The NIO Inc. (NIO) stock finished the day with a fall of -7.76 percent compared to Thursday’s close and ended the day around the 13.76 price level, according to unofficial data at the New York close.
NIO, a Chinese technology and electric car company, gapped-lower to open the day trading at 14.29 with the high of the day being just a bit higher at 14.53 while the low of the day was at 13.54.
As you can see from the chart, the 200-day moving average has turned over and been trending lower since the 4th quarter of 2021 while the 20-day moving average is also currently trending down.
The NIO RSI level is Bearish-Oversold
The Relative Strength Index, an indicator that can indicate overbought (above 70) and oversold levels (below 30), shows that the current RSI score is at 29.8 for a Bearish-Oversold reading on the daily time-frame.
NIO Price Trends
The NIO has declined by -22.00 percent over the past 10 days while seeing a fall of -31.47 over the past 30 days. The 90-day change is -20.87 while the 180-day return and the 365-day return are -52.76 and -66.59, respectively.
Advanced Micro Devices, Inc. End of Day Update: October 7th 2022
The Advanced Micro Devices, Inc. (AMD) stock finished the day with a decrease of -15.07 percent compared to yesterday’s closing price and closed the day around the 58.44 price level, according to unofficial data at the New York close.
AMD opened the day trading at 64.01, a gap down of about four dollars lower than Thursday’s closing, reaching a high of the day at 64.03 and with the low of the day at 58.22.
Advanced Micro Devices, a US technology company specializing in processing, has been on a strong downtrend since reaching a high above $160 in November of 2021. Today’s price hitting the lowest levels since July of 2020.
The stock is under the 20-day moving average and has been under the 200-day moving average since March.
The AMD RSI level is Bearish-Oversold
The Relative Strength Index, an indicator that can indicate overbought (above 70) and oversold levels (below 30), shows that the current RSI score is at 26.6 for a Bearish-Oversold reading on the daily time-frame.
AMD Price Trends
The AMD is lower by -14.01 percent over the past 10 days while seeing a slide of -39.86 over the past 30 days. The 90-day change is -42.63 while the 180-day return and the 365-day return are -52.06 and -30.45, respectively.
Lockheed Martin Corporation End of Day Update: October 7th 2022
The Lockheed Martin Corporation (LMT) stock bucked the stock market down-trend for the day and finished the day with a gain of 1.01 percent. LMT closed the day around the 403.96 price level, according to unofficial data at the New York close.
Lockheed Martin, a US aerospace and defense company, opened the day trading at 398.56 with the high of the day being 404.67 and the low of the day touching 396.01.
LMT is currently trading below the 20-day moving average and just recently in late September fell below its 200-day moving average.
The LMT RSI level is Bearish
The Relative Strength Index, an indicator that can indicate overbought (above 70) and oversold levels (below 30), shows that the current RSI score is at 45.5 for a Bearish reading on the daily time-frame.
LMT Price Trends
The LMT has slid by -2.21 percent over the past 10 days while seeing a fall of -7.30 over the past 30 days. The 90-day change is -7.61 while the 180-day return and the 365-day return are 9.83 and 12.95, respectively.
NVIDIA Corporation End of Day Update: October 7th 2022
The NVIDIA Corporation (NVDA) stock finished the day with a lowering of -9.40 percent and closed the day around the 120.76 price level, according to unofficial data at the New York close.
NVDA, a US technology company known for its GPU parts in performance computing, opened the day trading at 125.05 with the high being 126.69 while the low of the day touched 120.22.
The stock is trading below both its 20-day and 200-day moving averages as NVDA has been in a steep downtrend and trades at almost a third of its 2021 high-point.
The NVDA RSI level is Bearish
The Relative Strength Index, an indicator that can indicate overbought (above 70) and oversold levels (below 30), shows that the current RSI score is at 36.2 for a Bearish reading on the daily time-frame.
NVDA Price Trends
NVDA has fallen by -3.52 percent over the past 10 days while seeing a fall of -32.59 over the past 30 days. The 90-day change is -35.31 while the 180-day return and the 365-day return are -49.98 and -20.87, respectively.
The Tesla, Inc. (TSLA) stock finished the day with a decline of -7.46 percent and closed the day around the 223.07 price level, according to unofficial data at the New York close.
TSLA opened the day trading at 233.93 with the high of the day being 234.57 and the low bottoming for the day at 222.02.
TSLA is below both the 20-day and 200-day moving averages currently after the stock dropped below the $300 price level and both moving averages in late September.
The TSLA RSI level is Bearish-Oversold
The Relative Strength Index, an indicator that can indicate overbought (above 70) and oversold levels (below 30), shows that the current RSI score is at 27.0 for a Bearish-Oversold reading on the daily time-frame.
TSLA Price Trends
The TSLA has declined by -18.98 percent over the past 10 days while seeing a step lower by -24.66 over the past 30 days. The 90-day change is -11.74 while the 180-day return and the 365-day return are -32.83 and -3.63, respectively.
Heightened market volatility until the end of the year will be used by cryptocurrency investors to bolster Bitcoin and Ether holdings, says the CEO of one of the world’s largest independent financial advisory, asset management and fintech organizations.
deVere Group’s Nigel Green’s comments come as central banks around the world plan further interest rate hikes before the close of 2022.
He notes: “Markets are now predicting that policymakers at major central banks, including the U.S. Federal Reserve and Bank of England, are likely to remain resolute in pumping up interest rates in their battle to beat down unexpectedly stubborn inflation.
“Five powerful officials of the world’s most influential central bank, the Fed, in comments made on Thursday, maintained a hawkish theme that inflation remains far too high and they won’t be put off raising rates.
“We expect a 75 basis-point hike when they gather November 1-2.
“Meanwhile, members of the Bank of England’s Monetary Policy Committee have been delivering pretty clear hints that they will push through a big increase in rates when the MPC next meets on November 3.”
Typically, higher interest rates mean stock markets decline in value because companies will borrow less money. The result is their earnings will grow at a slower rate than investors previously expected. This has a ripple effect across most sectors of the stock market with some notable exceptions, such as financials.
“Given Bitcoin and Ether’s current correlation with stock markets, we anticipate further, perhaps heightened, volatility in the crypto market before the end of 2022,” says the deVere CEO.
“However, for serious investors this will not necessarily be seen as a bad thing.”
He continues: “The major investors, including institutional ones, will treat it in the same way as turbulence in any other market.
“Some of the world’s best investors consistently use market volatility as major buying opportunities in traditional financial markets – and the cryptocurrency market is now no different.”
“When used effectively and efficiently, volatility can be an extremely powerful investment strategy.”
History shows that Bitcoin gains have been enormous for those who hold during market turbulence, he goes on to add.
“Bitcoin remains the best-performing asset class in the world, and has consistently ranked amongst the best for both traditional and crypto investment sectors over the last few years.”
Compared to other top tech names over the last five years, we see Bitcoin has 355.22% higher returns than Amazon, 321.97% more than Google, while the asset out-performed Microsoft with returns of 182.65% and overshadowed Apple by 166.76%.
Nigel Green concludes: “Savvy, long-term crypto investors will be looking to benefit from panic-sellers by buying their digital currencies ‘on the cheap’ to enhance their investment portfolios.
“Serious investors will not be spooked by further volatility. This isn’t their first rodeo.”
About:
deVere Group is one of the world’s largest independent advisors of specialist global financial solutions to international, local mass affluent, and high-net-worth clients. It has a network of more than 70 offices across the world, over 80,000 clients and $12bn under advisement.
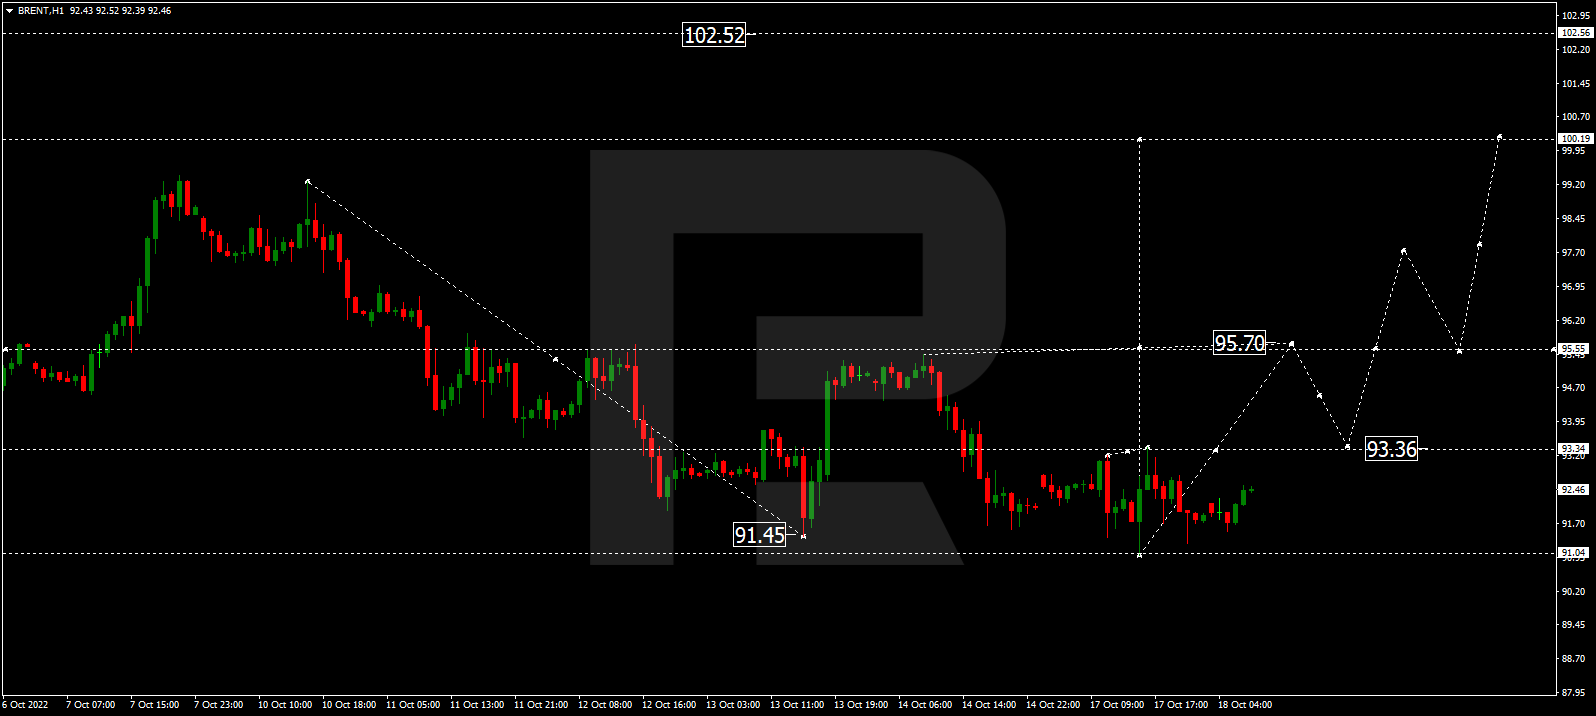
As we can see in the H4 chart, after breaking the 200-day Moving Average, Brent is trading above it to indicate a possible ascending tendency. However, there is divergence on the Relative Strength Index, which is a signal in favour of decline. In this case, the pair is expected to break 6/8 (93.75) and continue falling towards the support at 5/8 (90.62). However, this scenario may be cancelled if the price breaks the resistance at 7/8 (96.88) to the upside. After that, the instrument may move upwards to reach 8/8 (100.00).
In the M15 chart, the pair may break the downside line of the VoltyChannel indicator and, as a result, continue its decline.
S&P 500
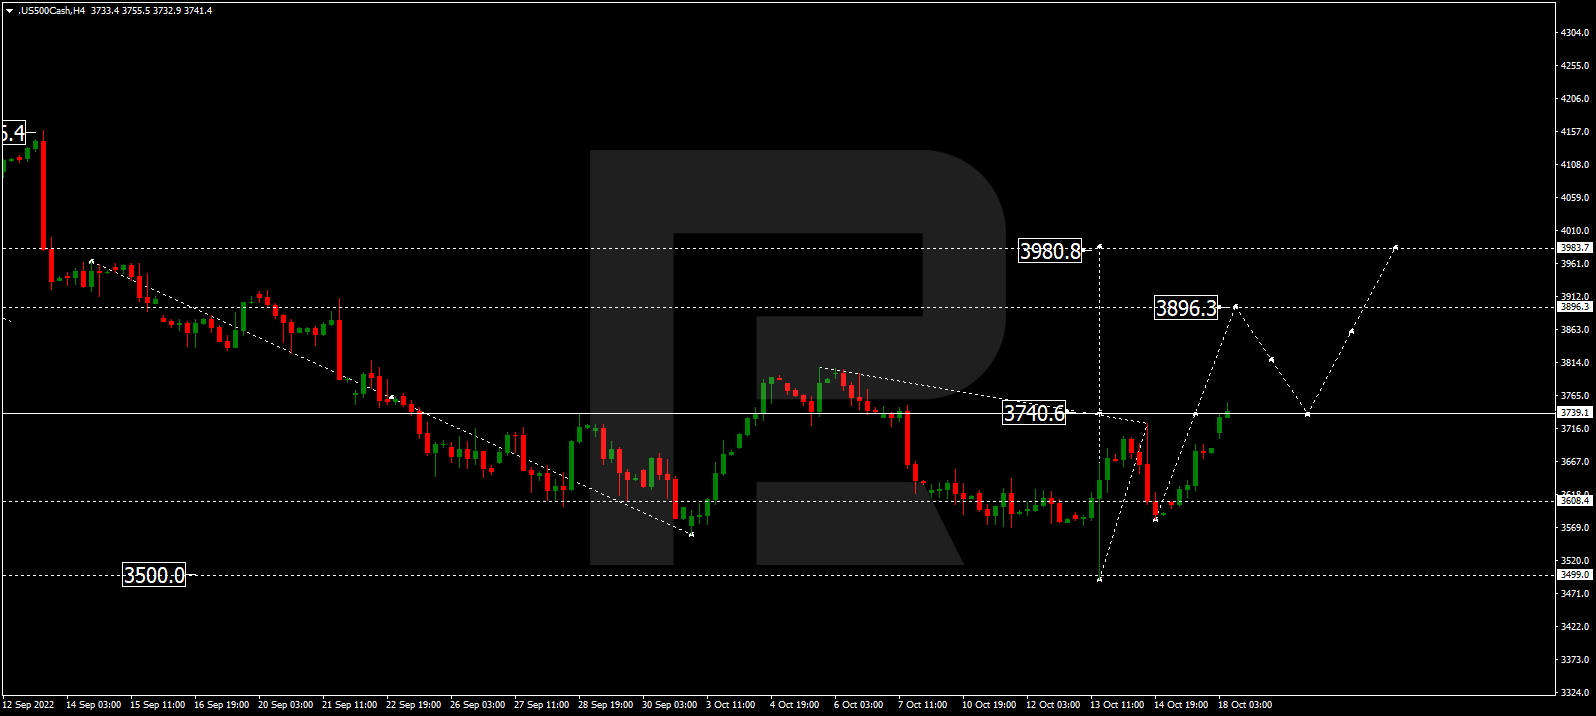
As we can see in the H4 chart, the S&P 500 index is trading inside the “oversold area”. The Relative Strength Index has broken the descending trendline to the upside. In this case, the price is expected to break 0/8 (3750.0) and continue moving upwards to reach the resistance at 1/8 (3906.2). However, this scenario may no longer be valid if the price breaks the support at -1/8 (3593.8) to the downside. After that, the instrument may continue to fall towards -2/8 (3437.5).
In the M15 chart, the pair may break the upside line of the VoltyChannel indicator and, as a result, continue trading upwards.
Attention! Forecasts presented in this section only reflect the author’s private opinion and should not be considered as guidance for trading. RoboForex LP bears no responsibility for trading results based on trading recommendations described in these analytical reviews.
BTC is falling again. On Friday, the asset is mostly trading at $19,921.
The current market situation is quite usual. Global market players are trying to avoid risks in stock markets, so they are currently not interested in crypto assets. The correlation between S&P 500/NASDAQ and the BTC remains quite strong.
American investors are once again bringing the US FOMC’s future moves in questions. At the same time, there were neither signals indicating a change in sentiment, nor the frustrating statistics. Most likely, investors hoped for a longer rebound. However, but when it became clear the rebound wouldn’t last long, market players were overwhelmed with disappointment.
Technically, the area between $18,000 and $19,000 remains a strong support zone. Until now, it managed to prevent “bears” from attacking.
The BTC miners’ reserves hit the lows
The number of coins held by the BTC miners dropped to the 10-year low, 1.92 million BTCs. Experts compare this with the tendency to sell cryptocurrency.
Holders are waiting in the wings
At the same time, holders – long-term investors – accumulated a record-breaking amount of cryptocurrencies. According to Ask Invest, they control at least 13.7 million coins, which is about 71.5% of the entire BTC volume offered in the market.
Norway will cancel the benefits for miners
Norwegian Ministry of Finance is thinking of cancelling the benefits for miners. This might add about $14 million to the country’s budget. At the moment, data centres that are involved in mining are paying for electricity at a reduced rate.
Attention! Forecasts presented in this section only reflect the author’s private opinion and should not be considered as guidance for trading. RoboForex LP bears no responsibility for trading results based on trading recommendations described in these analytical reviews.
Twitter’s board of directors had sued the Tesla billionaire in July 2022 when Musk tried to terminate the US$44 billion deal. The board has yet to drop its lawsuit, with a trial still scheduled to begin Oct. 17, 2022, which was intended to force Musk to complete the buyout.
As experts on corporate governance, we believe this feud raised two important corporate governance questions: What purpose does a board of directors serve? And does it matter if a member owns company stock or not?
‘A bad board will kill’
“Good boards don’t create good companies, but a bad board will kill a company every time.”
Venture capitalist Fred Destin wrote that in 2018, citing what he called an “old Silicon Valley proverb.” The quote has been making the rounds on Twitter recently in light of Musk’s hostile bid. It even seemed to get a nod from Dorsey himself when he replied to a tweet containing the quote with “big facts.”
This tweet and the general conversation that has emerged have important implications for understanding boards and their role in shepherding a company.
Broadly speaking, a board’s most important roles include hiring, paying and monitoring the chief executive officer.
Academic research suggests that board members at large companies – who typically receive generous compensation packages – may be limited in their ability to perform these tasks effectively. In our work, we found that boards often find it impossible to conduct adequate monitoring and rein in wayward CEOs because there’s just so much information for modern boards to process with their limited time. And the social dynamics involved in the board also make it difficult for directors to speak up and oppose other directors.
In a separate study involving face-to-face interviews with directors, we were consistently told that directors take their board service seriously and operate with their companies’ best interests in mind. But they do so with an eye toward collaborating with the CEO and the rest of the executive team rather than serving as impartial observers, as their “independent” status suggests they should.
While our work didn’t focus on this, if the board and the CEO fundamentally disagree about the direction of company – which was often the case between Dorsey and the Twitter board – it would certainly be problematic and could lead to less than optimal decisions being made.
That brings us to the next question: Does not owning a significant stake in a company you oversee make it more likely that you’ll run it into the ground, as Musk seemed to suggest?
A few days after making his takeover offer on April 14, the billionaire, responding to a tweet showing how few shares Twitter board members own, posted that its directors’ “economic interests are simply not aligned with shareholders.”
Musk’s arguments harked back to takeover bids from the 1980s in which activist investors – or “corporate raiders” – would argue that executives’ interests did not align with those of shareholders. As Gordon Gekko from the film “Wall Street” famously railed against executives of a business he wanted to take over, “Today, management has no stake in the company!”
Musk’s words echo Gekko’s “greed is good” speech, except in regard to independent directors, who comprise the vast majority of corporate boards. By definition, an independent or outside director is one who doesn’t hold an executive role in running the company, such as chief executive officer or chief financial officer.
‘Greed is good’
In reality, Twitter’s board share ownership is very similar to that of other companies.
Independent Twitter directors held a median ownership stake of 0.003% as of May 2022. For comparison, we looked at equity ownership of independent directors of companies listed in the S&P 500 stock index in 2021. We found the median stake was less than 0.01%, and all but a handful of directors held less than 1% of the company’s stock. Median ownership at Musk’s company Tesla is similarly minuscule, at 0.23%.
Whether this makes a difference to a company’s success is hard to assess because research on the topic is rather sparse, in large part because board members have so little equity.
Mixed research
Academic researchers on effective corporate governance in the 1970s argued that outside directors should avoid owning many shares in the companies they oversee to maintain objectivity. More recently, management scholars have suggested that higher stakes could provide a way to motivate directors to monitor management and make decisions more in line with shareholder interests.
But other work that examined multiple studies shows the impact of director stock ownership is mixed at best, with some studies suggesting higher stakes potentially lead to negative outcomes, such as excessive executive and director compensation.
Since the passage of the Sarbanes–Oxley Act of 2002 after massive accounting scandals at Enron, WorldCom and elsewhere, corporate governance issues such as board oversight have become increasingly important. This led to a number of changes intended to align the interests of managers and those of shareholders, including a focus on board independence and adjusting executive compensation.
The report on the ECB’s September 7, 8 monetary policy meeting released yesterday showed that many Governing Council representatives approved a 75 basis point rate hike. The report also indicated that in the medium term, a 50 basis point hike would be part of a sustainable path towards more neutral rate levels, and such a dynamic would be enough to alleviate inflationary pressures and not “drop” the economy deep into recession. But all inflation forecasts for 2023 and 2024 have been revised upward.
From the technical point of view, the trend on the EUR/USD currency pair on the hourly time frame is bullish. But the MACD indicator became negative, the price is trading below the moving averages, and the sellers’ pressure is increasing again. Buy trades should be considered from the support level of 0.9782. Sell deals may be considered from the resistance level of 0.9856, but only with confirmation.
Alternative scenario: if the price breaks down through the support level of 0.9666 and fixes below it, the downtrend will likely resume.
News feed for 2022.10.07:
– US FOMC Member Waller Speaks (m/m) at 00:00 (GMT+3);
– US FOMC Member Mester Speaks (m/m) at 01:30 (GMT+3);
– German Industrial Production (m/m) at 09:00 (GMT+3);
– US Nonfarm Payrolls (m/m) at 15:30 (GMT+3);
– US Unemployment Rate (m/m) at 15:30 (GMT+3);
– US FOMC Member Williams Speaks (m/m) at 17:00 (GMT+3).
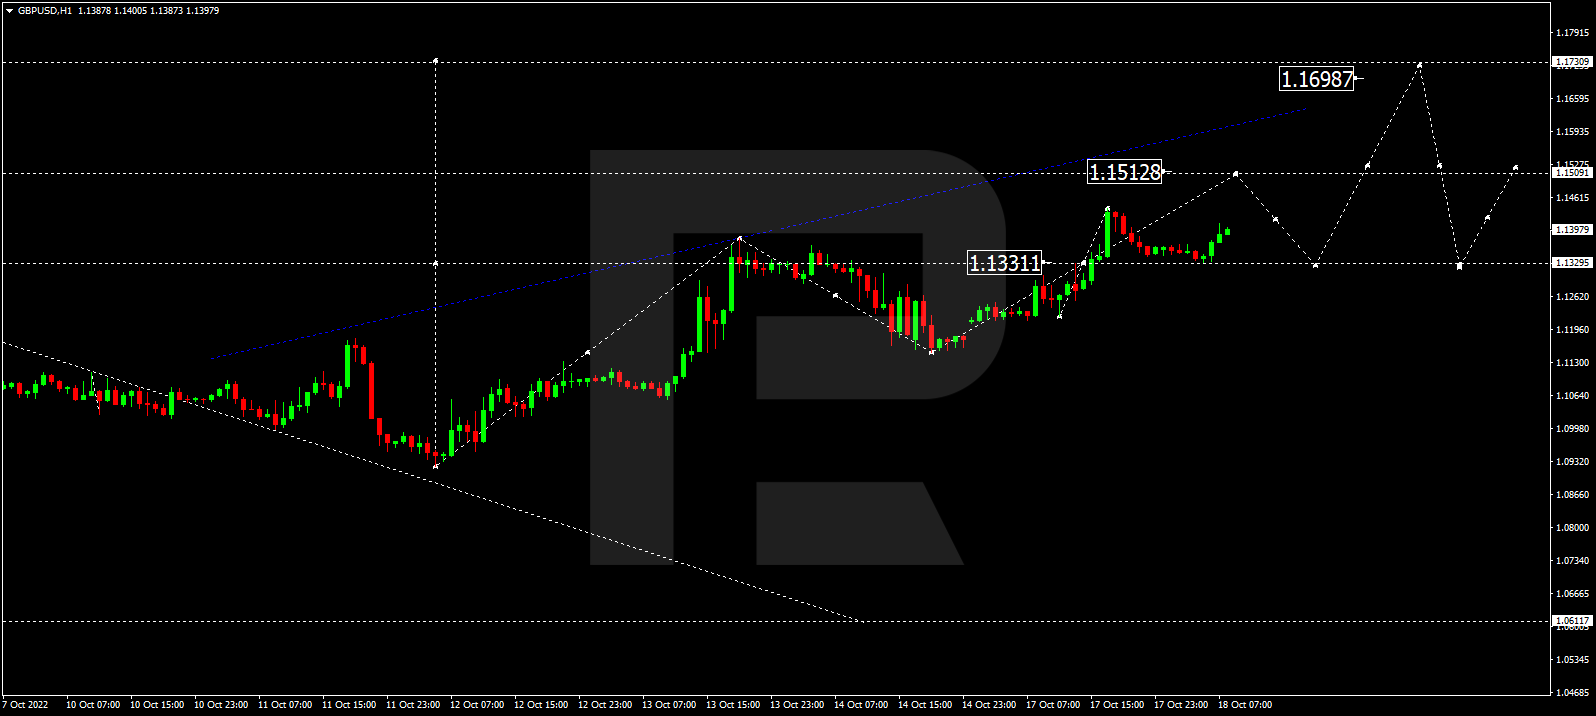
The GBP/USD currency pair
Technical indicators of the currency pair:
Prev Open: 1.1324
Prev Close: 1.1158
% chg. over the last day: -1.49 %
The UK construction companies reported a moderate increase in business activity in September, marking a return to growth after two months of declining output. Nevertheless, subdued demand persists, as evidenced by the weakest new orders since the economic recovery began in June 2020. Confidence in business prospects fell to its lowest level in two years in September, reflecting fears of higher interest rates and a downturn in the UK economy as a whole. On a more positive note, the supply deficit narrowed in September, and delivery delays were the least common since February 2020.
Trading recommendations
Support levels: 1.1121, 1.0915, 1.0816, 1.0711, 1.03
From the technical point of view, the GBP/USD currency pair trend on the hourly time frame is bullish. But the MACD indicator became negative, the price is trading below the moving averages, and the sellers’ pressure is increasing again. Under such market conditions, buy trades can be considered from the support level of 1.1121, but only with confirmation. Sell trades are best to look for on intraday time frames. The nearest resistance level is 1.1248, but also better with confirmation.
Alternative scenario: if the price breaks down from the 1.0915 support level and fixes below it, the downtrend will likely resume.
There is no news feed for today.
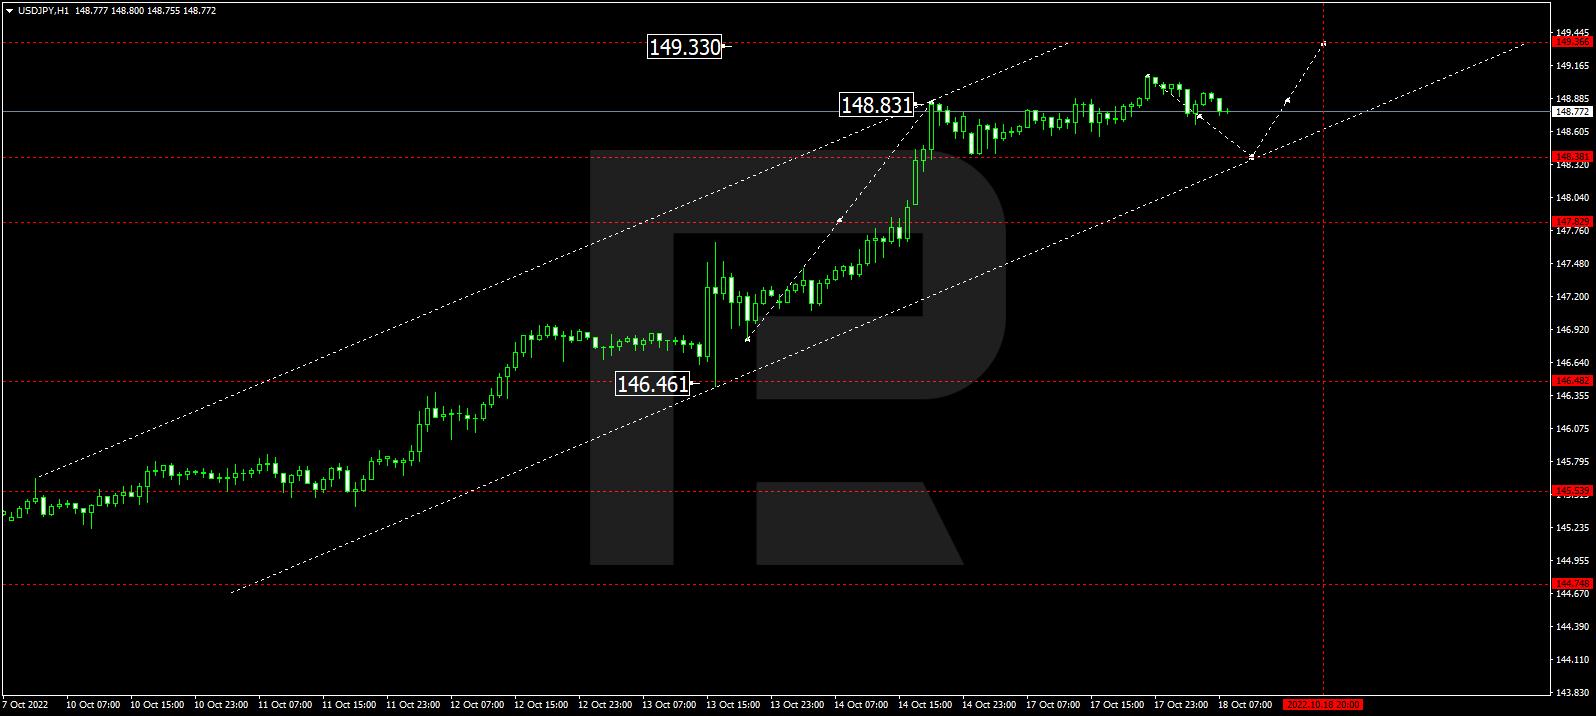
The USD/JPY currency pair
Technical indicators of the currency pair:
Prev Open: 144.58
Prev Close: 145.13
% chg. over the last day: +0.38 %
The USD/JPY quotes are slowly increasing again. Analysts are confident that it is not worth expecting another currency intervention from the Japanese government, as it is costly and has a temporary effect. Secondly, the Bank of Japan does not have enough funds to stop the yen’s fall. Japan has $1.3 trillion in reserves, but only about $135.5 billion is in the form of deposits. The rest is held in US Treasury bills. To stop the yen from falling, the Bank of Japan needs to shift the narrative from a soft monetary policy to a neutral one. However, since the Bank of Japan has no plans to change anything in its policy until the end of the year, and the US Federal Reserve continues to aggressively raise rates, USD/JPY quotes will be inclined to rise.
Trading recommendations
Support levels: 144.16, 143.00, 140.60, 139.61, 138.78, 137.65, 136.80, 135.20
Resistance levels: 145.35
From the technical point of view, the medium-term trend on the currency pair USD/JPY is bullish. The MACD indicator has become positive, and the price trades above the moving levels again. Under such market conditions, buy trades can be searched for on the intraday time frames from the support level of 144.16, but with confirmation. Sell deals can be searched from the resistance level of 145.35, but only with an additional confirmation in the form of a false breakout, since the level has already been tested.
Alternative scenario: If the price fixes below 140.60, the downtrend will likely resume.
There is no news feed for today.
The USD/CAD currency pair
Technical indicators of the currency pair:
Prev Open: 1.3615
Prev Close: 1.3746
% chg. over the last day: +0.96 %
Despite falling consumer prices in Canada, Bank of Canada Governor Tiff Macklem said he is firmly on a path to raise interest rates because policymakers are concerned about heightened domestic price pressures and rising inflationary expectations. Canada’s two-year bond yield reached its highest level since 2007, rising more than five basis points to 3.98%. Traders increased the odds of a 50 basis point rate hike at the next policy decision on October 26. Analysts are predicting that the Bank of Canada will stop at 4% in its rate hike cycle. The rate is currently at 3.25%.
Trading recommendations
Support levels: 1.3675, 1.3619, 1.3583, 1.3535, 1.3454
Resistance levels: 1.3755, 1.3858, 1.3968
From the point of view of technical analysis, the trend on the USD/CAD currency pair is bearish. But the price is trading above the moving lines again. The MACD indicator has become positive, and the buyer’s pressure is increasing. Under such market conditions, buy trades should be considered on the lower time frames from the support level of 1.3675 or 1.3619, but with confirmation. For sell deals, it is better to consider the resistance level of 1.3756, but only after the additional confirmation.
Alternative scenario: if the price breaks out through and consolidates above the resistance level of 1.3756, the uptrend will likely resume.
News feed for 2022.10.07:
– Canada Unemployment Rate (m/m) at 15:30 (GMT+3).
This article reflects a personal opinion and should not be interpreted as an investment advice, and/or offer, and/or a persistent request for carrying out financial transactions, and/or a guarantee, and/or a forecast of future events.