Towards zero hunger in Africa: 5 steps to achieve food security

By Edward Mabaya, Cornell University; Robert B. Richardson, Michigan State University, and Thomas Jayne, Michigan State University 

Global food systems have been battered by overlapping crises in recent years. Key among these are the COVID-19 pandemic, the Russo-Ukraine war and extreme weather events resulting from climate change. These have resulted in forced migration, loss of employment, climate stress, loss of biodiversity, and economic instability.

In Africa, which is home to 1.5 billion people, these shocks and stressors have slowed – or even reversed – decades of progress in improving food security and nutrition. For example, 37 million people in the Greater Horn of Africa are facing acute hunger in one of the region’s worst droughts in decades.

These multiple crises have forced the world to recognise that improving nutrition and food security requires more resilient global and national food systems. Food systems are the sum of actors and interactions along the food value chain – from input supply and production to transport, processing, retailing, wholesaling, preparation, consumption and disposal.

As set out in the Sustainable Development Goals (SDG2), the journey towards food and nutritional security for Africa has a clear destination – zero hunger. The target is to ensure access to safe, nutritious and sufficient food for all people by 2030.

The recently launched Africa Agriculture Status Report examines the continent’s progress towards food and nutritional security.

We co-edited the report, which has six key themes. It charts a roadmap to get to the goal faster while adapting to a changing environment. Our report coincided with World Food Day 2022, whose theme is safer food, better health.

Without transformative change like the Asian Green Revolution, African food systems will continue to impede human development. They will also continue to be overly dependent on food imports. Without a strong drive for sustainable agricultural practices, the continent’s food systems will worsen environmental destruction. Urgent action is needed to anticipate megatrends, rally political will, mobilise investments and strengthen capacity.

Five ways to transform African food systems

The need for true cost accounting

Development practitioners working in Africa need true cost accounting for our food systems. It should explicitly consider all the environmental, social and human health outcomes associated with the way food systems are organised. For example, 74% of agricultural production growth in sub-Saharan Africa since 2000 has been achieved through area expansion and only 26% from increased yields. This is far from ideal. Reliance on area expansion has converted forests and grasslands into cropland on a massive scale. The result has been substantial damage to the region’s stock of natural resources and ecosystem services.

A true cost accounting framework sets out the costs of this approach. It would lead to the recognition that technical innovation is important to improve yields on existing farmland. It would show that this is a more sustainable approach to production growth, better health and improved nutrition.

Anticipate the megatrends

African governments must be prepared for the big demographic, economic, environmental, and social trends shaping the continent’s food systems. These include:

  • rapid population growth, associated land scarcity and rapidly rising land prices
  • rapidly growing demand for food, driven by rapidly growing urban areas, rising incomes and purchasing power
  • more frequent and intense weather disruptions associated with climate change
  • global health crises, economic disruptions, and civil conflicts such as the Russo-Ukraine war
  • technical innovation in digital agriculture.

Africa’s food systems continue to evolve in response to these drivers. Food policies and investment strategies need to change too. We are chasing a moving target.

Role of leadership

Leadership is essential to harness collective effort, shared responsibility, stakeholder engagement and political will to transform food systems.

Political leaders can either push the accelerator or step on the brakes. The complex nature of our food systems requires that key actors, including national governments, international agencies, civil society, farmer organisations and the private sector, work together towards the common goal.

Governments and regional bodies are at the centre of food systems interventions.

Investment gap

Financing is the fuel needed to accelerate transformation. Based on recent estimates from New Growth International, a network based management consulting firm, food systems transformation in Africa requires up to US$77 billion a year from the public sector and up to US$180 billion from the private sector.

Mobilising financing at scale requires African governments to:

  • define priorities
  • commit to financing priority actions
  • enhance coordination between government and private sector
  • ensure good governance and accountability.

Capacities and capabilities

Africa must invest in domestic human, institutional and system-wide capacities and capabilities. Capacity development efforts should be guided by seven core principles: country ownership and leadership; alignment with national needs and priorities; use of national systems and local expertise; no “one-size-fits-all” tactics; multi-level approaches; and mutual accountability.

We also note that even though agricultural research capacity has increased by 90% between 2000 and 2016 there has been a decline in public investment in agricultural research systems. This threatens Africa’s capacity to adapt the latest technologies to local conditions.

Call to action

There’s an urgency to transforming African and global food systems to make them more resilient and sustainable. Failure is not an option.

Transformation will require a coordinated approach from governments, development partners, the private sector and civil society. It is time to put into action the carefully designed strategies, policy reforms and investment plans highlighted in the latest report.The Conversation

About the Author:

Edward Mabaya, Research Professor, Cornell University; Robert B. Richardson, Professor of Sustainable Development, Michigan State University, and Thomas Jayne, MSU Foundation Professor, Agricultural, Food and Resource Economics, Michigan State University

This article is republished from The Conversation under a Creative Commons license. Read the original article.


Global warming puts Arabica coffee at risk, and we’re barrelling towards a crucial threshold

By Jarrod Kath, University of Southern Queensland and Scott Power, University of Southern Queensland 

Coffee may be a major casualty of a hotter planet. Even if currently declared commitments to reduce emissions are met, our new research suggests coffee production will still rapidly decline in countries accounting for 75% of the world’s Arabica coffee supply.

Arabica coffee (Coffea arabica) is one of two main plant species we harvest coffee beans from. The plant evolved in the high-altitude tropics of Ethiopia, and is hypersensitive to changes in the climate.

Our research shows there are global warming thresholds beyond which Arabica coffee production plummets. This isn’t just bad news for coffee lovers – coffee is a multi-billion dollar industry supporting millions of farmers, most in developing countries.

If we manage to keep global warming below 2℃ this century, then producers responsible for most global Arabica supply will have more time to adapt. If we don’t, we could see crashes in Arabica productivity, interruptions to supply, and price hikes on our daily cup.

Jason Betz/Unsplash, CC BY

Where our coffee comes from

Most of our Arabica is grown in the tropics, throughout Latin America, Central and East Africa and parts of Asia. Brazil, Colombia and Ethiopia are the world’s top three producers of Arabica, and the crop has crucial social and economic importance elsewhere, too.

Millions of farmers, mostly in the developing world, depend on productive Arabica for their livelihood. If coffee productivity declines, the economic consequences for farmers, some of which do not earn a living income as it is, are dire.

Arabica coffee is typically most productive in cool high elevation tropical areas with a local annual temperature of 18-23℃.
Higher temperatures and drier conditions invariably lead to declines in yield.

Last year, for example, one of the worst droughts in Brazil’s history saw coffee production there drop by around one-third, with global coffee prices spiking as a result.

What we found

Previous research has focused on how changes in temperature and rainfall affect coffee yields. While important, temperature and rainfall aren’t the best indicators of global Arabica coffee productivity. Instead, we found that it’s more effective to measure how dry and hot the air is, which we can do using “Vapour Pressure Deficit”.

Vapour pressure deficit tells us how much water gets sucked out of a plant. Think of when you walk outside on a hot, dry day and your lips dry and crack – the moisture is being sucked out of you because outside, the vapour pressure deficit is high. It’s the same for plants.

We built scientific models based on climate data that was linked to decades of coffee productivity data across the most important Arabica producing countries. We found once vapour pressure deficit gets to a critical point, then Arabica coffee yields fall sharply.

Coffee crops have crucial social and economic importance.
Yanapi Senaud/Unsplash, CC BY

This critical point, we found, is 0.82 kilopascals (a unit of pressure, calculated from temperature and humidity). After this point, Arabica yields start falling fast – a loss of around 400 kilograms per hectare, which is 50% lower than the long-term global average.

Vapour pressure deficit thresholds have already been exceeded in Kenya, Mexico and Tanzania.

Unabated global warming will see the world’s coffee producing powerhouses at risk. If global warming temperatures increase from 2℃ to 3℃, then
Peru, Honduras, Venezuela, Ethiopia, Nicaragua, Colombia and Brazil –
together accounting for 81% of global supply – are much more likely to pass the vapour pressure deficit threshold.

What can we do about it?

While there are ways farmers and the coffee industry can adapt, the viability of applying these on a global scale is highly uncertain.

For example, irrigating coffee crops could be an option, but this costs money – money many coffee farmers in developing countries don’t have. What’s more, it may not always be effective as high vapour pressure deficits can still inflict damage, even in well-watered conditions.

Another option could be switching to other coffee species. But again, this is fraught. For example, robusta coffee (Coffea canephora) – the other main species of production coffee – is also sensitive to temperature rises. Others, such as Coffea stenophylla and Coffea liberica could be tested, but their production viability at large scales under climate change is unknown.

There is only so much adapting we can do. Our research provides further impetus, if we needed any, to cut net global greenhouse gas emissions.

Limiting global warming in accordance with the Paris Agreement is our best option to ensure we can all keep enjoying coffee. More importantly, keeping global warming below 2℃ is the best way to ensure the millions of vulnerable farmers who grow coffee globally have a livelihood that supports them and their families well into the future.The Conversation

About the Author:

Jarrod Kath, Senior Lecturer in Ecology and Conservation, University of Southern Queensland and Scott Power, Director, Centre for Applied Climate Sciences, University of Southern Queensland

This article is republished from The Conversation under a Creative Commons license. Read the original article.

The cryptocurrency market digest (BTC, APTOS). Overview for 19.10.2022

Article By RoboForex.com

BTC did not rise following the stock market and even declined. The flagship cryptocurrency is holding around 19,157 USD on Wednesday. BTC’s correlation with the S&P 500 and Nasdaq indices has momentarily weakened. This is due to a lack of liquidity on the floor, as well as the formation of bearish signals on time frames below the daily. Cryptocurrency exchanges still have no “ideas” of their own.

Technically, the area of 18,000-19,000 USD is still being held back by the sellers. However, it is no longer certain that the next bearish attack will hold. The faster the market advances to 20,500 USD and starts storming the resistance at 21,500 USD, the better the chances are for the continuation of the rally.

Energy consumption on the BTC network has increased over the year

The BTC Mining Council (BMC) presented statistics for Q3 2022, which show a 41% increase in BTC network energy consumption over the past 12 months. Data from more than 50 cryptocurrency miners was used to compile the report. Interestingly, mining all existing crypto-assets consumes approximately 0.16% of the world’s electricity production.

APTOS token “soars into the sky”

The APTOS token appreciated after Binance opened trading with the coin. The starting price was 1 USDT, rising to 100 USDT in the first minutes of trading.

Article By RoboForex.com

Attention!
Forecasts presented in this section only reflect the author’s private opinion and should not be considered as guidance for trading. RoboForex LP bears no responsibility for trading results based on trading recommendations described in these analytical reviews.

Corporate earnings push stock indices higher

By JustMarkets

The US indices rose on Tuesday as better-than-expected quarterly results continued to support stock sentiment for a second straight day, although Apple’s decline from session highs held back gains. At yesterday’s stock market close, the Dow Jones Index (US30) increased by 1.12%, and the S&P 500 Index (US500) added 1.14%. NASDAQ Technology Index (US100) gained 0.77%.

Apple ordered its suppliers to cut production of its iPhone 14 family of products by 6 million units after an expected surge in demand failed to materialize. Salesforce shares increased by 4% on reports that investor Starboard Value has acquired a “significant” stake in the software maker. Netflix stock rose more than 14% after the release of its third-quarter earnings report, which showed strong earnings estimates, while the number of subscriptions also exceeded expectations.

Today, companies such as Tesla (TSLA), Procter&Gamble (PG), and IBM (IBM) will report.

According to Coalition Greenwich, the world’s largest banks will earn a total of $8.3 billion on loan trading this year, the lowest since 2012.

According to the National Association of Home Builders (NAHB), builder confidence in the US market fell by 8 points to 38 in October, half of what it was six months ago. This is the lowest confidence reading since August 2012, excluding the 2020 pandemic. High mortgage rates approaching 7% have significantly dampened demand, especially among would-be home buyers. With expectations of continued interest rate hikes due to Federal Reserve actions, construction is projected to decline further in 2023.

Equity markets in Europe mostly rose yesterday. Germany’s DAX (DE30) gained 0.92%, France’s CAC 40 (FR40) added 0.44%, Spain’s IBEX 35 (ES35) increased by 0.72%, Britain’s FTSE 100 (UK100) closed Tuesday in plus by 0.24%.

The International Monetary Fund said the UK government’s “U-turn” on tax cuts would help deal with rising inflation. The IMF is trying to stabilize the global economy, and one of its main roles is to act as an early economic warning system.

Oil prices fell on Tuesday amid fears of increased supply in the US coupled with slower economic growth and lower fuel demand in China. China, the world’s largest importer of crude oil, indefinitely postponed the release of economic indicators originally scheduled for release on Tuesday, indicating to the market that fuel demand in the region has declined significantly. Oil prices were also pressured by reports that the US government will continue to release crude oil from reserves.

The United Arab Emirates believes OPEC+ made the right choice when it agreed to cut production, and the unanimous decision had nothing to do with politics. Kuwait’s foreign ministry on Tuesday also supported the UAE and Saudi Arabia’s position on the cuts, saying in a statement that the collective decision had a “purely economic basis.” But the US believes otherwise and points out that the cuts will increase Russia’s foreign revenues and reduce the effectiveness of sanctions imposed over its invasion of Ukraine.

Asian stock indices rose yesterday. Japan’s Nikkei 225 (JP225) gained 1.42%, Hong Kong’s Hang Seng (HK50) added 1.82%, and Australia’s S&P/ASX 200 (AU200) was up by 1.72%.

S&P 500 (F) (US500) 3,719.98 +42.03 (+1.14%)

Dow Jones (US30) 30,523.80 +337.98 (+1.12%)

DAX (DE40) 12,765.61 +116.58 (+0.92%)

FTSE 100 (UK100) 6,936.74 +16.50 (+0.24%)

USD Index 111.99 -0.05 (-0.05%)

Important events for today:
  • – UK Consumer Price Index (m/m) at 09:00 (GMT+3);
  • – Eurozone Consumer Price Index (m/m) at 12:00 (GMT+3);
  • – Canada Consumer Price Index (m/m) at 15:30 (GMT+3);
  • – US Building Permits (m/m) at 15:30 (GMT+3);
  • – US Crude Oil Reserves (w/w) at 17:30 (GMT+3).

By JustMarkets


This article reflects a personal opinion and should not be interpreted as an investment advice, and/or offer, and/or a persistent request for carrying out financial transactions, and/or a guarantee, and/or a forecast of future events.

Mid-Week Technical Outlook : Majors

By ForexTime 

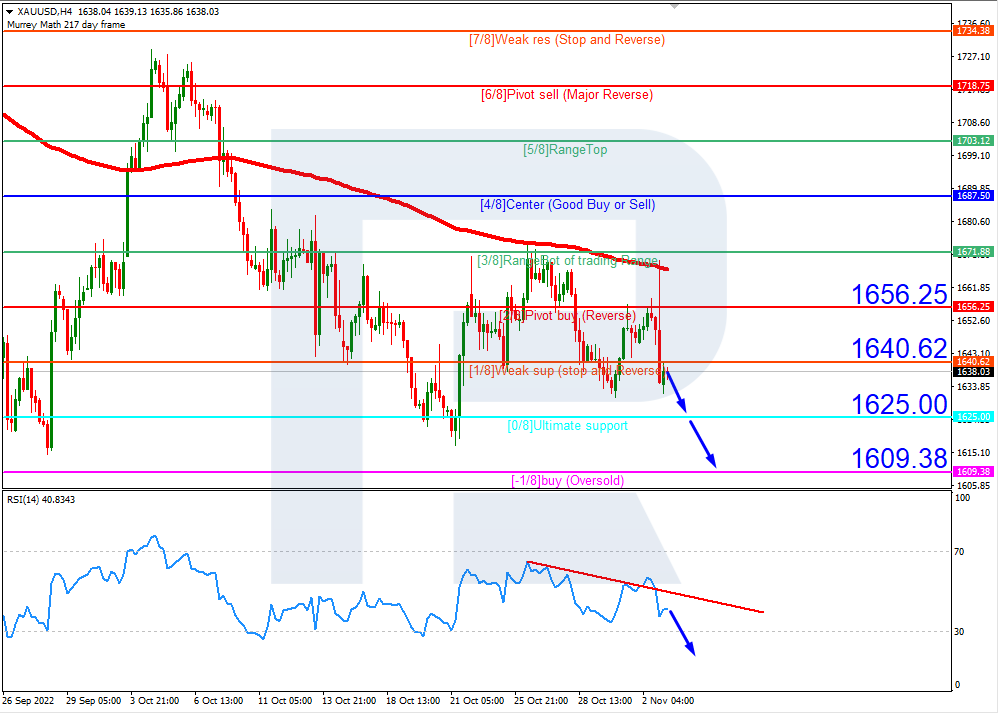
A sense of caution returned to markets on Wednesday as concerns over soaring inflation and slowing economic growth punctured risk sentiment. King dollar drew strength from the negative vibes while sterling weakened after UK inflation hit double digits. In the commodity space, oil prices edged cautiously higher thanks to bullish signals but gold tumbled with bears eyeing $1615. With the economic calendar relatively light today, markets could be influenced by corporate earnings and other key themes influencing sentiment. Our focus falls on the currency space with the tool of choice none other than technical analysis.

EURUSD eyes 0.9700

The path of least resistance for the EURUSD points south. Prices are trading below the 50, 100, and 200-day Simple Moving Average while the MACD trades below zero. A stronger dollar may drag the EURUSD and may pull prices closer to 0.9700. If this support is breached, the next key level can be found at 0.9500.  A move back above 0.9900 could open the doors back to parity.

GBPUSD…watch the range

Prices remain trapped within a wide range with support at 1.0925 and resistance at 1.1400. Sustained weakness under this resistance is likely to open the doors towards 1.1200 and 1.0925. If bulls can push prices above 1.1400, then an incline toward 1.1490 (where the 50-day SMA resides could be on the cards).

AUDUSD gearing for major breakdown

The trend is bearish on the AUDUSD. Prices are currently within a range with support at 0.6200 and resistance at 0.6340. A breakdown below 0.6200 could trigger a selloff towards 0.6000. If prices can break above 0.6340, the AUDUSD could test 0.6550.

USDJPY keeps pushing higher

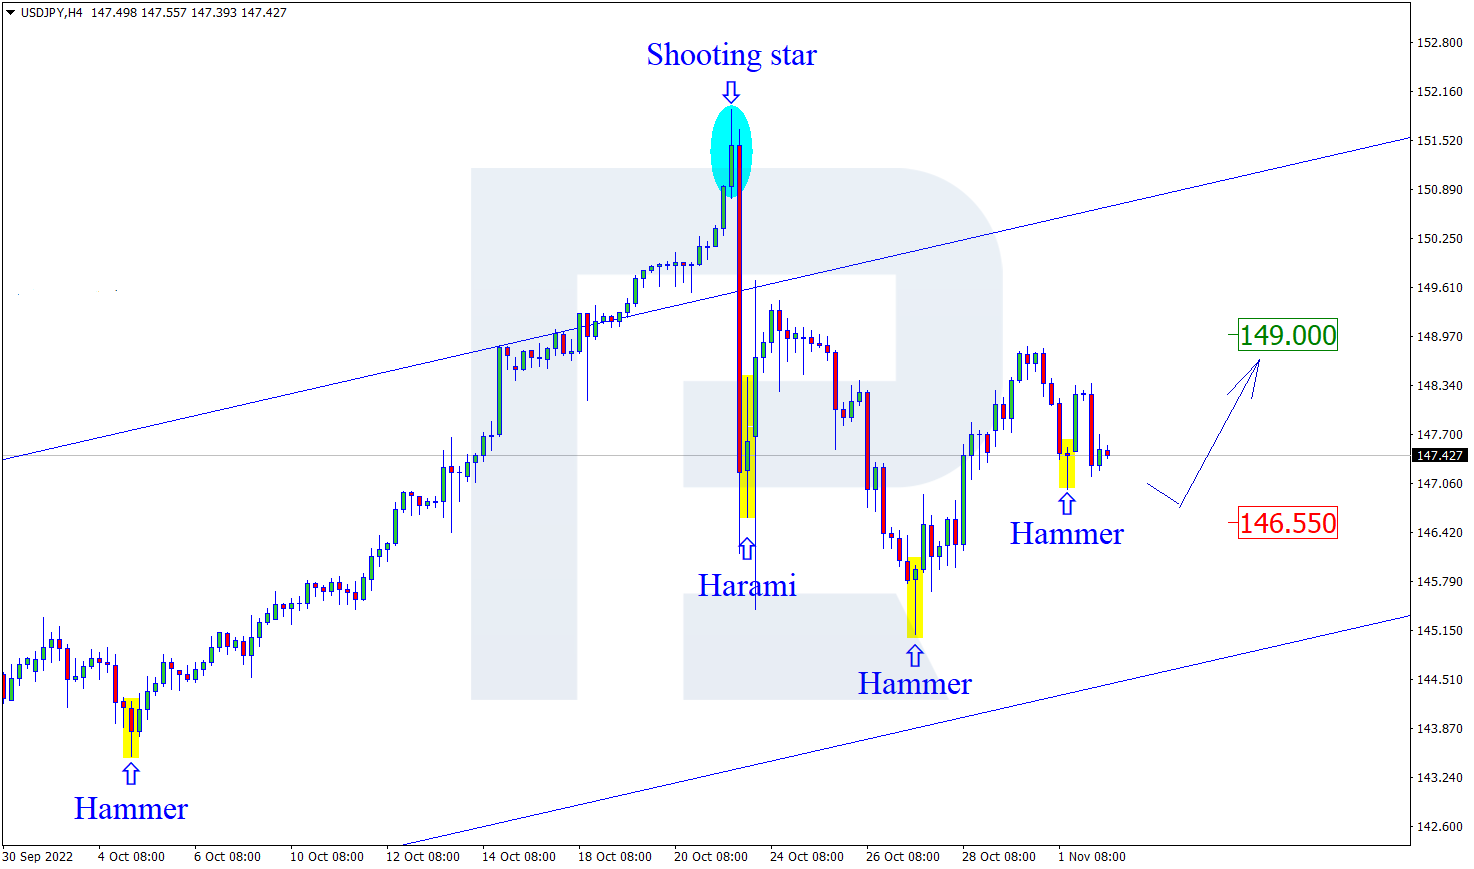
After securing a daily close above 149.00, USDJPY bulls are certainly in the driver’s seat. The currency pair is trading at levels not seen in 32 years thanks to verbal intervention by the Bank of Japan and an appreciating dollar. The upside momentum could take prices towards 150.00 and higher. A move back below 149.00 could trigger a selloff towards 145.00.

USDCAD ready to move?

Nothing much has happened on the USDCAD over the past few days. Prices have been trapped within a tight range with support at 1.3700 and resistance at 1.3840. Given how the dollar is back on the rise amid risk aversion, the USDCAD could conquer 1.3840 and 1.4000, respectively. If prices end up breaking below 1.3700, bears may target 1.3502.


Forex-Time-LogoArticle by ForexTime
ForexTime Ltd (FXTM) is an award winning international online forex broker regulated by CySEC 185/12 www.forextime.com

How the costs of disasters like Hurricane Ian are calculated – and why it takes so long to add them up

By Adam Rose, University of Southern California 

The U.S. experienced 15 disasters in the first nine months of 2022 that each caused at least US$1 billion in damage. Hurricane Ian is taking the largest toll of these disasters by far – but the extent of the damage could take years to calculate with any precision.

The Conversation U.S. asked Adam Rose, a senior research fellow at the Center for Risk and Economic Analysis of Threats and Emergencies at the University of Southern California, to explain how experts make these estimates and what could be done to make disasters less costly.

What did Ian cost?

Preliminary property damage estimates for Ian so far range from $42 billion to as much as $258 billion, with some landing in the middle.

If the higher end of the estimates proves more accurate, that alone would make Ian the costliest natural disaster in U.S. history.

However, property damage is only one aspect of disaster costs.

Another, which is often neglected, is business interruption – the decrease in economic activity measured either in terms of lost revenue or a combination of lost wages and profits.

Business interruption begins when the disaster strikes and continues until the economy has recovered. In this case, it is likely to take several years, as happened after Katrina wreaked destruction on Louisiana, Alabama and Mississippi in 2005.

Of course, these costs do not count lives lost or human misery, such as the number of people left without power or clean water.

Who makes these estimates and how are they made?

The earliest estimates of a disaster’s cost are often made within a few days, but they subsequently get refined as more data becomes available.

Insurance companies and insurance trade associations typically make the first estimates, which focus on property damage. Insurers base these estimates on losses covered by insurance and then extrapolate those calculations to also include losses related to noninsured property.

These initial estimates often omit damaged infrastructure, such as roads, bridges and utilities. One way that analysts can also estimate those losses is by studying and refining data collected by satellites and reconnaissance airplanes through a process called “Earth observation.”

Property damage can readily be translated into initial estimates of direct losses of economic activity, including the effects on employment and gross domestic product, using the Federal Emergency Management Agency’s loss estimation tool. The tool, known as Hazus, combines data related to wind speed, flood height and the size of the region affected. However, an accurate estimate of total losses must consider three more factors.

The first pertains to the multiplier effects that reverberate through supply chains. For example, earthquakes in Taiwan have in the past damaged semiconductor factories, disrupting the production of electronics in the U.S. and elsewhere.

The second is how quickly and efficiently businesses get back on their feet after a disaster by relying on strategies such as relocating or consuming less water and power. Disaster recovery experts refer to this way of reducing the risks associated with a disaster’s aftermath as “resilience.”

The third has to do with what happens to people who live in disaster zones. If they flee the area on their own or after being forced to do so by government evacuation orders, the local economy loses its labor base and demand for goods and services in the area declines.

I led a team that developed software that quickly makes these estimates – the Economic Consequence Analysis Tool. Known as E-CAT, it can provide almost immediate estimates of losses from hurricane-related flooding and other disasters once some basic information on the initial size of the disaster and rough estimates of the extent of resilience and behavioral responses become available. It can be used by non-experts and requires much less data than the government’s Hazus system.

Precise estimates of the cost of a given disaster can only be determined after a careful case study, which takes months or years to complete. That is why there’s no reliable estimate yet for Ian.

Who bears the greatest costs of damage from big disasters?

A National Academies of Science, Engineering and Medicine committee on which I served issued a report noting that low-income people and communities of color bear a disproportionate amount of disaster losses.

They are more prone to live in floodplains where property values are lower, are less able to afford to build homes that can withstand water and wind damage, and have less access to credit for rebuilding. They also have less political power in the overall decision-making process to prevent and cope with disasters.

Hurricanes, as well as sea-level rise, represent some exceptions to this pattern. Very wealthy people with beachfront property are disproportionately affected by hurricanes, and many of the homes that collapse into the ocean belong to the rich.

Can massive losses from hurricanes be avoided?

At this point, preventing losses from hurricanes is probably impossible, as it would require turning back the clock 50 years.

The U.S. would have benefited from better land-use planning in the mid-20th century. And it would have also helped if Americans had started decades ago to take action to mitigate climate change in the first place by reducing greenhouse gas emissions and slowing the pace of deforestation.

What could make future disasters less costly?

Natural disasters occur due to a combination of physical events, like hurricanes and earthquakes, and the vulnerability of homes, businesses and all the structures people rely on. Storms are getting stronger and human settlement systems are expanding, thereby increasing their vulnerability.

More people are moving closer to the coastlines as others who lost homes in disasters are rebuilding in floodplains – perpetuating losses.

In 2005, I led a report to Congress known as the Natural Hazard Mitigation Saves study, for which our team examined 10 years of FEMA Hazard Mitigation Assistance Grants. This money flows to state and local governments, Indian tribal organizations and nonprofits for projects designed to rebuild and lower the risk of future property damage and business interruption losses after a presidential disaster declaration.

We found that one of the most effective tactics to reduce disaster losses was to buy out properties from homeowners residing in flood-prone areas to eliminate the need to help them rebuild again and again.The Conversation

About the Author:

Adam Rose, Professor of Public Policy, University of Southern California

This article is republished from The Conversation under a Creative Commons license. Read the original article.

Opportunity for Investors Found in Psychedelics Space

Source: Patrick R. Trucchio  (9/27/22)

Treatment of alcohol use disorder with psychedelics plus therapy is effective, according to existing data, and the potential global market is large, noted an H.C. Wainwright & Co. report.

Awakn Life Sciences Corp. (AWKN:NEO; AWKNF:OTCQB) and Cybin Inc. (CYBN:NYSE American; CYBN:NEO) are best positioned to capitalize on the “robust potential of psychedelics in alcohol use disorder (AUD),” an estimated $20 billion-plus global market, purported H.C. Wainwright & Co. analyst Patrick Trucchio in a September 22, 2022 research note.

“With a potential addressable patient population in Western markets that exceeds 30 million people and with 10% or less of these patients in active treatment, the unmet medical need and opportunity for innovative approaches to treatment is very high,” Trucchio wrote. “As such, we believe the potential for psychedelics with therapy to ameliorate AUD could represent a significant opportunity for drug sponsors, which is highly underappreciated by investors.”

Two Leaders in the Space To Consider

Trucchio discussed Canada-based Awakn and Cybin, the two publicly traded biopharma companies that have announced AUD as a target indication. He noted both companies are worth an estimated $10 per share, “implying robust upside from current levels.”

One of them, Awakn, is pursuing ketamine, an NMDA receptor antagonist, plus psychotherapy in a variety of addiction disorders as well as MDMA plus therapy for AUD.

Over 32 weeks of observation, AUD patients treated with psilocybin plus therapy experienced “robust decreases in [their] percentage of heavy drinking days over and above those produced by active placebo and psychotherapy.”


The company’s lead clinical program, Project Kestrel, is supported by the Phase 2 trial in which KARE, or ketamine in the reduction of alcoholic relapse, and psychotherapy were administered to 96 patients with severe AUD. In this trial, patients achieved, on average, 86% abstinence at six months post-treatment compared to 2% pre-trial and 25% with the current standard of care.

Next for the program is a Phase 3 trial in the United Kingdom (U.K.), 66% of the costs of which the U.K.’s National Institute for Health and Care agreed to cover. Up to 280 AUD patients will be enrolled, treated, and followed for six to 12 months.

“The study is expected to be the largest ketamine-assisted therapy clinical trial and the only psychedelic Phase 3 trial receiving government funding,” Trucchio noted.

The clinical data supporting the use of psychedelics-assisted therapy in treating AUD and the size of the global AUD market bode well for Awakn and Cybin, which are pursuing the opportunity, and for investors in these companies that currently offer upside.

Awakn is also pursuing the use of MDMA plus therapy in AUD. The biopharma will explore a data licensing agreement with the U.S.-based Multidisciplinary Association for Psychedelic Studies, or MAPS, to support Awakn’s Phase 2b and planned Phase 3 studies evaluating MDMA-assisted therapy for AUD in Europe.

The second company in the space Trucchio highlighted, Cybin, is currently evaluating deuterated psilocybin, CYB003, as a treatment for major depressive disorder. The biopharma is expected to expand this program into AUD if the Phase 1/2a study, now underway, shows the compound to be safe, well-tolerated, and efficacious. Phase 1 data are due out by year-end, Phase 2a data by mid-2023.

Data Support Use of Psychedelics in Treating AUD

Trucchio pointed out the results of three robustly conducted trials that individually evaluated ketamine (Awakn’s Project Kestrel), MDMA (Imperial College London’s Bristol Imperial MDMA in Alcoholism, or BIMA, study), and psilocybin (study by Bogenschutz, Ross, Bhatt, et al.) showed a benefit in AUD patients.

“What is consistent in the data is that when administered in the proper set and setting with psychotherapy, psychoactive substances appear to ameliorate the cravings associated with AUD and thus, provide the potential for a significant reduction in heavy drinking days and even abstinence, both of which are approvable regulatory endpoints in the U.S. and Europe,” Trucchio wrote.

Results of the Bogenschutz et al. study were just published in JAMA’s Aug. 24, 2022 issue. The trial showed that over 32 weeks of observation, AUD patients treated with psilocybin plus therapy experienced “robust decreases in [their] percentage of heavy drinking days over and above those produced by active placebo and psychotherapy.”

The clinical data supporting the use of psychedelics-assisted therapy in treating AUD and the size of the global AUD market bode well for Awakn and Cybin, which are pursuing the opportunity, and for investors in these companies that currently offer upside.


Disclosures:
1) Doresa Banning wrote this article for Streetwise Reports LLC and provides services to Streetwise Reports as an independent contractor. She or members of her household own securities of the following companies mentioned in the article: None. She or members of her household are paid by the following companies mentioned in this article: None.

2) The following companies mentioned in this article are billboard sponsors of Streetwise Reports: Awakn Life Sciences Corp. Click here for important disclosures about sponsor fees. The information provided above is for informational purposes only and is not a recommendation to buy or sell any security. As of the date of this article, an affiliate of Streetwise Reports has a consulting relationship with: Awakn Life Sciences Corp. Please click here for more information.

3) Comments and opinions expressed are those of the specific experts and not of Streetwise Reports or its officers. The information provided above is for informational purposes only and is not a recommendation to buy or sell any security.

4) The article does not constitute investment advice. Each reader is encouraged to consult with his or her individual financial professional and any action a reader takes as a result of information presented here is his or her own responsibility. By opening this page, each reader accepts and agrees to Streetwise Reports’ terms of use and full legal  disclaimer. This article is not a solicitation for investment. Streetwise Reports does not render general or specific investment advice and the information on Streetwise Reports should not be considered a recommendation to buy or sell any security. Streetwise Reports does not endorse or recommend the business, products, services or securities of any company mentioned on Streetwise Reports.

5) From time to time, Streetwise Reports LLC and its directors, officers, employees or members of their families, as well as persons interviewed for articles and interviews on the site, may have a long or short position in securities mentioned. Directors, officers, employees or members of their immediate families are prohibited from making purchases and/or sales of those securities in the open market or otherwise from the time of the decision to publish an article until three business days after the publication of the article. The foregoing prohibition does not apply to articles that in substance only restate previously published company releases. As of the date of this article, officers and/or employees of Streetwise Reports LLC (including members of their household) own securities of Awakn Life Sciences Corp., a company mentioned in this article.

6) This article does not constitute medical advice. Officers, employees and contributors to Streetwise Reports are not licensed medical professionals. Readers should always contact their healthcare professionals for medical advice.

Disclosures For H.C.Wainwright & Co., Awakn Life Sciences Corp a.nd Cybin Inc.,  September 22, 2022

H.C. Wainwright & Co, LLC (the “Firm”) is a member of FINRA and SIPC and a registered U.S. Broker-Dealer.

I, Patrick R. Trucchio, CFA , certify that 1) all of the views expressed in this report accurately reflect my personal views about any and all subject securities or issuers discussed; and 2) no part of my compensation was, is, or will be directly or indirectly related to the specific recommendation or views expressed in this research report; and 3) neither myself nor any members of my household is an officer, director or advisory board member of these companies.

The research analyst principally responsible for preparation of the report does not receive compensation that is based upon any specific investment banking services or transaction but is compensated based on factors including total revenue and profitability of the Firm, a substantial portion of which is derived from investment banking services. Important disclosures and charts can be found on our disclaimer website: https://hcwco.bluematrix.com/sellside/ Disclosures.action

The securities of the company discussed in this report may be unsuitable for investors depending on their specific investment objectives and financial position. Past performance is no guarantee of future results. This report is offered for informational purposes only, and does not constitute an offer or solicitation to buy or sell any securities discussed herein in any jurisdiction where such would be prohibited. This research report is not intended to provide tax advice or to be used to provide tax advice to any person. Electronic versions of H.C. Wainwright & Co., LLC research reports are made available to all clients simultaneously.

No part of this report may be reproduced in any form without the expressed permission of H.C. Wainwright & Co., LLC. Additional information available upon request.

H.C. Wainwright & Co., LLC does not provide individually tailored investment advice in research reports. This research report is not intended to provide personal investment advice and it does not take into account the specific investment objectives, financial situation and the particular needs of any specific person. Investors should seek financial advice regarding the appropriateness of investing in financial instruments and implementing investment strategies discussed or recommended in this research report.

H.C. Wainwright & Co., LLC’s and its affiliates’ salespeople, traders, and other professionals may provide oral or written market commentary or trading strategies that reflect opinions that are contrary to the opinions expressed in this research report. H.C. Wainwright & Co., LLC and its affiliates, officers, directors, and employees, excluding its analysts, will from time to time have long or short positions in, act as principal in, and buy or sell, the securities or derivatives (including options and warrants) thereof of covered companies referred to in this research report.

The information contained herein is based on sources which we believe to be reliable but is not guaranteed by us as being accurate and does not purport to be a complete statement or summary of the available data on the company, industry or security discussed in the report. All opinions and estimates included in this report constitute the analyst’s judgment as of the date of this report and are subject to change without notice.

Securities and other financial instruments discussed in this research report: may lose value; are not insured by the Federal Deposit Insurance Corporation; and are subject to investment risks, including possible loss of the principal amount invested.

Getting to ‘net-zero’ emissions: How energy leaders envision countering climate change in the future

By Seth Blumsack, Penn State and Lara B. Fowler, Penn State 

With the federal government promising over US$360 billion in clean energy incentives under the Inflation Reduction Act, energy companies are already lining up investments. It’s a huge opportunity, and analysts project that it could help slash U.S. greenhouse gas emissions by about 40% within the decade.

But in conversations with energy industry leaders in recent months, we have heard that financial incentives alone aren’t enough to meet the nation’s goal of reaching net-zero emissions by 2050.

In the view of some energy sector leaders, reaching net zero emissions will require more pressure from regulators and investors and accepting technologies that aren’t usually thought of as the best solutions to the climate crisis.

‘Net-zero,’ with natural gas

In spring 2022, we facilitated a series of conversations at Penn State University around energy and climate with leaders at several major energy companies – including Shell USA, and electric utilities American Electric Power and Xcel Energy – as well as with leaders at the Department of Energy and other public-sector agencies.

We asked them about the technologies they see the U.S. leaning on to develop an energy system with zero net greenhouse gases by 2050.

Their answers provide some insight into how energy companies are thinking about a net-zero future that will require extraordinary changes in how the world produces and manages energy.

We heard a lot of agreement among energy leaders that getting to net-zero emissions is not a matter of finding some future magic bullet. They point out that many effective technologies are available to reduce emissions and to capture those emissions that can’t be avoided. What is not an option, in their view, is to leave existing technologies in the rearview mirror.

They expect natural gas in particular to play a large, and possibly growing, role in the U.S. energy sector for many years to come.

What’s behind this view, energy leaders say, is their deep degree of skepticism that renewable energy technologies alone can meet the nation’s future energy demands at a reasonable cost.

Costs for wind and solar power and for energy storage have declined rapidly in recent years. But dependence on these technologies has some grid operators worried that they can’t count on the wind blowing or sun shining at the right time – especially as more electric vehicles and other new users connect to the power grid.

Energy companies are rightly nervous about energy grid failures – no one wants a repeat of the outages in Texas in the winter of 2021. But some energy companies, even those with lofty climate goals, also profit handsomely from traditional energy technologies and have extensive investments in fossil fuels. Some have resisted clean energy mandates.

In the view of many of these energy companies, a net-zero energy transition is not necessarily a renewable energy transition.

Instead, they see a net-zero energy transition requiring massive deployment of other technologies, including advanced nuclear power and carbon capture and sequestration technologies that capture carbon dioxide, either before it’s released or from the air, and then store it in nature or pump it underground. So far, however, attempts to deploy some of these technologies at scale have been plagued with high costs, public opposition and serious questions about their environmental impacts.

Think globally, act regionally

Another key takeaway from our roundtable discussions with energy leaders is that how clean energy is deployed and what net-zero looks like will vary by region.

What sells in Appalachia, with its natural-resource-driven economy and manufacturing base, may not sell or even be effective in other regions. Heavy industries like steel require tremendous heat as well as chemical reactions that electricity just can’t replace. The economic displacement from abandoning coal and natural gas production in these regions raises questions about who bears the burden and who benefits from shifting sources of energy.

Opportunities also vary by region. Waste from Appalachian mines could boost domestic supplies of materials critical to a cleaner energy grid. Some coastal regions, on the other hand, could drive decarbonization efforts with offshore wind power.

At a regional scale, industry leaders said, it can be easier to identify shared goals. The Midcontinent Independent System Operator, known as MISO, which manages the power grid in the upper Midwest and parts of the South, is a good example.

U.S. map showing MISO and other power grid operators.
Among the major power grid operators, MISO has a broad, varied territory, which also extends into Canada, which can make management decisions more difficult.
Federal Energy Regulatory Commission

When its coverage area was predominantly in the upper Midwest, MISO could bring regional parties together with a shared vision of more opportunities for wind energy development and higher electric reliability. It was able to produce an effective multistate power grid plan to integrate renewables.

However, as utilities from more far-flung (and less windy) states joined MISO, they challenged these initiatives as not bringing benefits to their local grids. The challenges were not successful but have raised questions about how widely costs and benefits can be shared.

Waiting for the right kind of pressure

Energy leaders also said that companies are not enthusiastic about taking on risks that low-carbon energy projects will increase costs or degrade grid reliability without some kind of financial or regulatory pressure.

For example, tax credits for electric vehicles are great, but powering these vehicles could require a lot more zero-carbon electricity, not to mention a major national transmission grid upgrade to move that clean electricity around.

That could be fixed with “smart charging” – technologies that can charge vehicles during times of surplus electricity or even use electric cars to supply some of the grid’s needs on hot days. However, state utility regulators often dissuade companies from investing in power grid upgrades to meet these needs out of fear that customers will wind up footing large bills or technologies will not work as promised.

Energy companies do not yet seem to be feeling major pressure from investors to move away from fossil fuels, either.

For all the talk about environmental, social and governance concerns that industry leaders need to prioritize – known as ESG – we heard during the roundtable that investors are not moving much money out of energy companies whose responses to ESG concerns are not satisfactory. With little pressure from investors, energy companies themselves have few good reasons to take risks on clean energy or to push for changes in regulations.

Leadership needed

These conversations reinforced the need for more leadership on climate issues from lawmakers, regulators, energy companies and shareholders.

If the energy industry is stuck because of antiquated regulations, then we believe it’s up to the public and forward-looking leaders in business and government and investors to push for change.The Conversation

About the Author:

Seth Blumsack, Professor of Energy and Environmental Economics and International Affairs, Penn State and Lara B. Fowler, Interim Chief Sustainability Officer, Penn State; Interim Director, Penn State Sustainability Institute; Profess of Teaching, Penn State Law, Penn State

This article is republished from The Conversation under a Creative Commons license. Read the original article.

Forex Technical Analysis & Forecast 18.10.2022

Article By RoboForex.com

EURUSD, “Euro vs US Dollar”

EURUSD has formed a consolidation range around 0.9790 and continues to correct to 0.9873. After this level has been reached, the downside link to the level of 0.9790 is not excluded (test from above). Next, consider the likelihood of another upside structure to 0.9950.

EURUSD
Risk Warning: the result of previous trading operations do not guarantee the same results in the future

GBPUSD, “Great Britain Pound vs US Dollar”

GBPUSD has formed a consolidation range around the level of 1.1330 and with the exit upwards it suggests to consider the probability of continuation of correction to the level of 1.1513. After working out of this level, we expect a decline to the level of 1.1330. Further growth to the level of 1.1730.

GBPUSD
Risk Warning: the result of previous trading operations do not guarantee the same results in the future

USDJPY, “US Dollar vs Japanese Yen”

USDJPY has worked off the upside structure to 149.07. The market is currently forming a consolidation range below this level. On the way up, there will be upside potential to 149.40. On the way down, there is downside potential to 148.40.

USDJPY
Risk Warning: the result of previous trading operations do not guarantee the same results in the future

USDCHF, “US Dollar vs Swiss Franc”

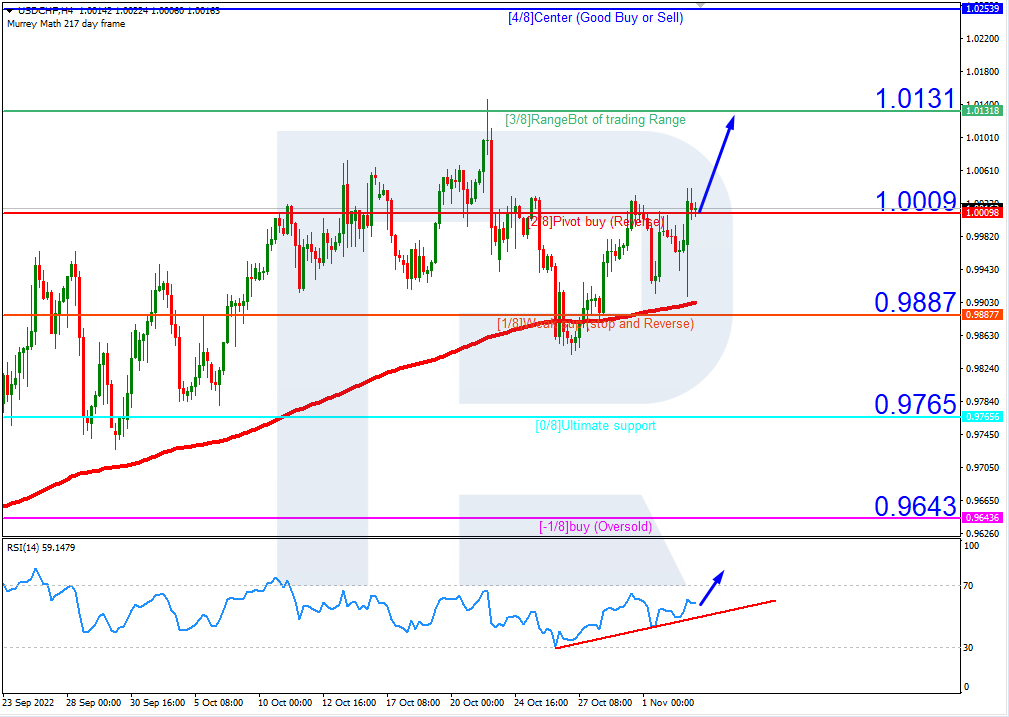
USDCHF rebounded to 0.9921. A continuation of the correction to 0.9900 is not excluded. Further, the growth to the level 1.0121 is expected. The target is local.

USDCHF
Risk Warning: the result of previous trading operations do not guarantee the same results in the future

AUDUSD, “Australian Dollar vs US Dollar”

AUDUSD has formed a consolidation range around the 0.6288 level. With an upside exit, the potential for continued correction to the 0.6383 level is open. The target is local.

AUDUSD
Risk Warning: the result of previous trading operations do not guarantee the same results in the future

BRENT

Brent continues to develop a consolidation range around the 93.36 level. Today we expect a growth link to the 95.70 level. After working out of this level, consider the probability of decrease to the level of 93.36. Further growth to the level of 100.20. The target is the first one.

BRENT
Risk Warning: the result of previous trading operations do not guarantee the same results in the future

XAUUSD, “Gold vs US Dollar”

Gold is forming an upside pattern towards 1664.90. We expect consolidation range development around this level and with the exit up we will consider continuation of the growth wave to the level of 1683.40. The arget is local.

GOLD
Risk Warning: the result of previous trading operations do not guarantee the same results in the future

S&P 500

The S&P index worked its way up to 3739.0. Today we expect consolidation range formation around this level. With an upside entry, upside potential will open up to 3896.3 with the prospect of a continuation of the trend towards 3983.3.

S&P 500
Risk Warning: the result of previous trading operations do not guarantee the same results in the future

Article By RoboForex.com

Attention!
Forecasts presented in this section only reflect the author’s private opinion and should not be considered as guidance for trading. RoboForex LP bears no responsibility for trading results based on trading recommendations described in these analytical reviews.

Third-Party Firm Rates Hydrogen Boiler Nearly 100% Efficient

Source: Streetwise Reports  (10/17/22)

Jericho Energy Ventures is working to bring its zero-emission hydrogen boilers to companies for commercial heating, hot water, and industrial steam.

An independent third-party firm has rated Jericho Energy Ventures Inc.’s (JEV:TSX.V; JROOF:OTCMKTS) zero-emissions hydrogen boiler technology as nearly 100% fuel efficient.

The company’s Dynamic Combustion Chamber™ boiler was tested by Process Engineering Associates LLC.

“All off-gas samples taken during the test did not detect hydrogen in the sample,” said Chris Muntean, a senior process engineer with Process Engineering Associates. “This data suggests that the burners are combusting the vast majority (or all) of the H2 (hydrogen) gas being supplied to the boiler. Based on these performance results, little to no fuel is left unburned.”

As technical analyst Clive Maund wrote for Streetwise Reports, hydrogen “is a fuel of the future.”

As companies shift toward greener energy sources and look to lower their carbon footprint, Jericho hopes its boiler technology will be there for commercial heating, hot water, and industrial steam boilers.

Hydrogen Technologies, a fully owned subsidiary of Jericho, has patented its method for burning hydrogen and oxygen in a vacuum chamber to create high-temperature water and steam with no greenhouse gases or other pollutants.

The only by-product is water, which is recycled. It’s meant to replace existing boilers that burn coal, natural gas, diesel, or fuel oil.

“Our system is more efficient than traditional steam systems,” Jericho Executive Officer Brian Williamson told Streetwise Reports. “They did a whole battery of tests on our system and validated that it is, in fact, 95% cost-efficient, which is  . . .  20% plus more efficient than anything else that’s out there in the market in conventional fossil fuels. There’s also 100% hydrogen burn in the system, meaning that there’s no waste.”

The Catalyst

The test backs up Jericho’s own research on the technology, and the company hopes to use the data to attract investors and customers.

Hydrogen Technologies held a demo week at the end of September in Modesto, Calif., for possible commercial and industrial clients. The company said it was so successful it plans to hold another demo week November 14-18.

The U.S. Department of Energy said the hydrogen market “is in its infancy” but that it has the “potential for near-zero greenhouse gas emissions.”

“Hydrogen generates electrical power in a fuel cell, emitting only water vapor and warm air,” the agency wrote. “It holds promise for growth in both the stationary and transportation energy sectors.”

The element is abundant in our environment and the most abundant element in the universe. It’s stored in water, hydrocarbons (such as methane), and other organic matter.

As technical analyst Clive Maund wrote for Streetwise Reports, hydrogen “is a fuel of the future.”

‘Quite a Few’ Companies Interested

Last summer, Jericho announced it was joining with Australia’s LINE Hydrogen Pty Ltd. to bring the boilers to that country. The companies are creating a distribution “hub” that will allow a constant supply of hydrogen fuel.

Jericho said additional industrial partners will be announced in the coming months, and the first DCC™ boiler is expected to be installed in Tasmania, Australia, in 2023.

Williamson said Jericho has “quite a few” companies that have already expressed interest in the boiler system. Jericho said it will target everything from large industrial plants to schools and hopes to create other duplicate hubs in other places in the world, like the United States, Canada, and Europe.

Each boiler removes the equivalent carbon dioxide of 2,500 cars a year (or about 4,400 tons of carbon dioxide), according to the company.

Jericho was once an oil and gas business. It still has interests in those sectors and has been using money from rising fossil fuel prices to help fund its push toward hydrogen.

The company began transitioning to green energy in June 2020. In January 2021, it announced the acquisition of Hydrogen Technologies. Also, last year, it announced a collaboration with Rémy Cointreau’s Bruichladdich Distillery in Scotland to install a boiler to run its stills that produce Scotch and artisanal gin.

Other green investments include in H2U Technologies Inc., which is developing an electrocatalyst discovery process for electrolyzer and fuel cell applications, and Supercritical Solutions Ltd., which is developing a new class of water electrolyzer that will allow low-cost hydrogen production. Jericho led the seed series funding round for SuperCritical and was joined by Chris Sacca’s Lowercarbon Capital as a co-investor.

Ownership and Share Structure

Top shareholders include Michael L. Graves Inter Vivos Trust with 16.43% or 37.13 million shares, McKenna & Associates LLC with 10.78% or 24.36 million shares, the CEO Williamson with 0.87% or 1.97 million shares, company Director Allen Wilson with 0.87% or 1.97 million shares, and Nicholas W. Baxter with 0.5% or 1.14 million shares.

Jericho has a market cap of CA$81.38 million with 226 million shares outstanding, 158.3 million of them free-floating. It trades in a 52-week range of CA$0.84 and CA$0.31.

Disclosures:
1) Steve Sobek wrote this article for Streetwise Reports LLC. He or members of his household own securities of the following companies mentioned in the article: None. He or members of his household are paid by the following companies mentioned in this article: None.

2) The following companies mentioned in this article are billboard sponsors of Streetwise Reports: Jericho Energy Ventures. Click here for important disclosures about sponsor fees. The information provided above is for informational purposes only and is not a recommendation to buy or sell any security.

3) The article does not constitute investment advice. Each reader is encouraged to consult with his or her individual financial professional and any action a reader takes as a result of information presented here is his or her own responsibility. By opening this page, each reader accepts and agrees to Streetwise Reports’ terms of use and full legal disclaimer. This article is not a solicitation for investment. Streetwise Reports does not render general or specific investment advice and the information on Streetwise Reports should not be considered a recommendation to buy or sell any security. Streetwise Reports does not endorse or recommend the business, products, services or securities of any company mentioned on Streetwise Reports.

4) From time to time, Streetwise Reports LLC and its directors, officers, employees or members of their families, as well as persons interviewed for articles and interviews on the site, may have a long or short position in securities mentioned. Directors, officers, employees or members of their immediate families are prohibited from making purchases and/or sales of those securities in the open market or otherwise from the time of the decision to publish an article until three business days after the publication of the article. The foregoing prohibition does not apply to articles that in substance only restate previously published company releases. As of the date of this article, officers and/or employees of Streetwise Reports LLC (including members of their household) own securities of Jericho Energy Ventures, a company mentioned in this article.