Tech. Analyst Says Pharma Co. Is at a Favorable Risk/Reward Ratio

Source: Clive Maund  (12/28/22) 

Technical analyst Clive Maund reviews Algernon Pharmaceuticals Inc.’s 6-month, 3-year, and 9-year charts to tell you whether you should be interested in this pharma company.

Another stock that appears to be at stony rock bottom is Algernon Pharmaceuticals Inc. (AGN:CSE; AGNPF:OTCQB; AGN0:XFRA), and it has two things going for it — one is that it could come out with positive news at any time that could get it moving and the other is that, with only 2.3 million shares in issue, when it does move it is likely to result in big percentage gains, as happened back last January when it rocketed from CA$4 to CA$12 in a matter of a couple of weeks, a move which we rode.

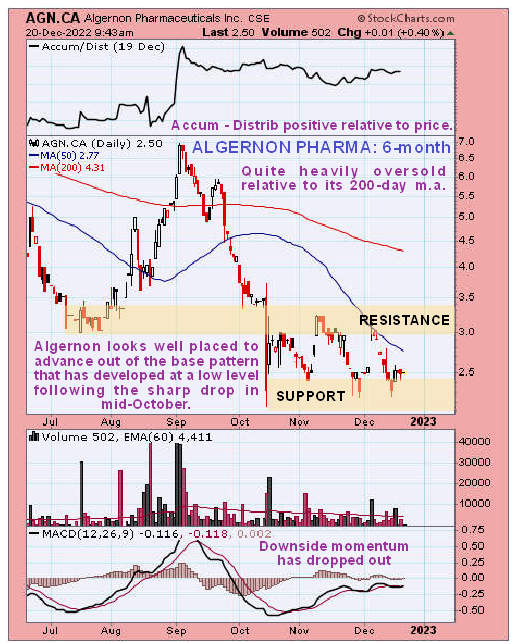
On its 6-month chart, we can see that after dropping hard in mid-October, it has marked out a low trading range that has allowed downside momentum to drop out and the 50-day moving average has dropped down close to the price, in the process opening up a quite large gap between it and the 200-day and these factors taken together make a rally soon increasingly likely with the relatively strong Accumulation line over the past several months being another positive factor.

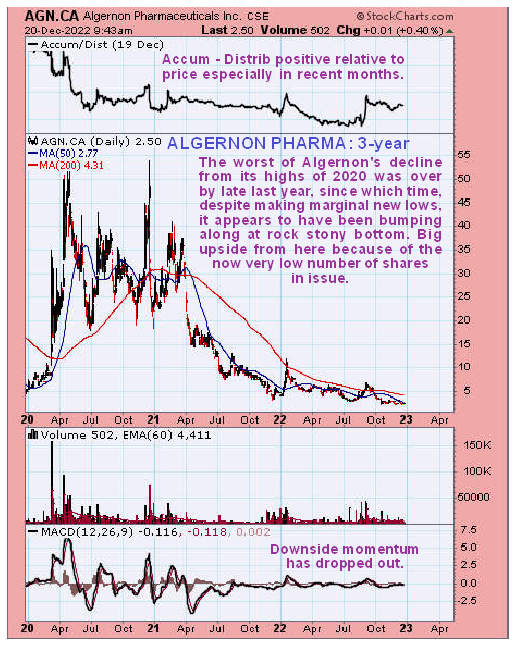
Zooming out on a 3-year chart enables us to put recent action in more perspective (note that this chart and the 9-year we are also looking at have been adjusted for a one-for-100-share rollback about a year ago, which explains the low number of shares in issue).

On this chart, we see that Algernon is now extraordinarily cheap as it has dropped back from a peak at over CA$53 in 2020 to the current miserly price of CA$2.50. The worst decline was behind it by late last year, since which time, although it has continued to make new lows, the rate of decline has slowed, with, as mentioned above, the Accumulation line showing a marked positive divergence in recent months.

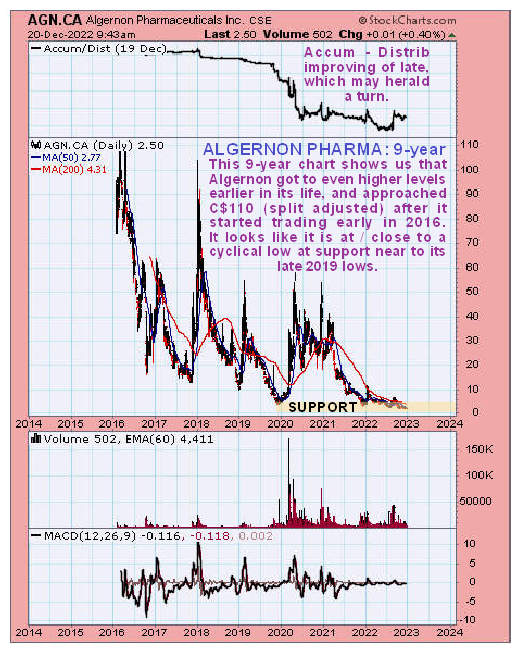
The 9-year chart shows us the entire history of the stock, and on this chart, we see that it got to even higher levels than we saw in 2020, as back in 2016, shortly after it started trading, it got close to CA$110 and at the start of 2018 it spiked to about CA$103.

It looks like it is making a cyclical low here, close to the late 2019 lows.

Even without factoring in the extremely low number of shares in issue, Algernon looks like it is at a low here with a very favorable risk/reward ratio, which is magnified enormously by the low number of shares in issue, as any good news coming through – and there is believed to be some coming through soon — could see it take off strongly higher.

Algernon is therefore rated a strong speculative Buy here.

Algernon Pharmaceuticals’ website

Algernon Pharmaceuticals Inc. closed at CA$2.50, $1.76 on December 20, 2022.

CliveMaund.com Disclosures

The above represents the opinion and analysis of Mr. Maund, based on data available to him, at the time of writing. Mr. Maund’s opinions are his own, and are not a recommendation or an offer to buy or sell securities. Mr. Maund is an independent analyst who receives no compensation of any kind from any groups, individuals or corporations mentioned in his reports. As trading and investing in any financial markets may involve serious risk of loss, Mr. Maund recommends that you consult with a qualified investment advisor, one licensed by appropriate regulatory agencies in your legal jurisdiction and do your own due diligence and research when making any kind of a transaction with financial ramifications. Although a qualified and experienced stock market analyst, Clive Maund is not a Registered Securities Advisor. Therefore Mr. Maund’s opinions on the market and stocks can only be construed as a solicitation to buy and sell securities when they are subject to the prior approval and endorsement of a Registered Securities Advisor operating in accordance with the appropriate regulations in your area of jurisdiction.

Disclosures:
1) Clive Maund: I, or members of my immediate household or family, own securities of the following companies mentioned in this article: None. I personally am, or members of my immediate household or family are, paid by the following companies mentioned in this article: None.

2) The following companies mentioned in this article are billboard sponsors of Streetwise Reports: Algernon Pharmaceuticals Inc. Click here for important disclosures about sponsor fees. As of the date of this article, an affiliate of Streetwise Reports has a consulting relationship with Algernon Pharmaceuticals Inc. Please click here for more information.

3) Statements and opinions expressed are the opinions of the author and not of Streetwise Reports or its officers. The author is wholly responsible for the validity of the statements. The author was not paid by Streetwise Reports for this article. Streetwise Reports was not paid by the author to publish or syndicate this article. Streetwise Reports requires contributing authors to disclose any shareholdings in, or economic relationships with, companies that they write about. Streetwise Reports relies upon the authors to accurately provide this information and Streetwise Reports has no means of verifying its accuracy.

4) This article does not constitute investment advice. Each reader is encouraged to consult with his or her individual financial professional and any action a reader takes as a result of information presented here is his or her own responsibility. By opening this page, each reader accepts and agrees to Streetwise Reports’ terms of use and full legal disclaimer. This article is not a solicitation for investment. Streetwise Reports does not render general or specific investment advice and the information on Streetwise Reports should not be considered a recommendation to buy or sell any security. Streetwise Reports does not endorse or recommend the business, products, services or securities of any company mentioned on Streetwise Reports.

5) From time to time, Streetwise Reports LLC and its directors, officers, employees or members of their families, as well as persons interviewed for articles and interviews on the site, may have a long or short position in securities mentioned. Directors, officers, employees or members of their immediate families are prohibited from making purchases and/or sales of those securities in the open market or otherwise from the time of the decision to publish an article until three business days after the publication of the article. The foregoing prohibition does not apply to articles that in substance only restate previously published company releases. As of the date of this article, officers and/or employees of Streetwise Reports LLC (including members of their household) own securities of Algernon Pharmaceuticals Inc., a company mentioned in this article.

6) This article does not constitute medical advice. Officers, employees and contributors to Streetwise Reports are not licensed medical professionals. Readers should always contact their healthcare professionals for medical advice.

Catalysts for Tech Co. Expected in 2023

Source: Graham Mattison  (12/28/22)

These upcoming events relate to this firm’s efforts to get one or more of its technologies integrated into an existing product and sold commercially, noted a Water Tower Research report.

In 2023 Meta Materials Inc. (MMAT:NASDAQ; MMAX:CSE; MMAT:FSE) is slated to showcase some of its technologies at the Consumer Electronics Show (CES) Jan. 5 to 8, 2023, in Las Vegas, Nev., and is expected to announce its first commercial production contract sometime during the year, reported Graham Mattison, a senior research analyst at Water Tower Research, in a Dec. 19 research note.

Mattison wrote that on the first day of the expo, Meta Materials will participate in ShowStoppers at CES 2023, a presentation of new technologies to the media, industry leaders, and advocates.

During all four days of CES, the Nova Scotia, Canada-based company will host Booth 9417 in the North Hall, where some of its technologies, all of which improve existing products in an important way, will be on exhibit.

Another catalyst to watch for in 2023 is the announcement of Meta Materials’ first technology being commercially incorporated into a product. This would constitute “a major milestone in the company’s growth of commercial revenues,” Mattison wrote.

Meta Materials will showcase its NANOWEB transparent electromagnetic interference shield installed in the door of a microwave oven.

The company also will demonstrate its NANOWEB heaters for deicing/defogging of advanced driver-assistance systems sensors; its NANOWEB antennas and electrochromic lenses for augmented reality eyewear; its NANOWEB 5G reflector films for managing signal propagation indoors and outdoors; and its NPORE nanocomposite ceramic battery separator.

These collectors, which reduce copper usage and improve safety, will be displayed in the company’s booth and incorporated into the exhibited Project Arrow concept electric vehicle.

Another catalyst to watch for in 2023 is the announcement of Meta Materials’ first technology being commercially incorporated into a product. This would constitute “a major milestone in the company’s growth of commercial revenues,” Mattison wrote.

Water Tower Research purported this technology likely will be NANOWEB for application in microwave oven doors, given several factors. One, this could be brought to the consumer product market quickly. High-end microwaves are an ideal initial target market, given their consumers will be less price-conscious and their manufacturers seek new technology to gain market share. Also, microwave ovens are ideal for the product size Meta Materials can currently produce.

To get an idea of the size of the market for these appliances, Mattison noted, “it is estimated that about 70 million microwaves are sold each year, with the typical replacement being about seven to 10 years.”

Meta Materials is currently trading at about $1.41 per share.

Disclosures:
1) Doresa Banning wrote this article for Streetwise Reports LLC and provides services to Streetwise Reports as an independent contractor. She or members of her household own securities of the following companies mentioned in the article: None. She or members of her household are paid by the following companies mentioned in this article: None.

2) The following companies mentioned in this article are billboard sponsors of Streetwise Reports: Meta Materials Inc. Click here for important disclosures about sponsor fees. The information provided above is for informational purposes only and is not a recommendation to buy or sell any security.

3) Statements and opinions expressed are the opinions of the author and not of Streetwise Reports or its officers. The author is wholly responsible for the validity of the statements. The author was not paid by Streetwise Reports for this article. Streetwise Reports was not paid by the author to publish or syndicate this article. Streetwise Reports requires contributing authors to disclose any shareholdings in, or economic relationships with, companies that they write about. Streetwise Reports relies upon the authors to accurately provide this information and Streetwise Reports has no means of verifying its accuracy.

4) This article does not constitute investment advice. Each reader is encouraged to consult with his or her individual financial professional and any action a reader takes as a result of information presented here is his or her own responsibility. By opening this page, each reader accepts and agrees to Streetwise Reports’ terms of use and full legal disclaimer. This article is not a solicitation for investment. Streetwise Reports does not render general or specific investment advice and the information on Streetwise Reports should not be considered a recommendation to buy or sell any security. Streetwise Reports does not endorse or recommend the business, products, services or securities of any company mentioned on Streetwise Reports.

5) From time to time, Streetwise Reports LLC and its directors, officers, employees or members of their families, as well as persons interviewed for articles and interviews on the site, may have a long or short position in securities mentioned. Directors, officers, employees or members of their immediate families are prohibited from making purchases and/or sales of those securities in the open market or otherwise from the time of the decision to publish an article until three business days after the publication of the article. The foregoing prohibition does not apply to articles that in substance only restate previously published company releases.

Disclosures For Water Tower Research, Meta Materials Inc., December 19, 2022

Water Tower Research (“WTR”) is a professional publisher of investment research reports on public companies and, to a lesser extent, private firms (“the Companies”). WTR provides investor-focused content and digital distribution strategies designed to help companies communicate with investors.

WTR is not a registered investment adviser or a broker/dealer nor does WTR provide investment banking services. WTR operates as an exempt investment adviser under the so called “publishers’ exemption” from the definition of investment adviser under Section 202(a)(11) of the Investment Advisers Act of 1940. WTR does not provide investment ratings / recommendations or price targets on the companies it reports on. Readers are advised that the research reports are published and provided solely for informational purposes and should not be construed as an offer to sell or the solicitation of an offer to buy securities or the rendering of investment advice.

The information provided in this report should not be construed in any manner whatsoever as personalized advice. All users and readers of WTR’s reports are cautioned to consult their own independent financial, tax and legal advisors prior to purchasing or selling securities. Graham Mattison, who is the writer of this report, covers the ClimateTech & Sustainable Investing sector for WTR. Mr. Mattison and members of his household have no personal or business-related relationship to the subject company other than providing digital content and any ancillary services WTR may offer.

Unless otherwise indicated, WTR intends to provide continuing coverage of the covered companies. WTR will notify its readers through website postings or other appropriate means if WTR determines to terminate coverage of any of the companies covered. WTR is being compensated for its research by the company which is the subject of this report. WTR may receive up to $14,000 per month [for research and potentially other services] from a given client and is required to have at least a 1-year commitment. None of the earned fees are contingent on, and WTR’s client agreements are not cancellable for the content of its reports. WTR does not accept any compensation in the form of warrants or stock options or other equity instruments that could increase in value based on positive coverage in its reports.

WTR or an affiliate may seek to receive compensation for non-research services to covered companies, such as charges for presenting at sponsored investor conferences, distributing press releases, advising on investor relations and broader corporate communications and public relations strategies as well as performing certain other related services (“Ancillary Services”). The companies that WTR covers in our research are not required to purchase or use Ancillary Services that WTR or an affiliate might offer to clients.

The manner of WTR’s research compensation and Ancillary Services to covered companies raise actual and perceived conflicts of interest. WTR is committed to manage those conflicts to protect its reputation and the objectivity of employees/analysts by adhering to strictly-written compliance guidelines. The views and analyses included in our research reports are based on current public information that we consider to be reliable, but no representation or warranty, expressed or implied, is made as to their accuracy, completeness, timeliness, or correctness. Neither we nor our analysts, directors, officers, employees, representatives, independent contractors, agents or affiliate shall be liable for any omissions, errors or inaccuracies, regardless of cause, foreseeability or the lack of timeliness of, or any delay or interruptions in the transmission of our reports to content users.

This lack of liability extends to direct, indirect, incidental, exemplary, compensatory, punitive, special or consequential damages, costs, expenses, legal fees, losses, lost income, lost profit or opportunity costs. All investment information contained herein should be independently verified by the reader or user of this report. For additional information, all readers of this report are encouraged to visit WTR’s website www.watertowerresearch.com.

Murrey Math Lines 29.12.2022 (USDCHF, XAUUSD)

By RoboForex.com

USDCHF, “US Dollar vs Swiss Franc”

On H4, the quotes are under the 200-day Moving Average, which indicates prevalence of a downtrend. The RSI has bounced off the resistance line. Further falling to the nearest support at 3/8 (0.9155) is expected. The scenario can be cancelled by an upward breakaway of 4/8 (0.9277). In this case, the pair may reach 5/8 (0.9399).

USDCHFH4
Risk Warning: the result of previous trading operations do not guarantee the same results in the future

On M15, the lower line of VoltyChannel is broken, which confirms a downtrend and increases the probability of further price falling.

USDCHF_M15
Risk Warning: the result of previous trading operations do not guarantee the same results in the future

XAUUSD, “Gold vs US Dollar”

On H4, the quotes are above the 200-day Moving Average, which indicates prevalence of an uptrend. The RSI has bounced off the support line. As a result, the quotes are expected to rise above 6/8 (1812.50) and grow to the resistance level of 7/8 (1843.75). The scenario can be cancelled by a downwards breakaway of the support level of 5/8 (1781.25). This might lead to falling of the price to 4/8 (1750.00).

XAUUSD_H4
Risk Warning: the result of previous trading operations do not guarantee the same results in the future

On M15, an additional signal confirming growth will he a breakaway of the upper border of VoltyChannel.

XAUUSD_M15
Risk Warning: the result of previous trading operations do not guarantee the same results in the future

Article By RoboForex.com

Attention!
Forecasts presented in this section only reflect the author’s private opinion and should not be considered as guidance for trading. RoboForex LP bears no responsibility for trading results based on trading recommendations described in these analytical reviews.

The Analytical Overview of the Main Currency Pairs on 2022.12.29

By JustMarkets

The EUR/USD currency pair

Technical indicators of the currency pair:
  • Prev Open: 1.0638
  • Prev Close: 1.0611
  • % chg. over the last day: -0.25 %

Inflation in the Eurozone lags Lithuanian inflation by half a year, which means that its peak is still to come. This is the opinion of the representative of the European Central Bank (ECB) Governing Council, Gediminas Simkus. The main risk comes from the energy crisis amid falling temperatures in winter. If Europe manages to pass this winter without considerable problems in the energy system, it is possible to say with certainty that the inflation peak has already passed this spring.

Trading recommendations
  • Support levels: 1.0586, 1.0483, 1.0361, 1.0332, 1.0284, 1.0193
  • Resistance levels: 1.0654, 1.0667, 1.0695

The trend on the EUR/USD currency pair on the hourly time frame is bullish. The price is forming a price corridor. The price is forming a wide price corridor, and the volatility is reducing in anticipation of the holidays. The MACD indicator has become inactive, but there is a slight selling pressure. Under such market conditions, buy trades are best considered from support levels on intraday time frames, but with additional confirmation. Sell deals can be considered from the resistance level of 1.0654 or 1.0667, but better with a confirmation in the form of a reverse initiative or a false breakout because the level has already been tested.

Alternative scenario: if the price breaks down through the support level of 1.0549 and fixes below it, the downtrend will likely resume.

EUR/USD
News feed for 2022.12.29:
  • – US Initial Jobless Claims (w/w) at 15:30 (GMT+2).

The GBP/USD currency pair

Technical indicators of the currency pair:
  • Prev Open: 1.2024
  • Prev Close: 1.2018
  • % chg. over the last day: -0.05 %

The situation on the GBP/USD currency pair has not changed compared to the previous day. Volatility remains below average in the run-up to the New Year holidays. Fundamental factors for the British pound are extremely weak now, so there are no prerequisites for growth. Traders should not expect significant changes in the price till the end of the year.

Trading recommendations
  • Support levels: 1.1999, 1.1979, 1.1684, 1.1476, 1.1418
  • Resistance levels: 1.2062, 1.2218, 1.2308, 1.2431, 1.2519

From the technical point of view, the trend on the GBP/USD currency pair on the hourly time frame is bearish. The MACD indicator became inactive, and the price formed a narrow price corridor. Under such market conditions, it is better to look for buy deals from the support level of 1.1999 or 1.1979, but with confirmation on intraday time frames. Sell trades are best sought from the resistance level of 1.2062 but also better with confirmation.

Alternative scenario: if the price breaks out through the 1.2308 resistance level and fixes above it, the uptrend will likely resume.

GBP/USD
There is no news feed for today.

The USD/JPY currency pair

Technical indicators of the currency pair:
  • Prev Open: 133.35
  • Prev Close: 134.47
  • % chg. over the last day: +0.83 %

Japan’s industrial production index declined for the third consecutive month. Recent economic data, including exports, retail sales, and industrial production, signal that Japan’s economy is still very fragile and thus supports the Bank of Japan’s view that monetary policy easing should continue. At the moment, JPY does not have any fundamental support, so weak economic data and interest rate differentials between BoJ and FOMC will have a negative impact on JPY.

Trading recommendations
  • Support levels: 133.75, 132.68, 132.27, 131.22
  • Resistance levels: 134.45, 135.88, 137.03, 138.00, 139.09

From the technical point of view, the medium-term trend on the currency pair USD/JPY is bearish. The price is now trading above the moving averages, while the MACD indicator has become inactive. There is some buying pressure inside the day. Buy trades are best considered on intraday time frames from a support level of 133.75 or 132.68, but only with confirmation. Sell deals can be looked for from the resistance level of 134.45, provided there is a reverse reaction.

Alternative scenario: If the price fixes above 137.00, the uptrend will likely resume.

USD/JPY
There is no news feed for today.

The USD/CAD currency pair

Technical indicators of the currency pair:
  • Prev Open: 1.3514
  • Prev Close: 1.3604
  • % chg. over the last day: +0.67 %

No economic events and data about Canada are expected before the end of the year, so the Canadian dollar these days will be completely dependent on the dynamics of the dollar index and oil prices, as Canadian is a commodity currency. Oil prices fell on Wednesday, as well as the likelihood that the easing of pandemic restrictions in China will increase demand for fuel. With the dollar rising, USD/CAD quotes jumped yesterday. The US crude oil inventories will be released today, which will add volatility to the currency pair.

Trading recommendations
  • Support levels: 1.3529, 1.3438, 1.3386, 1.3360, 1.3281, 1.3212
  • Resistance levels: 1.3614, 1.3656, 1.3700, 1.3776, 1.3855

From the point of view of technical analysis, the uptrend trend on the USD/CAD currency pair is still bullish. The price failed to consolidate below the priority level and is trading above the moving averages. The MACD indicator is in the positive zone, and buyers prevail inside the day. Buy trades should be considered from the support level 1.3529, but with confirmation. Sell deals are best to look for on intraday time frames from the resistance level of 1.3614, but with confirmation in the form of reverse initiative on the lower time frames.

Alternative scenario: if the price breaks down and consolidates below the support level of 1.3529, the downtrend will likely resume.

USD/CAD
News feed for 2022.12.29:
  • – US Crude Oil Inventories (w/w) at 18:00 (GMT+2).

By JustMarkets


This article reflects a personal opinion and should not be interpreted as an investment advice, and/or offer, and/or a persistent request for carrying out financial transactions, and/or a guarantee, and/or a forecast of future events.

How Putin’s war and small islands are accelerating the global shift to clean energy, and what to watch for in 2023

By Rachel Kyte, Tufts University 

The year 2022 was a tough one for the growing number of people living in food insecurity and energy poverty around the world, and the beginning of 2023 is looking bleak.

Russia’s war on Ukraine, one of the world’s largest grain and fertilizer feedstock suppliers, tightened global food and energy supplies, which in turn helped spur inflation.

Drought, exacerbated in some places by warring groups blocking food aid, pushed parts of the Horn of Africa toward famine. Extreme weather disasters have left trails of destruction with mounting costs on nearly every continent. More countries found themselves in debt distress.

But below the surface of almost weekly bad news, significant changes are underway that have the potential to create a more sustainable world – one in which humanity can tackle climate change, species extinction and food and energy insecurity.

I’ve been involved in international sustainable development for most of my career and now teach climate diplomacy. Here’s how two key systems that drive the world’s economy – energy and finance – are starting to shift toward sustainability and what to watch for in 2023.

Ramping up renewable energy growth

Russian President Vladimir Putin’s war on Ukraine has reverberated through Europe and spread to other countries that have long been dependent on the region for natural gas. But while oil-producing countries and gas lobbyists are arguing for more drilling, global energy investments reflect a quickening transition to cleaner energy.

Call it the Putin effect – Russia’s war is speeding up the global shift away from fossil fuels.

In December, the International Energy Agency published two important reports that point to the future of renewable energy.

First, the IEA revised its projection of renewable energy growth upward by 30%. It now expects the world to install as much solar and wind power in the next five years as it installed in the past 50 years.

The second report showed that energy use is becoming more efficient globally, with efficiency increasing by about 2% per year. As energy analyst Kingsmill Bond at the energy research group RMI noted, the two reports together suggest that fossil fuel demand may have peaked. While some low-income countries have been eager for deals to tap their fossil fuel resources, the IEA warns that new fossil fuel production risks becoming stranded, or uneconomic, in the next 20 years.

The main obstacles to the exponential growth in renewable energy, IEA points out, are antiquated energy policy frameworks, regulations and subsidies written at a time when energy systems, pricing and utilities were all geared toward fossil fuels.

Look in 2023 for reforms, including countries wrestling with how to permit smart grids and new transmission lines and finding ways to reward consumers for efficiency and clean energy generation.

The year 2023 will also see more focus on developing talent for the clean energy infrastructure build-out. In the U.S., the recently passed Inflation Reduction Act and the Bipartisan Infrastructure Law will pour hundreds of billions of dollars into clean energy and technology. Europe’s REPowerEU commitments will also boost investment. However, concerns about “buy American” rules within the new U.S. climate laws and an EU plan to launch a carbon border adjustment tax are raising fears that nationalism in trade policy could harm the speed of green growth.

Fixing international climate finance

The second system to watch for reform in 2023 is international finance. It’s also crucial to how low-income countries develop their energy systems, build resilience and recover from climate disasters.

Wealthy nations haven’t moved the energy transition forward quickly enough or provided enough support for emerging markets and developing countries to leapfrog inefficient fossil-fueled energy systems. Debt is ballooning in low-income countries, and climate change and disasters like the devastating flooding in Pakistan wipe out growth and add costs.

Barbados Prime Minister Mia Mottley has brought together international financial institutions with think tanks and philanthropists to push for changes.

Countries like Mottley’s have been frustrated that the current international financial system – primarily the International Monetary Fund and the multilateral development banks, including the World Bank – haven’t adapted to the growing climate challenges.

Mottley’s Bridgetown Initiative proposes a new approach. It calls for countries’ vulnerability to be measured by climate impact, and for funds to be made available on that basis, rather than income. It also urges more risk-taking by the development banks to leverage private investment in vulnerable countries, including climate debt swaps.

The Bridgetown Initiative also calls for countries to reflow their IMF Special Drawing Rights – a reserve available to IMF members – into a proposed fund that vulnerable countries could then use to build resilience to climate change. A working group established by the G-20 points out that the “easiest” trillion dollars to access for urgent climate response is that already in the system.

In early 2023, Mottley and French President Emmanuel Macron, with others, will drive a process to examine the possible measures to improve the current system before the annual meetings of the World Bank and the IMF in April, and then at a June summit called by France.

Watch in 2023 to see if this is the year the G-7 and the G-20 rekindle their global economic leadership roles. Their members are the largest owners of the international financial institutions, and also the largest emitters of carbon dioxide on the planet. India will lead the G-20 in 2023, followed by Brazil in 2024. Their leadership will be critical.

Watch small nations’ leadership in 2023

In 2023, expect to see small nations increasingly push for global transformation, led by the V-20 – the finance ministers of the countries most vulnerable to climate change.

In addition to the Bridgetown Initiative, Barbados has suggested a way to pool new funds working off the model of an oil spill damage fund at the International Maritime Organization. In the IMO fund, big oil importers pay in, and the fund pays out in the event of a spill. Barbados supports creating a similar fund to help countries when a climate event costs more than 5% of a country’s GDP.

This model is potentially a way to pool funds from a levy on the windfall profits of energy companies that saw their profits soar in 2022 while billions of people around the world suffered from energy price inflation.

Finally, the breakthrough agreement on biodiversity reached in December 2022 provides more promise for 2023. Countries agreed to conserve 30% of the world’s biodiversity and restore 30% of the world’s degraded lands. The funding – a $30 billion fund by 2030 – remains to be found, but the plan clarifies the task ahead and nature’s place in it. And we can hope 2023 is a year when signs of peace in our war against nature break out.The Conversation

About the Author:

Rachel Kyte, Dean of the Fletcher School, Tufts University

This article is republished from The Conversation under a Creative Commons license. Read the original article.

Volatility declines, investors shift to safe-haven assets ahead of New Year holidays

By JustMarkets

Investors continue to get rid of stocks before the end of the trading year. As the stock market closed Wednesday, the Dow Jones Index (US30) decreased by 1.10%, and the S&P 500 Index (US500) was down by 1.20%. The NASDAQ Technology Index (US100) fell by 1.35%. The Nasdaq (US100) fell to a two-month low as the technology downturn continues, and the S&P 500 (US500) is poised for its biggest annual loss since the 2008 financial crisis. Recession fears are highly likely to continue in the market in early 2023, but analysts believe equity markets will begin to recover in the second half of 2023.

The US Real Estate Market continues to show signs of weakness. Pending home sales fell in all regions this month. On a year-over-year basis, unfinished home sales fell by 38.60%, the largest year-over-year drop on record. Pending home sales are often seen as a leading indicator of purchases of existing homes, given that real estate contracts are usually entered into a month or two before they are sold.

Shares of Southwest Airlines (LUV) decreased by 3% after a warning that airlines continue to cancel flights due to bad weather. Shares of AAL (AAL) and DAL (DAL) were down more than 1% yesterday.

Tesla (TSLA) plans to cut production at its Shanghai plant due to an increase in the incidence of coronavirus.

Equity markets in Europe traded flat yesterday. German DAX (DE30) gained 0.32%, French CAC 40 (FR40) was 0.61% lower, Spanish IBEX 35 (ES35) decreased by 0.12%, and British FTSE 100 (UK100) gained 0.32%.

Analysts believe that the energy crisis will lead to a significant slowdown of the European economy in 2023. At the same time, real estate prices will collapse, and unemployment will rise substantially. The main risk comes from the energy crisis amid falling temperatures in winter. And suppose Europe manages to get through this winter without significant problems in the energy system. In that case, it will be possible to say with certainty that the peak of inflation is over.

The EU replaced Russian and Ukrainian steel with supplies from Taiwan and South Korea.

Oil prices fell Wednesday because of the likelihood that China’s easing of pandemic restrictions will boost demand for fuel. China said it would stop requiring quarantine for arriving travelers starting January 8, an important step toward easing strict restrictions. But falling oil inventories could bring back bullish sentiment in the oil market. A preliminary Reuters poll showed that US crude inventories fell by 1.6 million barrels last week.

Gold and silver are inversely correlated to the dollar index and US government bond yields. As monetary policy tightens, the dollar index and government bond yields go up, and gold and silver prices go down, which they have been doing for 2022. But the first signs of a slowdown in rate hikes have returned investor interest in precious metals. The US Federal Reserve will peak rates in 2023, potentially setting the stage for a new medium-term or even long-term uptrend in gold.

Asian indices traded flat yesterday. Japan’s Nikkei 225 (JP225) decreased by 0.41%, China’s FTSE China A50 (CHA50) was down by 0.08%, India’s NIFTY 50 (IND50) lost 0.05%, Hong Kong’s Hang Seng (HK50) jumped by 1.56%, and S&P/ASX 200 (AU200) closed down by 0.3%.

Chinese energy companies began constructing a power plant with a capacity of 16 million kW in northern China. The solar and wind power project will be the largest power plant of its kind built in the desert.

S&P 500 (F) (US500) 3,783.22 −46.03 (−1.20%)

Dow Jones (US30) 32,875.71 −365.85 (−1.10%)

DAX (DE40) 13,925.60 −69.50 (−0.50%)

FTSE 100 (UK100) 7,497.19 +24.18 (+0.32%)

USD Index 104.55 +0.37 (+0.35%)

Important events for today:
  • – US Initial Jobless Claims (w/w) at 15:30 (GMT+2);
  • – US Natural Gas Storage (w/w) at 17:30 (GMT+2);
  • – US Crude Oil Inventories (w/w) at 18:00 (GMT+2).

By JustMarkets


This article reflects a personal opinion and should not be interpreted as an investment advice, and/or offer, and/or a persistent request for carrying out financial transactions, and/or a guarantee, and/or a forecast of future events.

Three ‘F’ words to sum up 2022

By ForexTime 

This year has been fraught with market volatility, to say the least.

As we bid goodbye to 2022, let’s recap 3 major themes, each being an F-word, that rocked major assets over the past 12 months:


  1. Fed

The primary driver of global markets in 2022 has been the most aggressive Federal Reserve – the US central bank – that we’ve seen since the 1980s.

Recall that a central bank’s primary weapon in cooling down inflation is to move interest rates higher. After all, the US was experiencing its fastest inflation in 40 years!

To be more specific, markets were caught off guard particularly by the speed at which the Fed raised interest rates this year (to be fair, many Fed officials themselves didn’t think they’d have to hike rates so much so soon either).

  • This time last year, markets only forecasted that US interest rates would be hiked by a maximum of 75 basis points for all of 2022.
  • Fast forward 12 months later, we have seen US interest rates skyrocket by 425 basis points, bringing the benchmark rate from near-zero now up to 4.5% – its highest level since 2007!


Gold’s enemy #1 for 2022 proved to be US interest rates climbing at that speed, and the US dollar soaring in tandem.


The market’s fixation on soaring US interest rates, coupled with the fact that gold is a zero-yielding asset (does not pay interest/generate income for investors who hold on to this asset) to drag down prices, despite the precious metal’s traditional roles as:

  • Inflation hedge: a way to protect investors’ wealth against the corrosive effects of skyrocketing inflation
  • Safe haven: a way to protect investors’ wealth in times of great uncertainty.

Hence, bullion was dragged down by as much as 22% from its post-Russian invasion peak to its lowest levels since 2020.

Though to be fair, spot gold has embarked on a remarkable recovery since early November on hopes that the “worst” of the Fed rate hikes are over.

READ MORE:


Now, here’s the second F-word …

  1. Fear

From the Russia-Ukraine war that’s still raging on, to the UK’s worst cost-of-living crisis in a generation, and even crypto’s collapse – there were many notable events that frightened investors and traders worldwide.

Such events hastened those in the markets to scrambling for ways to protect their money.

Amid all the FUD (fear, uncertainty, doubt), one particular asset reigned supreme = King Dollar.

Note how the benchmark Dollar index, DXY (used to measure the US dollar’s overall performance, though specifically the US dollar’s performance against 6 other major currencies) soared by as much as 20% this year.

READ MORE:


Though since late-September, the DXY has halved its year-to-date gains, on the hopes that the Fed is closer to being done with its interest rate hikes.

Still, to prove the US dollar’s dominance as the safe haven of choice for 2022, here’s a comparison of how the DXY fared against other traditional safe haven assets, as measured by their respective year-to-date performances on this penultimate day of the year:

  • DXY = +9%
  • Gold = -1%
  • Swiss Franc = -1.4%
  • US bonds = -13% (as measured by the Bloomberg USAgg Index)
  • Japanese Yen = -14%


And now, for the final F-word of this year-in-review article …


  1. Fundamentals

Remember the days when central banks were printing money out of thin air and just dishing it out?

Well, a lot of that money also made it into stock markets, which sent prices to record highs.

Recall how the S&P 500 set a record high on January 3rd, 2022?

Well, those days are now long gone.

Central banks sought to suck some of that money back out of the financial markets, either by hiking interest rates or by halting the purchase of bonds (quantitative tightening).

This year, companies had to wave bye-bye to easy money, with interest rates no longer at record lows.

Hence, investors demanded that these companies return to the fundamentals: show that it can continue churning out profits in the future.

Companies with weak fundamentals, whose future profitability or growth were in severe doubt, were roundly punished by the stock market:

  • Coinbase (crypto platform) = -87%
  • Snap (social media) = -82%
  • Tesla (EV maker) = -68%

(NOTE: It was a particularly brutal year for EV makers, with the likes of Lucid Group, Rivian and Nio each suffering even bigger annual losses than Tesla’s)


Even Big Tech giants such as, from Amazon to Meta, had to let go tens of thousands of employees this year.

Such layoffs were carried out in the name of making sure these companies remain financially sound amid these turbulent times.


Furthermore, with the Fed rate hikes threatening to send the US economy into a recession, such a contraction in the world’s largest economy is expected to negatively impact the earnings of these publicly-listed companies.

Amid all these woes, and the end of the easy-money era, no surprise that the S&P 500 may well end the year in a ‘bear market’ (a 20% drop from its recent high).


READ MORE:


So, there you have it.

3 ‘F’ words that encapsulated a year to remember.


But before we wrap up, here’s a “bonus” F-word for you to consider … “Future”.

After all, investors and traders are forward-looking creatures, with today’s prices reflecting what markets think/believe/hope will happen down the line.

With that in mind, do look out for our 2023 Preview that’ll be posted here on this “Market Analysis” section soon.

Thank you for reading our Daily Market Analysis throughout 2022.

We hope to continue keeping you up-to-date on all the major happenings happening across FX, commodities, precious metals, and stocks in the year ahead.


Have a happy new year, and may 2023 be a rewarding time in the markets for us all.


Forex-Time-LogoArticle by ForexTime

ForexTime Ltd (FXTM) is an award winning international online forex broker regulated by CySEC 185/12 www.forextime.com

The cryptocurrency market digest (BTC, SOL, TON). Overview for 28.12.2022

By RoboForex.com

The BTC is stuck in place again, generally fluctuating near 16,654 USD.

The situation at the exchange is vague. Investors are afraid to buy due to trouble with mining and trust issues after the crash of the FTX crypto exchange. All these problems cannot be resolved at once, so no one rushes at solving them.

In fact, investors are tired of waiting, and on such a background, the price may fluctuate a lot. During winter holidays, care should he taken at the crypto market.

Technically, the BTC remains in a flat between 16,500 and 17,200 USD. Few investors believe that conditions will form at all for an attack on 17,200 USD, from where a pathway to 18,500 USD may open. However, all the highlights should be kept before one’s eyes. An important support level is 15,500 USD.

Capitalisation of the crypto market has dropped to 799.679 billion USD. The BTC takes up 40.1%, the ETH — 18.3%.

SOL and TON dropped noticeably

The SOL and TON tokens lost more than 10% yesterday, having no fundamental reasons for such a decline. The XCN and APT coins also got under some pressure.

Kraken leaves Japan

The Kraken crypto exchange leaves the Japanese market. The company has announced that starting 31 January 2023, it renounces its FSA registration as a crypto asset operator. The company made this decision to give priority to other more promising investment options.

FTX borrowed 511 million USD from Alameda

The bankrupt crypto exchange FTX loaned 511 million USD from its subsidiary Alameda Research in order to buy stocks of the Robinhood trading platform. This is clear from the documents retrieved by the court. The purchase of the block of shares was carried out by a shell company. The problem is that Alameda also borrowed the same sum from BlockFi (the company has already gone bankrupt) on the interest of those very Robinhood shares. The block of shares will now be the subject of most acute disputes.

Article By RoboForex.com

Attention!
Forecasts presented in this section only reflect the author’s private opinion and should not be considered as guidance for trading. RoboForex LP bears no responsibility for trading results based on trading recommendations described in these analytical reviews.

Hydrogen Fueled Boiler Drives Company’s Pivot Toward Green Energy

Source: Streetwise Reports  (12/22/22)

Jericho Energy Ventures Inc. reports gains with strong financial performance in gas, oil, and fuel of the future, hydrogen. Read more to learn the details of this report as well as see what experts are saying about the company. 

Jericho Energy Ventures Inc. (JEV:TSX.V; JROOF:OTC PINK: JLM:FRA) has been awarded the Solar Impulse Foundations’ ‘Solar Impulse Efficient Solution’ Label, for its zero-emission Dynamic Combustion Chamber™ (DCC™) hydrogen fueled boiler. The Label seeks to identify solutions that hit high standards in profitability and sustainability and displays them to leading decision-makers hoping to expedite their development.

JEV is an energy company focused on the transition to low-carbon energy solutions, with investments in zero-emission hydrogen technologies. Founded in 2010, the company initially focused its efforts on oil and gas before beginning the transition to green energy in 2020 and continues to use profits from those sectors to fund its research into hydrogen.

Why Hydrogen?

Hydrogen continues to claim its spot on the list of sustainable fuels of the future. As reported by the National Inflation Association, on Dec. 9, the leaders of France, Portugal, and Spain, as well as European Commission President Ursula von der Leyen, met in the Spanish city of Alicante for a discussion on the construction and financing of a new pipeline to carry green hydrogen between Barcelona and Marseille.

The NIA also reported on an announcement from Airbus detailing the development of a hydrogen-powered jet engine for the A380 superjumbo, with test flights due to begin in 2026.

Technical analyst Clive Maund described JEV as an “energy company that is moving with the times,” and it continues to prove it with the development of its hydrogen-fueled product.

The Biden-Harris Administration, through the U.S. Department of Energy (DOE), has also announced US$750 million in funding in a bid to reduce the cost of clean hydrogen technology.

It is hoped the injection of funds will accelerate the expansion of hydrogen use and is an essential part of President Biden’s plan to have a 100% clean electrical grid by 2035 and net-zero carbon emissions by 2050.

Texas Governor Greg Abbott also announced on Dec. 8 that a US$4 billion hydrogen factory will be built in North Texas and will produce more than 73,000 metric tons of green hydrogen per year. This will make it the largest green hydrogen facility in the U.S.

Source: iea.org

The Chairman of the Solar Impulse Foundation, Bertrand Piccard, highlighted that, while heads of state and government officials may say that protecting the environment is too expensive, “solutions exist and represent the biggest market opportunity of our century,” calling it an “opportunity which cannot be missed.”

And Jericho Energy Ventures is not a company that likes to miss opportunities. Back in November, technical analyst Clive Maund described JEV as an “energy company that is moving with the times,” and it continues to prove it with the development of its hydrogen-fueled product.

Catalyst: Expert Says Jericho To Be 2023’s Largest Gainer

While the award was great for Jericho Energy Ventures, it is not the only good news to come from the company.  It follows the news that JEV, whose registered office is in Vancouver, BC, reported record oil and gas joint venture results in Q3, a direct result of growing crude oil and natural gas prices in the first three quarters of 2022.

Having begun as an energy company focused on oil and gas, it acquired Hydrogen Technologies in January 2021 as part of its transition to researching and developing green energy solutions. It continues to invest in companies aligned with a low-carbon future, including H2U Technologies Inc., which is developing a new electrolyzer that will facilitate low-cost hydrogen production.

The National Inflation Association predicts that JEV will be one of the market’s largest percentage gainers in 2023.

Jericho Energy Ventures CEO Brian Williamson said that the company continues to “demonstrate that our strategy of providing molecules required for today and tomorrow can yield results for our shareholders. Our steady oil and gas production base provides strong cash flows that feed both strategic initiatives of hydrocarbons today and lower carbon forms of energy tomorrow.”

The National Inflation Association predicts that JEV will be one of the market’s largest percentage gainers in 2023. Investment from billionaire Chris Sacca’s Lowercarbon Capital in January 2022, along with investment from JEV into Supercritical Solutions, will go toward the development of the world’s first green hydrogen electrolyzer. The fact that Chris Sacca is one of the top three most successful technology investors of all time is sure to bring a level of prestige to the work going into development.

The NIA expects  JEV’s market cap to “reach levels that are many times higher than today.”

The boiler was developed by JEV’s wholly-owned subsidiary, Hydrogen Technologies, which provides its award-winning clean energy solution for the Commercial and Industrial Boiler Market. The DCC™ produces zero CO2 or Greenhouse Gas emissions and seeks to replace boilers that burn coal, natural gas, fuel oil, or diesel, which will hopefully lead to a significant reduction in global greenhouse gasses emitted each year. It aims to decarbonize the global commercial and industrial heating industry, valued at almost US$30 billion.

Williamson stated, “we are, of course, honored to receive this prestigious recognition from the Solar Impulse Foundation. I applaud the fortitude and determination shown by the Hydrogen Technologies Team, which made this achievement possible, and we look forward to our DCC™ playing a major role in the reduction of greenhouse gas emissions from the commercial and industrial heat and steam market globally.”

Ownership and Share Structure

Retail: 70%
Management/Insiders: 30%
Institutions: 0%
70%
30%
Share Structure as of 12/22/2022


According to Reuters, around 30% of Jericho’s shares are held by management and insiders. CEO Brian Williamson owns 1.26% of the shares, around 2.85 million. Founder Allen William Wilson is at 0.87%, with 1.97 million shares. and board member Nicholas Baxter owns 0.5%, with just over 1.1 million. Founder Allen William Wilson is at 0.87%, with 1.97 million shares.

Around 0.1% of shares are held by institutions. The largest of these is Michael L. Graves Inter Vivos Trust which is at 16.43%, with 37.13 million shares. McKenna & Associates LLC is next at 10.78%, with 24.36 million shares, and Andrew James Mckenna himself is at 0.15%, with 0.35 million shares.

70% of Jericho’s shares are in retail.

JEV’s market cap is CA$81.71 million, and it trades in a 52-week range of CA$0.31 and CA$0.84. It has 226.05 million shares outstanding.

Disclosures:
1) Lauren Rickard wrote this article for Streetwise Reports LLC and provides services to Streetwise Reports as an independent contractor. They members of their household own securities of the following companies mentioned in the article: None. They or members of their household are paid by the following companies mentioned in this article: None.

2) The following companies mentioned in this article are billboard sponsors of Streetwise Reports: Jericho Energy Ventures Inc. Click here for important disclosures about sponsor fees. As of the date of this article, an affiliate of Streetwise Reports has a consulting relationship with: None. Please click here for more information.

3) Comments and opinions expressed are those of the specific experts and not of Streetwise Reports or its officers. The information provided above is for informational purposes only and is not a recommendation to buy or sell any security.

4) The article does not constitute investment advice. Each reader is encouraged to consult with his or her individual financial professional and any action a reader takes as a result of information presented here is his or her own responsibility. By opening this page, each reader accepts and agrees to Streetwise Reports’ terms of use and full legal disclaimer. This article is not a solicitation for investment. Streetwise Reports does not render general or specific investment advice and the information on Streetwise Reports should not be considered a recommendation to buy or sell any security. Streetwise Reports does not endorse or recommend the business, products, services or securities of any company mentioned on Streetwise Reports.

5) From time to time, Streetwise Reports LLC and its directors, officers, employees or members of their families, as well as persons interviewed for articles and interviews on the site, may have a long or short position in securities mentioned. Directors, officers, employees or members of their immediate families are prohibited from making purchases and/or sales of those securities in the open market or otherwise from the time of the decision to publish an article until three business days after the publication of the article. The foregoing prohibition does not apply to articles that in substance only restate previously published company releases. As of the date of this article, officers and/or employees of Streetwise Reports LLC (including members of their household) own securities of Jericho Energy Ventures Inc., a company mentioned in this article.

Japanese Candlesticks Analysis 28.12.2022 (XAUUSD, NZDUSD, GBPUSD)

By RoboForex.com

XAUUSD, “Gold vs US Dollar”

At the support level, gold has formed a Harami reversal pattern. Currently, the pair can go by the pattern in an ascending wave. The goal of the growth might be the resistance level of 1830.50. After the test of the resistance level, the pair can break through it and continue the uptrend. However, the quotes may pull back to 1800.00 before further growth.

XAUUSD
Risk Warning: the result of previous trading operations do not guarantee the same results in the future

NZDUSD, “New Zealand Dollar vs US Dollar”

On H4, at the support level, the pair has formed a Hammer reversal pattern. The pair may now go by the signal in an ascending wave. The goal of the growth might be 0.6365. After a breakaway of the resistance, the quotes may get a chance for continuing the uptrend. However, the price may pull back to 0.6235 before further growth.

NZDUSD
Risk Warning: the result of previous trading operations do not guarantee the same results in the future

GBPUSD, “Great Britain Pound vs US Dollar”

On H4, at the support level, the pair has formed a Hammer reversal pattern. Currently, the pair may go by the signal in an ascending wave. The goal of the growth is still the resistance level of 1.2190. However, the price may pull back to 1.1960 before continuing the uptrend.

GBPUSD

Article By RoboForex.com

Attention!
Forecasts presented in this section only reflect the author’s private opinion and should not be considered as guidance for trading. RoboForex LP bears no responsibility for trading results based on trading recommendations described in these analytical reviews.