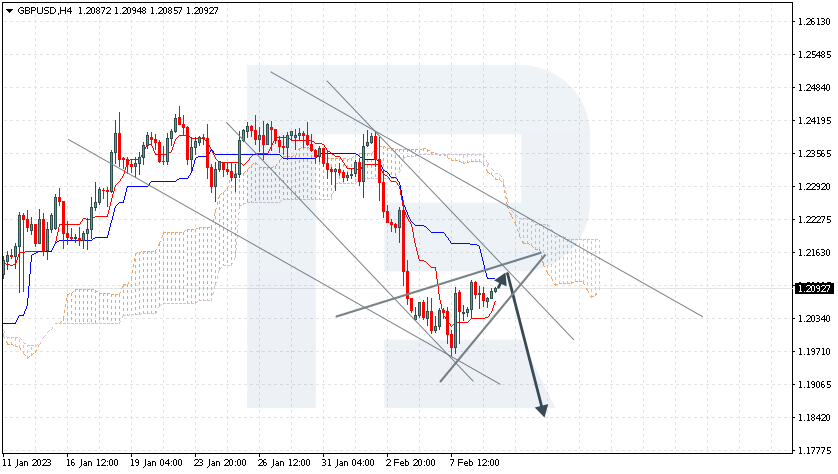
GBPUSD is correcting in a Wedge reversal pattern. The instrument is going below the Ichimoku Cloud, which suggests a downtrend. A test of the Kijun-Sen line at 1.2120 is expected, followed by falling to 1.1845. An additional signal confirming the decline will be a bounce off the upper border of the descending channel. The scenario can be cancelled by a breakaway of the upper border of the Cloud and securing above 1.2250, which will mean further growth to 1.2345. The scenario can be confirmed by a breakaway of the lower border of the Wedge and securing under 1.2035.
USDCAD, “US Dollar vs Canadian Dollar”
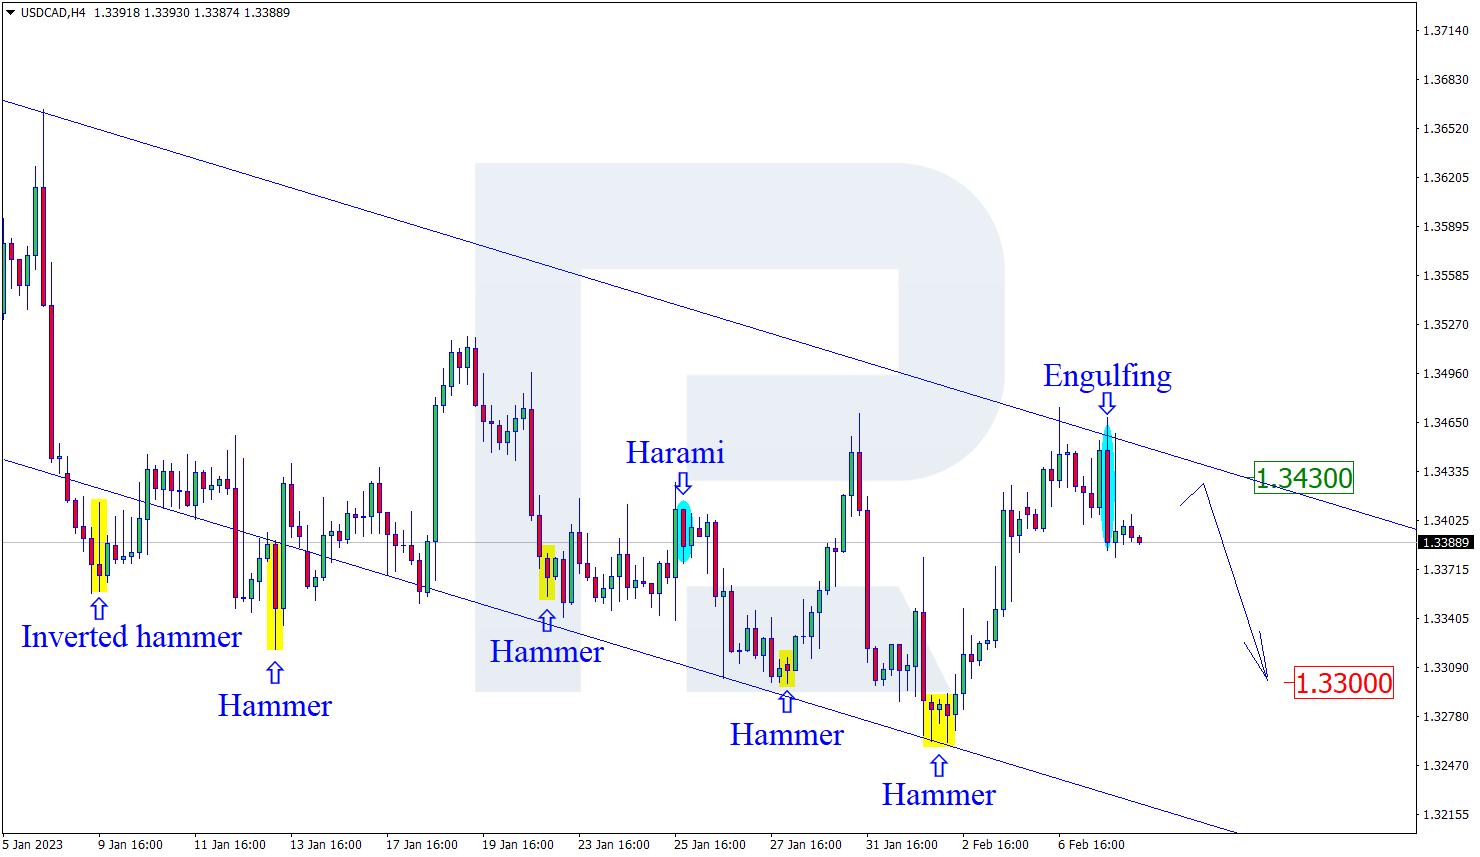
USDCAD is pushing off the resistance level. The instrument is going above the Ichimoku Cloud, which suggests an uptrend. A test of the Tenkan-Sen line of the Cloud at 1.3405 is expected, followed by growth to 1.3565. An additional signal confirming the decline will be a bounce off the lower border of the bullish channel. The scenario can be cancelled by a breakaway of the lower border of the Cloud and securing under 1.3310, which will mean further falling to 1.3205. The scenario can be confirmed by a breakaway of the upper border of the descending channel and securing above 1.3495.
AUDUSD, “Australian Dollar vs US Dollar”
AUDUSD is growing before falling. The instrument is going below the Ichimoku Cloud, which suggests a downtrend. A test of the Kijun-Sen line at 0.6980 is expected, followed by falling to 0.6775. An additional signal confirming the decline will be a bounce off the upper border of the descending channel. The scenario can be cancelled by a breakaway of the upper border of the Cloud and securing above 0.7055, which will mean further growth to 0.7145. The decline can be confirmed by a breakaway of the lower border of the bullish channel and securing under 0.6895.
Attention! Forecasts presented in this section only reflect the author’s private opinion and should not be considered as guidance for trading. RoboForex LP bears no responsibility for trading results based on trading recommendations described in these analytical reviews.
According to the ECB Governing Council spokesman Martins Kazaks, the central bank should raise interest rates to levels that will “significantly” constrain the economy. At the same time, the politician added that rate hikes might have to be maintained after the March meeting. That said, the peak in borrowing costs will have to be maintained for some time to ensure that the eurozone’s strongest price spike is subdued. Analysts are predicting that the ECB will raise the rate by 0.5% at the March meeting and a 0.25% rate hike in May.
The trend on the EUR/USD currency pair on the hourly time frame is bearish. The price is forming a narrow corridor. But the false breakdown zone below 1.0710 works as support and does not let the price go lower. The MACD indicator has become inactive, and sellers’ pressure is weak. Under such market conditions, buy trades are best considered from the support level of 1.0710, but with confirmation since the level has already been tested. Sell deals can be considered from the resistance level of 1.0838, but better with confirmation in the form of a reverse initiative.
Alternative scenario: if the price breaks down through the resistance level of 1.0967 and fixes above it, the uptrend will likely resume.
News feed for 2023.02.09:
– German Consumer Price Index at 09:00 (GMT+2);
– Eurozone Economic Forecasts (m/m) at 12:00 (GMT+2);
– US Initial Jobless Claims (w/w) at 15:30 (GMT+2).
The GBP/USD currency pair
Technical indicators of the currency pair:
Prev Open: 1.2037
Prev Close: 1.2070
% chg. over the last day: +0.27 %
Strikes remain a problem for the UK government. On March 15, civil servants are planning another strike. On the same day, Chancellor of the Exchequer Jeremy Hunt will present his financial plan, and there will be additional pressure to revise payroll requests possibly. Since the strike is undermining the UK economy, this is a negative for the British currency. Friday’s GDP data may serve as an additional catalyst for price movement.
Trading recommendations
Support levels: 1.2059, 1.2000, 1.1930
Resistance levels: 1.2147, 1.2202, 1.2311, 1.2416
From the technical point of view, the trend on the GBP/USD currency pair on the hourly time frame is bearish. The price is trading at the level of the moving averages. A false breakdown zone was formed below the level of 1.2000. The MACD indicator has become positive. Under such market conditions, it is better to look for buy deals on intraday time frames from the support level of 1.2059 or 1.2000, but with a confirmation in the form of an impulse initiative. It is best to look for sell deals after a pullback. The best resistance levels are 1.2147 and 1.2202, but it is also better with a confirmation in the form of a reverse initiative.
Alternative scenario: if the price breaks out through the 1.2416 resistance level and fixes above it, the uptrend will likely resume.
News feed for 2023.02.09:
– UK Monetary Policy Report Hearings at 11:45 (GMT+2).
The USD/JPY currency pair
Technical indicators of the currency pair:
Prev Open: 131.05
Prev Close: 131.43
% chg. over the last day: +0.29 %
Most Japanese inflation indicators show that price growth has no signs of easing, despite the Bank of Japan holding firm to its forecast that inflation will return to the 2% target in the first half of this year. In addition, rising wage growth (+4.8%) is also raising concerns about the wage and price spiral. This inflationary pressure has sparked rumors that the Bank of Japan will simply be forced to abandon its soft monetary policy.
Trading recommendations
Support levels: 130.34, 129.68, 129.98, 129.19, 129.04, 128.16
Resistance levels: 131.58, 132.95, 133.23
From the technical point of view, the medium-term trend on the currency pair USD/JPY is bullish. The price is trading at the level of moving averages. Above the level of 131.58, a false breakout area was formed, which is now acting as resistance. The MACD indicator has become inactive. It is better to look for buy deals from the support level of 130.34 or 129.68, but only with confirmation on the lower time frames. Sell deals can be sought from the resistance level of 131.59, but it is also better with confirmation.
Alternative scenario: If the price fixes below the support level of 128.16, the downtrend will be renewed with a high probability.
There is no news feed for today.
The USD/CAD currency pair
Technical indicators of the currency pair:
Prev Open: 1.3386
Prev Close: 1.3446
% chg. over the last day: +0.35 %
Oil prices rose yesterday due to supply chain problems in Turkey because of the earthquake. In addition, the inventory data from the American Petroleum Institute (API) showed a 2.18 million barrels decline instead of a projected increase of the same amount. The Canadian dollar is a commodity currency, so rising oil prices help to strengthen the Canadian currency. However, it is always worth keeping in mind that an excessive rise in oil prices may increase inflation again.
From the point of view of technical analysis, the trend on the USD/CAD currency pair is bullish. The price is forming a wide-volatile sideways trend. The MACD indicator is positive again. Sell deals should be considered from the resistance level of 1.3442 but on the condition of a false breakout, as the level has already been tested. Buy trades can be considered from the support of 1.3385 or 1.3333, but with additional confirmation in the form of an impulse initiative.
Alternative scenario: if the price breaks down and consolidates below the support level of 1.3263, the downtrend will likely resume.
This article reflects a personal opinion and should not be interpreted as an investment advice, and/or offer, and/or a persistent request for carrying out financial transactions, and/or a guarantee, and/or a forecast of future events.
Australia’s cash rate has hit 3.35%, after the Reserve Bank raised interest rates for the ninth time in a row – and signalled more interest rate pain ahead. The 0.25 percentage point rise adds A$90 a month to a $600,000 variable mortgage.
Ahead of Tuesday’s statement from the Reserve Bank board, there was talk of just one more 0.25 point rate hike this year.
That was the view of traders in the money market, who had priced loans on the basis that the bank’s cash rate would climb just 0.35 points further after being lifted to 3.35% on Tuesday, before plateauing and then falling.
No longer. The statement released after Tuesday’s board meeting included this carefully-considered plural:
The Board expects that further increases in interest rates will be needed over the months ahead to ensure that inflation returns to target and that this period of high inflation is only temporary.
The reference was to “increases”, not an “increase”, and to those increases in the months ahead, implying (at least) two more increases within months.
Within minutes, traders adjusted their prices to a peak in the cash rate of 3.9%, rather than 3.7% – which coincidentally was around the average forecast of participants in The Conversation’s economic survey at the start of the week.
The bank is lifting rates even though it thinks inflation is heading down.
In a preview of its full set of forecasts to be released on Friday, it said it expected inflation to slide from its present 7.8% to 4.74% by the end of this year, and to around 3% by mid-2025, which is also in line with the forecasts of the Conversation’s panel.
The steam is coming out of inflation partly because of interest rate hikes here and overseas, and partly because the global effects of Russia’s invasion of Ukraine are fading.
US Federal Reserve Chair Jerome Powell. EPA
Last Wednesday, the head of the US Federal Reserve Jerome Powell (the equivalent of Australia’s Reserve Bank Governor Philip Lowe) began talking about “disinflation”.
“We can now say, I think for the first time, that the disinflationary process has started,” he told a press conference, and to underline the point he used the word “disinflation” ten more times in 44 minutes.
US inflation has been falling since the middle of last year, from a peak of 9.1% in June to 6.5% in December.
Powell says inflation is falling mainly because the global shortages of goods and commodities caused by Russia’s invasion of Ukraine have been “fixed”.
But inflation is also falling because of the work Powell has done. In the US, the Federal Funds rate (similar to our Reserve Bank cash rate) has climbed from something near zero to 4.5% in the space of a year, denting consumer spending.
Disinflation abroad, weak wage pressure at home
In Australia, figures released by the Bureau of Statistics on Monday show spending fell in the three months to December – not in absolute dollar terms, because December is always a big month, but compared to what would have been expected given the end of the year.
Continuing to hold up inflation in the US and in the UK – but not in Australia – has been very high wages growth. Higher prices have become baked into higher wages, which have been fed into higher prices, which have in turn fed back into higher wages.
Not here. Whereas in the US and the UK wage growth has topped 6%, here it is officially 3.1% – way below what would be needed to hold up inflation.
In part, we’ve a former Labor government to thank for the absence of a wage-price spiral.
Prime Minister Paul Keating steered Australia toward enterprise bargaining at the start of the 1990s, locking many of us into wage agreements that are only struck once every three or so years, and are unable to respond quickly to prices.
So why is the Reserve Bank determined to whack inflation further, rather than watch it slowly die?
Perhaps to send a message that it is really, really serious, and that it is not a good idea to get relaxed about spending, thinking the worst will soon be over.
Bleak times ahead
Between the lines though, the bank is hinting it’s likely to soon ease off.
Its statement says rate increases affect the economy “with a lag” and that Australians on fixed-rate mortgages have yet to feel the full effect of the cumulative increases since May.
The bank’s assessment of the economy after the increases are over is bleak.
It says it expects GDP growth to slow to only 1.5% during 2023 and 2024, which is an even more dismal forecast than the International Monetary Fund’s, which has economic growth of just 1.6% this year, climbing to a historically-low 2.2% by 2026. The Conversation’s forecasters expect 1.7%, climbing to 2.5%.
The RBA’s forecast would mean income per person barely increases for years to come (although the unemployment rate would stay below 5%), a condition that before COVID was known as secular stagnation.
This would mean the economic resources Australian governments needs to provide the services we’re likely to need (such as to get to net zero emissions, and to deal with climate change) are going to be harder to come by.
It’s what Treasurer Jim Chalmers intends to spend much of 2023 readying us for.
Later this month Chalmers will release a revamped tax expenditures statement, setting out the scope to wind back tax breaks, including those for profits made selling high-end family homes. That’s something Chalmers says he isn’t considering, but which the IMF has recommended.
And then later in the year, he will release the first intergenerational report to properly spell out the financial costs of climate change – right through to 2063.
On Wednesday, many Federal Reserve officials stressed the need for further rate hikes because of concerns that a strong labor market could pave the way for inflation. As the stock market closed Wednesday, the Dow Jones Index (US30) decreased by 0.61%, and the S&P 500 Index (US500) lost 1.11%. The NASDAQ Technology Index (US100) fell by 1.68%.
Federal Reserve representative Christopher Waller said Wednesday that the fight to lower inflation might be long, and a longer-term interest rate hike may be needed.
Google held an event to launch its new “Bard” artificial intelligence chatbot, but the AI chatbot reportedly gave inaccurate answers just before the event. The decline in Google’s quotes pulled the entire tech sector with it. In response to the glitch, Google said it would use external feedback and its own testing to ensure that Bard’s answers met the high bar for quality, safety, and validity of real-world information.
Uber Technologies Inc (UBER) had an outstanding performance, closing up more than 5% after the company reported unexpected fourth-quarter earnings and optimistic forecasts.
Equity markets in Europe traded yesterday without a single dynamic. Germany’s DAX (DE30) gained 0.60%, France’s CAC 40 (FR40) fell by 0.18%, Spain’s IBEX 35 index (ES35) added 0.67%, Britain’s FTSE 100 (UK100) closed up by 0.26% on Wednesday.
According to Governing Council spokesman Martins Kazaks, the European Central Bank should raise interest rates to levels that would “significantly” limit the economy. The head of Lithuania’s central bank also added that investors should pay attention to comments made by President Christine Lagarde, who promised that the ECB would “stay the course” to return inflation to its medium-term target of 2%. At the same time, the politician believes there is no reason to pause or stop rate hikes after March’s 0.5% rate hike.
The FTSE 100 reached a new all-time high, boosted by optimistic reports from oil giants BP and Shell for the fourth quarter of 2022 and new optimism about the Fed’s short-term reversal. The British company Barratt developments reported a +15.9% rise in profit for the half-year, and the National Institute of Economic and Social Research (NIESR) added positive sentiment suggesting that the UK may be able to avoid a major recession.
Oil prices rose yesterday, mainly due to supply chain problems in Turkey caused by the earthquake. In addition, inventory data from the American Petroleum Institute (API) showed a deterioration of -2.18 million barrels rather than an increase of a similar amount.
Asian markets also traded flat yesterday. Japan’s Nikkei 225 (JP225) decreased by 0.29%, China’s FTSE China A50 (CHA50) lost 0.41%, Hong Kong’s Hang Seng (HK50) ended the day down by 0.07%, India’s NIFTY 50 (IND50) increased by 0.85%, and Australia’s S&P/ASX 200 (AU200) ended the day up by 0.35%.
The five-year term of the head of the Bank of Japan, Mr. Kuroda, expires on April 8, and the choice of his successor will probably affect how quickly the Bank of Japan will be able to phase out the stimulus. Government nominees are due to be submitted to parliament at the end of this month. Earlier this week, it was reported that the Japanese government had approached Bank of Japan Deputy Governor Masayoshi Amamiya about the possibility of replacing current Governor Haruhiko Kuroda. Among other candidates, Hiroshi Nakaso, the former deputy governor of the Bank of Japan, who has international experience, speaks fluent English, and has close contacts with foreign central banks, is widely considered. Amamiya, like Kuroda, is a fan of soft monetary policy, while Nakaso is considered a more “hawkish” candidate who can lead the Bank of Japan down the path of policy normalization.
S&P 500 (F) (US500) 4,117.86 −46.14 (−1.11%)
Dow Jones (US30) 33,949.01 −207.68 (−0.61%)
DAX (DE40) 15,412.05 +91.17 (+0.60%)
FTSE 100 (UK100) 7,885.17 +20.46 (+0.26%)
USD Index 103.39 +0.06 (+0.06%)
Important events for today:
– German Consumer Price Index at 09:00 (GMT+2);
– UK Monetary Policy Report Hearings at 11:45 (GMT+2);
– Eurozone Economic Forecasts (m/m) at 12:00 (GMT+2);
– US Initial Jobless Claims (w/w) at 15:30 (GMT+2);
This article reflects a personal opinion and should not be interpreted as an investment advice, and/or offer, and/or a persistent request for carrying out financial transactions, and/or a guarantee, and/or a forecast of future events.
Comments made Tuesday by the Federal Reserve’s Chair are likely to “kick start a year of important opportunities” for global investors, predicts the CEO and founder of one of the world’s largest independent financial advisory, asset management and fintech organizations.
The bullish prediction from deVere Group’s Nigel Green comes after Jerome Powell delivered his first remarks after Friday’s “extraordinarily strong” U.S. jobs report which, according to the central bank, shows it has more work to do to tame inflation.
Powell was speaking during a question-and-answer session with David Rubenstein of the Economic Club of Washington.
“We didn’t expect it to be this strong,” he said of the January jobs report, which found that 517,000 jobs had been added to the U.S. economy. “It kind of shows you why we think that this will be a process that takes a significant period of time.”
Of the comments, the deVere CEO says: “Of course, investors hang off every word of the Chair of the central bank of the world’s largest economy.
“So, naturally, when Jerome Powell said ‘the disinflationary process has begun’, markets jumped — despite him also adding notes of caution.
“It would have also not gone noticed by investors that when pushed a little, Powell didn’t use the opportunity to adopt a more hawkish tone.”
After the comments, all major Wall Street indices were trading up. The S&P 500 went up 0.5%, while the Nasdaq Composite gained 0.8%; meanwhile, the Dow Jones was up about 38 points, pushing back on an earlier loss of 186 points.
Nigel Green continues: “We expect that the Fed believing that ‘significant’ declines in inflation will occur this year is likely to kick start a year of important opportunities for global investors.
“2022 was an extremely challenging year for investors, many of whom were caught spectacularly off-guard by not having properly diversified portfolios, which left them open to untold financial risks.
“Looking ahead to the rest of 2023, it is likely that investment headwinds will exceed the tailwinds – thanks to considerably more favourable market conditions driven by inflation peaking and China’s reopening, amongst other factors.
“As we move into an era of peaked inflation, it’s crucial that investors ensure their portfolios are suitably diversified across asset classes, sectors, currencies and regions, so as to make the most of the considerable opportunities that will inevitably present themselves.”
Technology stocks led the gains Tuesday on Powell’s comments.
Last week, as big tech firms posted earnings reports, the deVere chief executive noted: “As market environments shifted in 2022, investors dumped growth stocks, like tech, in favour of value stocks which were deemed more suitable to the challenging landscape,” he observed.
“But what is happening now, we believe, is the beginning of a rebound. Tech stocks are back. Rotation into the right growth stocks will provide strong returns.”
He cited two key reasons why he believes the big tech reports heralded the start of The Great Rotation back to growth stocks.
First, valuations of tech and other growth stocks are currently low, having been hit by the previous rotation into value stocks. Investors are now eyeing these attractive entry points to top up their portfolios as the trend is reversing.
And second, inflation has seemingly peaked, and interest rates are set to stabilise, which takes away a major obstacle for tech stocks.
“Powell’s comments about the disinflationary process having begun will now dominate investors’ mindsets in 2023 as they seek to create and build wealth after a difficult 2022,” concludes Nigel Green.
“They will be positioning their portfolios to take advantage of improving market conditions in order not to miss out on opportunities.”
About:
deVere Group is one of the world’s largest independent advisors of specialist global financial solutions to international, local mass affluent, and high-net-worth clients. It has a network of more than 70 offices across the world, over 80,000 clients and $12bn under advisement
The BTC has reached 23,204 USD. The pause was not a lengthy one. The so-called fear & greed index confirmed this as well. The index entered the greed field and gives signals that investors are ready to buy. The market absolutely needs to hold above 23,000 USD. If so, it will have a serious chance for reaching 23,500 and 25,000 USD.
Correlation between the BTC at one side and the S&P 500 and Nasdaq indices at the other remains extremely high. Good moods of American investors support digital activity.
By now, the capitalisation of the crypto market has reached 1.086 trillion USD, while it has just seemed that a trillion is so far away. The share of the BTC has shrunk to 41.2%, and the ETH takes up 18.9%.
MicroStrategy will be selling futures on BTC
The MicroStrategy tech company announced it was going to trade futures on the BTC. Previously, the business left aside the idea to loan its own crypto via third-party platforms because of multiple risks. Now the company is considering cooperation with CME Group.
US National Football League decided against partnerships with crypto sponsors
After the story with the FTX exchange, the US NFL decided against being sponsored by crypto sector institutions. For the upcoming LVII Supercup, 1.88 billion USD were collected, but none of the sponsors were connected to the crypto market. The NFL management thinks that there is no trustu to the crypto sector.
Attention! Forecasts presented in this section only reflect the author’s private opinion and should not be considered as guidance for trading. RoboForex LP bears no responsibility for trading results based on trading recommendations described in these analytical reviews.
On H4, the pair has formed an Engulfing reversal pattern. The instrument is now going by the pattern in a descending wave. The goal of the decline might be 1.3300; then the price may break through the support level and continue the downtrend. However, the price may pull back to 1.3430 before falling.
AUDUSD, “Australian Dollar vs US Dollar”
On H4, the pair has formed a Hammer reversal pattern. The instrument is now going by the signal in an ascending wave. The goal of the growth might be 0.7070. Upon testing the resistance level, the quotes might break through it and continue growing. However, the price may pull back to 0.6925 and continue the uptrend after the correction.
USDCHF, “US Dollar vs Swiss Franc”
On H4, at the resistance level, the pair has formed a Hanging Man reversal pattern. The instrument is now going by the signal in a descending wave. The goal of the decline might be 0.9155. Upon testing the support level, the pair might break through it and continue developing the downtrend. However, the price may pull back to 0.9250 before declining.
Attention! Forecasts presented in this section only reflect the author’s private opinion and should not be considered as guidance for trading. RoboForex LP bears no responsibility for trading results based on trading recommendations described in these analytical reviews.
On Tuesday, Federal Reserve Chairman Jerome Powell reiterated that inflation is slowing but reaffirmed the need for it to continue rising. Morgan Stanley predicts that the US Federal Reserve will end its tightening cycle at the May meeting at 5.00-5.25%, after which it will take a long pause. According to the Fed’s rate monitoring tool, expectations of a rate hike in March are almost entirely factored into prices, while the probability of a rate hike in May jumped from 38% to 69%.
The trend on the EUR/USD currency pair on the hourly time frame is bearish. Yesterday the price formed a false breakdown zone, which can now act as a support zone. The MACD indicator is in the negative zone, but sellers’ pressure is weak. Under such market conditions, buy trades are better to be considered from the support level of 1.0710. Sell deals can be considered from the resistance level of 1.0838, but better with confirmation in the form of reverse initiative.
Alternative scenario: if the price breaks down through the resistance level of 1.0967 and fixes above it, the uptrend will likely resume.
News feed for 2023.02.8:
– US FOMC Member Williams Speaks at 16:15 (GMT+2);
– US FOMC Member Waller Speaks at 20:45 (GMT+2).
The GBP/USD currency pair
Technical indicators of the currency pair:
Prev Open: 1.2020
Prev Close: 1.2047
% chg. over the last day: +0.22 %
Friday’s US jobs report continues to support the dollar index and, in turn, limits GBP/USD quotes recovery attempts. Market participants estimate a higher Fed peak rate for 2023 than the Bank of England (BoE). Given the problems in the UK economy, the Bank of England is much closer to completing its rate hike cycle. The Bank of England will likely hold another 0.25% hike at its next meeting, but that will not narrow the interest rate differential between the BoE and the US Fed, which is negative for the pound.
Trading recommendations
Support levels: 1.2000, 1.1930
Resistance levels: 1.2147, 1.2202, 1.2311, 1.2416
From the technical point of view, the trend on the GBP/USD currency pair on the hourly time frame is bearish. The price is trading at the level of the moving averages. A false breakdown zone was formed below the level of 1.2000. The MACD indicator has become positive. Under such market conditions, it is better to look for buy deals on intraday time frames from the support level of 1.2000, but with confirmation in the form of reverse initiative. It is best to look for sell trades after the pullback, as the price has deviated strongly from the moving averages. The best resistance levels are 1.2147 and 1.2202, but it is also better with a confirmation in the form of the reverse initiative.
Alternative scenario: if the price breaks out through the 1.2416 resistance level and fixes above it, the uptrend will likely resume.
There is no news feed for today.
The USD/JPY currency pair
Technical indicators of the currency pair:
Prev Open: 132.63
Prev Close: 131.07
% chg. over the last day: -1.19 %
Solid payroll data has once again sparked rumors that the Bank of Japan might reconsider its ultra-soft monetary policy after all. Even though it is just a rumor, the Japanese Yen managed to appreciate slightly against the dollar. A lot will depend on who becomes the next governor of the Bank of Japan. A more hawkish politician might reverse the trend in the USD/JPY currency pair, while a more dovish candidate who will continue with the current soft monetary policy will lead to even more weakness in the Japanese currency as the interest rate differential between the Bank of Japan and the US Fed continues to widen.
Trading recommendations
Support levels: 130.34, 129.98, 129.19, 129.04, 128.16
Resistance levels: 131.58, 132.95, 133.23
From the technical point of view, the medium-term trend on the currency pair USD/JPY is bullish. The price has corrected to the “discount” area but hasn’t reached the support level, which is why one more decrease in quotes is possible. The MACD indicator has become negative. It is better to look for buy deals from the support level of 130.34, but only with confirmation on the lower time frames. Sell deals can be searched from the resistance level of 131.59, but it is also better with confirmation.
Alternative scenario: If the price fixes below the support level of 128.16, the downtrend will be renewed with a high probability.
There is no news feed for today.
The USD/CAD currency pair
Technical indicators of the currency pair:
Prev Open: 1.3444
Prev Close: 1.3397
% chg. over the last day: -0.35 %
Just two weeks ago, when the Bank of Canada raised its interest rate, analysts were certain that this was the last rate hike. But yesterday, the BoC head dispelled those predictions, pointing out that it was too early to think about lowering rates, and it was not entirely clear if the Bank of Canada had raised rates enough. The Canadian dollar strengthened yesterday on the back of a 4% rise in oil prices. Oil prices were supported by continuing bets on consumption growth in China, as well as the fact that all operations at the Turkish oil export terminal with a capacity of 1 million barrels per day in Ceyhan were halted after a major earthquake. This terminal exports Azeris crude oil to international markets.
From the point of view of technical analysis, the trend on the USD/CAD currency pair is bullish. Yesterday the price formed a false break zone above the level of 1.3442, which will act as resistance. The MACD indicator has become negative, and there is slight seller pressure. Sell deals should be considered from the resistance of 1.3442 in case of a reversal in the intraday time frames since it has already been tested. Buy trades could be considered from the 1.3333 support level, but with additional confirmation in the form of an impulse initiative.
Alternative scenario: if the price breaks down and consolidates below the support level of 1.3263, the downtrend will likely resume.
This article reflects a personal opinion and should not be interpreted as an investment advice, and/or offer, and/or a persistent request for carrying out financial transactions, and/or a guarantee, and/or a forecast of future events.
The stock market yesterday was tossing from one side to the other, digesting comments of the head of the US Federal Reserve, Jerome Powell. As a result, Mr. Powell did not give any new clues. The Fed still sees the need for further rate hikes in the fight against inflation, which is likely to be protracted. As the stock market closed Tuesday, the Dow Jones index (US30) increased by 0.78%, and the S&P 500 Index (US500) added 1.29%. The NASDAQ Technology Index (US100) jumped by 1.90% yesterday.
According to the Fed’s rate monitoring tool, expectations for a rate hike in March are almost entirely factored into prices, while the probability of a rate hike in May jumped from 38% to 69%. The final rate is expected to be 5.00-5.25% in May, after which the central bank will take a long pause until the end of the year.
Microsoft Corporation (MSFT) and Alphabet Inc (GOOGL) are showing strong growth. An AI arms race has begun between the two technology heavyweights. One day after Google released its chatbot Bard, based on its LaMDA artificial intelligence, Microsoft held an event detailing plans to integrate ChatGPT into its Bing search engine as well as other products.
Equity markets in Europe traded yesterday without a single dynamic. German DAX (DE30) decreased by 0.16%, French CAC 40 (FR40) lost 0.07%, Spanish IBEX 35 (ES35) added 0.06%, and British FTSE 100 (UK100) increased by 0.36% on Tuesday.
The FTSE 100 index is nearing its first test of its recently formed all-time high on BP’s optimistic results. The London-based company posted record earnings of $27.7 billion in 2022, breaking its previous record of $26.2 billion. BP also announced an additional $2.75 billion in shares buybacks and plans to pay a dividend of 6.61 cents. Similarly, Shell, the largest company in the FTSE 100 index, benefited from higher energy prices and earned a record profit of $42 billion last year.
ECB spokeswoman Isabel Schnabel said yesterday that the slowdown in inflation in Europe is not yet due to ECB policy, with core inflation (excluding food and energy prices) remaining extremely high.
Yields on two-year UST (bonds), sensitive to interest rates, are slightly below the level last seen at the end of last year. Gold is inversely correlated to US government bond yields and the dollar index. Against the backdrop of further US Federal Reserve rate hike plans, higher UST yields are expected for a longer period of time, so it will be difficult for gold to regain its recent high levels.
Natural gas futures increased for a second straight day on Tuesday, adding just over 5% thanks to forecasts of cooler temperatures in the coming weeks. But analysts believe this is a temporary bounce and a new bottom is yet to come because storage levels are 9.4% higher than a year ago, and production has reached near-record levels of about 100 billion cubic feet a day, which has significantly weakened the fundamental outlook for gas.
Asian markets also traded without a single trend yesterday. Japan’s Nikkei 225 (JP225) decreased by 0.03% yesterday, China’s FTSE China A50 (CHA50) fell by 0.14%, Hong Kong’s Hang Seng (HK50) ended the day up by 0.36%, India’s NIFTY 50 (IND50) lost 0.24%, and Australia’s S&P/ASX 200 (AU200) ended the day down by 0.46%.
The Australian dollar rose sharply after the RBA raised its interest rate target to 3.35% from 3.10%. The acceleration in the Consumer Price Index caused some concern among bank officials. The RBA’s accompanying statement said that the board expects that further interest rate increases will be needed in the coming months to ensure that inflation returns to target levels and that this period of high inflation is only temporary. The futures market is starting to lean toward another potential 25 bps hike in March.
This article reflects a personal opinion and should not be interpreted as an investment advice, and/or offer, and/or a persistent request for carrying out financial transactions, and/or a guarantee, and/or a forecast of future events.
European markets flashed green on Wednesday, tracking gains in Wall Street overnight. A less hawkish than feared Jerome Powell injected global equity bulls with renewed confidence, propelling the S&P500 more than 1%. Stock markets also drew fresh support from positive earnings which boosted market sentiment and sweetened the risk appetite. In the currency space. The dollar slightly dipped thanks to Powell, providing some room for G10 currencies to fight back. Gold continues to linger around $1880 while oil prices stabilized after rising the most in three months.
Today, our focus will be directed toward the global equity and commodity space, especially US indices which remain reactive to rate hike expectations.
S&P 500 waits for catalyst
Despite rallying overnight, the S&P 500 remains in a range on the daily charts with support at 4100 and resistance at 4200. A breakout could be on the horizon with the correct fundamental spark. Should prices breach above 4200, the next key point of interest can be found at 4320. Alternatively, a breakdown below 4100 could signal a selloff towards 3950 – a level just above the 50 and 200-day SMA.
Nasdaq eyes 12800
Just like the S&P 500, the Nasdaq 100 jumped overnight with bulls eying 12800. Overall, the Index remains firmly bullish on the daily charts as there have been consistently higher highs and higher lows while the MACD trades above zero. A solid breakout and daily close above 12800 could inspire and incline towards 13150. Should prices slip back below 12400, the Nasdaq could sink back to the 200-day SMA around 11900.
FTSE 100 hits record highs!
The FTSE100 set fresh record highs this morning after risk appetite was boosted by the rally on Wall Street overnight. Prices are trading above the 50, 100, and 200-day SMA while the MACD trades above zero. The trend remains heavily bullish with the next key level of interest found at 8000. Alternatively, a move below the 7730 support level could signal a selloff towards 7620 and 7490, respectively.
STOX50 breakout…
After breaking above 4200, the STOX50 Index could be poised for further upside with 4380 acting as the next key level of interest. Prices remain bullish on the daily charts with the candlesticks trading firmly above the 50, 100, and 200-day SMA. It may be wise to keep a close eye on the RSI which is pointing to overbought levels. Should this lead to a decliner back below 4200, prices may slip back toward the 4105 support.
Gold
It’s been a shaky week for the precious metal with prices struggling to push back above $1880. Sustained weakness below this level may trigger a selloff towards the 50-day SMA and the next key level at $1825. A solid breakout above $1880 could see gold test $1900.


