It should come as no surprise to anyone that the big news item this week is that handlers for the 80-year-old U.S. President Joe Biden have been passing him “cheat sheets” with detailed instructions on how to conduct a White House press conference, complete with a full set of questions to be asked by the carefully-selected “audience” of reporters designed to float out a series of soft-coated questions whose responses have not only been scrutinized in advance by staff but time has been allocated for totally-scripted, rehearsed responses to be delivered in the guise of “off-the-cuff” repartee.
As I was watching Canadian Prime Minister Justin Trudeau denying media allegations about the forced COVID-19 vaccinations imposed upon the Canadian people causing the termination of employment for hundreds and hundreds of healthcare workers all in the name of “science,” I was reminded of the early days of the pandemic, where no politician barking orders to the Canadian electorate dared stand in front of a camera unless he/she had an array of health care “gurus” flanking them on either side, providing an “implied sanction” on the words being delivered on the efficacy of the “science” they were attempting to espouse.
Then, you have the famous FOMC press conferences where the same group of perhaps five honored members of the media led by CNBC’s Steve Leisman and the Wall Street Journal’s Nick Timiraos that consistently, without fail, deliver softball questions time after irritating time to Jay Powell then bragging about how their questions sent stocks soaring. Everywhere one turns, you run into crafted interviews and scripted press conferences, all designed to give the public the mistaken impression that our leaders — actually, our elected celebrities — are actors on a stage and little more.
Over the years, the blatant allocation of “pork” has escalated to a degree that politicians have become anesthetized to criticism such that public scrutiny is now deemed as, quite simply, the cost of doing business.
When I sit back and ruminate the pros and cons behind life in either a constitutional republic (U.S.A.) or a parliamentary democracy (Canada), I wind up running blindfolded in logistical circles in the middle of the room.
We were told from a very young age that we vote for politicians with character, resolve, love of country, and morality, but the process of achieving political power involves a very long series of chameleon-like metamorphoses by both voters and politicians.
The wide-eyed innocence of the idealistic political rookie and the first-time all-believing voter gets subverted from doing what is right into doing what is right “for me.” Politicians that are able to survive the wilderness of the political stump learn “The Art of Breaking Promises” while voters over the years grow to appreciate “The Wonders of Political Favour.”
Voters are today drawn to promises as opposed to ideals or policy positions while the baby-kissing crowd learns that the proliferation of promises is not unlike the nuclear arms race of the post-WWII period, where weaponry held by both the U.S. and the Soviet Union grew to multiple of what was required to vapourize each country.
In both the U.S. and Canada, parties in power enact policies designed to attract votes, and they know that there is no longer a need to keep such strategies in the closet, so to speak, because the term “pork barrel politics” has morphed into “container ship politics” as the price of re-election has skyrocketed thanks to a sharp-eyed (and well-trained) electorate.
Over the years, the blatant allocation of “pork” has escalated to a degree that politicians have become anesthetized to criticism such that public scrutiny is now deemed as, quite simply, the cost of doing business.
A Vicious Debt Spiral
Promising a new postal distribution center or a research facility to be paid for by public funding never runs the gauntlet of “How will we pay for it?” and instead simply falls under the purview of can-kicking, and therein lies the entire conundrum behind this vicious debt spiral.
Debt gets created because the electorate never gets hit with a sudden tax increase (which is political suicide for incumbents), and the political spenders can push repayment several decades out into the nebulae of time before it becomes a real-time concern.
So, if there are no governors to impose checks and balances on them governors, they will accede to our — the voters’ — demands and keep on spending wildly with money created by “keystroke ingenuity.” Sadly, that process has been ongoing for over four decades resulting in a global debt leviathan too large and unwieldy to ever be retired.
My children and grandchildren will need to sort out the ways and means to manage the upcoming fiscal crisis, and what they will determine is that blame must rest on the shoulders of the generation that created the crisis — the Babyboomers.
It is true that once the first nation defaults, the U.S. dollar will be caught up in a contagion, not unlike the 2020 pandemic.
The problem with that is that we Boomers were really quite visionary when we decided to create an irreversible tsunami of credit in much the same way that Stanley Kubrick’s brilliant “Dr. Strangelove (or How I Stopped Worrying and Grew to Love the Bomb)” depicted life in the Cold War ’60s where nuclear proliferation had gone berserk.
The lead character (Dr. Strangelove) created his personal doomsday machine that would annihilate all human life once the first bomb was dropped. The “first bomb dropping” in this allegory would be akin to the “first sovereign debt default,” where once set in motion, all counterparties (which is basically every nation on the planet) would be affected by the global debt contagion.
Nonetheless, it is true that once the first nation defaults, the U.S. dollar will be caught up in a contagion, not unlike the 2020 pandemic. No one is immune from a debt meltdown, and because the bulk of trade is conducted in the most heavily-leveraged currency in the world (and the one now known as the “global reserve currency”), the benefits of the Breton Woods Agreement, now a mere fragment of what it was once purported to provide, will transform itself from asset to liability in the stroke of a basis point.
A ‘Cheat Sheet’ Economy
We live in a “cheat sheet” economy where nothing is as it appears. Everything we read and hear, and watch emanates from one massive propaganda-generating “Thought Machine” that instructs us on diet, medicine, daily routine, sexuality, and morality, all delivered through the diabolical venue of technology.
All those futuristic movies from the 1960s and 1970s, like A Clockwork Orange and Soylent Green all had one recurring theme in that humanity was under strict control by a ruler or ruling class in what would certainly be a condemnation of authoritarian rule. In all aspects, authoritarian rule only works if one has a passive, compliant citizenry.
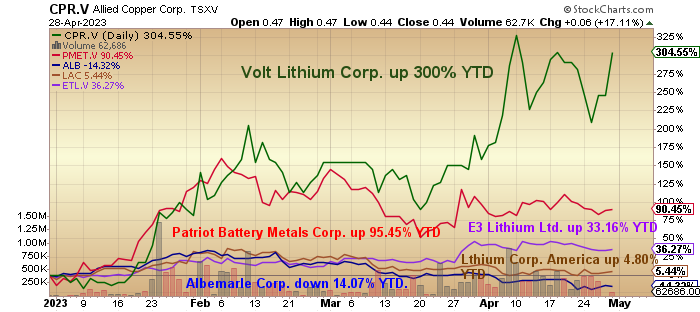
I have been adding to my holdings on recent weakness and consider Volt Lithium Corp. to be a “must-own” as the year progresses.
Whether it is food or drugs or government work programs, all measures designed to brainwash the populace into compliance and passivity are the function of an authoritarian state which is precisely why our leaders have teams of people managing their every traceable move, especially where cameras are present.
The politician’s image is now groomed and preened and preserved in all manners possible so that by election time, all distractions caused by ill-timed and unrehearsed replies to questions concerning policy have been swept away or prevented by way of cheat sheets.
All that remains are the promises seared into the memory banks of a well-targeted electorate as they enter the voting booth and pull the switch. It is an abomination and one which our founders would abhor.
Stocks
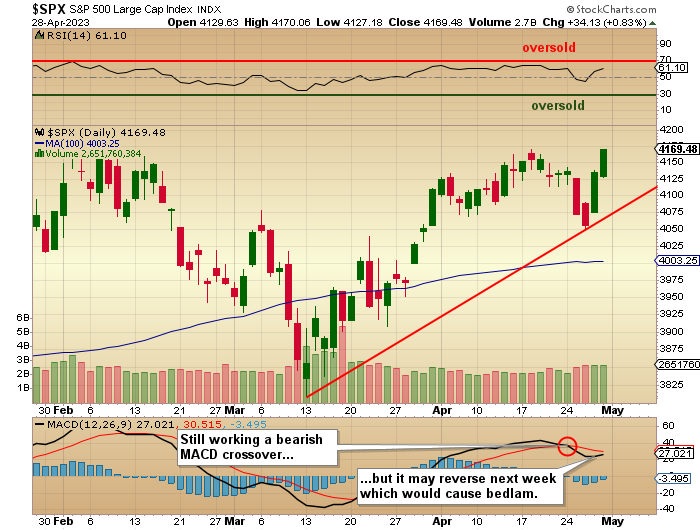
The U.S. economic data continues to both disappoint and confound, with the SPX still working a bearish MACD crossover from a few days back. These negative events have been effective harbingers since January 2022, and as I said last week, when it went bearish, it cannot override the bullish January Barometer, but it certainly can allow for a correction within the larger bullish major trend off what looks like the intermediate-term correction low of last October.
The sentiment is decidedly bearish, with the Twitterverse and the Blogosphere all rife with downbeat interviews with Ray Dalio or Stan Druckenmiller, but the most chilling is the current 3,200 target for the SPX by legendary Jeremy Grantham.
The contrast between what I get from the hard money crowd like Adam Taggart’s Wealtheon site and the CNBC party line is staggering, with the New Yorkers all strutting the bullish strut with tech stocks leading the charge, but the reality is that just a handful of stocks are leading the charge.
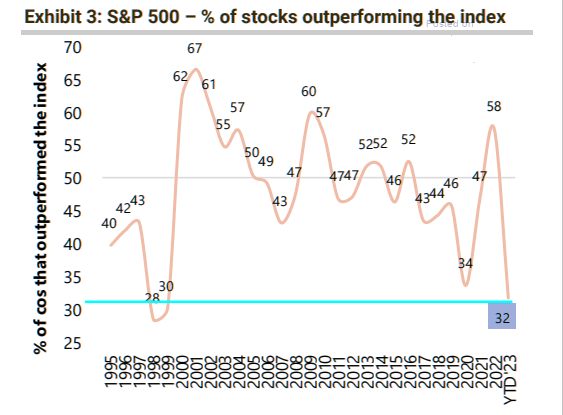
The last time market breadth was this weak was 1999 and 2019, and I remember 2019 and the aggravation that I went through because of the market’s inability to cave in. The Wall Street banks kept juicing the FANG stocks that held up the S&P sending the bears all scurrying for cover as squeeze after squeeze kept a chokehold on them.
Finally, it took the arrival of the pandemic to finally break the major trend, and down it all went until April when the Fed and the Treasury turned on the money spigots and flooded the world with cash.
Poor market breadth was a stalwart in the arsenal of another legendary market timer, Richard Russell, whose Proprietary Trend Index (“PTI”) focused heavily on the advance-decline figures over multiple time frames. I am currently a cautious bull but mindful of the need for keeping position sizes in check, as I will not bet against the MACD crossover of a few days ago.
I reduced position sizes as a result of the sell signal, but looking at the MACD tonight, another few days of strength like we had last week, and we could actually have a bullish MACD crossover. A bullish MACD reversal would be uncommon but not impossible, but if we do get one, there will be a wicked short squeeze setting up a potential blow-off top — or not.
One thing is without dispute: these are the toughest markets to trade that I have ever encountered, with a close resemblance to 2019.
Gold
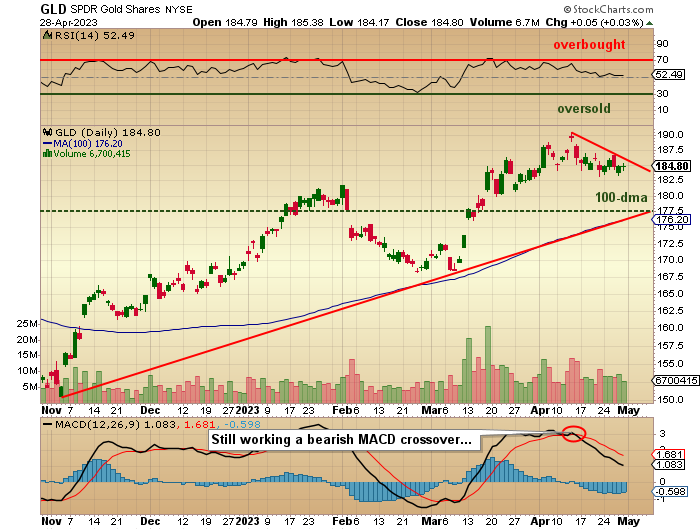
Gold is on “standby” right now and will be until next Wednesday when the FOMC statement on interest rates is announced, followed by the Jerome Powell press conference.
Until then, I see little to talk about other than once the U.S. dollar index breaks the 100 level, I see the potential for a waterfall decline to the low 90s, which should take gold (and silver) to new all-time highs with gold getting their by summer and silver later as we approach the fall. It is my hope and prayer that such a development kicks the junior gold miners in the backside and assists in eliminating the huge discount at which they trade.
GTCH is not alone, as many of the gold developers have the same problem attracting retail and institutional investors for some ungodly reason, unlike lithium, which continues to be the darling of the battery metals space.
They are now in pilot plant production, with the upcoming maiden resource estimate being eagerly awaited, as well as the results from the first large-scale volume of brines currently being processed. The Pro-forma, which assumes that bench test results are duplicated at the pilot plant operations, estimated over US$35 million of after-tax earnings by the end of June 2024.
So assuming no further dilution, that would put the per-share earnings number at US$0.2644.
It is my assertion that early evidence of recoverability rates for lithium carbonate and lithium hydroxide would result in a sharp rerating of VLT:TSV and move it quickly onto institutional radar screens.
At a US$32.9m market cap, it is more than fairly priced, and a look at performance relative to its peers is impressive.
I have been adding to my holdings on recent weakness and consider Volt Lithium Corp. to be a “must-own” as the year progresses.
This letter makes no guarantee or warranty on the accuracy or completeness of the data provided. Nothing contained herein is intended or shall be deemed to be investment advice, implied or otherwise. This letter represents my views and replicates trades that I am making but nothing more than that. Always consult your registered advisor to assist you with your investments. I accept no liability for any loss arising from the use of the data contained on this letter. Options and junior mining stocks contain a high level of risk that may result in the loss of part or all invested capital and therefore are suitable for experienced and professional investors and traders only. One should be familiar with the risks involved in junior mining and options trading and we recommend consulting a financial adviser if you feel you do not understand the risks involved.
1) Michael J. Ballanger: I, or members of my immediate household or family, own securities of the following companies mentioned in this article: Allied Copper Corp./Volt Lithium Corp. and Getchell Gold Corp. I personally am, or members of my immediate household or family are, paid by the following companies mentioned in this article: None.
2) The following companies mentioned in this article are billboard sponsors of Streetwise Reports: None. Click here for important disclosures about sponsor fees. As of the date of this article, an affiliate of Streetwise Reports has a consulting relationship with: None. Please click here for more information.
3) Statements and opinions expressed are the opinions of the author and not of Streetwise Reports or its officers. The author is wholly responsible for the validity of the statements. The author was not paid by Streetwise Reports for this article. Streetwise Reports was not paid by the author to publish or syndicate this article. Streetwise Reports requires contributing authors to disclose any shareholdings in, or economic relationships with, companies that they write about. Streetwise Reports relies upon the authors to accurately provide this information and Streetwise Reports has no means of verifying its accuracy.
4) This article does not constitute investment advice. Each reader is encouraged to consult with his or her individual financial professional and any action a reader takes as a result of information presented here is his or her own responsibility. By opening this page, each reader accepts and agrees to Streetwise Reports’ terms of use and full legal disclaimer. This article is not a solicitation for investment. Streetwise Reports does not render general or specific investment advice and the information on Streetwise Reports should not be considered a recommendation to buy or sell any security. Streetwise Reports does not endorse or recommend the business, products, services or securities of any company mentioned on Streetwise Reports.
5) From time to time, Streetwise Reports LLC and its directors, officers, employees or members of their families, as well as persons interviewed for articles and interviews on the site, may have a long or short position in securities mentioned. Directors, officers, employees or members of their immediate families are prohibited from making purchases and/or sales of those securities in the open market or otherwise from the time of the decision to publish an article until three business days after the publication of the article. The foregoing prohibition does not apply to articles that in substance only restate previously published company releases. As of the date of this article, officers and/or employees of Streetwise Reports LLC (including members of their household) own securities of Allied Copper Corp./Volt Lithium Corp. and Getchell Gold Corp., companies mentioned in this article.