
By RoboForex Analytical Department
The EUR/USD currency pair is starting the new week of April balanced, hovering around 1.0900. Market activity was slowed down during the Easter holidays in the US and Europe, but investors are gradually returning to trades.
Last Friday, the US labor market statistics were released, and while they came out almost unnoticed, market participants will have a chance to account for the data in the quotes later. The unemployment rate in March saw a decrease to 3.5%, which was better than expected. Nonfarm payrolls (NFP) rose by 236 thousand against the forecasted 228 thousand and 326 thousand previously. The data from February were revised and came out better, which is a positive signal. The average hourly wage also grew by a stable 0.3% m/m.
Although for now, the risk that the economy could slow down has not found any reflection in the employment sector, this margin of safety is unlikely to last long.
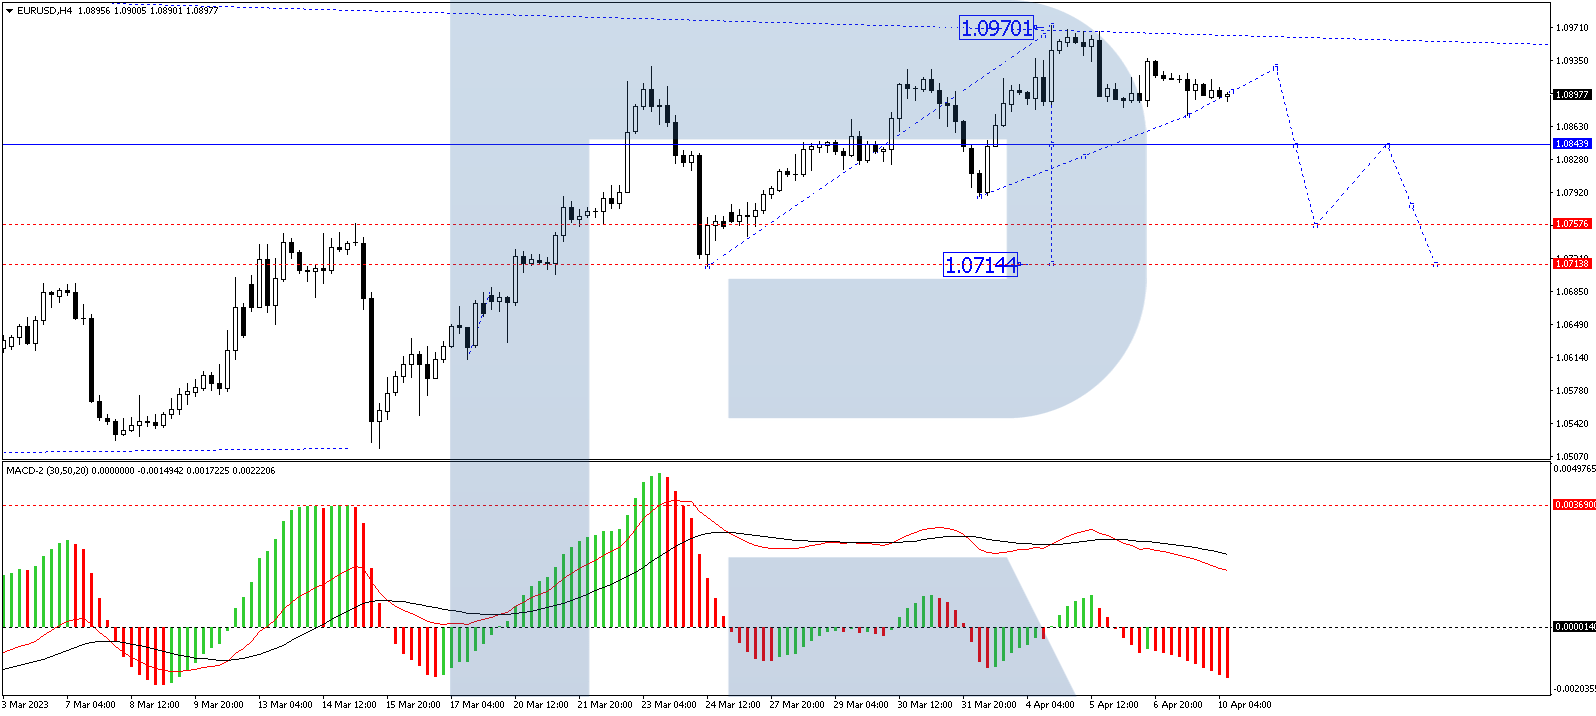
On the H4 chart, the EUR/USD currency pair has performed an impulse of decline to 1.0875. Currently, the market is forming a consolidation range under this level. There is a possibility of growth to 1.0930, followed by a decline to 1.0760, from where the wave could continue to 1.0720. Technically, this scenario is confirmed by the MACD indicator, which shows that its signal line is above the zero mark and directed strictly down to renew the lows.
Free Reports:
 Download Our Metatrader 4 Indicators – Put Our Free MetaTrader 4 Custom Indicators on your charts when you join our Weekly Newsletter
 Get our Weekly Commitment of Traders Reports - See where the biggest traders (Hedge Funds and Commercial Hedgers) are positioned in the futures markets on a weekly basis.
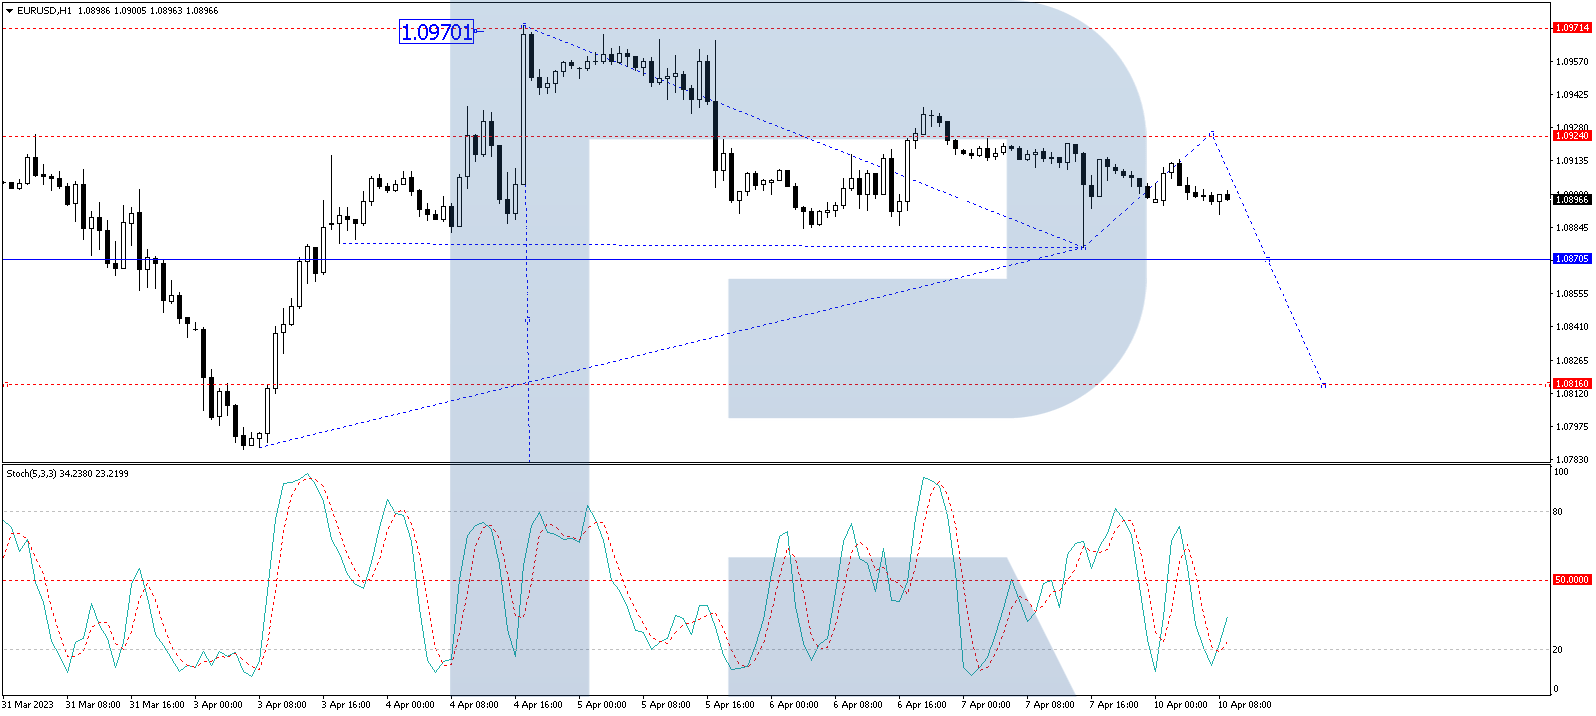
On the H1 chart, the EUR/USD currency pair has completed a structure of the declining wave to 1.0875. At the moment, a consolidation range is forming above this level. The price could break the range upwards and correct to 1.0924. Then, a decline to 1.0820 could follow, with the target being local. This scenario is technically confirmed by the Stochastic oscillator, which shows that its signal line is near 50, expected to grow to 80, and then drop to 20.
Disclaimer
Any forecasts contained herein are based on the author’s particular opinion. This analysis may not be treated as trading advice. RoboForex bears no responsibility for trading results based on trading recommendations and reviews contained herein.

- COT Metals Charts: Weekly Speculator Bets led by Copper & Steel Jul 18, 2026
- COT Bonds Charts: Weekly Speculator Bets led by 2-Year, SOFR 3M & 5-Year Bonds Jul 18, 2026
- COT Energy Charts: Weekly Speculator Bets led by Brent Oil & Heating Oil Jul 18, 2026
- COT Soft Commodities Charts: Weekly Speculator Bets led by Wheat, Corn & Soybean Meal Jul 18, 2026
- The Bank of Canada kept its interest rate unchanged. Platinum prices reached a three‑week high Jul 16, 2026
- Stock indices rose after the release of US inflation data. China’s GDP slowed sharply Jul 15, 2026
- GBP/USD Awaits Political News: What Will Happen Next Jul 15, 2026
- USD/JPY Holds at Highs: Pressure Lingers on Yen Jul 14, 2026
- Oil prices jumped 4% amid a new wave of escalation between the US and Iran Jul 13, 2026
- EUR/USD: US Inflation Will Determine Everything Jul 13, 2026
