Source: Streetwise Reports (7/12/24)
We explain carbon credits, cover some of the system’s inherent problems, discuss future market growth and highlight some carbon credit streaming companies working hard to operate transparently.
Last year, scrutiny of the carbon credits/offsets market rose with media exposés on unethical carbon projects and system abuses. Despite issues with the system and harsh criticisms, the market is reportedly gaining traction.
Forecasts call for rapid growth over the next decade due to efforts by countries around the world to reach a net zero carbon status in the foreseeable future.
A Quick Primer
Carbon credits were introduced in 1997 as a way to lower carbon dioxide (CO2) emissions. Today, their purpose goes further, to help speed up decarbonization by offsetting global emissions.
“We are in a climate emergency, and we need every tool in the box to meet the 1.5 degrees C [global warming] target,” said Annette Nazareth, council chair of the Integrity Council for the Voluntary Carbon Market. “High-integrity carbon credits can mobilize private finance at scale for projects to reduce and remove billions of tons of emissions that would not otherwise be viable.”
Carbon credits allow a company or entity to emit CO2 or other greenhouse gases, specifically one ton of either per credit, according to Investopedia. Though these credits are akin to rations, companies earn them by avoiding, reducing, or removing carbon through a project verified by an independent third party.
As explained by Carbon Direct, “Carbon avoidance is an action that prevents a carbon-emitting activity from happening. Carbon reduction is an action that decreases the amount of greenhouse gas emissions compared to prior practices. Carbon removal is the process of removing carbon dioxide from the atmosphere and locking it away for decades, centuries, or millennia.”
After a project is verified, the company behind it receives the credits. Companies may either use, trade, or sell their credits.
Carbon Cowboys
While the concept is lofty, the carbon credit system has inherent problems. This has dampened companies’ confidence in it, which is reflected in the decrease in traded carbon credits in 2023, reported the Center for Strategic and International Studies.
The world learned about one major abuse in 2006, when Gustav Daphne and three coconspirators were arrested for stealing €5−10 billion (€5−10B) from the European Union’s carbon emissions trading system, meant to facilitate transactions between member countries, according to an article by The Guardian. The scammers achieved “the fraud of the century,” the media called it, in just months, by exploiting a loophole in the market’s policy.
According to MIT News, “Several experts at the Massachusetts Institute of Technology (MIT) now say that the system could be effective.”
The case of the Kariba REDD+ project in Zimbabwe illustrates two additional issues with carbon credit systems: a lack of transparency and accountability in where revenues from carbon-offsetting projects go and a lack of checks and balances in the verification process.
The Kariba project promised to conserve vast forest areas to sequester carbon and pass on benefits to the community by, for instance, investing in infrastructure and job creation. Reportedly, an independent third party verified the project, and it generated more than €100 million (€100M) from sales of carbon credits to Western companies. Yet only €14M of the proceeds went to the local villages, The Guardian reported. The other €86M went to the project broker/lead and local coordinator for costs and profits.
This very scheme has happened enough around the world, primarily in developing countries, that there is a name for groups involved in nature-based carbon markets just to make money from trading carbon: “carbon cowboys.” Like with Kariba, questions linger about the integrity and value of many projects.
Critics argue that forest carbon schemes often benefit international traders over local communities. More broadly, opponents of carbon credits/offsets claim they do not work and, sometimes, the associated projects harm the planet.
“Scientific studies and investigative have found that a growing number of projects failed to deliver the emission reductions promised,” reported Climate Home News on May 29. “Nongovernmental organizations have also denounced instances of human rights abuse and environmental damage caused by carbon-offsetting activities.”
Notable Growth Projected
Despite the controversy, the carbon credit/offset market is forecasted to skyrocket between 2023 and 2028 at a compound annual growth rate (CAGR) of 31%, according to Market and Markets, even with the expectation that transparency and traceability will hamper its growth. By 2028, the market is projected to reach US$414.8B in value, more than 250 times the US$1.6B it was in 2023. The primary growth driver will continue to be the massive global effort to reach net zero carbon targets.
CarbonCredits.com highlighted Carbon Streaming Corp. as one of its Top 4 Carbon Stocks To Watch in 2024. The company, the first of its kind in the carbon credit market.
“Rising environmental concerns and government support are expected to offer lucrative opportunities for the market players in the next five years,” the report said.
Demand for voluntary carbon markets (VCMs), marketplaces in which entities may buy, sell, or trade carbon credits, is growing. Thus, the voluntary carbon credit market is projected to expand at a 27% CAGR between 2024 and 2032, according to Global Market Insights. During this period, the market value is forecasted to reach US$21.7B, up from US$2.4B.
In the U.S. in May, the Departments of Treasury, Agriculture, and Energy and White House representatives published a joint policy statement that laid out seven principles for responsibly participating in VCMs and ensuring they are effective, fair, and equitable, noted a White House fact sheet.
Carbon Streaming Isn’t Over
While bad actors may have previously polluted the carbon credit market, there are companies striving to operate transparently, and some experts consider the system worth looking into.
According to MIT News, “Several experts at the Massachusetts Institute of Technology (MIT) now say that the system could be effective, at least in certain circumstances, but it must be thoroughly evaluated and regulated.”
Base Carbon
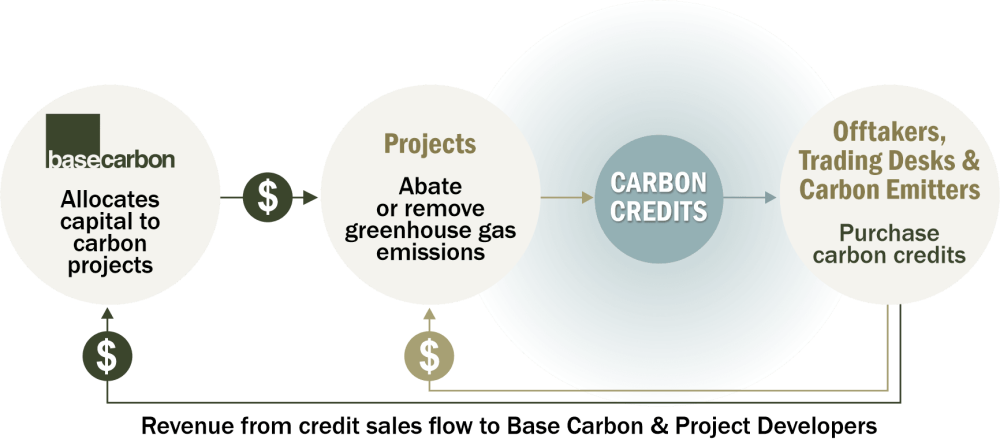
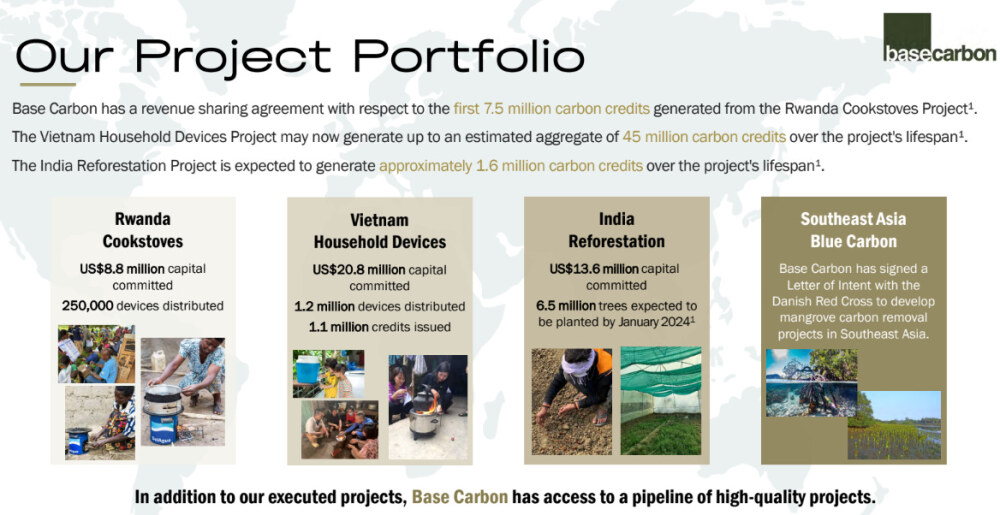
One company, Base Carbon (BCBN:NEO; BCBNF:OTCMKTS), is working to set standards for transparency in the sale of carbon credits. Base Carbon is a carbon credit company focusing on carbon capital allocation, project origination, and data transparency tools. According to the company, its primary objective is to allocate “capital directly into carbon reduction projects and carbon development companies.”
According to Base Carbon, “Pledges to lower carbon emissions now cover 92% of GDP and 88% of emissions worldwide. However, emission reduction, capture, and sequestration technologies are not yet scaled to meet these targets, creating a growing demand for quality carbon credits.”
Base Carbon aims to aid in this divide by connecting project developers who need financing and credit buying who may be searching for reputable carbon credits for their individual climate pledges.
In terms of renewing credibility in the carbon market, CEO Michael Costa stated, “Our mission is to simplify the carbon credit economy, and we are working to become the trusted financier within the voluntary carbon markets.”
One of the ways it does this is through data transparency tools. The company’s data standardization frameworks help capture and organize information from initial carbon emission sources. This process transforms raw data into valuable, usable components within the carbon credit ecosystem. By ensuring the accuracy and consistency of project-generated data, the company hopes to build a solid foundation of trust for our investment decisions and collaborative efforts.
You can see Base Carbon’s list of projects in the image below.
While past “bad apples” in the carbon credit space may have put a bad taste in investors’ mouths, Base Carbon is not slowing down anytime soon. As an article from Green Investing notes, “There’s a never-ending list of potential factors that turn people away from the space. This can either be seen as a contrarian opportunity or a reason to look elsewhere. Regardless, Base Carbon is going to continue advancing in the industry.”
The article solidified this opinion by sharing Base Carbon’s upcoming catalysts, which include:
- The company will likely become profitable this year (2024).
- Base Carbon has 8.1 million credits to be issued from its cookstove and household devices projects, which Green Investing believes could result in US$50 million in revenue.
- Announcements about deals to sell carbon credits or get government approval for these sales.
- New developments from current partnerships and more potential projects in the works.
- More information about the company’s joint investment plan with STX Group to be released.
Streetwise Ownership Overview*
Base Carbon (BCBN:NEO;BCBNF:OTCMKTS)
| Retail: 65.54% | |
| Strategic Investors: 16.79% | |
| Management & Insiders: 10.57% | |
| Institutions: 7.1% |
- *Share Structure as of 7/11/2024
Graham Mattison of Water Tower Research also sees promise in Base Carbon, as shown in a May 1 research note. Mattison wrote he saw “continued execution across all projects,” a growing cash flow, and “multiple potential catalysts ahead” for Base Carbon.
He wrote, “The current market cap of Base Carbon is ~US$40 million; the Vietnam project alone will deliver cash of ~US$29.1 million in the next 12 months.”
According to Reuters, 10.57% of the company is with management and insiders.
16.79% is with strategic investor Abaxx Technologies Inc.
7.10% is with institutions.
The rest is with retail.
According to the company, Base Carbon has a market cap of US$46.8 million, US$0 in debt, US$667,391 in cash, and 117.1 million shares outstanding as of May 16, 2024.
Market Watch notes that the company trades in the 52-week range between US$0.2025 and US$0.4520.
Carbon Streaming Corp.
Base Carbon is not alone in its mission to make carbon credits more attractive to the market. Carbon Streaming Corp. (NEO-NETZ; OTC-OFSTF) is also working on changing this perspective as part of a corporate turnaround following a drop in its stock price to CA$0.50 per share from CA$15.
The largest investor in the company, Marin Katusa of Katusa Research, is spearheading the changes. He willingly became a technical and financial adviser to the board at no cost, he said, to benefit all shareholders.
Certain changes at the management and board level were required to make the company a success for shareholders, which in turn will enable more investments to help improve the environment, in my eyes,” he told Streetwise Reports. “I trust the individuals I’ve asked to be on the board fully, and I believe we [the shareholders] are in good hands moving forward.” The new interim chair is Olivier Garret, and the interim chief executive officer is CEO Christian Milau.
Katusa also provided Carbon Streaming’s five-part plan for moving forward:
- Go through the existing deals and see what we are dealing with. I don’t have an answer for anyone at this point, but I will within 120 days. I will be involved in the technical review of the projects with the new board.
- Immediately meet with all existing employees and figure out who we want to keep and who needs to move on and pursue a new venture. Getting rid of the ridiculous compensation that was taken by certain prior management members has now stopped, and further cuts to G&A will be put into place.
- In addition to 1&2 above, we have initiated a search both internally and externally for a new permanent CEO. There are two individuals currently employed at NETZ who did catch my eye as the potential to rise to the occasion, and every person at the firm will be given every opportunity to see if the CEO role is the right one. The culture of the company has already changed immediately after replacing the former CEO, and this is a chance for anyone in the firm to rise from the ashes or move on. Christian and the rest of the new NETZ board have the same “business culture” as my own, as does Alice Schroeder, and that will be paramount moving forward.
- Moving forward, when it comes to Voluntary Carbon Markets — I’ll be encouraging Carbon Streaming will adopt my rule from 2022, only invest in the VCM market if there is an offtake in place for the credits. No offtake, no investment in the voluntary market.
- We will look at all projects, assets, etc., to return shareholder value.
Unlike the company’s previous practice, Katusa said the board members now will only receive the standard options, no cash, no deferred or restricted stock units, nor any other form of compensation “third-party consultants justify.”
About the new culture Katusa is working to achieve, he commented, “This is a win for the shareholder rights. I am proud of this result. It wasn’t easy, but we got what we needed to give this company a chance to succeed. We live to see another day, and I’m expecting big things.”
Streetwise Ownership Overview*
Carbon Streaming Corp. (NEO-NETZ; OTC-OFSTF)
| Retail: 93.52% | |
| Management & Insiders: 6.46% | |
| Institutions: 0.02% |
On July 3, 2024, the company also announced it had closed its acquisition with Blue Dot Carbon Corp. Blue Dot is a private company with an equity investment in a carbon project developer and certain option rights to invest in future removals (reforestation) projects of its partners.
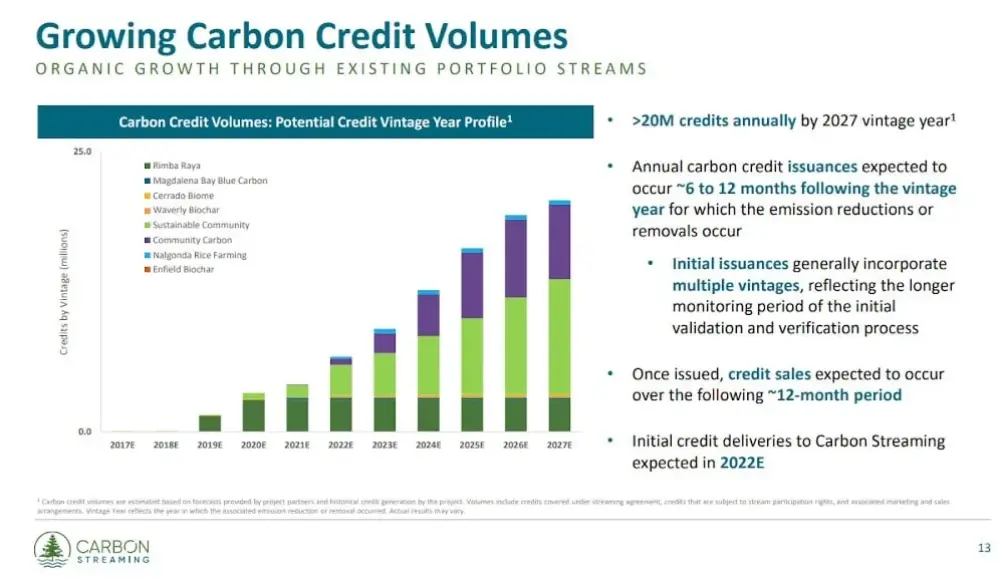
CarbonCredits.com highlighted Carbon Streaming Corp. as one of its Top 4 Carbon Stocks To Watch in 2024. The company, the first of its kind in the carbon credit market, “expects moderate and then rapid growth of credits in the coming years, peaking near 20 million (20M) credits per year by 2027,” the article indicated. “Its unique business model could help it outperform the competition.”
On June 7, Jack Gilleland of the American Association of Individual Investors gave Carbon Streaming Corp. a Value Score of 62, which, according to the article, he considers good.
According to Reuters, management and insiders hold 6.5% or 3.12M shares of Carbon Streaming. In this category, Ross Beaty owns 2.9%, or 1.39M shares.
The company has one institutional investor, Black Diamond Asset Management Inc., which holds 0.02%, or 0.01M shares.
The rest of the company, 93.48%, is with retail.
Carbon Streaming has 47.97M shares outstanding and 44.85M free float traded shares.
Its market cap is CA$31.51M. Its stock price range over the past 52 weeks was CA$0.46−$1.47 per share.
Pioneer Key Carbon Ltd., A Private Co.
Most of the large carbon credit companies are private. These include Carbon by Indigo, Nori, TrueCarbon by TrueTerra, Bayer Carbon Program, and Nutrien Ag.
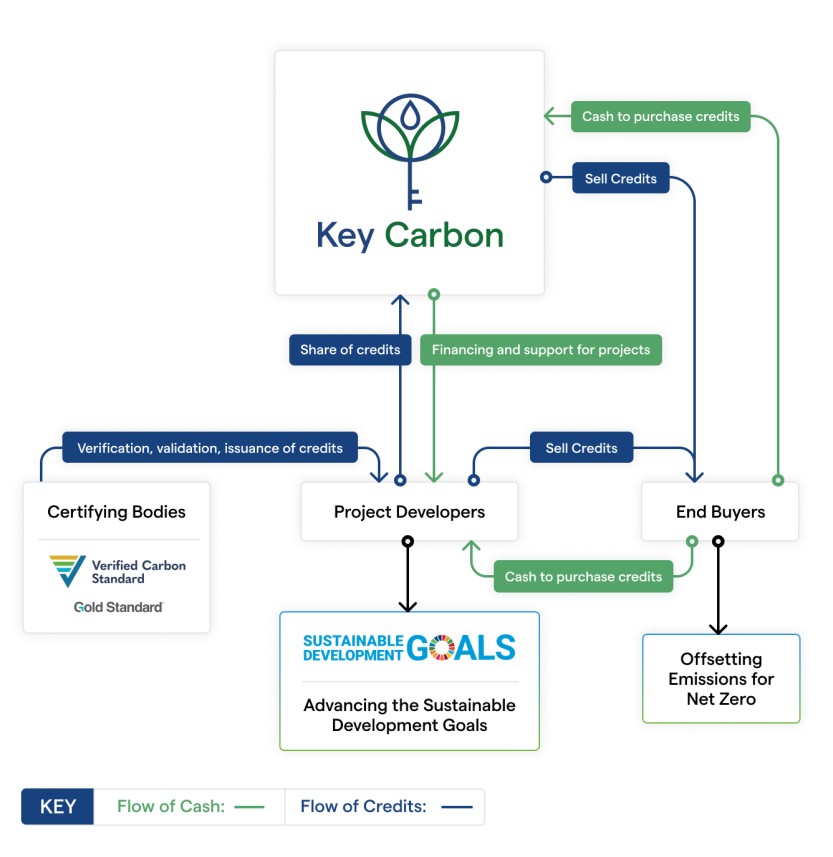
Another carbon credit streamer striving to be transparent is Key Carbon. Headquartered in Vancouver, British Columbia, this private company finances and supports developers of carbon projects around the world and is building a diversified portfolio of carbon credit streams and royalties. Corporations and other entities may purchase Key Carbon’s voluntary carbon credits to help them achieve their climate and sustainability goals.
“We will be a large environmental services company,” Luke Leslie, co-founder and chief executive officer of Key Carbon Ltd., told Streetwise Reports. “We want to do that to service these projects in a way others can’t, with cutting-edge monitoring systems to provide the data to better understand the impact.”
How it works is Key Carbon selectively chooses a carbon project after rigorously vetting its developer. The company pays the developer upfront in return for a portion of future carbon credits, as defined in an exclusive financing agreement created by Key Carbon. It receives the credits once an independent third party, such as Verra, verifies the project. Then Key Carbon sells the credits to corporations or groups that need them to offset their carbon emissions. Key Carbon also continues to support the developer with strategy and operational improvements.
Current partners of Key Carbon include BURN, Africa’s leading clean cooking company, and Worldview International Foundation, a nonprofit organization that has pioneered 680 sustainable development projects in 26 countries.
BURN is a small project with a big impact, in which Key Carbon has invested US$36M. Through BURN, they provide fuel-efficient cookstoves to families cooking on open fires, a practice that has caused 4M premature deaths, noted Leslie. Cookstoves use less fuel, are safer, and free up users’ time.
Key Carbon’s work with Worldview is an example of a higher-value project that Key Carbon has helped fund. This project consists of reforestation of native trees, specifically mangroves.
With Key Carbon’s portfolio, an estimated 41.2 million tons of carbon will be removed or avoided, according to the company’s website.
The types of projects Key Carbon could partner on are numerous, Leslie said, given that “the carbon markets have 200 ways to generate carbon credit.”
As for catalysts, Key Carbon will close a US$15M financing this month, moving it closer to its goal of raising US$100M by year-end, Leslie said. The company is continuing to build out direct sales channels and acquire biodiversity businesses. Also, of course, additional partnerships and project deals could also move the stock.
Carbon Industry Surviving
While so-called “carbon cowboys” may have sullied the name of carbon credits, these three companies, Base Carbon, Carbon Streaming, and Key Carbon, and growth forecasts might be showing that the carbon credits industry is surviving the negative aspects is very much alive, and is expanding.
These companies are working to ensure transparency and efficiency within the companies and to create a sustainable army in the fight against the climate crisis.
Important Disclosures:
- As of the date of this article, officers and/or employees of Streetwise Reports LLC (including members of their household) own securities of Key Carbon Ltd.
- Doresa Banning and Katherine DeGilio wrote this article for Streetwise Reports LLC and provide services to Streetwise Reports as an independent contractor/employee.
- This article does not constitute investment advice and is not a solicitation for any investment. Streetwise Reports does not render general or specific investment advice and the information on Streetwise Reports should not be considered a recommendation to buy or sell any security. Each reader is encouraged to consult with his or her personal financial adviser and perform their own comprehensive investment research. By opening this page, each reader accepts and agrees to Streetwise Reports’ terms of use and full legal disclaimer. Streetwise Reports does not endorse or recommend the business, products, services or securities of any company.
For additional disclosures, please click here.