Melt-Up Continues While Metals Warn of Risks

By TheTechnicalTraders 

– What a week for Metals and the markets, folks. The Transportation Index is up nearly 4% for the week.  The Dow Jones Industrial Average is up over 3% for the week.  Silver is up over 14% and reached a peak near $30 (over 23%).  Gold is up over 2.5% and trading above $2025 right now – with a peak price level near $2090.  If you were not paying attention this week, there were some really big moves taking place.

MELT-UP WITH HIGH RISKS – PAY ATTENTION

Overall, our research team believes the current “melt-up” price action is likely to continue as global investors continue to believe the US Fed will do everything possible to save the collapsing world economy.  We are nearing a critical juncture in price, as you can see from this YM Weekly chart below.  A series of lower highs has set up since the peak in February 2020 which suggests some new price weakness may lie just ahead – but until we see a substantial downside price move triggering a new bearish trend (a closing price below $26,000), then we must assume the melt-up will likely continue.
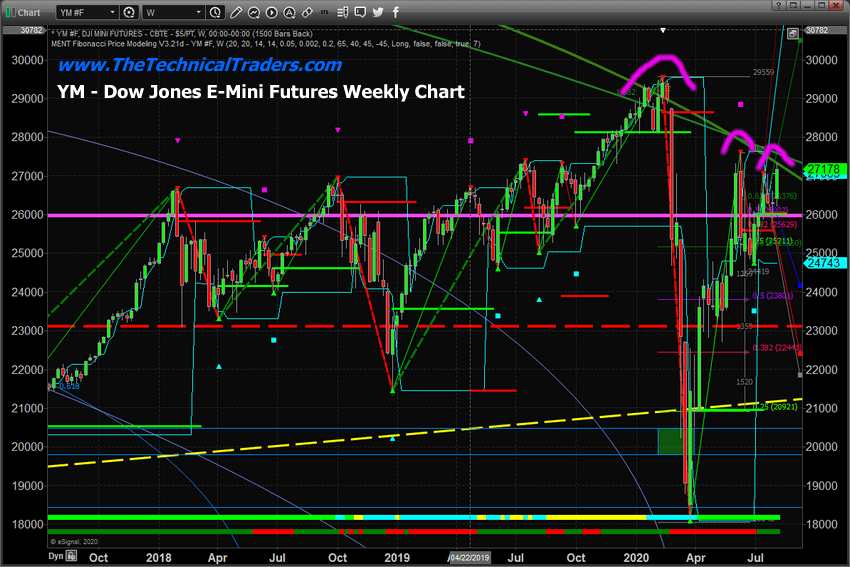
The current price rotational range on the YM, from a peak near $27,600 to a trough near $24,765, presents a moderately large and volatile price range for traders totaling 2,835 points.  Skilled traders should not discount the risks and volatility which are still very present in the current market environment.  Don’t misinterpret this melt-up as a lower volatility bullish price trend – this market can chew your head off in less than 60 seconds if you are not careful and properly position your trades.

The real risks going forward relate more to a technical failure of price near the current peak levels (near  $27,300).  If a downside price trend were to initiate soon, this could confirm a “lower high” Fibonacci technical pattern which would suggest a failure to attempt to breach the previous high pivot level near $27,600.  In short, this is a “wait and see” type of situation where volatility is likely to spike as the markets attempt to either continue the “melt-up” or fail and begin a new downside price trend.

WEEKLY TRANSPORTATION INDEX RISING

This Weekly Transportation Index chart further highlights the Lower-High patterns that have continued to set up over the past 24+ months.  The first peak level on this chart occurred on September 10, 2018.  Our research team believes the real peak in the global markets occurred in early January 2018.  All of our modeling systems suggest that the early January 2018 peak was the peak in organic economic growth and a capitulation top.  Since then, the subsequent peaks appear to be valuation (capital shift) level peaks that are not supported by organic economic activity – think of these as “false price peaks” related to how capital is shifting around the globe chasing returns.

In order for the global markets to attain an organic growth phase, credit, debt and consumers must all participate in the expansion of economic activity.  Since early 2018, when the US Fed shocked the markets and the US/China trade issues initiated, a number of economic factors have weakened over time – particularly the global consumer activity and credit markets.  We believe the recent efforts by the US Fed and global central banks have attempted to buoy these aspects of the markets as global credit and trade concerns mount.
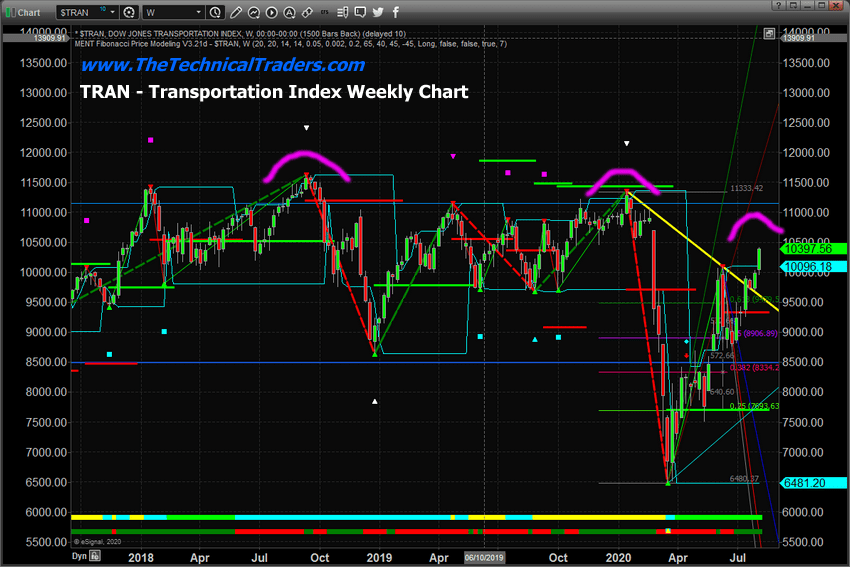
The Transportation Index, one of our favorite charting symbols, clearly shows the failed “higher-high” peaks over the past 24+ months. The current peak level, near 10,400, is -8.35% below the January/February 2020 peak levels.  It seems highly likely that the “melt-up” process may push the TRAN price high enough to fill the GAP that was created in February, near $10,800 if it continues to push price levels higher.  Yet, we believe the risk levels which have recently been screaming at us because of the huge upside moves in Gold and Silver are extreme right now.  In other words, Gold and Silver are kicking us in the forehead and screaming, “Hey, we are skyrocketing because the global market risks are excessive and traders are not paying attention to these risks right now”.  So our advice for skilled technical traders would be to stay cautious and expect a continued melt-up until it ends.

Be sure to opt-in to our free market trend analysis and signals now so you don’t miss our next special report!

CUSTOM METALS INDEX SCREAMS HIGH RISKS

This Weekly Custom Metals Index chart clearly highlights the big breakout trend that has taken place over the past 6+ weeks and really accelerated higher over the past 3+ weeks.  Almost every trader on the planet knows that Metals hedge risk.  When metals start to move higher, one should expect the global markets to become excessively volatile and risky – which suggests skilled technical traders must learn to properly position-size and address new risk factors.

Our research team believes the move in metals has just started.  We published an article early this week that highlighted many of our earlier research posts to help you understand the true nature of the risks in the markets and how metals will act to hedge these risks.

As metals continue to climb higher, skilled traders should interpret this upside price move as “the markets are entering higher risk and volatility levels” – even if these larger concerns are materially evident in the current price trend.  Metals move higher when global traders expect much higher risk factors and excessive unknowns.  In other words, metals are the canary in the coalmine as they tell you to be prepared for potentially very large price rotations and serious unknown events in the near future.
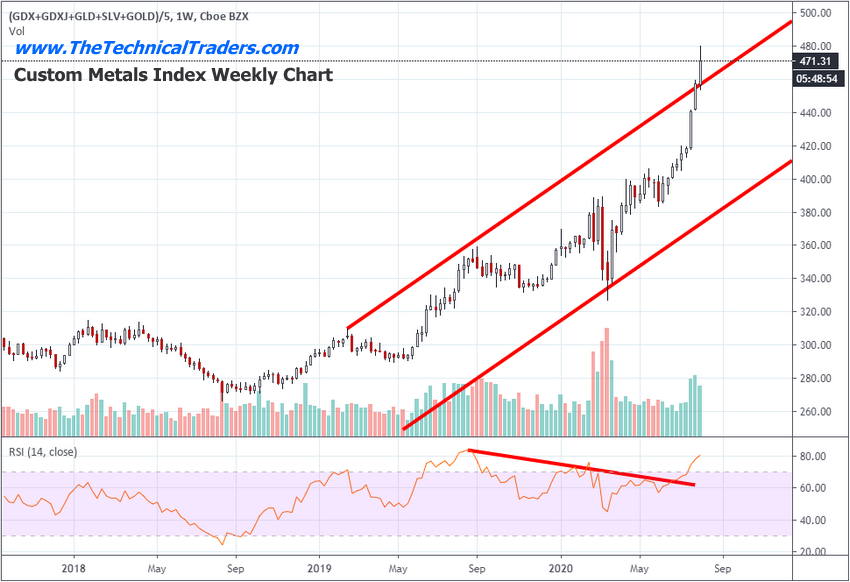
As we close out this week and head into the late summer months, our advice would be to prepare for increased volatility, the strong potential for unknown events to take place, and a moderate “melt-up” to continue until it breaks lower.  If Gold clears $2300 over the next 3+ weeks, then we suggest moving into a very protective mode for your portfolio and assets.  A move like this would suggest global traders expect some type of major event to take place and risks are not subsiding.

As we suggested throughout 2018 and all of 2019, 2020, and the next 3+ years are going to be excellent opportunities for skilled technical traders to profit from big price swings.  Recently, we just closed two active trades for a quick 11% profit in the markets.  We attempt to assist our subscribers by helping them navigate these market trends, stay away from risk, and learn to target highly accurate trades.

Get our Active ETF Swing Trade Signals or if you have any type of retirement account and are looking for signals when to own equities, bonds, or cash, be sure to become a member of my Passive Long-Term ETF Investing Signals which we are about to issue a new signal for subscribers.

Chris Vermeulen
Chief Market Strategist
Founder of Technical Traders Ltd.

NOTICE: Our free research does not constitute a trade recommendation or solicitation for our readers to take any action regarding this research.  It is provided for informational and educational purposes only.    Take a minute to visit TheTechnicalTraders.com to learn more about how we can help you find and execute better trades.

 

Five top tips for managing your personal finances during coronavirus

By Jonquil Lowe, The Open University

When it comes to money, coronavirus has split the nation. Financial stress dominates for many of the 9.5 million employees on furlough, potentially facing unemployment as the scheme unwinds, and for those whose small businesses have been disrupted or whose finances were already precarious before the crisis. By contrast, if you are one of the lucky ones whose income has been uninterrupted, you may have found that your spending has dropped and, as a result, you might have been able to pay off debts and even build up your savings.

Whichever camp you fall into, here are some ways to weather the pandemic storm and plan for your financial future.

1. Saving

With the Bank of England base rate slashed to 0.1%, the returns on savings accounts are at record lows. But the government needs your money. Pre-coronavirus, National Savings & Investments (NS&I), the UK’s state-owned savings bank, was tasked to raise £6 billion in 2020-21 for the government. That has now been hiked to £35 billion. To attract your savings, NS&I has some of the best deals, such as 1% per annum on its direct saver account and 1.4% per annum in prizes on premium bonds.

Even with low interest rates, saving still makes sense to provide a buffer against further disruption and emergencies. For longer-term goals, such as pensions, you should consider investments.

2. Investing

For higher returns than savings offer, inevitably you must take on more risk. One option is peer-to-peer investing, where investors are matched directly to borrowers through online platforms, such as Ratesetter and Zopa. Make sure you understand that you could lose money if borrowers default and that peer-to-peer investing is not covered by the Financial Services Compensation Scheme (unlike savings accounts).

The stock market fell sharply at the start of the crisis and is largely treading water in the uncertain climate of changing policy announcements and fears of further coronavirus outbreaks. Some see this as an opportunity for stock-picking – always a high-risk activity. Stocks that are “in” include online businesses and green technology. Those that are “out” are high street retailers, airlines and carbon-based industries. Some investors are turning to commodities, including gold, but prices are already high.

In general, profound uncertainty about the economic and inflation outlook makes diversifying your investments across a range of different assets more important than ever.

3. Retirement contributions

The current climate is a perfect storm for pension schemes, suffering low interest rates, the stock market fall and widespread dividend cuts. On top of that, if your budget is currently squeezed, you may feel tempted to opt out of your workplace pension scheme.

Bear in mind, though, that you will lose your employer contributions and tax relief, which in effect double your money from the start, regardless of investment returns. So, try to keep paying in if you can.

4. Borrowing

Payment holidays on mortgages, credit cards and other loans are a welcome source of temporary respite for millions of borrowers. But bear in mind that interest still builds up during the so-called holiday and, when payments restart, they could be higher than before.

Also be aware that, although using a payment-holiday scheme will not be noted on your credit records with credit reference agencies, it may still affect your ability to borrow in future. This is because lenders must carry out affordability checks to make sure you can manage any new borrowing on top of catching up with existing loans once the payment holiday stops.

So only use or extend payment holidays as a last resort. And, if your money problems look like they will be more than temporary, talk to your lender about other options. Consider getting help from one of the free, independent debt advice organisations. You can find one near you via the Money Advice Service.

5. Spending

It is natural to spend less if you are worried about the future. But this creates a classic dilemma, first analysed by economist, John Maynard Keynes, during the 1930s depression: if consumers don’t spend, the economy contracts. This results in job losses, falling household incomes and further spending cuts in a damaging downward spiral.

This is why the government announced various incentives in its March budget and the July summer statement. This included VAT cuts for the tourism and hospitality sectors, discounts on eating out, raising the stamp duty threshold on home purchases, a deal for green homes to subsidise the cost of double glazing, insulation and energy-efficient heating, along with an extension of discounts for buying electric cars.

So if your household can afford it, spending will help to support and revive the economy. It will also gain you, for example, up to £5,000 off making your home greener and up to £3,000 off the purchase of an electric car.

One area of spending that is proving more fraught is holidaying abroad. The recent surprise announcement that tourists returning from Spain will have to self-isolate for 14 days was a sharp reminder that the world is far from getting back to normal.

If you are planning a trip abroad, check carefully what your travel operator’s policy is in the event of a coronavirus-related cancellation. Also make sure that your travel insurance includes coronavirus cover (many don’t) and whether this cover is limited to medical expenses or extends to cancellation as well. Consumer choice company, Which?, has a useful guide.The Conversation

About the Author:

Jonquil Lowe, Senior Lecturer in Economics and Personal Finance, The Open University

This article is republished from The Conversation under a Creative Commons license. Read the original article.


Moldova cuts rate 3rd time 2020 to keep inflation on target

By CentralBankNews.info

The central bank of Moldova cut its policy rate for the third time this year and its reserve requirement for the second time to keep inflation in its target range and counter the disinflationary pressures from measures to contain the Covid-19 pandemic and lower fiscal spending.

     The National Bank of Moldova (NBM) lowered its base rate by 25 basis points to 3.0 percent and narrowed its interest rate corridor by 100 points by lowering the rate on overnight loans by 75 points to 5.50 percent and raising the rate on overnight deposits by 25 points to 0.5 percent on overnight loans to “streamline the transmission mechanism of monetary policy decisions.”
     “This measure creates conditions for maintaining inflation in the range of +/- percentage points from the medium-term inflation target of 5.0 percent,” NBM said on Aug. 6.
     NBM, which said the policy decision by its executive board was unanimous, has now cut its base rate by 250 basis points this year following two cuts in March.
     Since December 2019, when the central bank also cut its rate for the first time after raising it in July 2019, the rate has been lowered 450 points.
     In addition to the rate cuts, NBM also cut its required reserve ratio on banks’ leu and non-convertible liabilities by another 100 basis points to to 32 percent for the period of Aug. 16 to Sept. 15 and then for the period of Sept. 16 to Oct. 15.
     The reserve ratio on freely convertible currencies was raised 300 basis points to 27.0 percent for the same to application periods as on lei-denominated liabilities, the bank said, adding the decision to continue to balance the reserve ratios aims to improve financial intermediation in the domestic currency and was discussed during last month’s talks with the International Monetary Fund (IMF).
      The policy decision followed the bank’s third inflation report, which will be published on Aug. 13, which forecasts that aggregate demand will generate disinflationary pressures by the third quarter of 2021, mainly due to measures taken by the government to ease the pandemic, and the reduced budget expenditures in the first half of this year and a decrease in some regulated tariffs.
      On July 27 the IMF said its staff and Moldova had agreed on an economic reform program supported by a 3-year extended credit facility and extended fund facility agreements, allowing access to about US$558 million.
     Approval of this agreement is expected by the IMF executive board in September, subject to the country’s implementation of a number of actions in the area of central bank independence, financial sector oversight and fiscal transparency.
     “The successful clean-up of the banking sector in the aftermath of the major bank fraud is a credit to the supervisory work of the NBM,” the IMF said, adding it is in Moldova’s interest to preserve the independence of the central bank and is also a critical requirement under the latest agreement.
     In March Moldova detained two current and two former senior central bank officials on suspicion of involvement in the US$1 billion theft from three banks in 2014-2015, triggering a political crises in the former Soviet republic.
      The theft led to street protests, a freeze in aid by the IMF and the European Union, a plunge in the leu’s exchange rate and a rise in inflation.
      Inflation in Moldova, which is located between Ukraine and Romania, close to the Black Sea, rose to 4.3 percent in June from 4.1 percent in May and its gross domestic product grew 0.5 percent in the first quarter from the previous quarter for annual growth of 0.9 percent.
      After falling in the first three months of the year, the leu has been rising May and rose further today to 16.6 to the U.S. dollar, up 4.2 percent this year.
     The National Bank of Moldova issued the following statement:

“The Executive Board of the National Bank of Moldova (NBM) decided unanimously, at its meeting of 6 August 2020, a set of incentive monetary policy measures.

Thus, the base rate applied to the main short-term monetary policy operations decreased by 0.25 percentage points to 3.0 percent annually. This measure creates conditions for maintaining inflation in the range of ± 1.5 percentage points from the medium-term inflation target of 5.0 percent.

The decision is based on an assessment of the recent available macroeconomic information on internal and external environment and the assumptions taken into account in drawing up the new forecasting round.

At the same time, the Executive Board set the interest rates at the level of 5.5 percent on overnight loans and of 0.5 percent on overnight deposits. The decrease of 1.0 percentage points in the interest rates corridor aims to calibrate monetary policy instruments in order to streamline the monetary policy transmission mechanism.

The required reserves ratio from the financial means attracted in Moldovan lei and in non-convertible currency decreased by 1.0 percentage points, up to 32.0 percent for the application periods of 16 August 2020 – 15 September 2020, and, respectively, 16 September 2020 – 15 October 2020. The required reserves ratio from the financial means attracted in freely convertible currency increased by 3.0 percentage points, up to 27.0 percent, for the same application periods. The decision to continue balancing the required reserve ratios, also discussed in last month’s talks with the IMF, aims to improve financial intermediation in the national currency.

The Inflation Report no. 3 was also approved during today’s meeting, which will be published on 13 August 2020.

According to the forecast contained in the report, the aggregate demand will generate disinflationary pressures by the third quarter of 2021, mainly due to the measures taken by the authorities to mitigate the pandemic crisis and to reduce budget expenditures in the first half of this year.

In this context, the aggregate domestic demand and the negative fiscal impulse as well as the decrease in some regulated tariffs will be the main factors with disinflationary action. At the same time, a pro-inflationary influence will have the decrease of the agricultural production in the current year, the export restrictions to some agro-food products in the region, the effect of the products with a strong seasonal character and the adjustment of excise duties.

The NBM is continuously monitoring the macroeconomic situation caused by the pandemic and, in due course, without compromising its fundamental objective of ensuring price stability, will come up with the necessary measures to maintain a sufficient liquidity level for licensed banks, in support of a sustainable and stable banking system.

The next monetary policy meeting will take place on 9 September 2020, according to the published schedule.”

www.CentralBankNews.info

Natural Gas, Centerra Gold, Yahoo Japan & Advantest lead Weekly Top Gainers/Losers

By IFCMarkets.com

Top Gainers – The World Market

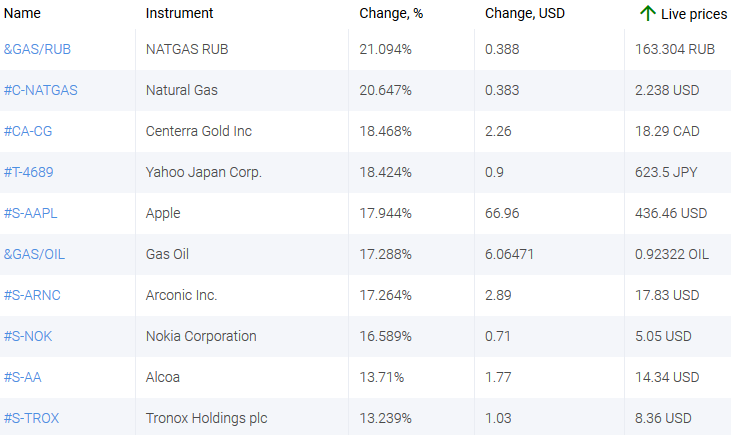
The US dollar index continues to fall for the 7th week in a row in anticipation of the new Fed emissions, aimed at stimulating the US economy, affected by Covid-19. Natural gas has risen in price sharply against the backdrop of a reduction in LNG production due to the pandemic.

1.GAS/RUB, 21.09% – personal composite instrument NATGAS against the Russian ruble.

2.NATGAS, 20,65% – futures contract for the natural gas located at the Henry Hub terminal in the United States.

market sentiment ratio long short positions

 Top Losers – The World Market

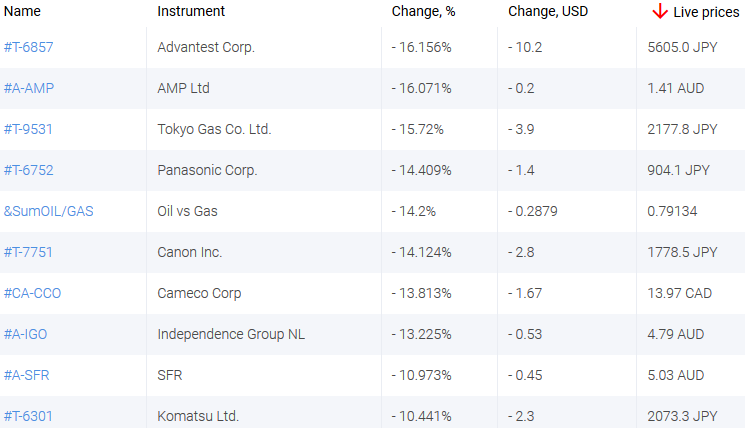
1. Advantest Corporation – Japanese manufacturer оf semiconductor engineering and measuring instruments.

2. AMP Ltd – Australian finance company.

market sentiment ratio long short positions

 Top Gainers – Foreign Exchange Market (Forex)

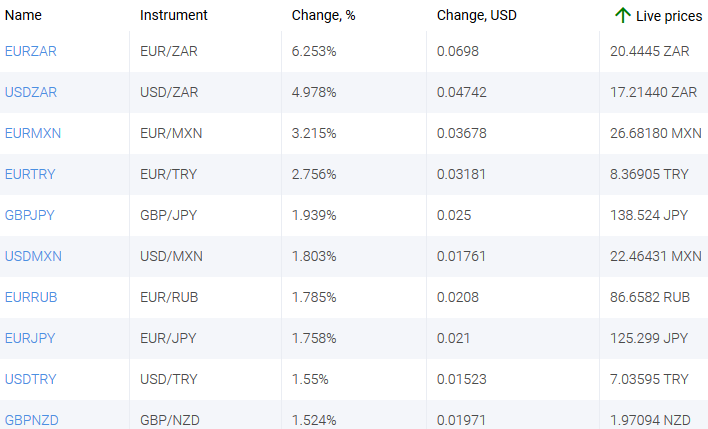
1. EURZAR, USDZAR – the growth of these charts means the strengthening of the US dollar and the euro against the South African rand.

2. EURMXN, EURTRY – the growth of these charts means the weakening of the Mexican peso and Turkish lira against the euro.

market sentiment ratio long short positions

 Top Losers – Foreign Exchange Market (Forex)

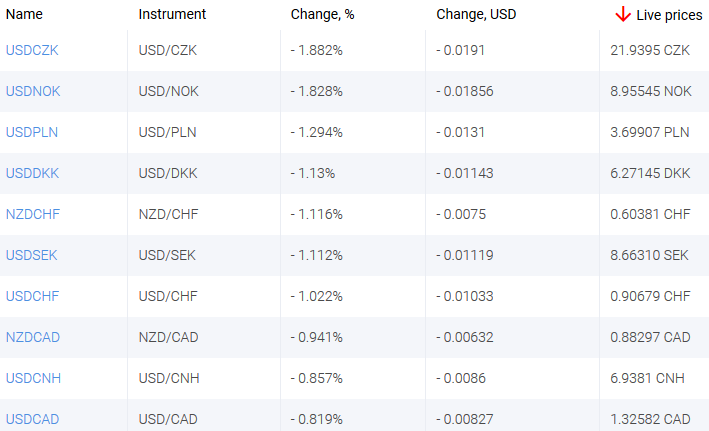
1. USDNOK, USDCZK – the drop of these charts means the strengthening of the Norwegian krone and the Czech koruna against the US dollar.

2. USDPLN, USDDKK – the drop of these charts means the weakening of the US dollar against the Polish zloty and the Danish krone.

market sentiment ratio long short positions
Market Analysis provided by IFCMarkets.com

Murrey Math Lines 07.08.2020 (Brent, S&P 500)

Article By RoboForex.com

Brent

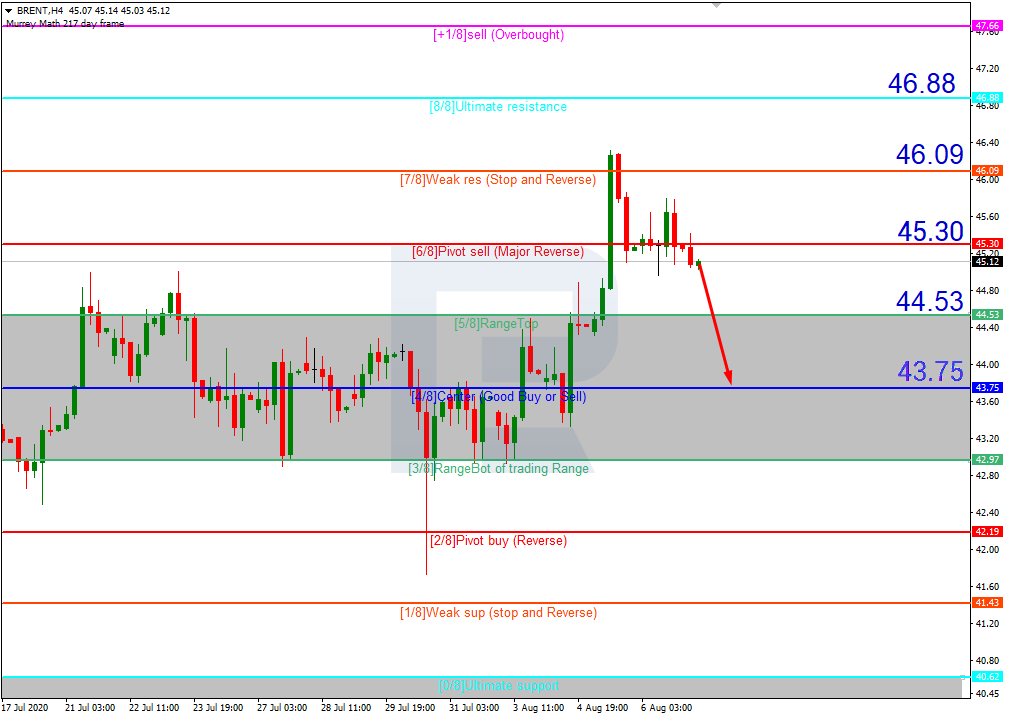
As we can see in the H4 chart, Brent has stopped at 7/8. In this case, the price is expected to get back inside the consolidation range and test the support at 4/8. However, this scenario may no longer be valid if the price breaks the resistance at 7/8 to the upside. After that, the instrument may continue growing to reach 8/8.

BRENT_H4
Risk Warning: the result of previous trading operations do not guarantee the same results in the future

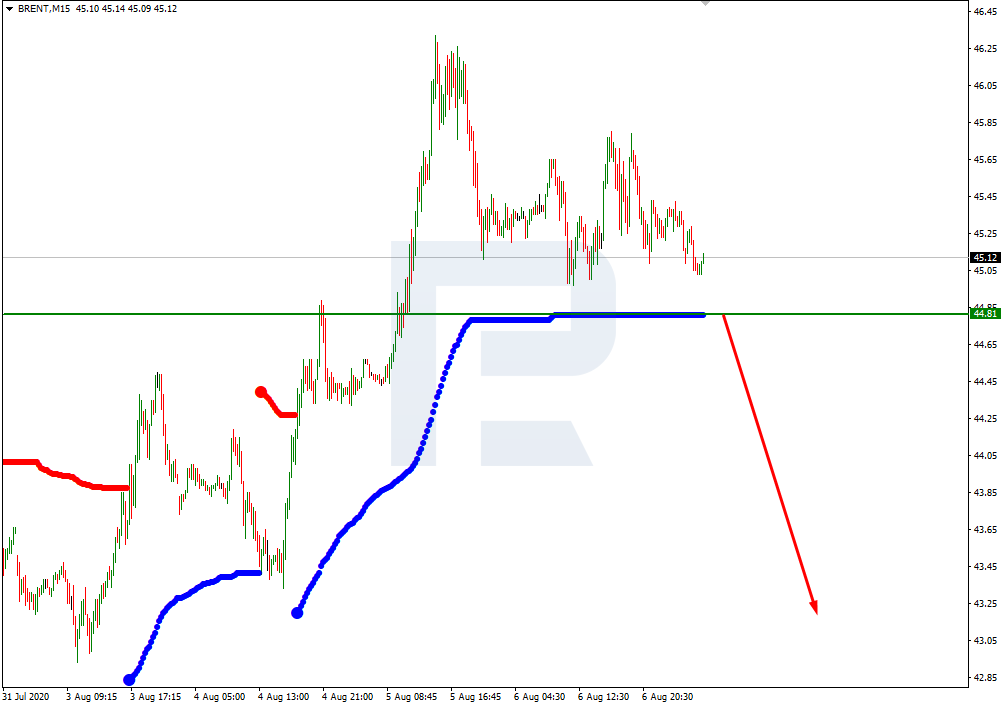
In the M15 chart, the asset may break the downside line of the VoltyChannel indicator and, as a result, continue the descending tendency.

BRENT_M15
Risk Warning: the result of previous trading operations do not guarantee the same results in the future

S&P 500

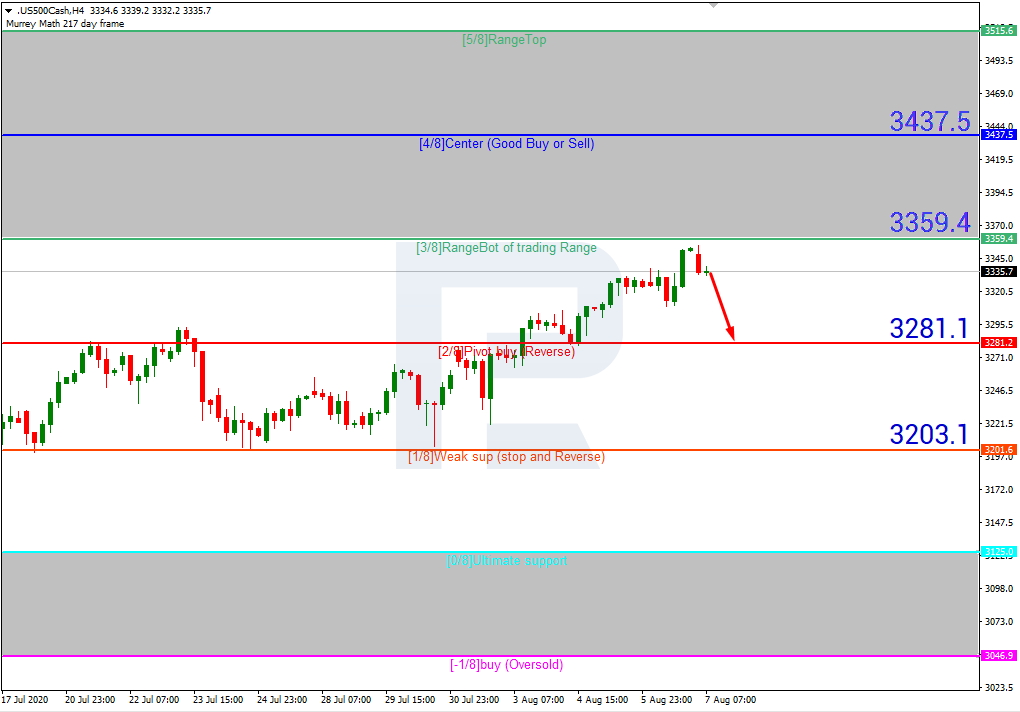
As we can see in the H4 chart, after rebounding from 3/8 again, the Index is expected to start another decline towards the closest support at 2/8. However, this scenario may no longer be valid if the price breaks 3/8 to the upside. After that, the instrument may resume growing towards the resistance at 4/8.

S&P 500_H4
Risk Warning: the result of previous trading operations do not guarantee the same results in the future

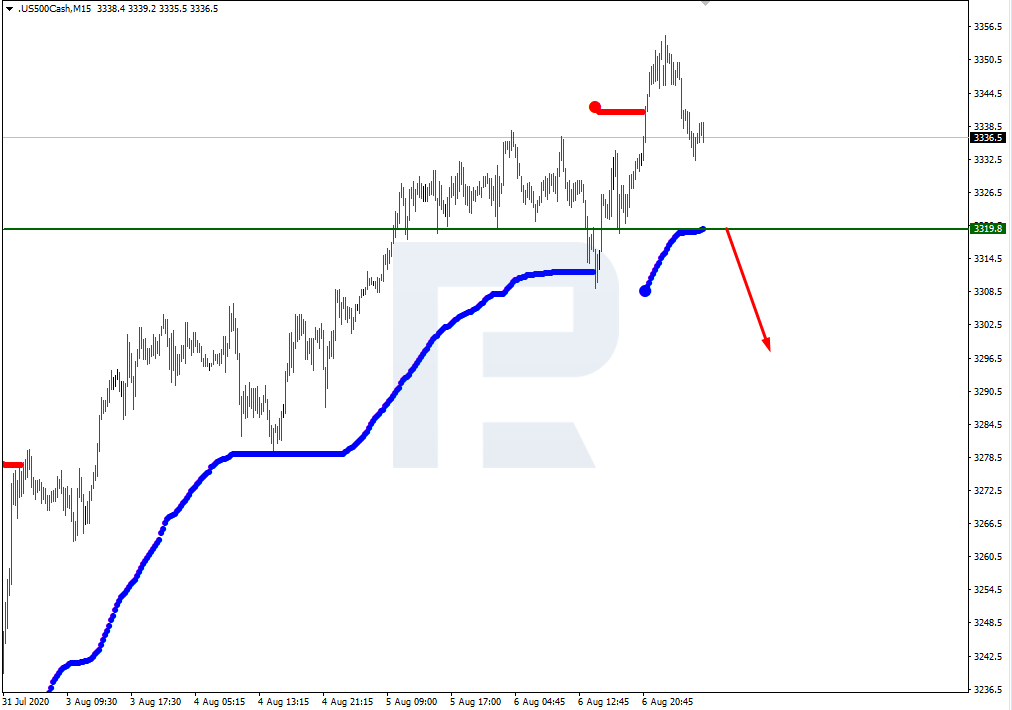
In the M15 chart, the asset may break the downside line of the VoltyChannel indicator and, as a result, continue trading downwards to reach 2/8 from the H4 chart.

S&P 500_M15

Article By RoboForex.com

Attention!
Forecasts presented in this section only reflect the author’s private opinion and should not be considered as guidance for trading. RoboForex LP bears no responsibility for trading results based on trading recommendations described in these analytical reviews.

Fibonacci Retracements Analysis 07.08.2020 (BITCOIN, ETHEREUM)

Article By RoboForex.com

BTCUSD, “Bitcoin vs US Dollar”

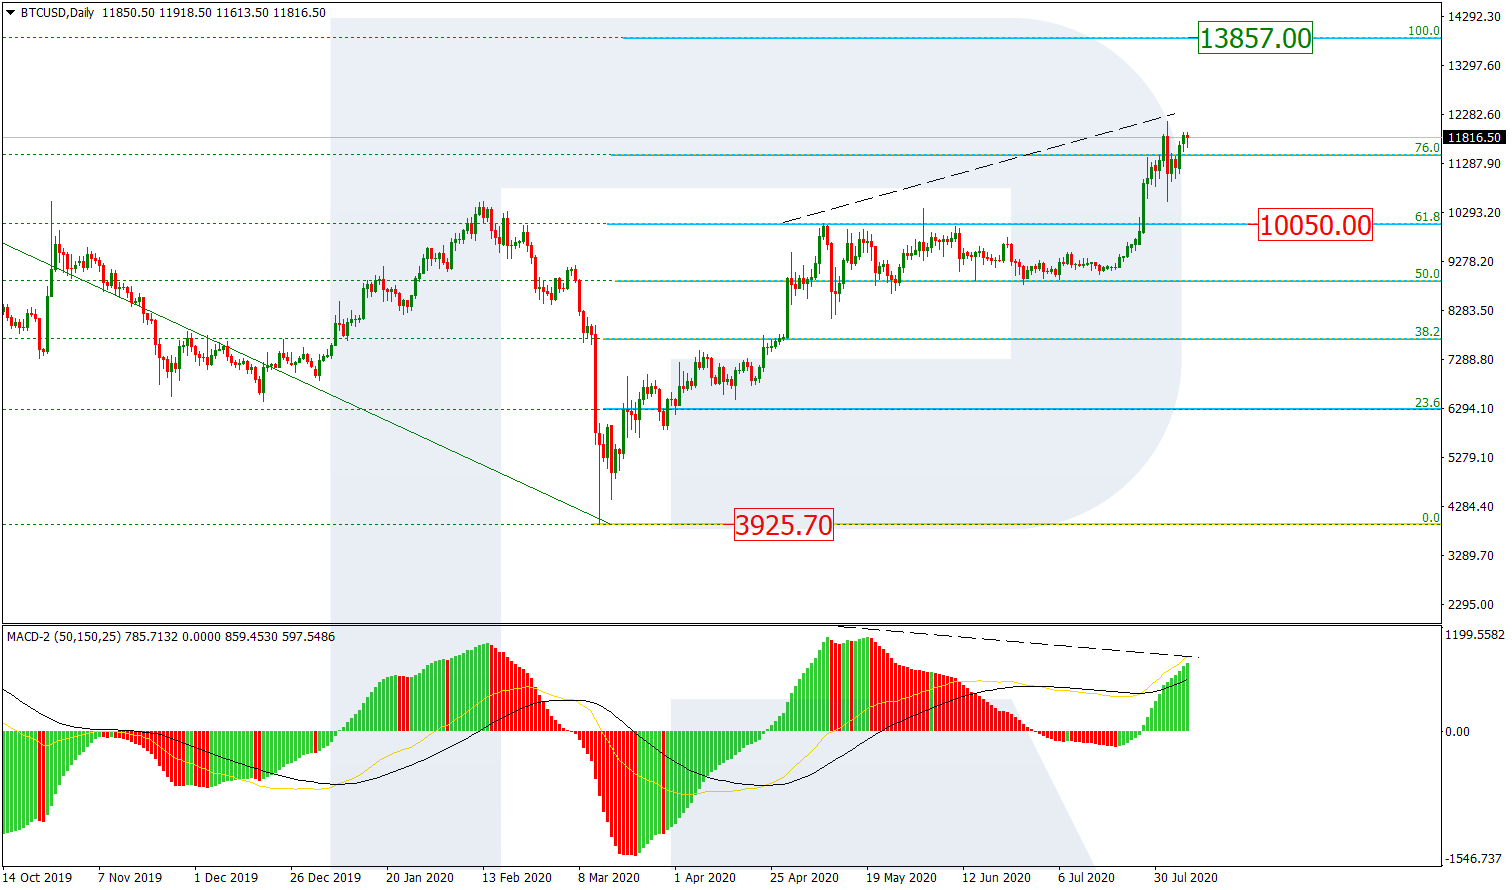
As we can see in the daily chart, BTCUSD has slowed down its growth at 76.0% fibo; right now, it is correcting downwards after completing an ascending impulse. The next upside target may be the fractal high at 13857.00. it may be assumed that after reaching this target, the instrument will start another correction. The support is 61.8% fibo at 10500.00.

BTCUSD_D1
Risk Warning: the result of previous trading operations do not guarantee the same results in the future

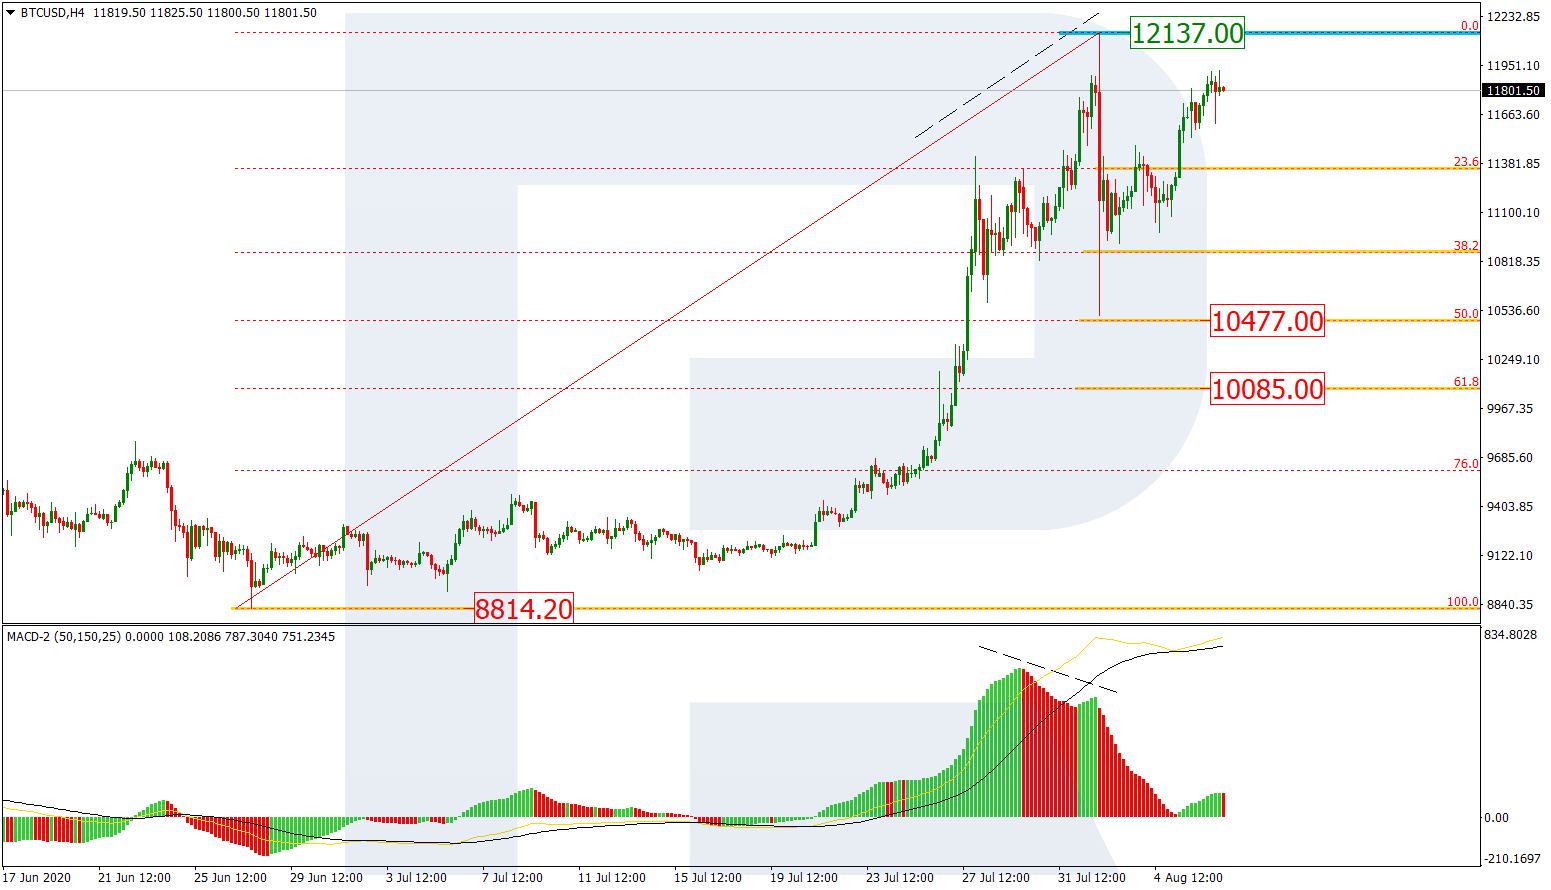
The H4 chart shows a more detailed structure of the current correction. There was a divergence on MACD, which made the pair start a new descending impulse that tried to break 50.0% fibo but failed. At the moment, the current rising wave, after reaching the high at 12137.00, has failed to test or break it. Later, the market may resume trading downwards to reach 50.0% and 61.8% fibo at 10477.00 and 10085.00 respectively.

BTCUSD_H4
Risk Warning: the result of previous trading operations do not guarantee the same results in the future

ETHUSD, “Ethereum vs. US Dollar”

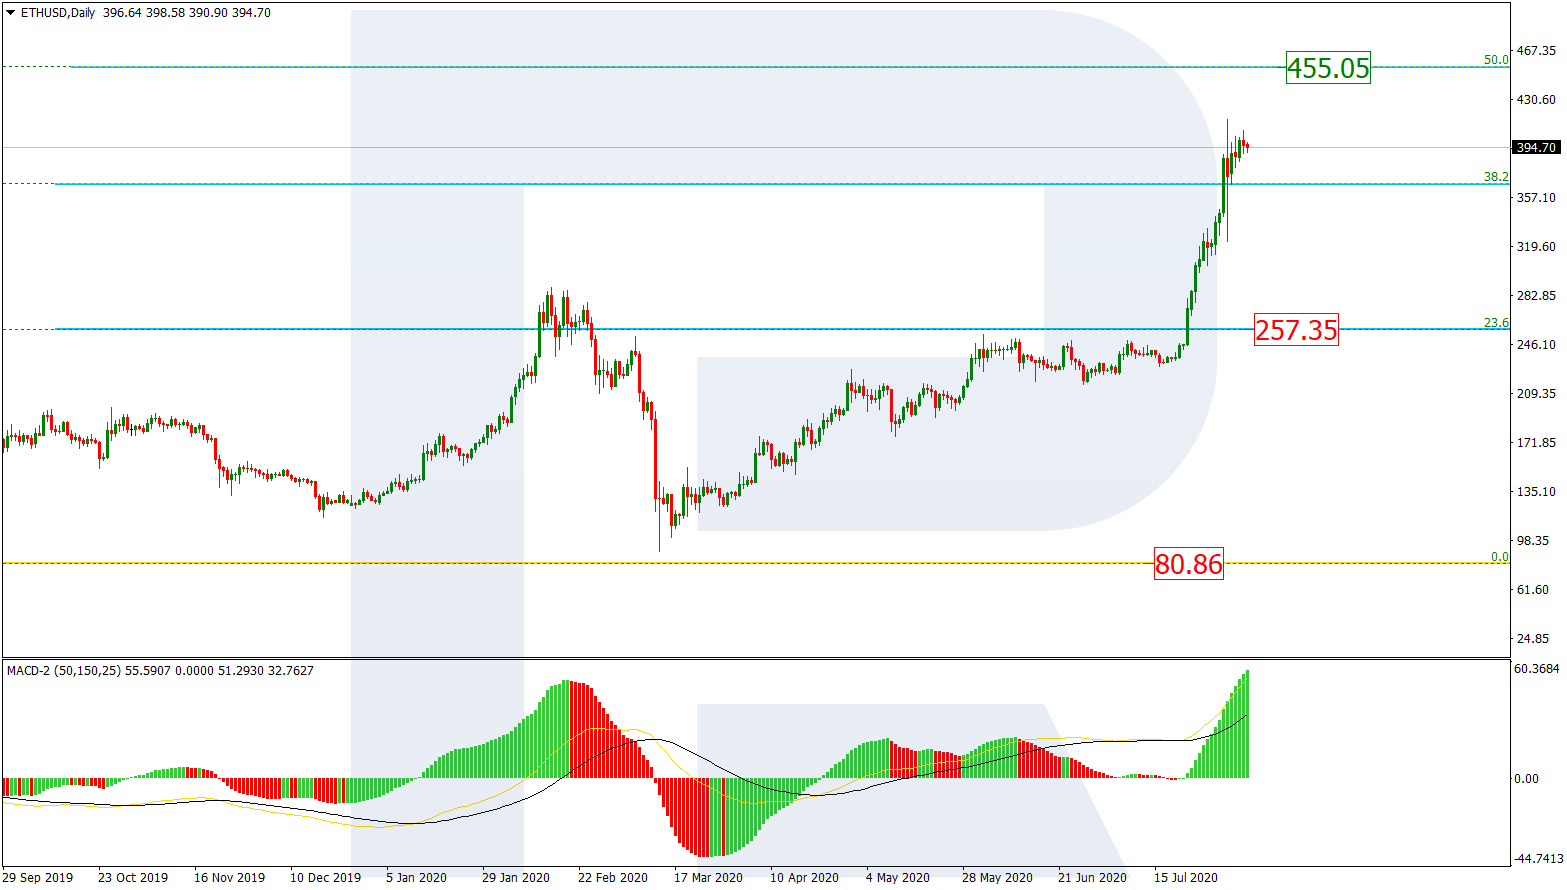
As we can see in the daily chart, after breaking 38.2% fibo, Ethereum is correcting to the downside. The next upside target may be at 50.0% fibo at 455.05. One may assume that after reaching the target the asset may start a new correction. The key support is at 257.35.

ETHUSD_D1
Risk Warning: the result of previous trading operations do not guarantee the same results in the future

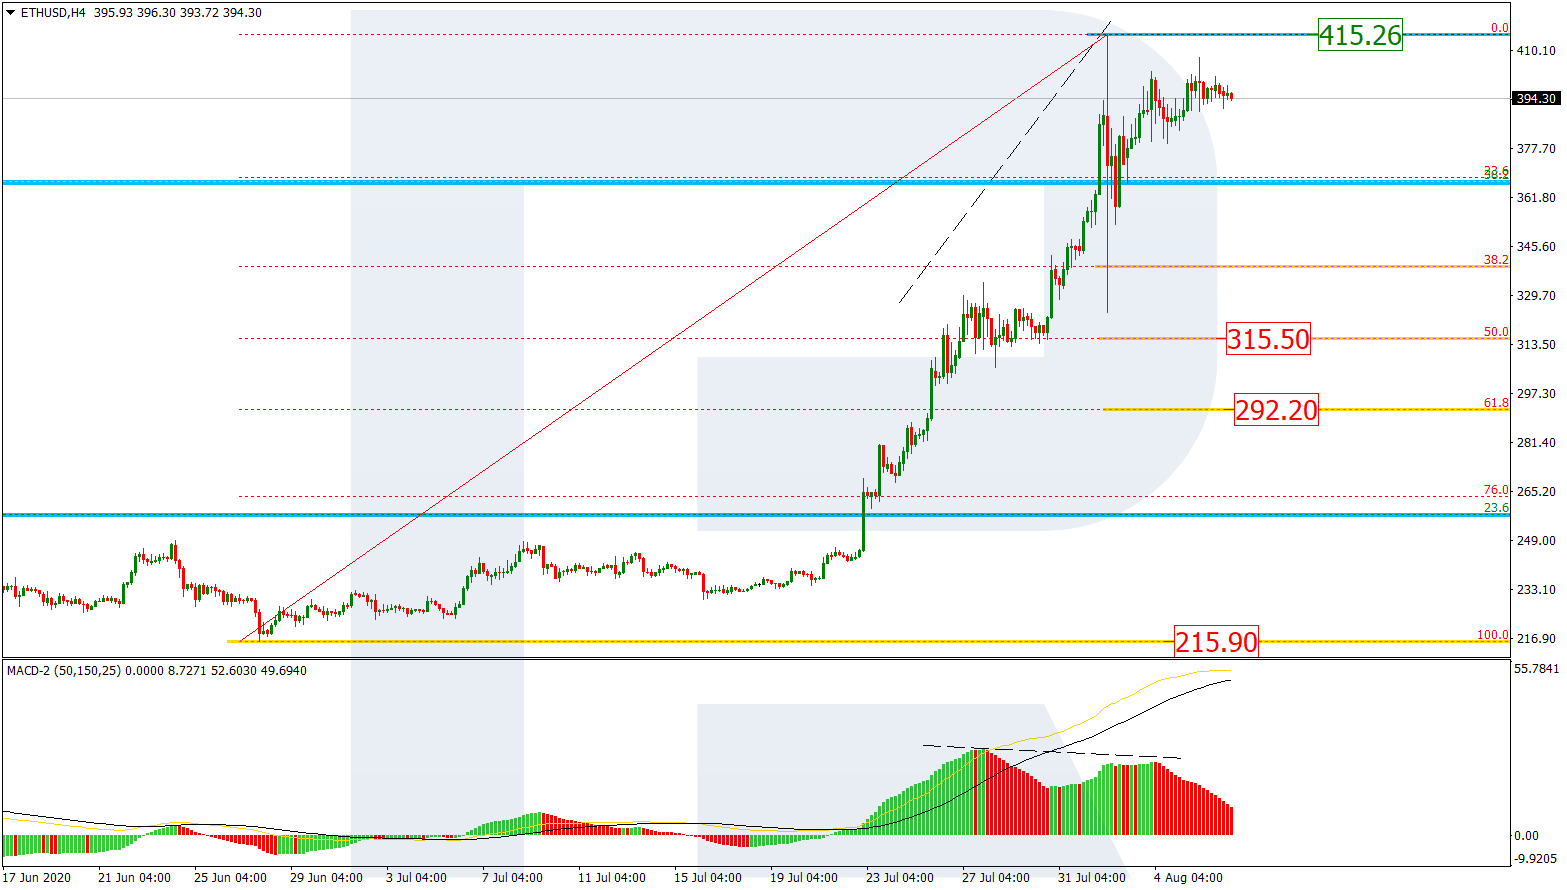
In the H4 chart, earlier, the divergence made the pair start a new descending impulse, which managed to break 38.2% fibo. After that, there was another rising wave, which has stopped close to the high at 415.26. Later, the asset may continue trading downwards to reach 50.0% and 61.8% fibo at 315.50 and 292.20 respectively.

ETHUSD_H4

Article By RoboForex.com

Attention!
Forecasts presented in this section only reflect the author’s private opinion and should not be considered as guidance for trading. RoboForex LP bears no responsibility for trading results based on trading recommendations described in these analytical reviews.

Technical Analysis Feeder Cattle: Rising beef exports bullish for FCATTLE

By IFCMarkets

Rising beef exports bullish for FCATTLE

Last week US Department of Agriculture (USDA) reported export sales of US 2020 beef in the week ended July 23 at 29,500 tons. The sales volume was up 81% from the prior four-week average and a marketing year high. Higher demand for beef as evidenced by exports report is bullish for the FCATTLE. At the same time today USDA will publish data on exports for the week ended July 30, and data showing a reverse trend will be a downside risk for the feeder cattle price.

IndicatorVALUESignal
RSINeutral
MACDSell
Donchian ChannelBuy
MA(200)Buy
FractalsBuy
Parabolic SARBuy


Summary of technical analysis

OrderBuy
Buy stopAbove 146.95
Stop lossBelow 139.15

Market Analysis provided by IFCMarkets

The Analytical Overview of the Main Currency Pairs on 2020.08.07

by JustForex

The EUR/USD currency pair

Technical indicators of the currency pair:
  • Prev Open: 1.18595
  • Open: 1.18763
  • % chg. over the last day: +0.11
  • Day’s range: 1.18197 – 1.18831
  • 52 wk range: 1.0777 – 1.1781

The EUR/USD currency pair has become stable. The trading instrument is consolidating. Investors have taken a wait-and-see attitude before the publication of the report on the US labor market for July. We recommend paying attention to the difference between the actual and forecasted values. Investors also follow the progress of negotiations in Washington on new measures to stimulate the American economy due to the COVID-19 epidemic. At the moment, the local support and resistance levels are 1.1820 and 1.1880, respectively. Positions should be opened from these marks.

The news feed on 2020.08.07:
  • – Report on the US labor market for July at 15:30 (GMT+3:00).
EUR/USD

Indicators do not give accurate signals: the price has fixed between 50 MA and 100 MA.

The MACD histogram has moved into the negative zone, which indicates the bearish sentiment.

Stochastic Oscillator is in the neutral zone, the %K line is above the %D line, which gives a signal to buy EUR/USD.

Trading recommendations
  • Support levels: 1.1820, 1.1800, 1.1740
  • Resistance levels: 1.1880, 1.1915

If the price fixes below 1.1820, EUR/USD quotes are expected to correct. The movement is tending to 1.1760-1.1720.

An alternative could be the growth of the EUR/USD currency pair to 1.1910-1.1950.

The GBP/USD currency pair

Technical indicators of the currency pair:
  • Prev Open: 1.31120
  • Open: 1.31378
  • % chg. over the last day: +0.26
  • Day’s range: 1.30976 – 1.31478
  • 52 wk range: 1.1466 – 1.3516

GBP/USD quotes have become stable after a prolonged rally. At the moment, the British pound is consolidating. Local support and resistance levels are 1.3100 and 1.3155, respectively. A technical correction of the trading instrument is possible in the near future. We expect statistics on the US labor market. Positions should be opened from key levels.

The news feed on the UK economy is calm.

GBP/USD

Indicators do not give accurate signals: the price has crossed the 50 MA and 100 MA.

The MACD histogram has moved into the negative zone, which indicates the bearish sentiment.

Stochastic Oscillator is in the neutral zone, the %K line is above the %D line, which gives a signal to buy GBP/USD.

Trading recommendations
  • Support levels: 1.3100, 1.3040, 1.2980
  • Resistance levels: 1.3155, 1.3185

If the price fixes below 1.3100, GBP/USD quotes are expected to correct. The movement is tending to 1.3050-1.3000.

An alternative could be further growth of the GBP/USD currency pair to 1.3200-1.3230.

The USD/CAD currency pair

Technical indicators of the currency pair:
  • Prev Open: 1.32660
  • Open: 1.32863
  • % chg. over the last day: +0.30
  • Day’s range: 1.32843 – 1.33727
  • 52 wk range: 1.2949 – 1.4668

The USD/CAD currency pair has been growing. During yesterday’s and today’s trading sessions, the growth of quotes exceeded 90 points. The trading instrument has set new local highs. The loonie is under pressure due to the falling of “black gold” prices. At the moment, the Canadian dollar is consolidating in the range of 1.3330-1.3370. Financial market participants expect reports on the labor market in the US and Canada. Positions should be opened from key levels.

At 15:30 (GMT+3:00), data on the labor market will be published in Canada.

USD/CAD

Indicators signal the power of buyers: the price has fixed above 100 MA.

The MACD histogram is in the positive zone, which indicates the bullish sentiment.

Stochastic Oscillator is in the neutral zone, the %K line is below the %D line, which gives a signal to sell USD/CAD.

Trading recommendations
  • Support levels: 1.3330, 1.3290, 1.3255
  • Resistance levels: 1.3370, 1.3400, 1.3420

If the price fixes above 1.3370, further growth in USD/CAD quotes is expected. The movement is tending to 1.3400-1.3420.

An alternative could be a decline in the USD/CAD currency pair to 1.3290-1.3270.

The USD/JPY currency pair

Technical indicators of the currency pair:
  • Prev Open: 105.520
  • Open: 105.496
  • % chg. over the last day: -0.03
  • Day’s range: 105.480 – 105.641
  • 52 wk range: 101.19 – 112.41

The USD/JPY currency pair is being traded in a prolonged flat. There is no defined trend. USD/JPY quotes continue to test the key support and resistance levels: 105.30 and 105.80, respectively. The US labor market report for July is in the spotlight. We also recommend paying attention to the dynamics of US government bonds yield. Positions should be opened from key levels.

The news feed on Japan’s economy is calm enough.

USD/JPY

Indicators do not give accurate signals: 50 MA has crossed 100 MA.

The MACD histogram is near the 0 mark. There are no signals at the moment.

Stochastic Oscillator is in the neutral zone, the %K line has crossed the %D line. There are no signals at the moment.

Trading recommendations
  • Support levels: 105.30, 104.80, 104.20
  • Resistance levels: 105.80, 106.20, 106.45

If the price fixes above 105.80, USD/JPY quotes are expected to grow. The movement is tending to 106.20-106.50.

An alternative could be a decline in the USD/JPY currency pair to 104.80-104.60.

by JustForex

There Is a Variety of Trends on Currency Majors. Investors Expect Data on the US Labor Market

by JustForex

The US dollar has become stable against a basket of currency majors. The US dollar index (#DX) closed yesterday’s trading session with a slight decline (-0.09%). Traders monitor the talks in Washington on new measures to stimulate the American economy. On Wednesday, Democrats and Republicans couldn’t reach a deal on a new package of measures. US Secretary of the Treasury, Steven Mnuchin, said that Republicans and Democrats were “still far away” on the key issues of implementing additional measures. According to White House Chief of Staff, Mark Meadows, if Congress does not reach an agreement, then US President Donald Trump can independently extend the unemployment premiums. Investors also expect the publication of reports on the US labor market today, which may significantly affect market sentiment.

Yesterday, the Bank of England kept its key interest rate unchanged at 0.1%. The regulator also left the volume of the government bond-buying program at 745 billion pounds. The central bank notes that the outlook for the UK and global economies remains uncertain. Further assumptions regarding the growth or decline of economies will depend on the situation with the COVID-19 pandemic.

The “black gold” prices are declining. At the moment, futures for the WTI crude oil are testing the $41.55 mark per barrel. At 17:30 (GMT+3:00), US crude oil inventories will be published.

Market indicators

Yesterday, there was the bullish sentiment in the US stock market: #SPY (+0.67%), #DIA (+0.70%), #QQQ (+1.32%).

The 10-year US government bonds yield is consolidating. At the moment, the indicator is at the level of 0.52-0.53%.

The news feed for 2020.08.07:
  • – Data on the US labor market at 15:30 (GMT+3:00);
  • – Statistics on the labor market in Canada at 15:30 (GMT+3:00);
  • – Ivey PMI in Canada at 17:00 (GMT+3:00).

by JustForex

Is the EUR/USD headed for 1.1900, driven by NFPs, for the weekly close?

By Admiral Markets

Source: Economic Events August 7, 2020 – Admiral Markets’ Forex Calendar

The Euro continued to profit from ongoing US dollar weakness and the drift lower in US Treasury yields which closed at new all-time lows.

In fact, the USD weakness for the start of this trading week may come as a surprise to some after recent US economic projections. Some, like Monday’s ISM Manufacturing data set, continued to improve, coming in at 54.2 in July against an expected 53.6, with new orders having risen sharply (61.5 vs 56.4 in June).

Traders were probably smelling something fishy given the failed attempt for US yields to gain momentum and, in fact, Wednesday’s ADP payrolls saw a huge miss, rising by a meagre 167,000 compared to an expected 1.2 million, showing that only 40% of lost jobs have been recovered out of the total 19.7 million jobs lost since March and due to the Corona lockdown.

So, with expectations rising that the Fed will continue to weaken the US dollar by putting further pressure on US yields as they are expected to go for a run as low as 0%, which leaves the US dollar in a lose-lose situation. If better-than-expected NFPs don’t deliver the fuel for a EUR/USD correction, disappointing NFPs (which are likely, given the ADP miss) could accelerate the move higher in the currency pair, pushing the EUR/USD towards 1.1900 into the weekly close.

Nevertheless, from a trader’s perspective, we’d prefer a short-term correction towards 1.1400/30 since this would deliver a trading setup with a more attractive risk-reward ratio.

Technically, the mode stays bullish on a daily time-frame as long as we trade above 1.1150/1200:

EUR/USD daily chart

Source: Admiral Markets MT5 with MT5-SE Add-on EUR/USD Daily chart (between June 7, 2019, to August 6, 2020). Accessed: August 6, 2020, at 10:00pm GMTPlease note: Past performance is not a reliable indicator of future results, or future performance.

In 2015, the value of the EUR/USD fell by 10.2%, in 2016, it fell by 3.2%, in 2017, it increased by 13.92%, 2018, it fell by 4.4%, 2019, it fell by 2.2%, meaning that after five years, it was down by 7.3%.

Discover the world’s #1 multi-asset platform

Admiral Markets offers professional traders the ability to trade with a custom, upgraded version of MetaTrader 5, allowing you to experience trading at a significantly higher, more rewarding level. Experience benefits such as the addition of the Market Heat Map, so you can compare various currency pairs to see which ones might be lucrative investments, access real-time trading data, and so much more. Click the banner below to start your FREE download of MT5 Supreme Edition!

Download MetaTrader 5 and begin trading today!

Disclaimer: The given data provides additional information regarding all analysis, estimates, prognosis, forecasts or other similar assessments or information (hereinafter “Analysis”) published on the website of Admiral Markets. Before making any investment decisions please pay close attention to the following:

  1. This is a marketing communication. The analysis is published for informative purposes only and are in no way to be construed as investment advice or recommendation. It has not been prepared in accordance with legal requirements designed to promote the independence of investment research, and that it is not subject to any prohibition on dealing ahead of the dissemination of investment research.
  2. Any investment decision is made by each client alone whereas Admiral Markets shall not be responsible for any loss or damage arising from any such decision, whether or not based on the Analysis.
  3. Each of the Analysis is prepared by an independent analyst (Jens Klatt, Professional Trader and Analyst, hereinafter “Author”) based on the Author’s personal estimations.
  4. To ensure that the interests of the clients would be protected and objectivity of the Analysis would not be damaged Admiral Markets has established relevant internal procedures for prevention and management of conflicts of interest.
  5. Whilst every reasonable effort is taken to ensure that all sources of the Analysis are reliable and that all information is presented, as much as possible, in an understandable, timely, precise and complete manner, Admiral Markets does not guarantee the accuracy or completeness of any information contained within the Analysis. The presented figures refer that refer to any past performance is not a reliable indicator of future results.
  6. The contents of the Analysis should not be construed as an express or implied promise, guarantee or implication by Admiral Markets that the client shall profit from the strategies therein or that losses in connection therewith may or shall be limited.
  7. Any kind of previous or modeled performance of financial instruments indicated within the Publication should not be construed as an express or implied promise, guarantee or implication by Admiral Markets for any future performance. The value of the financial instrument may both increase and decrease and the preservation of the asset value is not guaranteed.
  8. The projections included in the Analysis may be subject to additional fees, taxes or other charges, depending on the subject of the Publication. The price list applicable to the services provided by Admiral Markets is publicly available from the website of Admiral Markets.

Leveraged products (including contracts for difference) are speculative in nature and may result in losses or profit. Before you start trading, you should make sure that you understand all the risks.

By Admiral Markets