10-Year Treasury Note Speculators edged their bullish bets higher, up for 5th time in 6 weeks

By CountingPips.comReceive our weekly COT Reports by Email


10-Year Note Non-Commercial Speculator Positions:

Large bond speculators increased their bullish net positions in the 10-Year Note futures markets again this week, according to the latest Commitment of Traders (COT) data released by the Commodity Futures Trading Commission (CFTC) on Friday.

The non-commercial futures contracts of 10-Year Note futures, traded by large speculators and hedge funds, totaled a net position of 75,257 contracts in the data reported through Tuesday October 13th. This was a weekly gain of 5,744 net contracts from the previous week which had a total of 69,513 net contracts.

The week’s net position was the result of the gross bullish position (longs) decreasing by -43,266 contracts (to a weekly total of 585,180 contracts) while the gross bearish position (shorts) dropped by a larger amount of -49,010 contracts for the week (to a total of 509,923 contracts).

The 10-Year speculators slightly added to their net bullish bets this week and raised their wagers for the fifth time in the past six weeks. The rise in bullish positions follows a sharp decline last week when spec sentiment fell by -59,063 contracts. The overall standing has now been in bullish territory for six straight weeks (after a dip on Sept. 1st) and has been bullish in sixteen out of the past seventeen weeks.

10-Year Note Commercial Positions:

The commercial traders position, hedgers or traders engaged in buying and selling for business purposes, totaled a net position of -99,519 contracts on the week. This was a weekly decrease of -7,820 contracts from the total net of -91,699 contracts reported the previous week.


10-Year Note Futures:

Over the same weekly reporting time-frame, from Tuesday to Tuesday, the 10-Year Note Futures (Front Month) closed at approximately $139.20 which was an advance of $0.16 from the previous close of $139.04, according to unofficial market data.


*COT Report: The COT data, released weekly to the public each Friday, is updated through the most recent Tuesday (data is 3 days old) and shows a quick view of how large speculators or non-commercials (for-profit traders) as well as the commercial traders (hedgers & traders for business purposes) were positioned in the futures markets.

The CFTC categorizes trader positions according to commercial hedgers (traders who use futures contracts for hedging as part of the business), non-commercials (large traders who speculate to realize trading profits) and nonreportable traders (usually small traders/speculators).

Find CFTC criteria here: (http://www.cftc.gov/MarketReports/CommitmentsofTraders/ExplanatoryNotes/index.htm).

Article By CountingPips.comReceive our weekly COT Reports by Email

Gold Speculators cut back on their bullish bets for 1st time in 3 weeks

By CountingPips.comReceive our weekly COT Reports by Email


Gold Non-Commercial Speculator Positions:

Large precious metals speculators cut back on their bullish net positions in the Gold futures markets this week, according to the latest Commitment of Traders (COT) data released by the Commodity Futures Trading Commission (CFTC) on Friday.

The non-commercial futures contracts of Gold futures, traded by large speculators and hedge funds, totaled a net position of 240,671 contracts in the data reported through Tuesday October 13th. This was a weekly decrease of -7,916 net contracts from the previous week which had a total of 248,587 net contracts.

The week’s net position was the result of the gross bullish position (longs) advancing by 6,064 contracts (to a weekly total of 326,986 contracts) while the gross bearish position (shorts) rose by a larger amount of 13,980 contracts for the week (to a total of 86,315 contracts).

Gold speculators trimmed their bullish positions this week for this first time in three weeks. Over the previous two weeks, the bullish position had risen by approximately +30,000 net contracts and brought the overall standing to the highest of the past ten weeks. Despite this week’s decline, the net standing has remained above the +240,000 contract level for the three straight weeks and the bullish position has now been at least +200,000 net contracts for seventy consecutive weeks, dating back to June of 2019.

Gold Commercial Positions:

The commercial traders position, hedgers or traders engaged in buying and selling for business purposes, totaled a net position of -284,655 contracts on the week. This was a weekly increase of 3,813 contracts from the total net of -288,468 contracts reported the previous week.


Gold Futures:

Over the same weekly reporting time-frame, from Tuesday to Tuesday, the Gold Futures (Front Month) closed at approximately $1888.50 which was a shortfall of $-12.60 from the previous close of $1901.10, according to unofficial market data.


*COT Report: The COT data, released weekly to the public each Friday, is updated through the most recent Tuesday (data is 3 days old) and shows a quick view of how large speculators or non-commercials (for-profit traders) as well as the commercial traders (hedgers & traders for business purposes) were positioned in the futures markets.

The CFTC categorizes trader positions according to commercial hedgers (traders who use futures contracts for hedging as part of the business), non-commercials (large traders who speculate to realize trading profits) and nonreportable traders (usually small traders/speculators).

Find CFTC criteria here: (http://www.cftc.gov/MarketReports/CommitmentsofTraders/ExplanatoryNotes/index.htm).

Article By CountingPips.comReceive our weekly COT Reports by Email

VIX Speculators raised their bearish bets to 34-week high

By CountingPips.comReceive our weekly COT Reports by Email

VIX Non-Commercial Speculator Positions:

Large volatility speculators boosted their bearish net positions in the VIX futures markets this week, according to the latest Commitment of Traders (COT) data released by the Commodity Futures Trading Commission (CFTC) on Friday.

The non-commercial futures contracts of VIX futures, traded by large speculators and hedge funds, totaled a net position of -101,939 contracts in the data reported through Tuesday October 13th. This was a weekly change of -8,388 net contracts from the previous week which had a total of -93,551 net contracts.

The week’s net position was the result of the gross bullish position (longs) sinking by -1,907 contracts (to a weekly total of 36,963 contracts) while the gross bearish position (shorts) rose by 6,481 contracts for the week (to a total of 138,902 contracts).

VIX speculators increased their bearish positions higher this week for a second consecutive week. This rise has now pushed the overall bearish standing back over the -100,000 contract threshold and to the highest level of the past thirty-four weeks, dating back to February 18th. Despite the heavy turmoil that the coronavirus inflicted upon the markets this year, the VIX never flipped over into bullish territory as speculator positions have remained bearish now for ninety-two consecutive weeks, dating all the way back to January 8th of 2019.

VIX Commercial Positions:

The commercial traders position, hedgers or traders engaged in buying and selling for business purposes, totaled a net position of 104,708 contracts on the week. This was a weekly advance of 9,676 contracts from the total net of 95,032 contracts reported the previous week.


VIX Futures:

Over the same weekly reporting time-frame, from Tuesday to Tuesday, the VIX Futures (Front Month) closed at approximately $26.88 which was a decline of $-4.67 from the previous close of $31.55, according to unofficial market data.


*COT Report: The COT data, released weekly to the public each Friday, is updated through the most recent Tuesday (data is 3 days old) and shows a quick view of how large speculators or non-commercials (for-profit traders) as well as the commercial traders (hedgers & traders for business purposes) were positioned in the futures markets.

The CFTC categorizes trader positions according to commercial hedgers (traders who use futures contracts for hedging as part of the business), non-commercials (large traders who speculate to realize trading profits) and nonreportable traders (usually small traders/speculators).

Find CFTC criteria here: (http://www.cftc.gov/MarketReports/CommitmentsofTraders/ExplanatoryNotes/index.htm).

Article By CountingPips.comReceive our weekly COT Reports by Email

Brexit: “The only certainty is more uncertainty for investors”

By George Prior

As UK Prime Minister Boris Johnson puts Britain on notice for a no-deal Brexit, many businesses and individuals will act swiftly to protect their wealth by considering international options, affirms the CEO of one of the world’s largest independent financial advisory and fintech organizations.

The prediction from Nigel Green, the chief executive and founder of deVere Group, which has $12bn under advisement, comes as Boris Johnson is reported as saying that the EU has abandoned the idea of a free trade deal and unless the EU makes major changes to its stance, the UK will opt for no-deal.

The PM went on to suggest that Britain now prepares for such an arrangement.

Mr Green notes: “Johnson has told Britain to get ready for an ‘Australian solution’ to Brexit but still has not yet ended trade talks with the European Union altogether.

“Indeed, the EU is preparing for more trade talks in London next week, because the Prime Minister did not explicitly say he was walking away from negotiations.

“Are Johnson’s comments posturing? Is it a bluff? Who knows.

“What we do know is that 2020’s only certainty is more uncertainty.”

The deVere CEO continues: “The uncertainty will make the UK and international investors already invested in UK-based financial assets increasingly nervous.

“The fallout surrounding a no-deal scenario Brexit will prompt an increasing number of them to consider alternative overseas options in order to protect their wealth through various established international financial solutions.”

Financial markets loathe uncertainty. On the back of Boris Johnson’s statement, the pound – seen as a Brexit bellwether – was down 0.2% against the euro and down 0.1% against the dollar.

“Should the UK leave with no-deal, the already weak pound – which is one of the world’s worst-performing currencies this year – is likely to remain weak for several years to come until Britain and the EU readjust,” observes Mr Green.

It has already shed about 20% of its value since the EU referendum in 2016.

“A low pound can help to reduce people’s purchasing power and lead to a drop in UK living standards. Weaker sterling means imports are more expensive, with rising costs being passed on to consumers.

“The drop in sterling is good for UK exports some insist, however around half of the country’s exports rely on imported components. These will become more expensive as the pound falls in value.

“In addition, a weaker pound is, of course, bad news for British expats, amongst others, who receive income or pensions in sterling and for Brits looking to travel overseas.”

The deVere CEO concludes: “As the Brexit uncertainty heightens, we can expect current and potential domestic and overseas investors to increasingly look to other jurisdictions.”

About:

deVere Group is one of the world’s largest independent advisors of specialist global financial solutions to international, local mass affluent, and high-net-worth clients.  It has a network of more than 70 offices across the world, over 80,000 clients and $12bn under advisement.

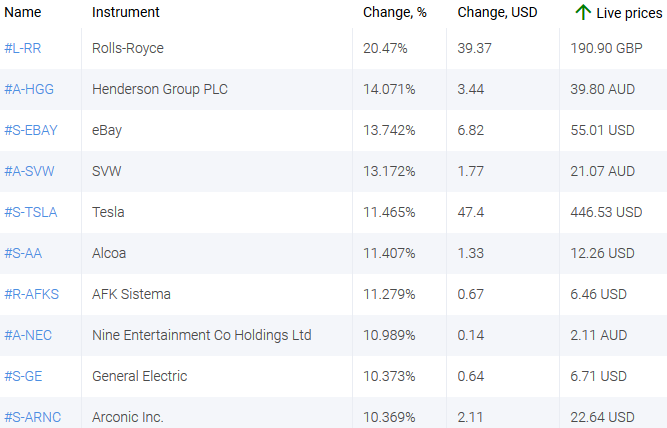
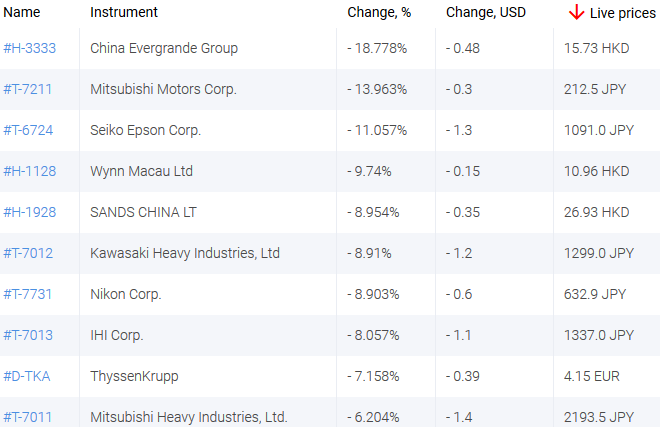
Rolls-Royce, Henderson Group, eBay, China Evergrande & Mitsubishi lead Weekly Top Gainers/Losers

By IFCMarkets.com

Top Gainers – The World Market

The euro and the US dollar weakened amid the ECB’s and the Fed’s plans to mitigate their monetary policy in order to expand economic stimulus. The Swedish krona strengthened against the backdrop of falling inflation and unemployment in September. The British pound was bolstered by investors’ hopes for the success of the next round of Brexit talks.

1.Rolls-Royce Group plc, 20,5% – a British manufacturer of aircraft equipment and power plants.

2. Henderson Group PLC, 14,1% – a British financial and investment group.

market sentiment ratio long short positions

 Top Losers – The World Market

1. China Evergrande Group – an integrated residential property developer Iin China

2. Mitsubishi Motors Corp – a Japanese manufacturer of cars and other machinery.

market sentiment ratio long short positions

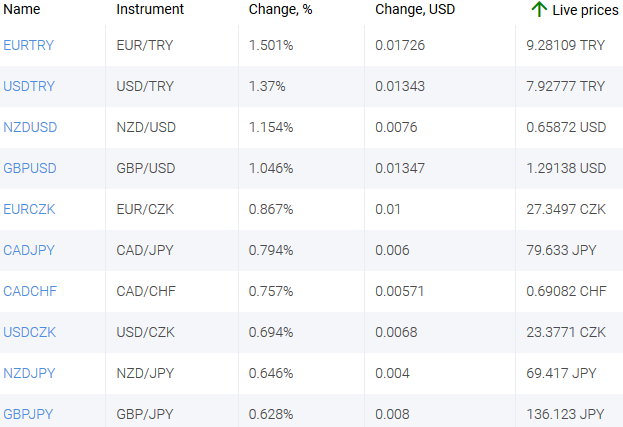
 Top Gainers – Foreign Exchange Market (Forex)

1. EURTRY, USDTRY – the growth of these charts means the strengthening of the US dollar and the euro against the Turkish lira.

2. NZDUSD, GBPUSD – the growth of these charts means the weakening of the US dollar against the New Zealand dollar and the British pound.

market sentiment ratio long short positions

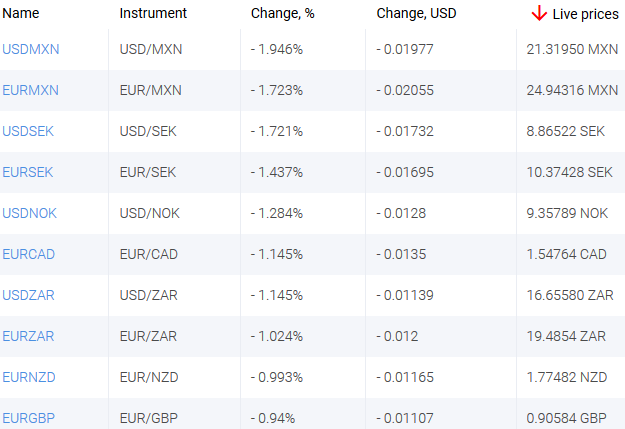
 Top Losers – Foreign Exchange Market (Forex)

1. USDMXN, EURMXN – the drop of these charts means the weakening of the US dollar and euro against the Mexican peso.

2. USDSEK, EURSEK – the drop of these charts means the weakening of the euro and the US dollar against the Swedish krona.

market sentiment ratio long short positions
Market Analysis provided by IFCMarkets.com

Is Bitcoin set to have a 2017-style mini-boom this year?

By George Prior

Bitcoin’s price is set to “surge before the end of 2020” with investors keen not to “sleepwalk” through a 2017-style mini-boom, says the CEO of one of the world’s largest independent financial advisory and fintech organizations.

The prediction from Nigel Green, the deVere Group CEO and founder, which has $12bn under advisement, comes as Bitcoin – already one of the best-performing assets this year – appears to be on the brink of a bullish breakout.

In recent days, Square, which is owned by the billionaire founders of Twitter, has allocated 1% of its cash reserves to the cryptocurrency, whilst a former Goldman Sachs hedge fund chief says the price of Bitcoin will jump to $1m in five years.

Mr Green comments: “There’s been something of an avalanche of interest in Bitcoin in recent weeks from household-name investors.

“Investor activity is picking up considerably with various on-chain metrics and ongoing – and heightening – global political, economic and social turbulence suggesting that there will be a price surge before the end of the year.

“Like gold, Bitcoin can be expected to retain its value or even grow in value when other assets fall, therefore enabling investors to reduce their exposure to losses. Investors will increase exposure to decentralized, non-sovereign, secure digital currencies, such as Bitcoin, to help shield them from the potential issues in traditional markets”.

He continues: “There’s a growing sense that we’re set to experience a mini-boom similar to that at the end of 2017.

“Prices are yet to catch-up with investor interest – but this is only a matter of time as investors will not want to sleepwalk towards perhaps year-high prices in the run-up to the end of 2020.”

The late 2017 bull run saw the Bitcoin price reach its all-time high of $20,089.

The deVere CEO concludes: “There’s been a notable ramping-up of interest in Bitcoin amongst investors since the end of summer. Indeed, it has been the best performing week for one of the year’s best-performing assets since July.

“I can see no reason why this upward trajectory will not continue between now and the end of the year.”

About:

deVere Group is one of the world’s largest independent advisors of specialist global financial solutions to international, local mass affluent, and high-net-worth clients.  It has a network of more than 70 offices across the world, over 80,000 clients and $12bn under advisement.


Forex Technical Analysis & Forecast 16.10.2020

Article By RoboForex.com

EURUSD, “Euro vs US Dollar”

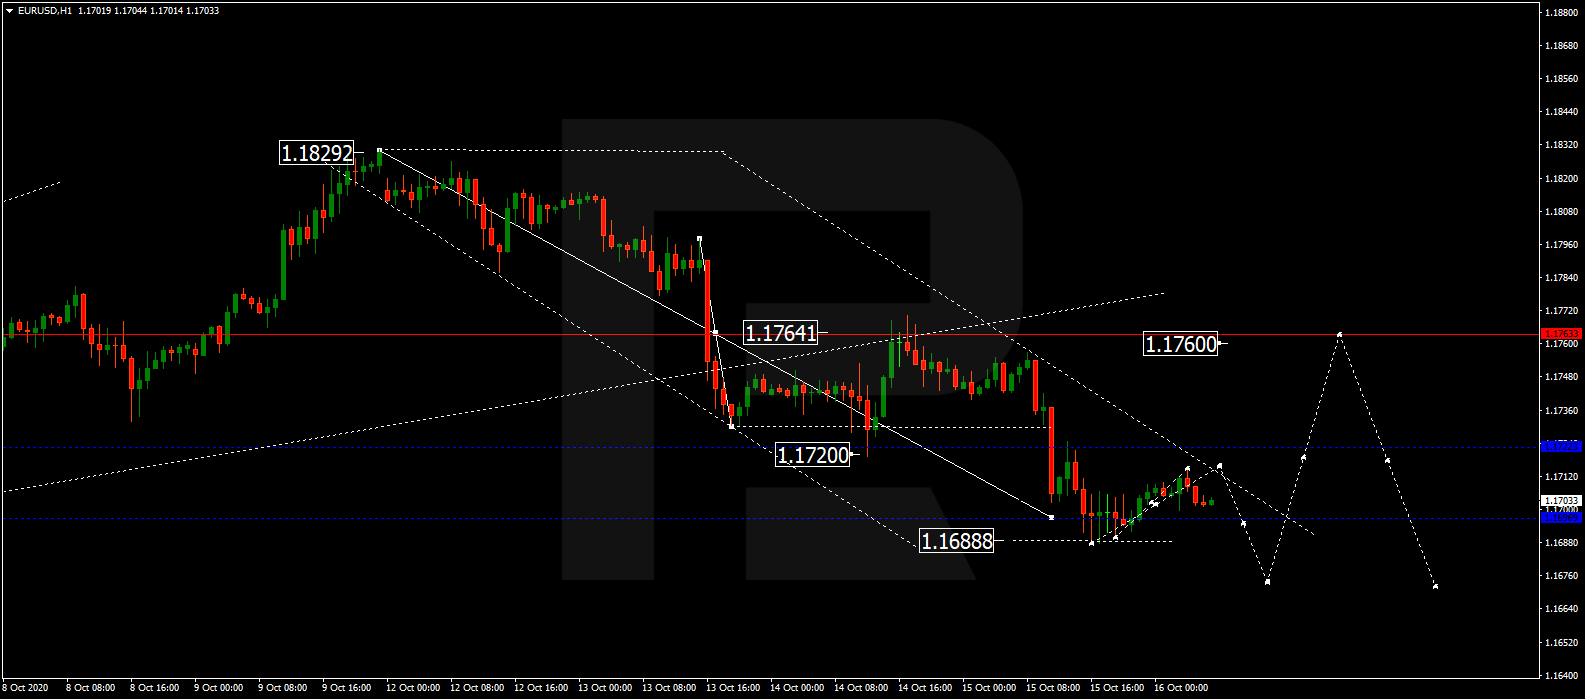
After completing the descending wave at 1.1698, EURUSD is consolidating above this level. Possibly, the pair may expand the range up to 1.1717 and then down to 1.1678. If later the price breaks this range to the upside, the market may start a new correction with the target at 1.1760; if to the downside – resume trading downwards to reach 1.1600.

EURUSD
Risk Warning: the result of previous trading operations do not guarantee the same results in the future

GBPUSD, “Great Britain Pound vs US Dollar”

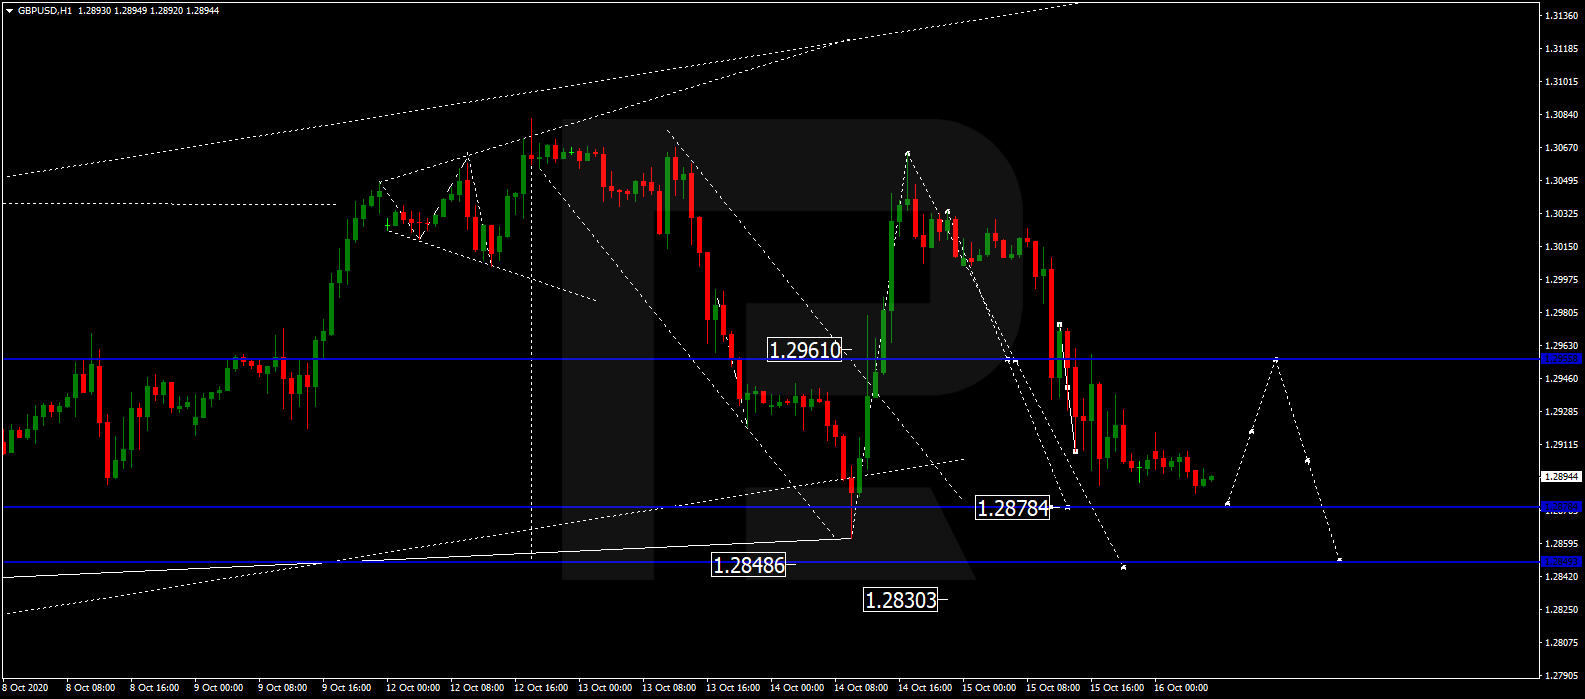
After finishing the descending structure at 1.2960 and breaking this level to the downside, GBPUSD continues falling to reach 1.2848. After that, the instrument may correct towards 1.2960 and then form a new descending structure with the first target at 1.2830.

GBPUSD
Risk Warning: the result of previous trading operations do not guarantee the same results in the future

USDRUB, “US Dollar vs Russian Ruble”

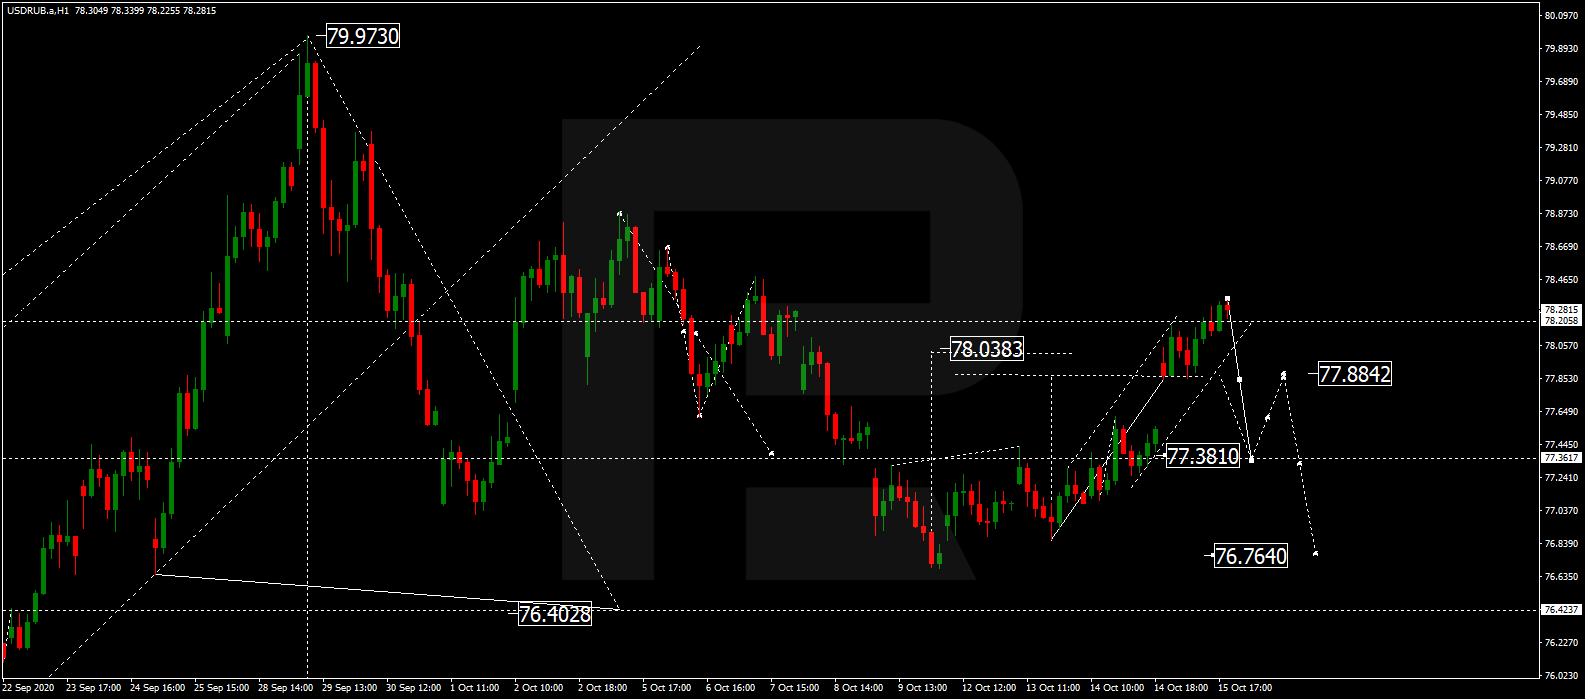
After completing the ascending correctional structure at 78.28, USDRUB is expected to break this correctional channel to the downside and resume trading downwards with the first target at 76.40.

USDRUB
Risk Warning: the result of previous trading operations do not guarantee the same results in the future

USDJPY, “US Dollar vs Japanese Yen”

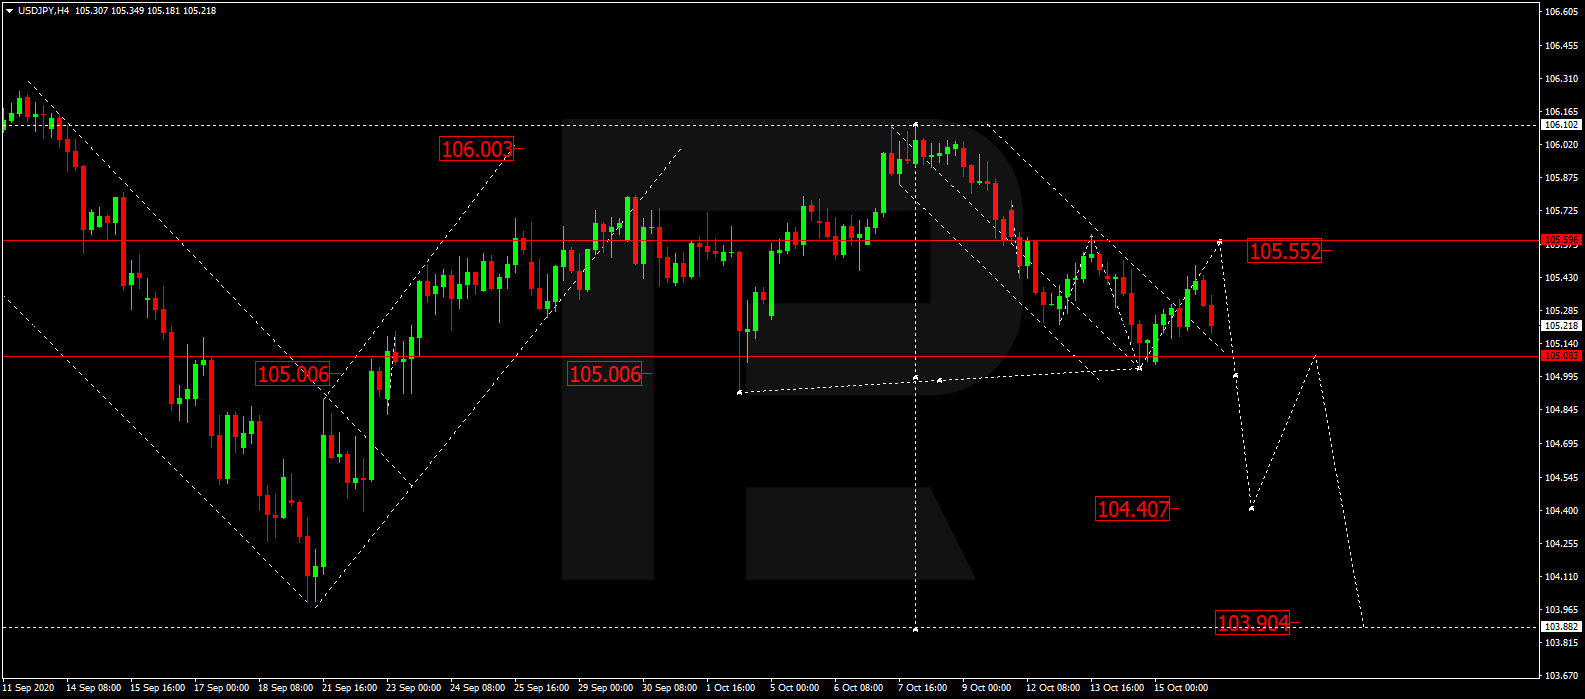
USDJPY is still consolidating above 105.00. Possibly, the pair may correct and expand the range up to 105.55 and then fall to return to 105.00. After that, the instrument may break the later level and continue moving downwards with the short-term target at 104.40.

USDJPY
Risk Warning: the result of previous trading operations do not guarantee the same results in the future

USDCHF, “US Dollar vs Swiss Franc”

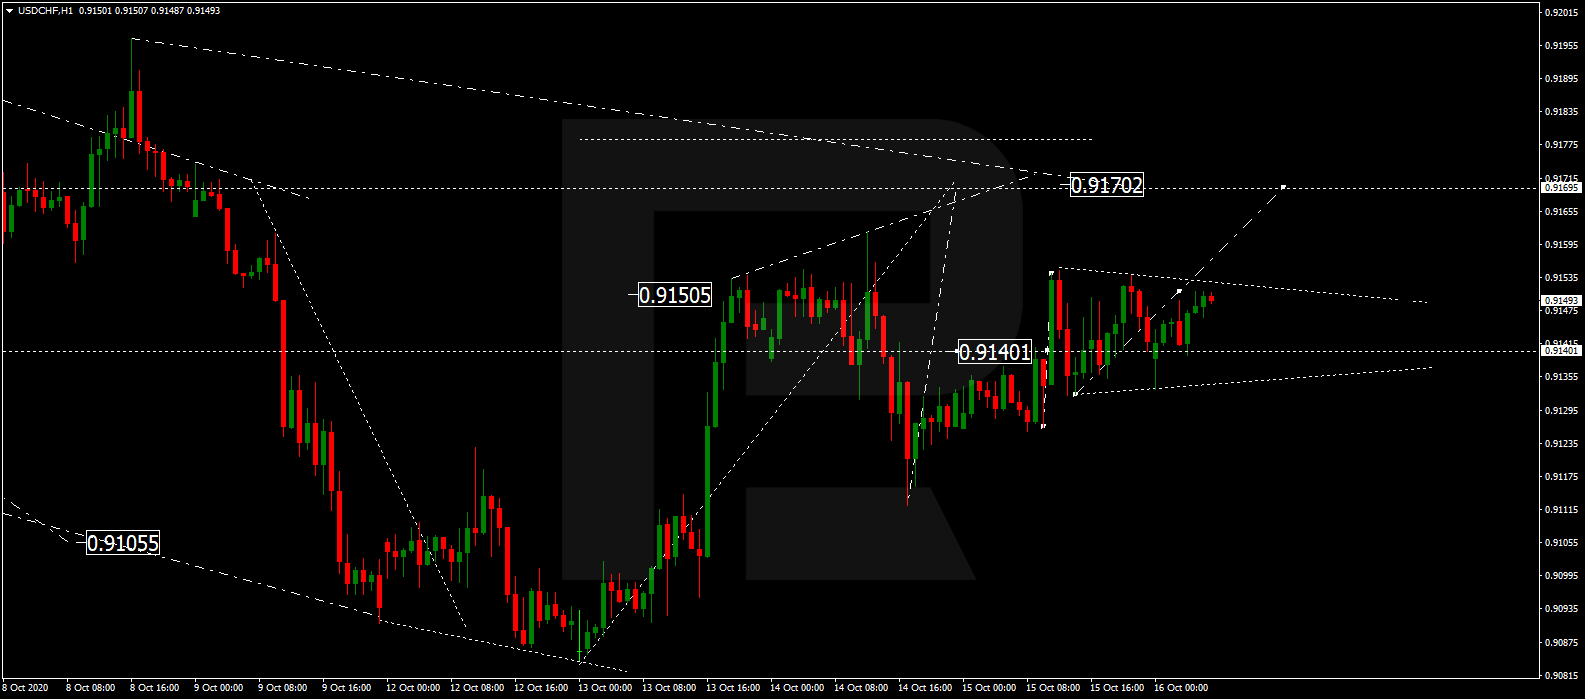
USDCHF is still consolidating around 0.9140. Possibly, today the pair may expand the range up to 0.9170 and then start a new correction to reach 0.9127. Later, the market may form one more ascending structure with the target at 0.9225.

USDCHF
Risk Warning: the result of previous trading operations do not guarantee the same results in the future

AUDUSD, “Australian Dollar vs US Dollar”

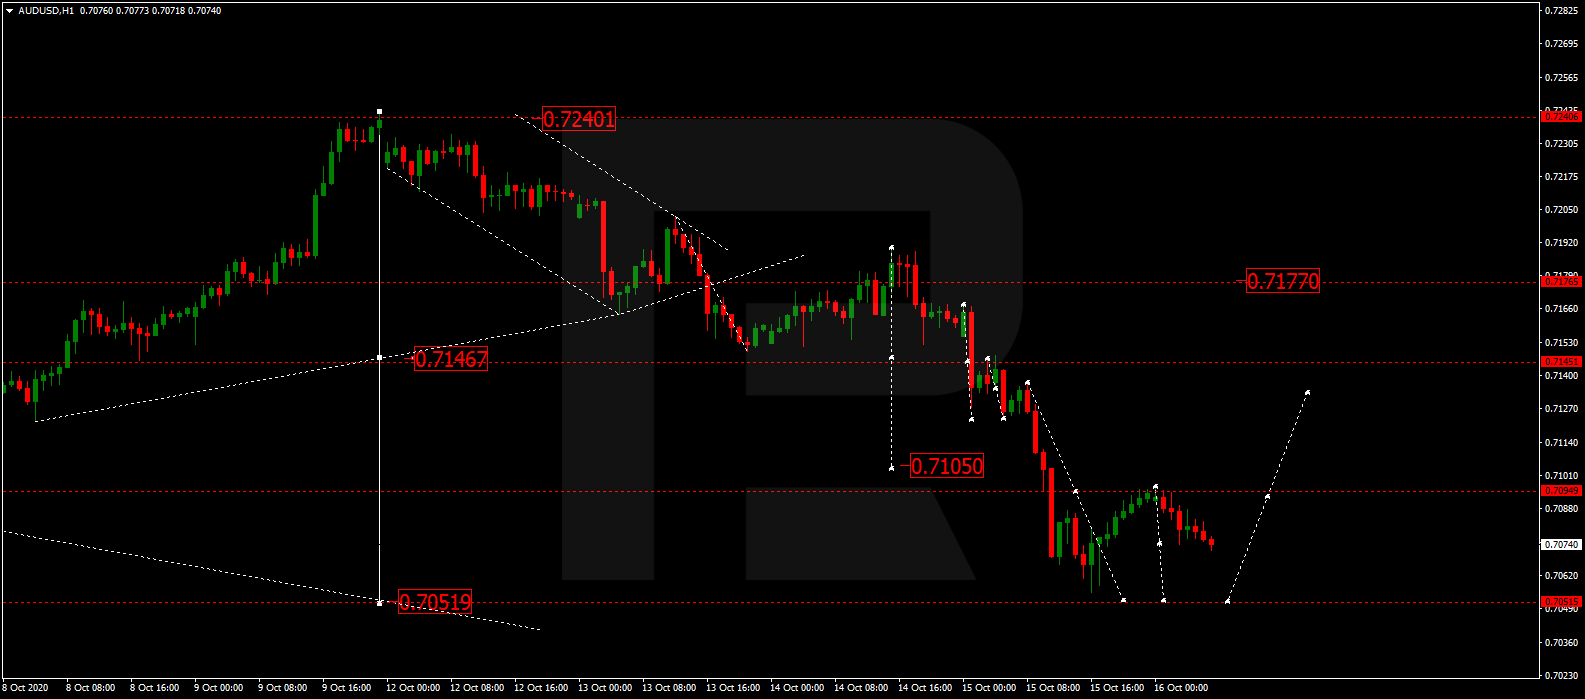
AUDUSD is still falling towards 0.7052. Today, the pair may reach this level and then consolidate around it. If later the price breaks this range to the upside, the market may correct with the target at 0.7140.

AUDUSD
Risk Warning: the result of previous trading operations do not guarantee the same results in the future

BRENT

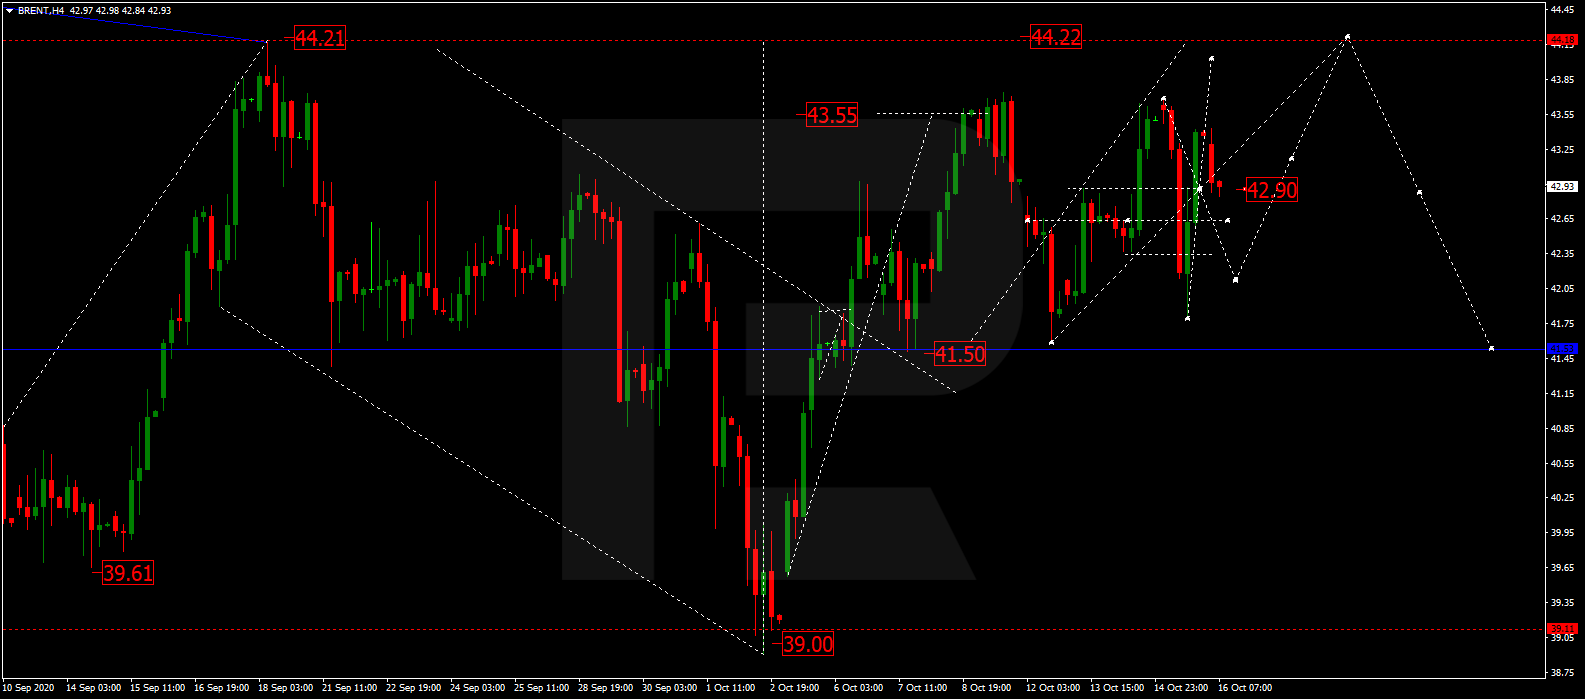
Brent is still consolidating around 42.60. Possibly, the asset may fall towards 41.50 and then form one more ascending structure to reach 44.22, at least. Later, the market may correct to return to 41.50 and then resume growing with the target at 46.50.

BRENT
Risk Warning: the result of previous trading operations do not guarantee the same results in the future

XAUUSD, “Gold vs US Dollar”

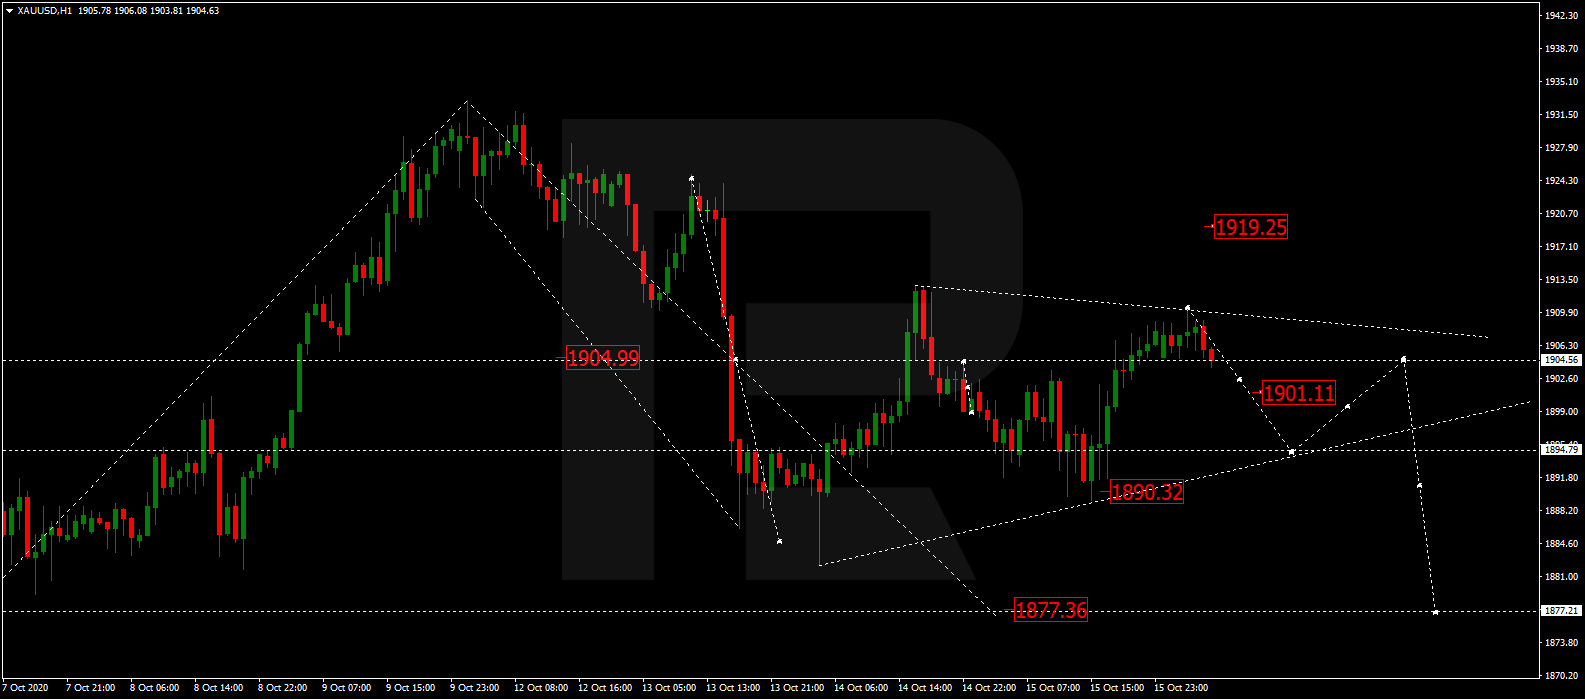
After finishing the descending wave at 1890.50, Gold has returned to 1905.50; right now, it is consolidating around the latter level. If later the price breaks this range to the upside, the market may continue the correction with the target at 1919.19 and then resume trading downwards to reach 1880.00.

GOLD
Risk Warning: the result of previous trading operations do not guarantee the same results in the future

BTCUSD, “Bitcoin vs US Dollar”

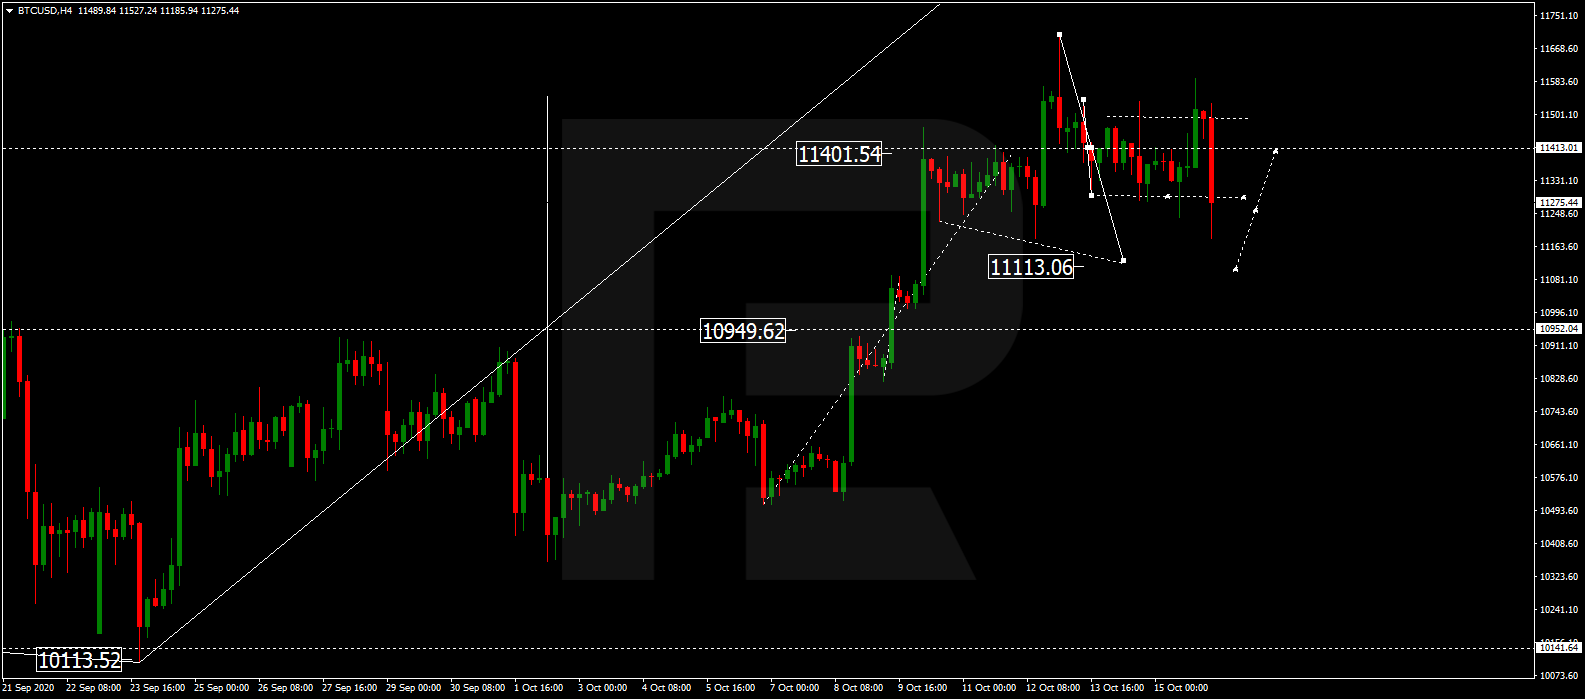
BTCUSD is still consolidating around 11400.00 without any particular direction. According to the main scenario, the price is expected to fall towards 11111.00. Later, the market may correct to test 11400.00 from below and then resume falling with the target at 10900.00.

BTCUSD
Risk Warning: the result of previous trading operations do not guarantee the same results in the future

S&P 500

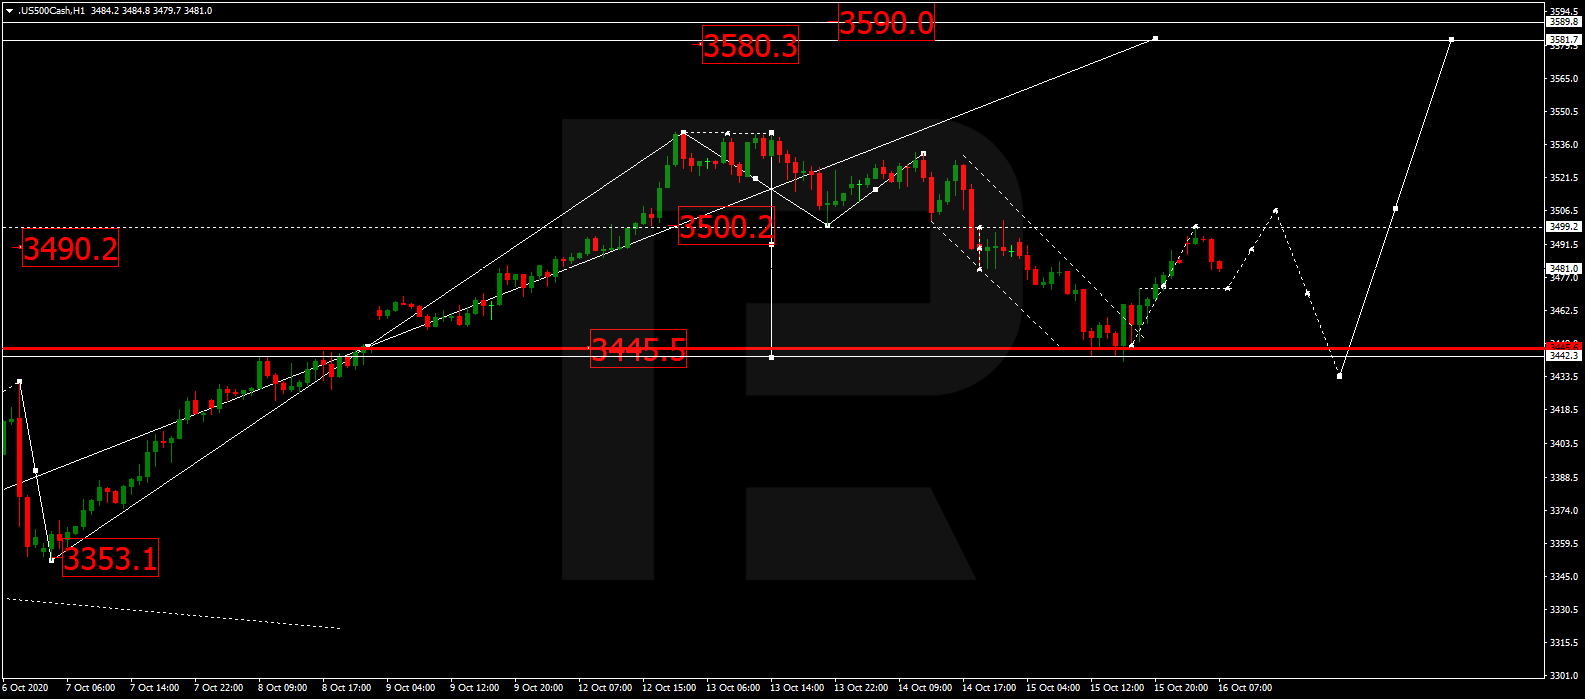
After finishing the descending wave at 3447.5 and almost eliminating the gap, the S&P index has completed the ascending structure towards 3500.0. Possibly, today the asset may reach 3506.6 and then start a new decline with the target at 3440.0. After that, the instrument may form one more ascending structure to reach 3580.0.

S&P500

Article By RoboForex.com

Attention!
Forecasts presented in this section only reflect the author’s private opinion and should not be considered as guidance for trading. RoboForex LP bears no responsibility for trading results based on trading recommendations described in these analytical reviews.

Stepping GAP Patterns May Suggest Upside Breakout Pending In Natural Gas/UNG

By TheTechnicalTraders 

– An upward stepping GAP pattern for UNG and Natural Gas has our research team believing a strong upside price breakout may be pending. We believe the open gap patterns, which are below the current price levels, represent a building momentum based/bottom that has setup in UNG.  This pattern, if we are correct, may prompt a big breakout move in the near future.

THREE GAPS PATTERN & MOMENTUM BASE COMPLETE – WHAT NEXT?

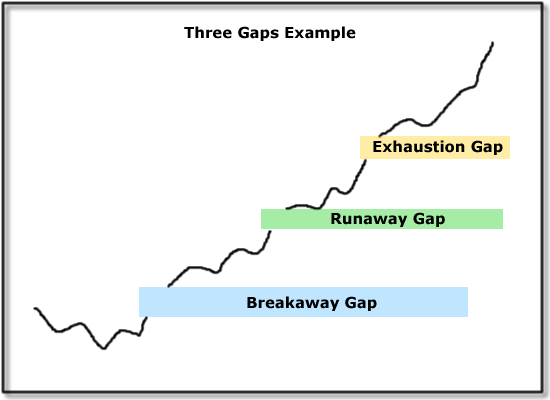
These GAP patterns are similar to a Japanese Candlestick pattern called “Three Gaps”.  A Three Gaps pattern is typically associated with trending and suggests an exhaustion top may be near.  It is represented by three very clear open price gaps in a defined trend (up or down), as can be seen in the chart below.

As you can see, a clearly defined trend has extended higher while three clear price gaps have taken place.  The first is considered the Breakaway Gap.  The second is considered the Runaway Gap, and the last is considered the Exhaustion Gap.

It is fairly easy to understand how these Gaps translate into trends.  The first price gap usually represents a strong trend has initiated where price breaks away from previous price ranges.  The second gap takes place within the trend and represents trend momentum forcing a price gap to take place.  The last gap represents momentum reaching extreme levels, prompting another gap, yet getting closer to an exhaustion top or peak.

Be sure to sign up for our free market trend analysis and signals now so you don’t miss our next special report!

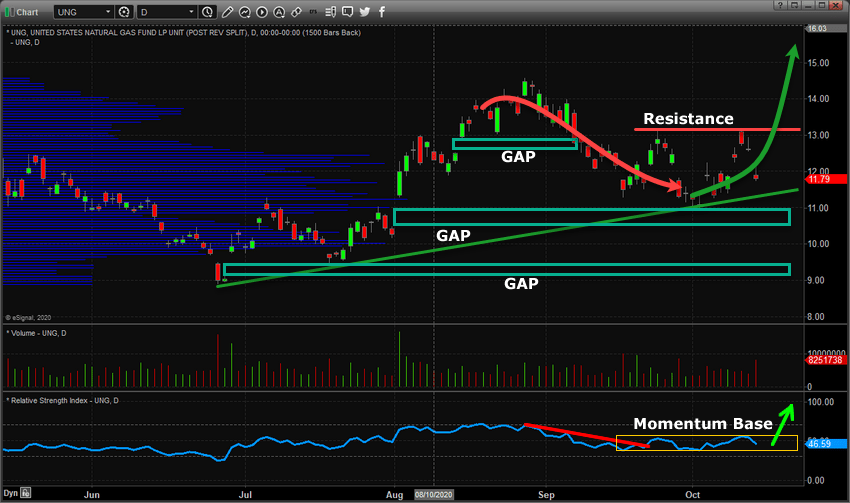
Take a look at the UNG Daily chart below.  A very clear series of Three Gaps has completed before the start of September 2020.  Then, an Exhaustion Peak rolled price levels lower – reaching just above the $11.00 level.  This created a new Momentum Base setup above the Runaway Gap level.  Our researchers believe that because the Breakaway and Runaway Gap levels are still “open”, a potentially new upward price trend may setup prompting another set of Three Gaps as price accelerates above the $13 to $14 price level.

The Exhaustion Gap above was filled by the downward price rotation recently. This suggests the momentum from the Breakaway and Runaway Gaps is still valid, and a new upside price trend may prompt a big rally in Natural Gas and UNG over the next 30+ days.

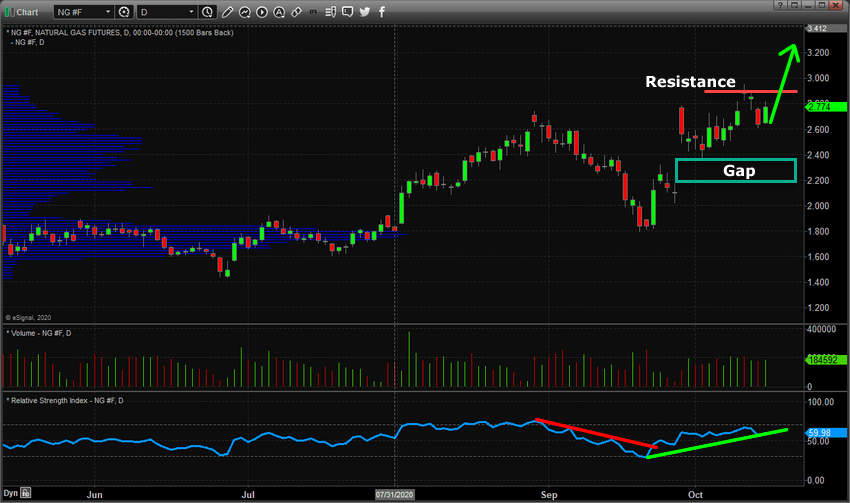
The Natural Gas Futures Daily chart below shows a very clear price gap that took place on the contract rollover date.  This suggests the new month’s price levels represent a perceived higher valuation than the expired month’s contract.  Our researchers believe this provides further indication that a bullish rally phase may be pending in Natural Gas.

What becomes more important than the Gap at this time is that the current price levels have allowed the gap to stay OPEN.  Thus, the bullish momentum is strong enough at this time to prevent the rollover gap from being CLOSED.

We believe any upside price rally above $2.95 to $3.00 may prompt a breakout rally, possibly creating or prompting a new Runaway Gap pattern, as the price of Natural Gas extends to new Yearly highs.  If this rally is similar to the 2018 rally in Natural Gas, price levels above $4.00 to $4.25 are not out of the question.

Skilled technical traders should prepare for one of two options going forward; a breakout above the $3.00 price level in Natural Gas – prompting a new breakout bullish price trend, or a continued downside price rotation where the open gap is retested, which would create a new momentum base near $2.40.  This is a chart that technical traders must have on their watch lists right now.  The opportunity for a big breakout trend is likely just a few days or weeks away.

As a technical analyst and trader since 1997, I have been through a few bull/bear market cycles in stocks and commodities. I believe I have a good pulse on the market and timing key turning points for investing and short-term swing traders.  If you want to learn how to become a better trader and investor, visit TheTechnicalTraders.com to learn how we can help you make money with our swing and investing signals. Don’t miss all the incredible trends and trade setups, sign up today.

Chris Vermeulen
Chief Market Strategist
www.TheTechnicalTraders.com

NOTICE AND DISCLAIMER: Our free research does not constitute a trade recommendation or solicitation for our readers to take any action regarding this research.  It is provided for educational purposes only to our subscribers and not intended to be acted upon.  Read our FULL DISCLAIMER here.


Fibonacci Retracements Analysis 16.10.2020 (BITCOIN, ETHEREUM)

Article By RoboForex.com

BTCUSD, “Bitcoin vs US Dollar”

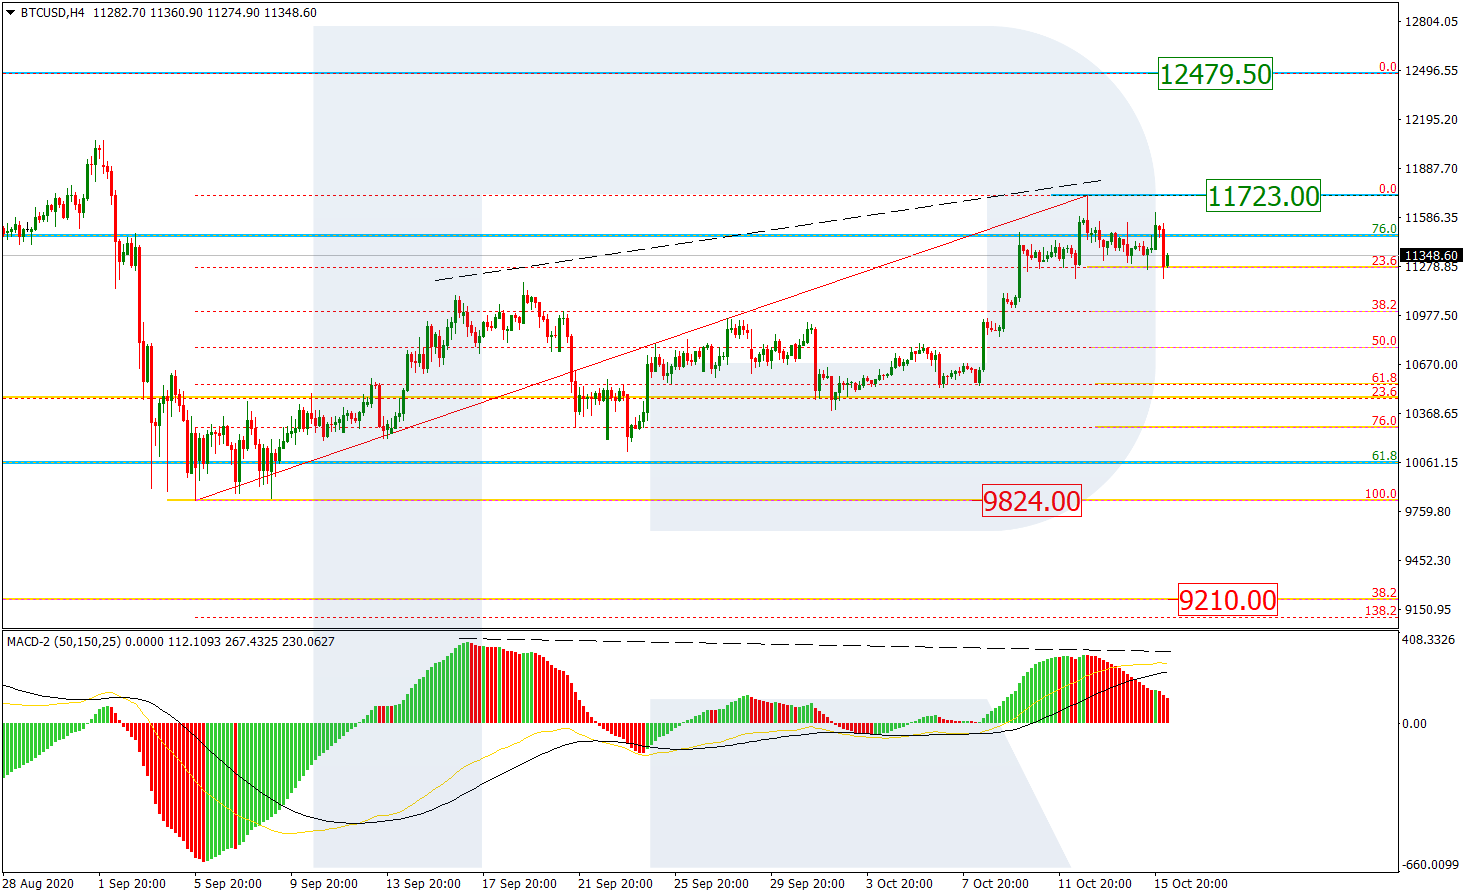
In the H4 chart, there is a divergence on MACD, which may indicate further growth towards the high at 12479.50 but only after the price breaks the current high at 11723.00. However, the main scenario implies that the BTCUSD may continue falling with the short-term target at the low at 9824.00. After breaking this level, the next descending wave may be heading towards the mid-term 38.2% fibo at 9210.00.

BTCUSD_H4
Risk Warning: the result of previous trading operations do not guarantee the same results in the future

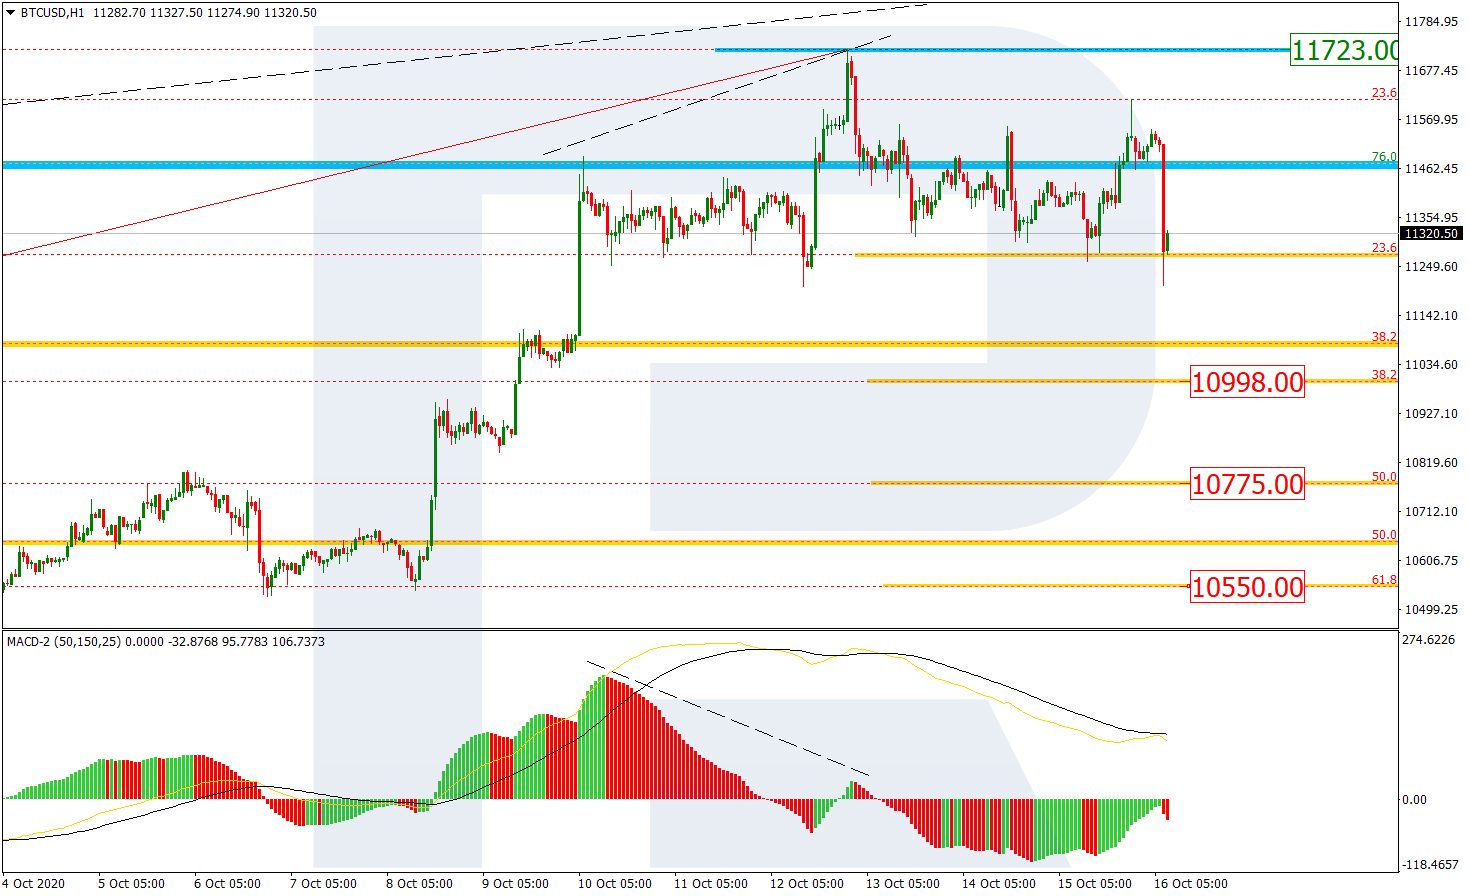
The H1 chart shows a more detailed structure of the current correction. The first descending wave has reached 23.6% fibo and later may move towards 38.2%, 50.0%, and 61.8% fibo at 10998.00, 10775.00, and 10550.00 respectively.

BTCUSD_H1
Risk Warning: the result of previous trading operations do not guarantee the same results in the future

ETHUSD, “Ethereum vs. US Dollar”

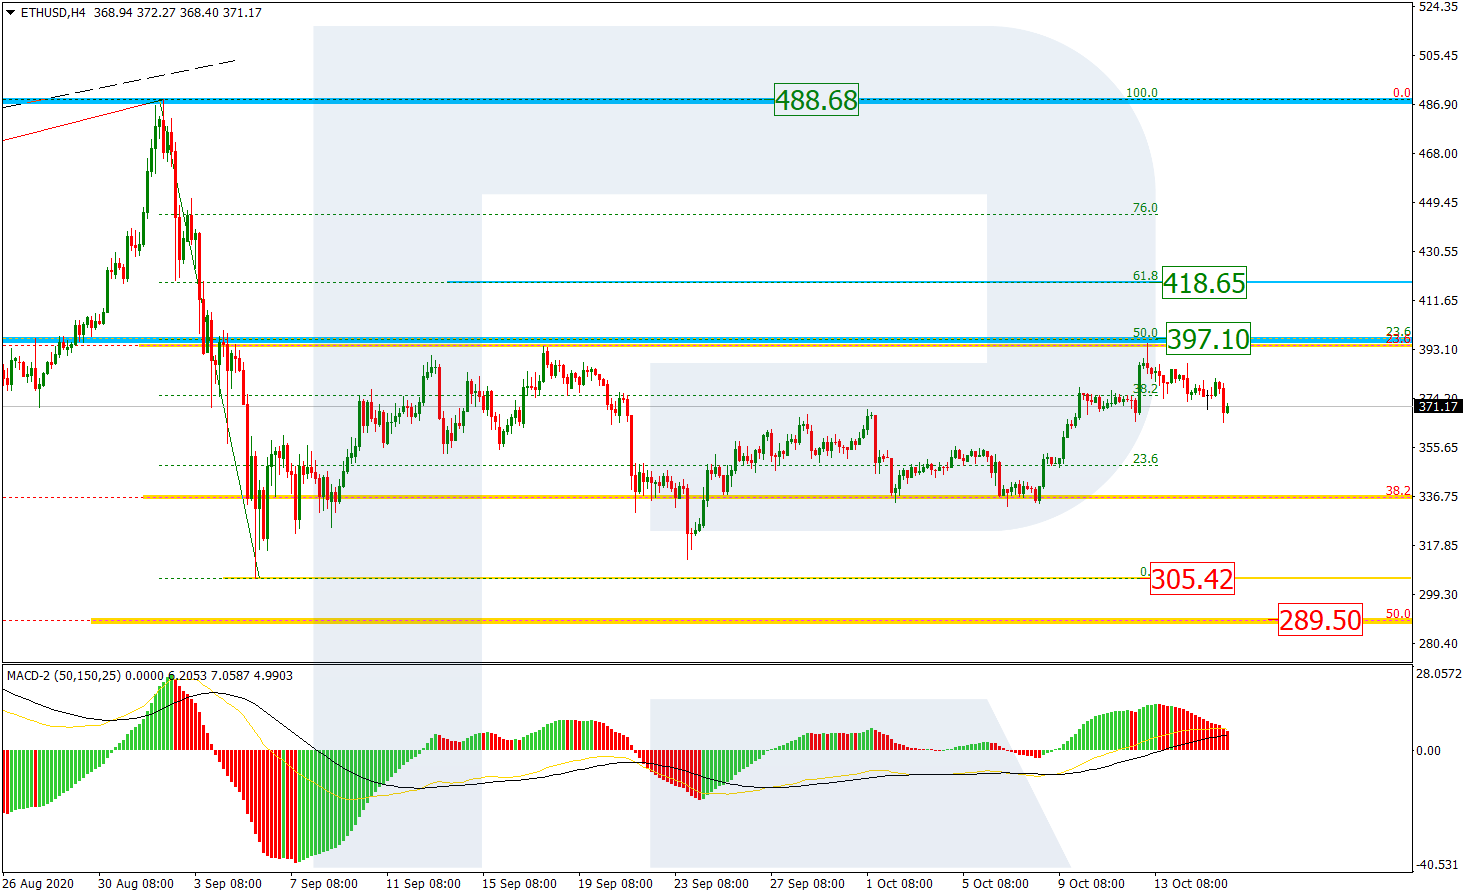
As we can see in the H4 chart, Ethereum has tried to re-test 50.0% fibo at 397.10. as long as the price is moving above the fractal low at 305.42, one shouldn’t exclude a possibility of further growth towards 61.8% fibo at 418.65. However, if ETHUSD manages to form a stable downtrend and break the above-mentioned low, the instrument may continue falling to reach 50.0% fibo at 289.50. The resistance is the high at 488.68.

ETHUSD_H4
Risk Warning: the result of previous trading operations do not guarantee the same results in the future

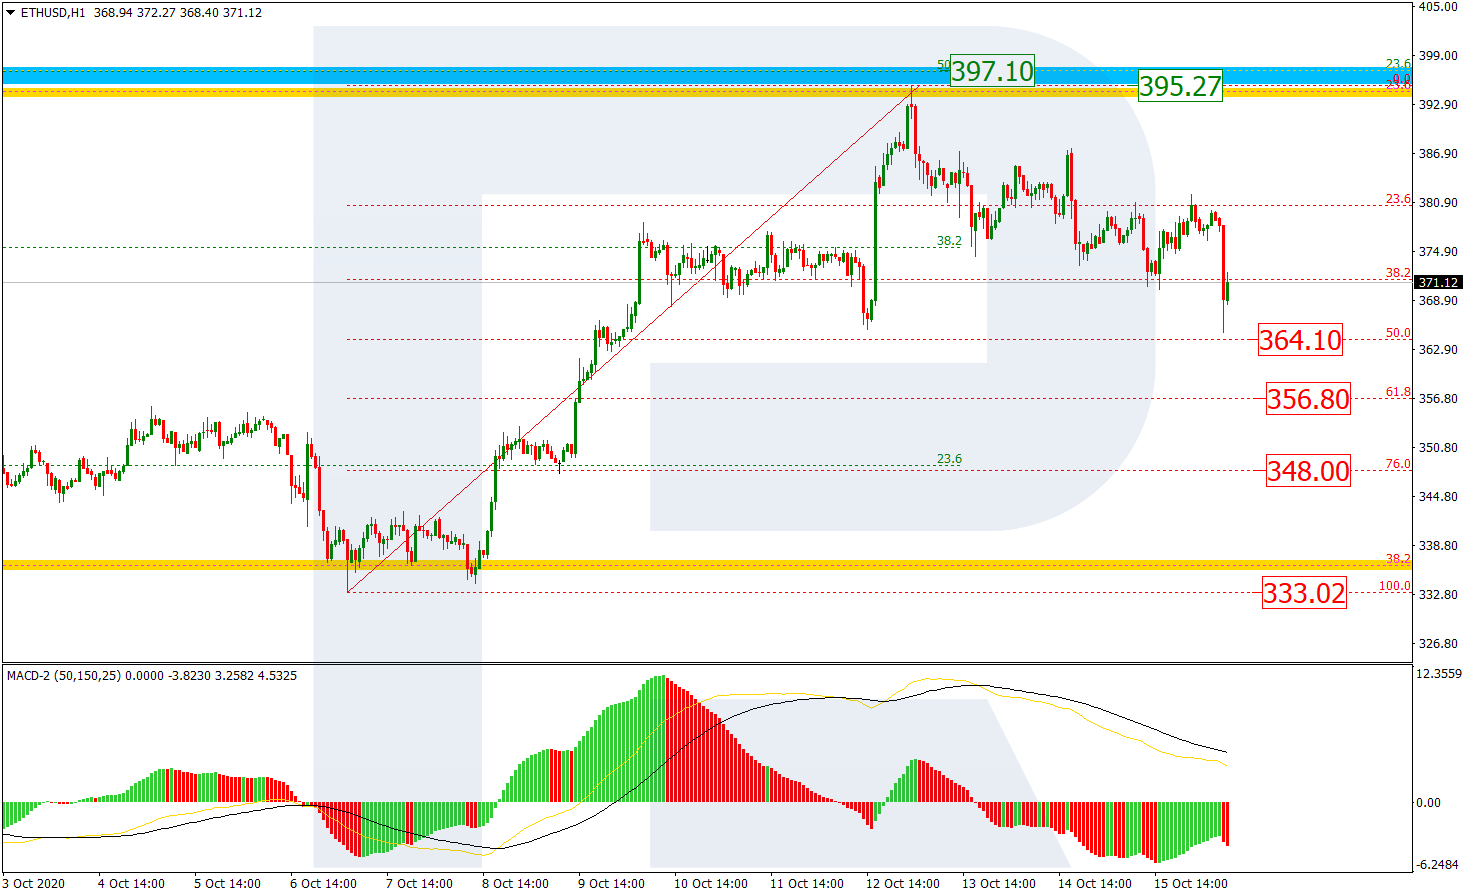
In the H1 chart, the pair is heading towards 50.0% fibo at 364.10 after a divergence. Later, the price may continue falling to reach 61.8% and 76.0% fibo at 356.80 and 348.88, as well as the low at 333.02. The local resistance is the high at 395.27.

ETHUSD_H1

Article By RoboForex.com

Attention!
Forecasts presented in this section only reflect the author’s private opinion and should not be considered as guidance for trading. RoboForex LP bears no responsibility for trading results based on trading recommendations described in these analytical reviews.

The Analytical Overview of the Main Currency Pairs on 2020.10.16

by JustForex

The EUR/USD currency pair

Technical indicators of the currency pair:
  • Prev Open: 1.17453
  • Open: 1.17076
  • % chg. over the last day: -0.34
  • Day’s range: 1.16941 – 1.17156
  • 52 wk range: 1.0637 – 1.2012

The greenback has been growing against its main competitors. The demand for safe assets has grown due to a sharp increase in the number of COVID-19 cases in the US and Europe. Several EU countries have introduced new restrictive measures. Investors also continue to follow the discussion on new economic stimulus in the US. The EUR/USD currency pair has updated local lows. At the moment, the trading instrument is consolidating in the range of 1.1690-1.1720. Further decline in the single currency is possible. We recommend opening positions from key levels.

The news feed on 2020.10.16:
  • – Data on inflation in the Eurozone at 12:00 (GMT+3:00);
  • – Report on retail sales in the US at 15:30 (GMT+3:00).
EUR/USD

Indicators signal the power of sellers: the price has fixed below 50 MA and 100 MA.

The MACD histogram is in the negative zone, but above the signal line, which gives a weak signal to sell EUR/USD.

Stochastic Oscillator is in the neutral zone, the %K line is above the %D line, which indicates the bullish sentiment.

Trading recommendations
  • Support levels: 1.1690, 1.1650
  • Resistance levels: 1.1720, 1.1735, 1.1765

If the price fixes below 1.1690, EUR/USD quotes are expected to fall further. The movement is tending to 1.1650-1.1630.

An alternative could be the growth of the EUR/USD currency pair to 1.1745-1.1760.

The GBP/USD currency pair

Technical indicators of the currency pair:
  • Prev Open: 1.30069
  • Open: 1.28972
  • % chg. over the last day: -0.75
  • Day’s range: 1.28832 – 1.29415
  • 52 wk range: 1.1409 – 1.3516

Sales prevail on the GBP/USD currency pair. During yesterday’s trading session, the British pound lost more than 100 points. The trading instrument has updated local lows. At the moment, GBP/USD quotes are consolidating in the range of 1.2885-1.2940. The demand for greenback is still high. A further decline in the GBP/USD currency pair is possible. Financial market participants expect up-to-date information on the Brexit process. Positions should be opened from key levels.

The publication of important UK economic releases is not planned.

GBP/USD

Indicators signal the power of sellers: the price has fixed below 50 MA and 100 MA.

The MACD histogram is in the negative zone, but above the signal line, which gives a weak signal to sell GBP/USD.

Stochastic Oscillator is in the neutral zone, the %K line is above the %D line, which indicates the bullish sentiment.

Trading recommendations
  • Support levels: 1.2885, 1.2850, 1.2800
  • Resistance levels: 1.2940, 1.2975, 1.3005

If the price fixes below 1.2885, a further decline in the GBP/USD currency pair is expected. The movement is tending to 1.2850-1.2820.

An alternative could be the growth of GBP/USD quotes to 1.2975-1.3000.

The USD/CAD currency pair

Technical indicators of the currency pair:
  • Prev Open: 1.31421
  • Open: 1.32247
  • % chg. over the last day: +0.56
  • Day’s range: 1.32048 – 1.32375
  • 52 wk range: 1.2949 – 1.4669

The USD/CAD currency pair has been growing. During yesterday’s trading session, the growth of quotes exceeded 80 points. The trading instrument has updated local highs. At the moment, the loonie is consolidating in the range of 1.3200-1.3250. The demand for the US dollar has grown significantly. Further growth of USD/CAD quotes is possible. We recommend paying attention to the dynamics of “black gold” prices. Positions should be opened from key levels.

The news feed on Canada’s economy is calm.

USD/CAD

Indicators signal the power of buyers: the price has fixed above 50 MA and 100 MA.

The MACD histogram is in the positive zone, but below the signal line, which gives a weak signal to buy USD/CAD.

Stochastic Oscillator is in the neutral zone, the %K line has crossed the %D line. There are no signals at the moment.

Trading recommendations
  • Support levels: 1.3200, 1.3170, 1.3125
  • Resistance levels: 1.3250, 1.3285, 1.3335

If the price fixes above 1.3250, further growth in USD/CAD quotes is expected. The movement is tending to 1.3280-1.3300.

An alternative could be a decline of the USD/CAD currency pair to 1.3170-1.3150.

The USD/JPY currency pair

Technical indicators of the currency pair:
  • Prev Open: 105.121
  • Open: 105.437
  • % chg. over the last day: +0.28
  • Day’s range: 105.192 – 105.443
  • 52 wk range: 101.19 – 112.41

The USD/JPY currency pair is in a sideways trend. There is no defined trend. Quotes are testing local support and resistance levels: 105.20 and 105.50, respectively. The trading instrument has the potential for further decline. We recommend paying attention to the dynamics of US government bonds yield. Positions should be opened from key levels.

The news feed for Japan’s economy is calm.

USD/JPY

Indicators do not give accurate signals: the price has crossed the 50 MA and 100 MA.

The MACD histogram has started declining, which indicates the bearish sentiment.

Stochastic Oscillator is in the neutral zone, the %K line has crossed the %D line. There are no signals at the moment.

Trading recommendations
  • Support levels: 105.20, 105.05, 104.70
  • Resistance levels: 105.50, 105.65, 105.80

If the price fixes below 105.20, a further fall in USD/JPY quotes is expected. The movement is tending to 104.80-104.60.

An alternative could be the growth of the USD/JPY currency pair to 105.70-105.90.

by JustForex


This article reflects a personal opinion and should not be interpreted as an investment advice, and/or offer, and/or a persistent request for carrying out financial transactions, and/or a guarantee, and/or a forecast of future events.