Farmers are depleting the Ogallala Aquifer because the government pays them to do it

By Matthew R Sanderson, Kansas State University; Burke Griggs, Washburn University, and Jacob A. Miller, Kansas State University 

– A slow-moving crisis threatens the U.S. Central Plains, which grow a quarter of the nation’s crops. Underground, the region’s lifeblood – water – is disappearing, placing one of the world’s major food-producing regions at risk.

The Ogallala-High Plains Aquifer is one of the world’s largest groundwater sources, extending from South Dakota down through the Texas Panhandle across portions of eight states. Its water supports US$35 billion in crop production each year.

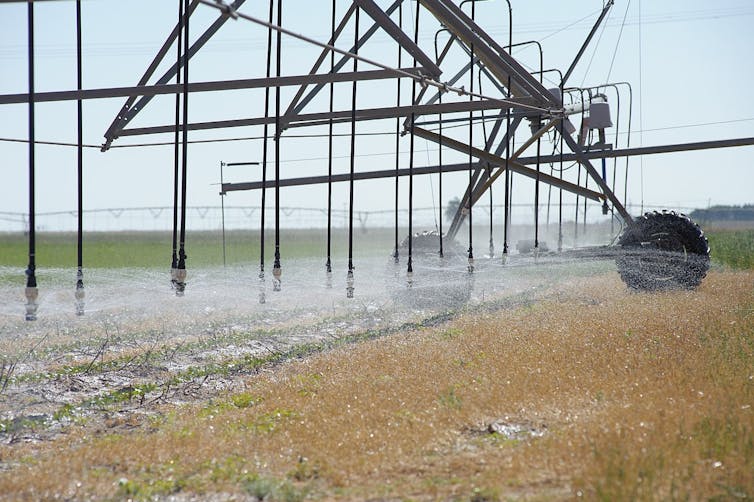
A center-pivot sprinkler with precision application drop nozzles irrigates cotton in Texas.
USDA NRCS/Wikipedia

But farmers are pulling water out of the Ogallala faster than rain and snow can recharge it. Between 1900 and 2008 they drained some 89 trillion gallons from the aquifer – equivalent to two-thirds of Lake Erie. Depletion is threatening drinking water supplies and undermining local communities already struggling with the COVID-19 pandemic, the opioid crisis, hospital closures, soaring farm losses and rising suicide rates.

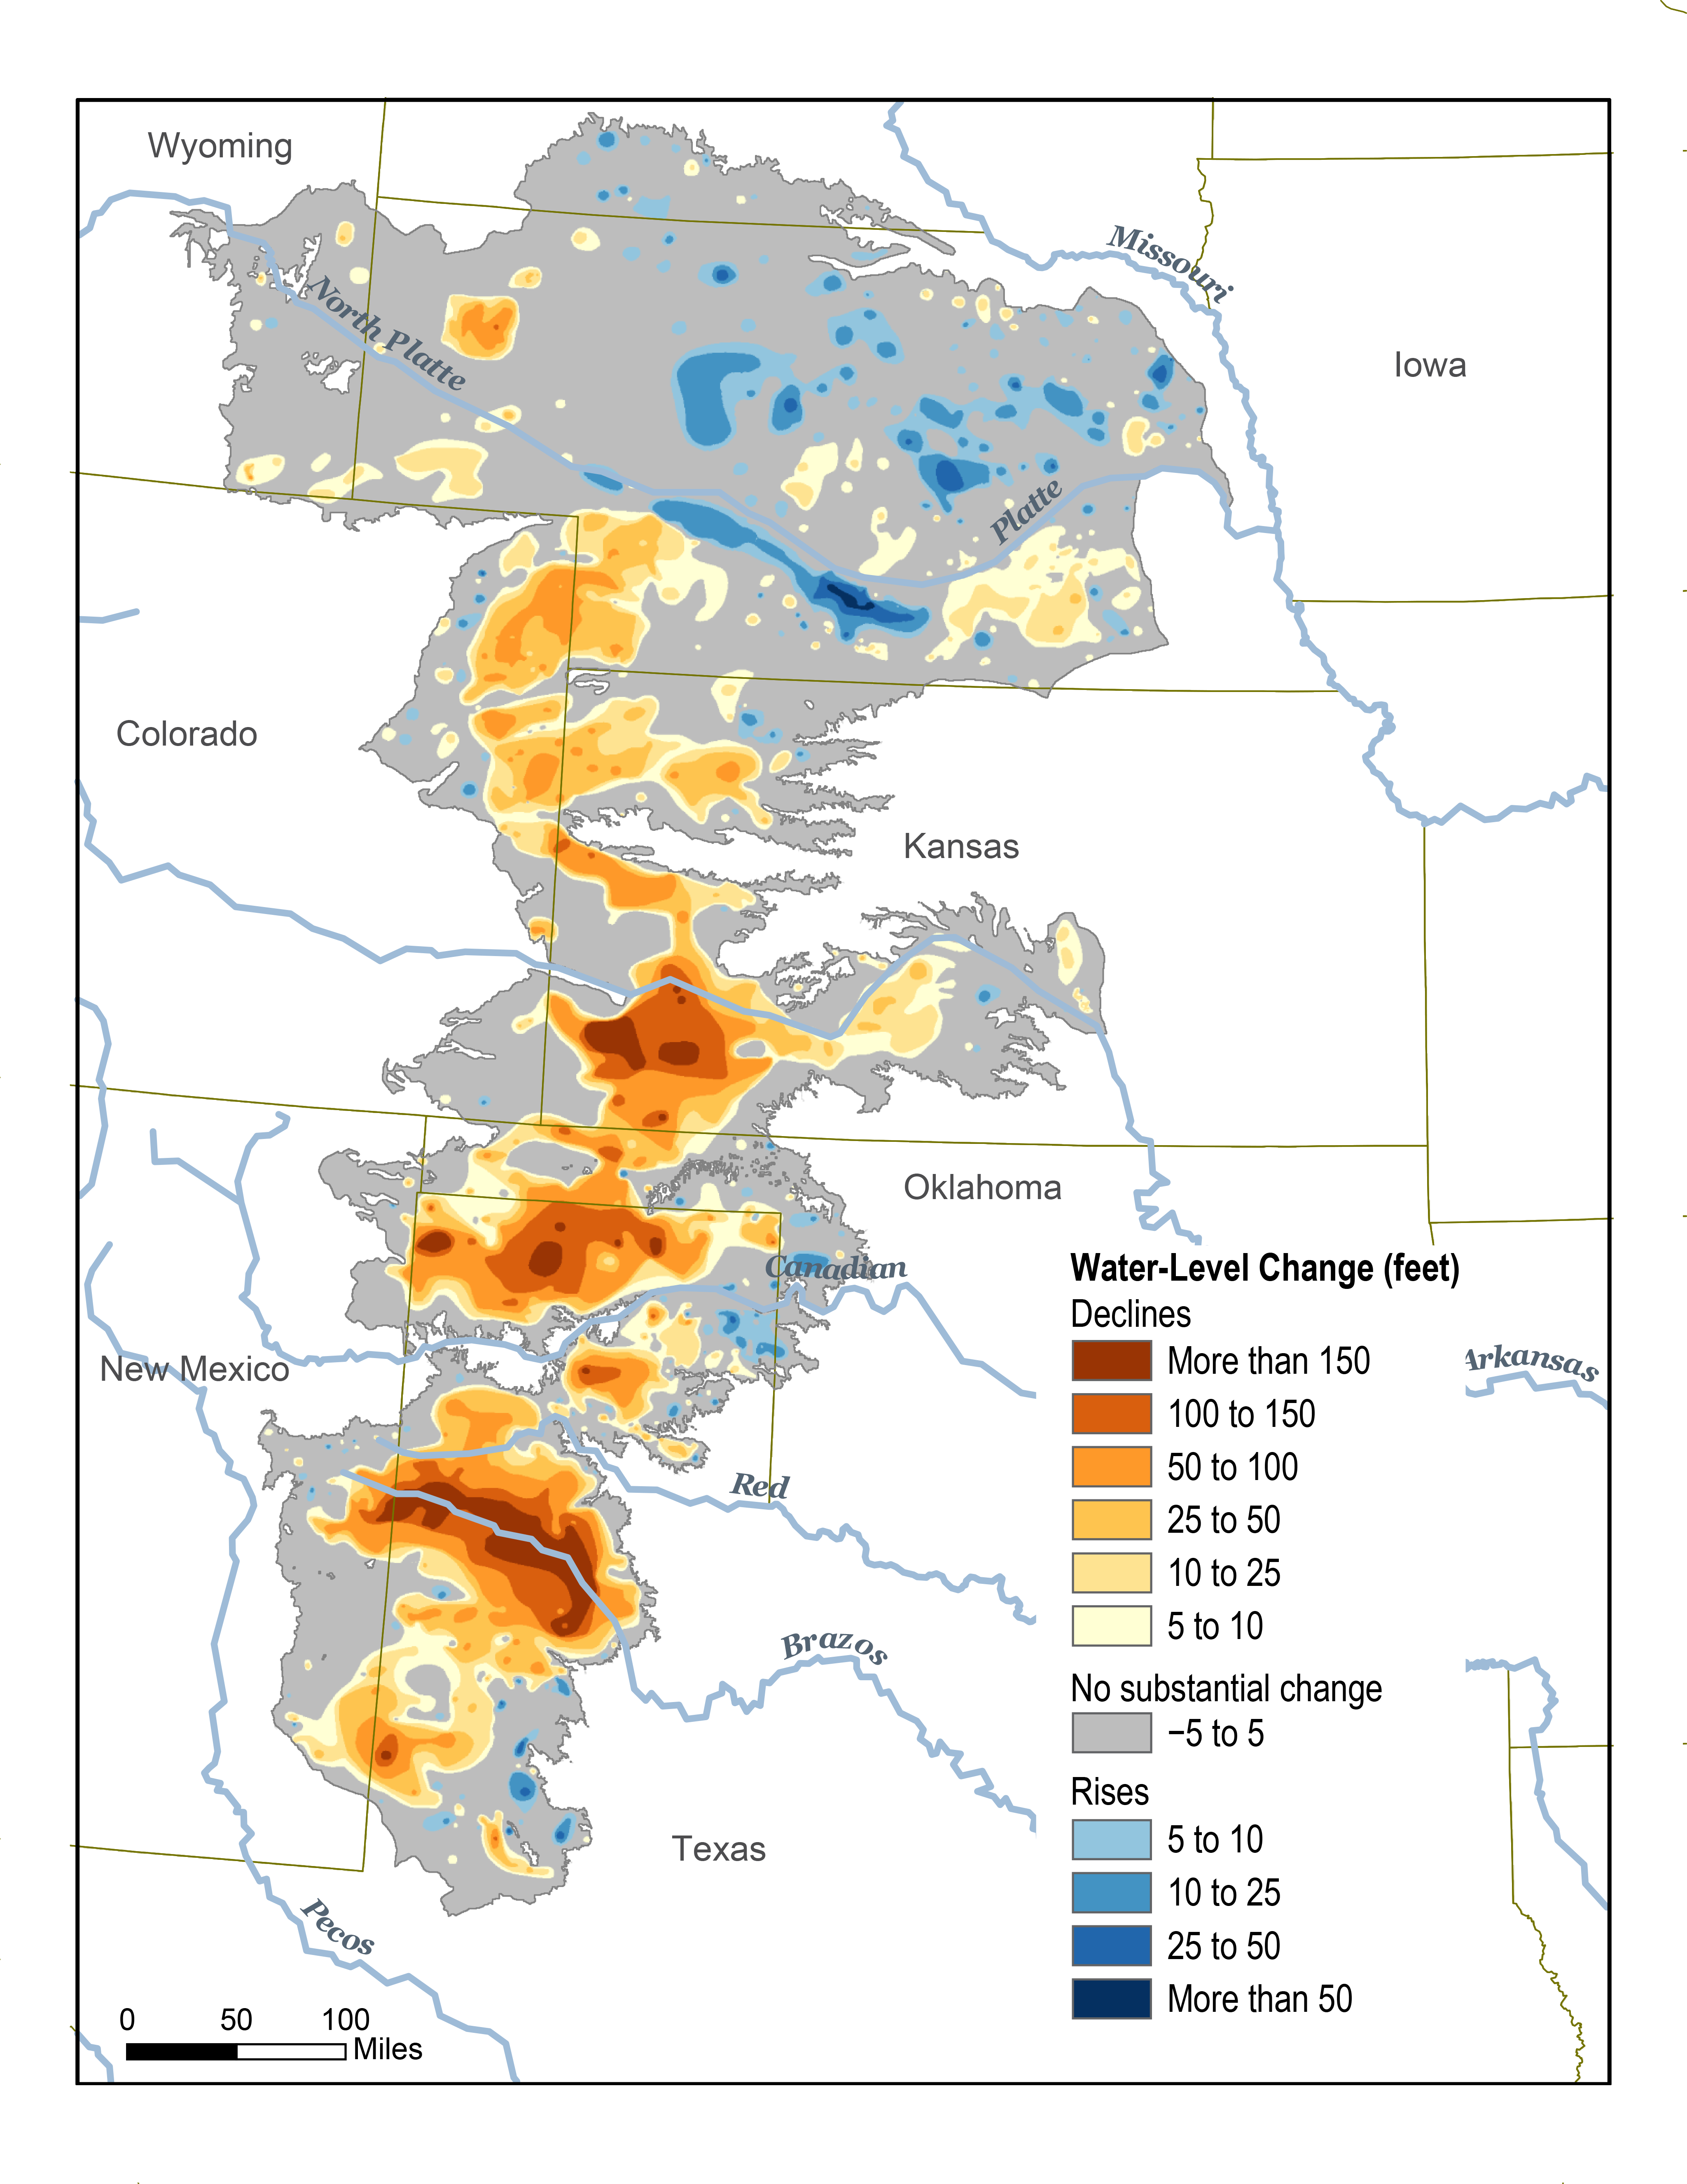
Map showing changing Ogallala Aquifer water levels over the past century
Changes in Ogallala water levels from before the aquifer was tapped in the early 20th century to 2015. Gray indicates no significant change. Water levels have risen in some areas, especially Nebraska, but are mostly in decline.
NCA 2018

In Kansas, “Day Zero” – the day wells run dry – has arrived for about 30% of the aquifer. Within 50 years, the entire aquifer is expected be 70% depleted.

Some observers blame this situation on periodic drought. Others point to farmers, since irrigation accounts for 90% of Ogallala groundwater withdrawals. But our research, which focuses on social and legal aspects of water use in agricultural communities, shows that farmers are draining the Ogallala because state and federal policies encourage them to do it.

A production treadmill

At first glance, farmers on the Plains appear to be doing well in 2020. Crop production increased this year. Corn, the largest crop in the U.S., had a near-record year, and farm incomes increased by 5.7% over 2019.

But those figures hide massive government payments to farmers. Federal subsidies increased by a remarkable 65% this year, totaling $37.2 billion. This sum includes money for lost exports from escalating trade wars, as well as COVID-19-related relief payments. Corn prices were too low to cover the cost of growing it this year, with federal subsidies making up the difference.

Our research finds that subsidies put farmers on a treadmill, working harder to produce more while draining the resource that supports their livelihood. Government payments create a vicious cycle of overproduction that intensifies water use. Subsidies encourage farmers to expand and buy expensive equipment to irrigate larger areas.

Irrigation pump in field
Irrigation pump in Haskell County, Kansas.
Matthew Sanderson/Kansas State University, CC BY-ND

With low market prices for many crops, production does not cover expenses on most farms. To stay afloat, many farmers buy or lease more acres. Growing larger amounts floods the market, further reducing crop prices and farm incomes. Subsidies support this cycle.

Few benefit, especially small and midsized operations. In a 2019 study of the region’s 234 counties from 1980 to 2010, we found that larger irrigated acreage failed to increase incomes or improve education or health outcomes for residents.

Focus on policy, not farmers

Four decades of federal, state and local conservation efforts have mainly targeted individual farmers, providing ways for them to voluntarily reduce water use or adopt more water-efficient technologies.

While these initiatives are important, they haven’t stemmed the aquifer’s decline. In our view, what the Ogallala Aquifer region really needs is policy change.

A lot can be done at the federal level, but the first principle should be “do no harm.” Whenever federal agencies have tried to regulate groundwater, the backlash has been swift and intense, with farm states’ congressional representatives repudiating federal jurisdiction over groundwater.

Nor should Congress propose to eliminate agricultural subsidies, as some environmental organizations and free-market advocates have proposed. Given the thin margins of farming and longstanding political realities, federal support is simply part of modern production agriculture.

With these cautions in mind, three initiatives could help ease pressure on farmers to keep expanding production. The U.S. Department of Agriculture’s Conservation Reserve Program pays farmers to allow environmentally sensitive farmland to lie fallow for at least 10 years. With new provisions, the program could reduce water use by prohibiting expansion of irrigated acreage, permanently retiring marginal lands and linking subsidies to production of less water-intensive crops.

These initiatives could be implemented through the federal farm bill, which also sets funding levels for nonfarm subsidies such as the Supplemental Nutrition Assistance Program, or SNAP. SNAP payments, which increase needy families’ food budgets, are an important tool for addressing poverty. Increasing these payments and adding financial assistance to local communities could offset lower tax revenues that result from from farming less acreage.

A 40-year sequence of false-color satellite images shows the spread of center-pivot irrigation around Dalhart, Texas from 1972 to 2011. The equipment creates circular patterns as a sprinkler rotates around a well pivot.

Amending federal farm credit rates could also slow the treadmill. Generous terms promote borrowing for irrigation equipment; to pay that debt, borrowers farm more land. Offering lower rates for equipment that reduces water use and withholding loans for standard, wasteful equipment could nudge farmers toward conservation.

The most powerful tool is the tax code. Currently, farmers receive deductions for declining groundwater levels and can write off depreciation on irrigation equipment. Replacing these perks with a tax credit for stabilizing groundwater and substituting a depreciation schedule favoring more efficient irrigation equipment could provide strong incentives to conserve water.

Rewriting state water laws

Water rights are mostly determined by state law, so reforming state water policies is crucial. Case law demonstrates that simply owning water rights does not grant the legal right to waste water. For more than a century courts have upheld state restrictions on waste, with rulings that allow for adaptation by modifying the definitions of “beneficial use” and “waste” over time.

Using these precedents, state water agencies could designate thirsty crops, such as rice, cotton or corn, as wasteful in certain regions. Regulations preventing unreasonable water use are not unconstitutional.

[Deep knowledge, daily. Sign up for The Conversation’s newsletter.]

Allowing farmers some flexibility will maximize profits, as long as they stabilize overall water use. If they irrigate less – or not at all – in years with low market prices, rules could allow more irrigation in better years. Ultimately, many farmers – and their bankers – are willing to exchange lower annual yields for a longer water supply.

As our research has shown, the vast majority of farmers in the region want to save groundwater. They will need help from policymakers to do it. Forty years is long enough to learn that the Ogallala Aquifer’s decline is not driven by weather or by individual farmers’ preferences. Depletion is a structural problem embedded in agricultural policies. Groundwater depletion is a policy choice made by federal, state and local officials.

About the Author:

Stephen Lauer and Vivian Aranda-Hughes, former doctoral students at Kansas State University, contributed to several of the studies cited in this article.The Conversation

Matthew R Sanderson, Professor of Sociology and Professor of Geography and Geospatial Sciences, Kansas State University; Burke Griggs, Associate Professor of Law, Washburn University, and Jacob A. Miller, PhD Student in Sociology, Kansas State University

This article is republished from The Conversation under a Creative Commons license. Read the original article.

New Zealand launches new loan tool to boost stimulus

New Zealand’s central bank became the third advanced economy central bank in less than a week to ease its monetary policy stance another notch in response to the economic hit from COVID-19 as it launched a new lending tool and said it was making progress in using negative interest rates, if necessary.
      The Reserve Bank of New Zealand (RBNZ) left its official cash rate (OCR) steady at a record low of 0.25 percent but said its Monetary Policy Committee (MPC) had “agreed to provide additional monetary stimulus to the economy in order to meet its consumer price inflation and employment remit,” and this would be provided through a Funding for Lending Programme (FLP) that would begin in December, lowering banks’ funding costs.
      The fresh stimulus by New Zealand’s central bank comes on the heels of last week’s rate cut and additional asset purchases by Australia’s central bank and the Bank of England’s increase in its bond purchase program.
       RBNZ’s decision was largely expected by economists as the central bank in September said it was preparing to launch additional monetary stimulus, such as the new lending program that would offer banks funds at or near the cash rate, a negative interest rate or the purchase of foreign assets.
     While RBNZ kept its target for large scale asset purchases (LSAP) at NZ$100 billion – the amount it was raised it to in August – the central bank further delayed the start of an increase in bank capital “until 2022 to allow banks continued headroom to respond to the effects of the COVID-19 pandemic and to support the economic recovery.”
     RBNZ already pushed back an increase in capital requirements for banks by 12 months to July 20121 in March and is now delaying it by another year until July 2022, saying this would strike the right balance between providing more headroom for banks to support lending by drawing on their capital buffers and ensuring financial stability.
     The timing of the capital requirements will be reconfirmed near the end of 2021 while further details about new rules around capital instruments will be announced on Nov. 17, the bank said, adding it would also consult about re-instating loan-to-value ratio (LVR) restrictions on high-risk lending – which are used to reduce the risk to financial stability and were scrapped in March – next month.
     In addition, the central bank said restrictions on dividends paid by banks that were put in place in April this year would remain in effect to at least until March 31, 2021 while it had written to insurers, telling them it expects them to only pay dividend if it is prudent in light of the elevated risks.
     “The Committee agreed that monetary policy will need to remain stimulatory for a long time to meet the consumer price inflation and employment remit, and that it must remain prepared to provide additional support if necessary,” RBNZ said.
     As far as cutting interest rates to negative, the central bank said the country’s banking system was on track to be operationally ready for negative rate by the end of the year and the MPC “agreed that it was prepared to lower the OCR to provide additional stimulus if required.”
     The additional stimulus by New Zealand’s central bank comes as financial markets have rejoiced over this week’s news of a possible vaccine against COVID-19 by the pharmaceutical company Pfizer and economies have proved to be more resilient than expected, partly due to the policy response.
     “However, members noted that the severe economic effects of the pandemic were persisting and have significantly implications for the Committee in meeting its remit,” while the shock to the economy is very large and inflation and employment will remain below targets for a prolonged period.
     New Zealand’s inflation rate fell to 1.4 percent in the third quarter from 1.5 percent in the previous quarter while the economy shrank 12.2 percent in the second quarter from the first quarter, the unemployment rate jumped to 5.3 percent from 4.0 percent, and the New Zealand dollar – which has risen since mid-March – rose further to trade at 1.45 to the U.S. dollar, up 2.4 percent since the start of this year.
       The Reserve Bank of New Zealand issued the following two statements:

“Tēnā koutou katoa, welcome all.

The Monetary Policy Committee agreed to provide additional monetary stimulus to the economy in order to meet its consumer price inflation and employment remit. The Committee agreed that the additional stimulus would be provided through a Funding for Lending Programme (FLP), commencing in December. The FLP will reduce banks’ funding costs and lower interest rates.

The Committee will also continue with the Large Scale Asset Purchase (LSAP) Programme up to $100 billion, and retain the Official Cash Rate (OCR) at 0.25 percent in accordance with the guidance issued on 16 March.

Progress has been made on the Bank’s operational ability to deploy an FLP and a negative OCR. The Committee agreed that these instruments can be mutually supportive in bolstering economic activity if necessary.

Economic activity since the August Monetary Policy Statement, both international and domestic, has proved more resilient than earlier assumed. In New Zealand this trend was evident across a range of indicators, including employment, household spending, GDP, and asset prices. These outcomes reflect the effectiveness of the health and economic policy responses to the initial shock.

However, the COVID-19 shock to the economy is very large and persistent, and inflation and employment will remain below the remit targets for a prolonged period. These outcomes are despite the current significant fiscal and monetary stimulus.

The outlook for global economic activity remains dependent on the containment of the virus. While recent news on vaccine developments is positive, there remains a long and uncertain lag before any widespread vaccine deployment may be achieved. Meanwhile international border restrictions will continue to curtail international trade and migration, with variable impacts across industries and regions. International prices for New Zealand’s exports have remained resilient, although export returns continue to be partly offset by the New Zealand dollar exchange rate.

Domestically, fiscal stimulus remains significant even with the Wage Subsidy scheme having now run its course. Government spending on business assistance and household income support continues, and government investment will rise.

However, we expect an ongoing increase in unemployment as the economy adjusts. Consumer price inflation is also projected to remain at the lower-end of the remit target range for a period, and inflation expectations remain subdued.

The Committee agreed that monetary policy will need to remain stimulatory for a long time to meet the consumer price inflation and employment remit, and that it must remain prepared to provide additional support if necessary.

More information

Summary Record of Meeting

The Monetary Policy Committee discussed international economic and financial market developments. The Committee noted that following a severe contraction, economic activity has subsequently improved. However, these outcomes diverged across countries, depending largely on the degree of social restrictions imposed as a COVID-19 containment measure.

Members noted that economic activity had been surprisingly resilient in some economies, including China. They also noted that the impact on New Zealand of the global economic weakness had been more muted than expected, with commodity and asset prices remaining firm. However, members remained concerned about the downside risks from the persistent spread of the virus in Europe and the United States in particular, which would constrain demand for global exports.

Members discussed domestic economic developments since the August Statement. Overall, economic outcomes had been more resilient than earlier assumed. This trend was evident across a range of information, including the labour market, household spending, GDP, asset prices, and goods trade. These outcomes partly reflected the effectiveness of policy responses to the shock.

However, members noted that the severe economic effects of the pandemic were persisting and have significant implications for the Committee in meeting its remit. Both headline and underlying inflation were below 2 percent, inflation expectations were subdued, and employment was assessed to be below its maximum sustainable level.

The Committee discussed the implications of the pandemic and associated steps to contain it for the New Zealand economy. The implications of closed international borders meant service export industries, such as tourism, would operate well below capacity for a prolonged period. Meanwhile, economic activity in other sectors appeared resilient, with labour shortages re-emerging in some cases.

The Committee agreed that the assessed maximum sustainable level of employment may continue to be lower than otherwise while the economy adjusted to the virus shock. Some members noted that resources could take a considerable period to be redeployed, which could result in isolated cost pressures. Others emphasised that underutilised labour from some sectors would put downward pressure on wages and inflation.

Members agreed that there was substantial uncertainty around how the economy would adjust. The Committee agreed that it remained appropriate for fiscal policy to play the primary role in bolstering economic outcomes, given the nature of the economic shock, with monetary policy in an important support role.

Members discussed the outlook for inflation and employment. Staff presented a baseline scenario, conditioned on a number of assumptions, including that there were no further substantial community outbreaks of COVID-19 in New Zealand, and that the international border would be fully open by 2022.

In this scenario, the labour market was projected to weaken further in the near term. It was projected to recover over subsequent years, in particular after the border was assumed to be fully reopened. Inflation was projected to fluctuate around the bottom of the Committee’s 1 to 3 percent target range until late in the projection period.

Most Committee members agreed that risks to the baseline scenario were less skewed to the downside than they had appeared earlier in the year. Economic outcomes could be stronger than assumed if household or business spending accelerated, for instance due to an earlier partial border reopening, or a higher propensity to consume out of household wealth. The latter could be supported by higher housing and financial asset prices, or improving sentiment about the global health outlook and its management. Members agreed that recent news around vaccine development was promising, but that there were still challenges to overcome before widespread availability could be achieved.

Members agreed, however, that it was still the case that unpredictable events could push inflation and employment significantly lower than in the baseline scenario. They discussed events such as ongoing virus outbreaks, delays in borders reopening, and continued reluctance to invest by businesses due to general uncertainty.

The Committee discussed the effects of its recent monetary policy actions. Members noted that wholesale interest rates had eased following the August Statement. This reflected the expansion and front-loading of the Large Scale Asset Purchase (LSAP) programme, and expectations from market participants that the OCR could be reduced below zero next year. Bank term deposit rates had also fallen substantially in recent months. In particular, these falls had followed the Committee’s guidance to Bank staff issued in September to prepare a Funding for Lending Programme (FLP) to be ready to deploy before the end of the year.

However, members noted that bank lending rates were largely unchanged since August despite the reduction in funding costs. They discussed the importance of banks passing on funding cost reductions to their lending rates in order for monetary policy to transmit effectively. Members noted that the Reserve Bank had announced a further 12-month delay to the start date of increased capital requirements for banks following the capital review, to July 2022, which would assist them in maintaining lending growth.

The Committee agreed that a prolonged economic downturn would make it difficult to achieve its inflation and employment objectives. Some members noted that while the decline in inflation expectations this year was not surprising given the scale of the shock, it would be concerning if expectations fell further or remained low for a prolonged period. The Committee agreed that it was important to anchor inflation expectations around the mid-point of the target range over the medium term.

Members agreed that, under current circumstances, the appropriate stance to achieve its remit objectives would be to provide further monetary stimulus. They also agreed that providing sufficient monetary stimulus would also promote financial stability, through improved employment and household income prospects. The Committee agreed that, given the current inflation and employment conditions, and the ongoing significant uncertainty with regard to the outlook, there was less regret associated with the risk of temporarily overshooting their policy remit.

The Committee noted that other prudential policy settings could be adjusted to reduce risks to the financial system if required. Members noted that the Reserve Bank will consult on the possible reintroduction of limits on high loan-to-value ratio lending, in order to slow the build-up of riskier lending on bank balance sheets.

The Committee reaffirmed that an FLP, a lower or negative OCR, purchases of foreign assets, and interest rate swaps remain under consideration.

The Committee noted that staff were prepared to implement an FLP from early December. The FLP was expected to work primarily by lowering system-wide funding costs, benefiting all financial institutions, not just those that drew on FLP funds. Lower funding costs would enable financial institutions to lower borrowing costs for firms and households.

Members noted that the effectiveness of an FLP would depend on financial institutions passing on declines in their funding costs to borrowers, and agreed to monitor pass-through to lending rates closely. Members agreed with the staff assessment that an FLP would be an effective way to provide additional monetary stimulus, and that it was the best tool to deploy at this time given the Committee’s principles for alternative monetary policy instruments. They also noted that evaluations of similar programmes deployed overseas had shown that they were effective.

Members discussed the design of the FLP. They endorsed staff advice that the programme should be of sufficient size to allow financial institutions to reduce interest rates with confidence that a low cost, stable funding source was available.

Members noted that the FLP was likely to be drawn down gradually given banks’ current funding needs, and that the success of the programme would be measured by the fall in household and business borrowing rates, rather than the level of drawdown.

The Committee agreed that including an incentive to expand lending would help to ensure adequate supply of credit to support the economic recovery, but that targeting the incentives to specific sectors would reduce the programme’s effectiveness. The Committee noted that overseas initiatives to target sectors of the economy had been designed to overcome specific issues in those countries. The Committee agreed targeting credit to specific sectors was the role of the banking sector or government initiatives.

Members noted that the banking system is on track to be operationally ready for negative interest rates by year end. The Committee agreed that it was prepared to lower the OCR to provide additional stimulus if required.

The Committee noted staff advice that bond purchases under the LSAP programme had been effective at keeping yields low, and endorsed their recommendation to continue adjusting purchases as market conditions dictate. On Wednesday 11 November, the Committee reached a consensus to:

  • hold the OCR at 0.25 percent, in accordance with the guidance issued on 16 March;
  • maintain the existing LSAP programme of a maximum of $100b by June 2022; and
  • direct the Bank to implement an FLP in early December 2020.

Attendees:

Reserve Bank staff: Adrian Orr, Geoff Bascand, Christian Hawkesby, Yuong Ha
External: Bob Buckle, Peter Harris, Caroline Saunders
Observer: Tim Ng
Secretary: Ross Kendall”

“Reserve Bank delays start date for increases in bank capital

The Reserve Bank – Te Pūtea Matua is further delaying the start of increases in bank capital until 2022 to allow banks continued headroom to respond to the effects of the COVID-19 pandemic and to support the economic recovery.

This delay supports other actions the Reserve Bank has taken to cushion the initial economic blow of COVID-19 by promoting cash flow and confidence in the financial system.

“The Reserve Bank’s actions throughout this period have promoted monetary and financial stability and provided broad support to the Government, financial institutions and New Zealanders,” Reserve Bank Deputy Governor and General Manager Financial Stability Geoff Bascand says.

“COVID-19 has emphasised the importance of buffers in the financial system. The more capital a bank holds, the better it can weather economic storms and meet customer needs during tough times.

“Delaying the implementation of parts of the Capital Review decisions by a further 12 months strikes the right balance between providing more headroom for banks to support lending now by drawing on their capital buffers, while also ensuring that capital levels lift in the longer term to support financial stability.”

The Reserve Bank remains committed to increasing capital requirements in the medium-term to underpin financial stability, Mr Bascand says.

The changes mean the increase in the Prudential Capital Buffer will not begin until July 2022. The Reserve Bank will reconfirm this timing near the end of 2021, and will consider making further amendments to the timing if the conditions warrant it. Other aspects of the capital reforms will proceed from 1 July 2021, including the new rules around capital instruments. More detail on this will be released on November 17.

Reserve Bank will consult on loan-to-value ratio (LVR) restrictions

Meanwhile, in December, the Reserve Bank will consult about re-instating loan-to-value ratio (LVR) restrictions on high-risk lending with effect from 1 March 2021.

LVR restrictions are used to reduce the risks to financial stability from higher-risk lending. The restrictions were removed in May to best ensure credit could flow, and that they did not have an undue impact on the mortgage deferral scheme implemented in response to the COVID-19 pandemic.

“Circumstances in the lending market have since improved and we are now observing rapid growth in higher-risk investor lending. We will consult about re-instating the restrictions we had in place pre-COVID, which limited the amount of high-risk lending that banks could make,” Mr Bascand says.

Bank Dividend restrictions will remain in place

The Reserve Bank is also announcing that the restrictions on dividends and redeeming non-Common Equity Tier 1 (CET1) capital instruments put in place in April 2020 will be retained until 31 March 2021, or later if required. This will continue to support the stability of the financial system.

Reserve Bank updated expectations on insurer dividends

The Reserve Bank has also written to insurers to advise it has updated expectations on dividends. The Reserve Bank expects that insurers will only make dividend payments if it is prudent for that insurer to do so, having regard to their own stress testing and the elevated risks in the current environment.

More information: 

Media contact:
Brendan Manning
Senior Adviser External Stakeholders
DDI: +64 9 366 2643 | MOB: 021 923 217
Email: [email protected]

Background Notes

  • Reserve Bank Deputy Governor Geoff Bascand will discuss these announcements in a media conference, livestreamed on the Bank’s website at 3pm today.
  • The Reserve Bank will be publishing more detailed commentary on its assessment of the soundness and efficiency of New Zealand’s financial system in the November Financial Stability Report (FSR) at 9am on Wednesday 25 November. More details of the LVR restriction consultation, including the timing, will be provided when the FSR is released.
  • Removing the LVR restrictions earlier this year was a reasonably quick process, as it allowed banks to lend straight away. The process of imposing LVR restrictions takes more time, following consultation, as banks require time to adjust their lending practices and manage borrowing applications already underway to ensure they comply with the new rules.
  • Timing of Capital Review implementation:
    • In March 2020 the Reserve Bank delayed the start date of increased capital requirements for banks by 12 months – to 1 July 2021. We noted that this action was taken to help support lending in the economy at time of heightened uncertainty. Banks have significant buffers above current regulatory minimums, and we encouraged them to use them.
    • At the time of that decision we also noted that should conditions warrant it next year, the Reserve Bank will consider whether further delays are necessary. Today’s announcement updates the March 2020 decision.
    • The following parts of the December 2019 decisions have been delayed to begin from July 2022 onwards:
    • Increases in capital buffers: the increase will be gradually phased in from July 2022 until July 2028.
    • The scheduled increase in the Internal Ratings-Based approach (IRB) ‘scalar’ for risk weights to 1.2, from 1.06 at present, will start from 1 October 2022.
    • All other December 2019 decisions will proceed as planned:
    • Changes to the requirements for Additional Tier 1 and Tier 2 capital instruments (from 1 July 2021).
    • The de-recognition of existing Additional Tier 1 and Tier 2 capital instruments (from 1 July 2021).
    • ‘Dual reporting’: Internal Ratings Based (IRB) banks required to report IRB and Standardised capital calculations (from 1 January 2022).
    • Setting the output floor on IRB exposures to 85% (from 1 January 2022).
    • Other December 2019 Capital Review changes, that do not require banks to increase capital, will continue to proceed from 1 July 2021 onwards. These changes provide banks with certainty about the future capital rules.
    • To implement the changes, the Reserve Bank will publish consultation material and seek feedback for changes to the Banking Supervision Handbook – which is the set of rules and policies registered banks must adhere to – on 17 November. Consultation will run until 31 March 2021.”

www.CentralBankNews.info

EURUSD Gives Back Monday’s Gains

By Orbex

EURUSD Gives Back Monday’s Gains

The euro’s failure at the 1.1900 level is pushing price action lower.

At the time of writing, the common currency is trading near the 1.1800 level. With the trend line and the horizontal support area, price action could be moving into a tight consolidation.

However, the Stochastics oscillator is oversold. Unless it moves further into the oversold levels, the EURUSD could be looking to rebound from the 1.1800 level.

This will keep prices trading flat between the 1.1800 and 1.1900 levels for the near term.

To the downside, the risks of a breakout are higher.

If the euro loses the 1.1800 support, then we expect a move back to the 1.1715 level next.

GBPUSD Advances Slightly Higher

The British pound sterling is looking to build upon the gains from Monday.

However, as price approaches the 1.3300 handle, the momentum is losing steam. This could see prices pulling back in the near term.

Any downside declines will be firmly stalled near the 1.3122 level of support.

This could mean that the GBPUSD might settle into a sideways range between the said levels for the moment, given the psychological importance of the 1.3300.

To the downside, in the event of prices failing near the 1.3122 level, we could see a decline back to the 1.3000 support area.

For the moment, the Stochastics oscillator is likely to signal a short term pullback from the current highs.

Crude Oil Attempts To Break Past 41.00 Handle Again

Oil prices pulled back after testing the technical resistance area near 41.00 on Tuesday.

However, oil recouped the bullish momentum, and the commodity is now attempting to break past this psychological barrier.

A strong breakout above 41.00 could breathe some fresh air for the oil markets, which have been stuck in a strong sideways range.

With the market sentiment likely to linger on, there is scope for oil prices to break past this level.

Above 41.00, support will need to form in order to confirm further upside. This will put the next key level near 43.50 into focus.

Gold Rises After Monday’s Declines

The precious metal is trading about 1% higher on Tuesday.

The gains came after price action fell to the 1850 level briefly. With traders rejecting prices near this level, gold prices made a modest bounce to the upside.

Despite the modest gains in comparison to Monday’s fall, gold prices could be looking to settle into a range.

The upside will once again be challenged near the 1911.50 – 1900.00 level of resistance.

To the downside, the 1850 level is firmly established as strong support level.

Only a breakout from either of these levels will determine the next direction in the commodity.

By Orbex

Murrey Math Lines 11.11.2020 (USDJPY, USDCAD)

Article By RoboForex.com

USDJPY, “US Dollar vs. Japanese Yen”

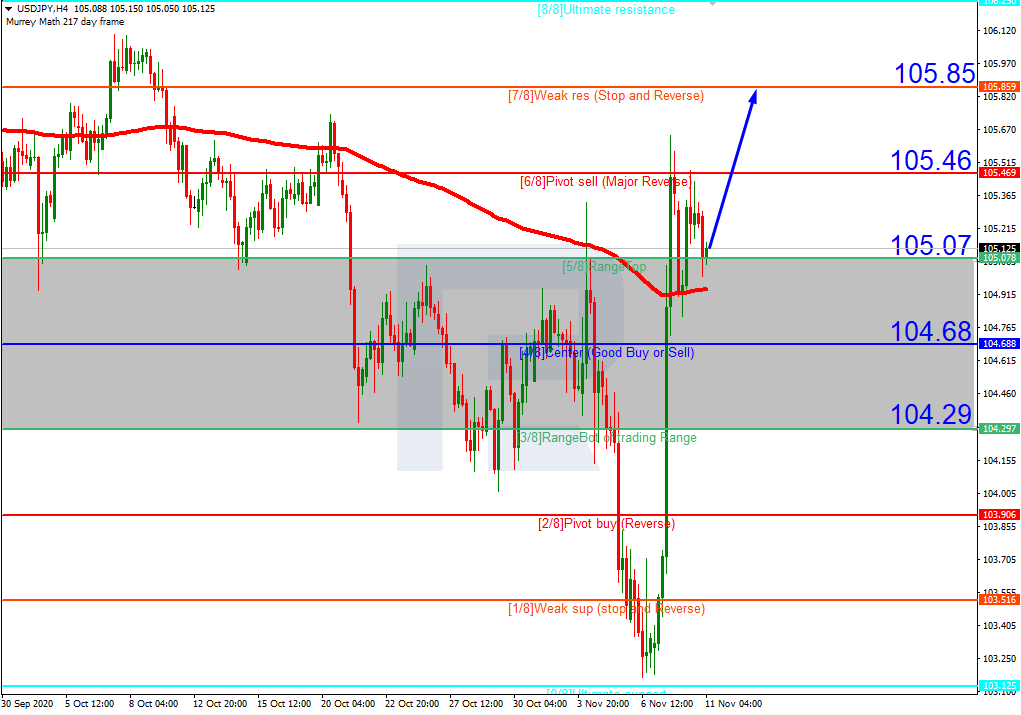
In the H4 chart, after breaking 5/8, USDJPY is moving above the 200-day Moving Average, thus indicating a possible ascending tendency. In this case, the price is expected to continue growing towards 105.85. However, this scenario may no longer be valid if the price breaks 5/8 to the downside. After that, the instrument may continue falling to reach the support at 4/8.

USDJPY_H4
Risk Warning: the result of previous trading operations do not guarantee the same results in the future

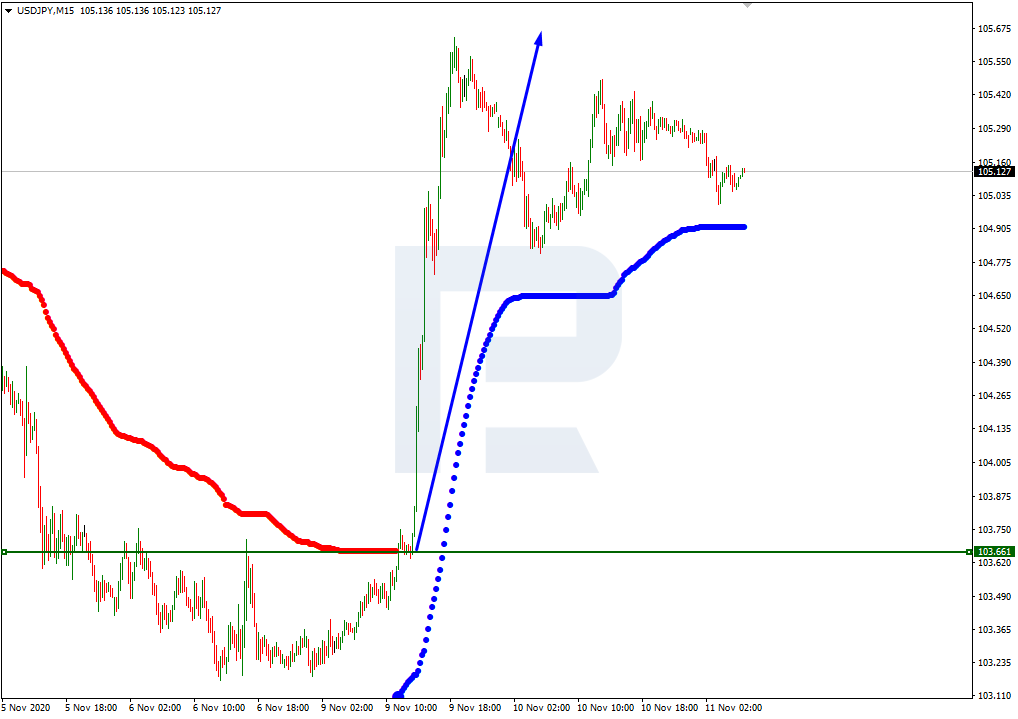
As we can see in the M15 chart, the pair has broken the upside line of the VoltyChannel indicator and, as a result, may continue moving upwards.

USDJPY_M15
Risk Warning: the result of previous trading operations do not guarantee the same results in the future

USDCAD, “US Dollar vs Canadian Dollar”

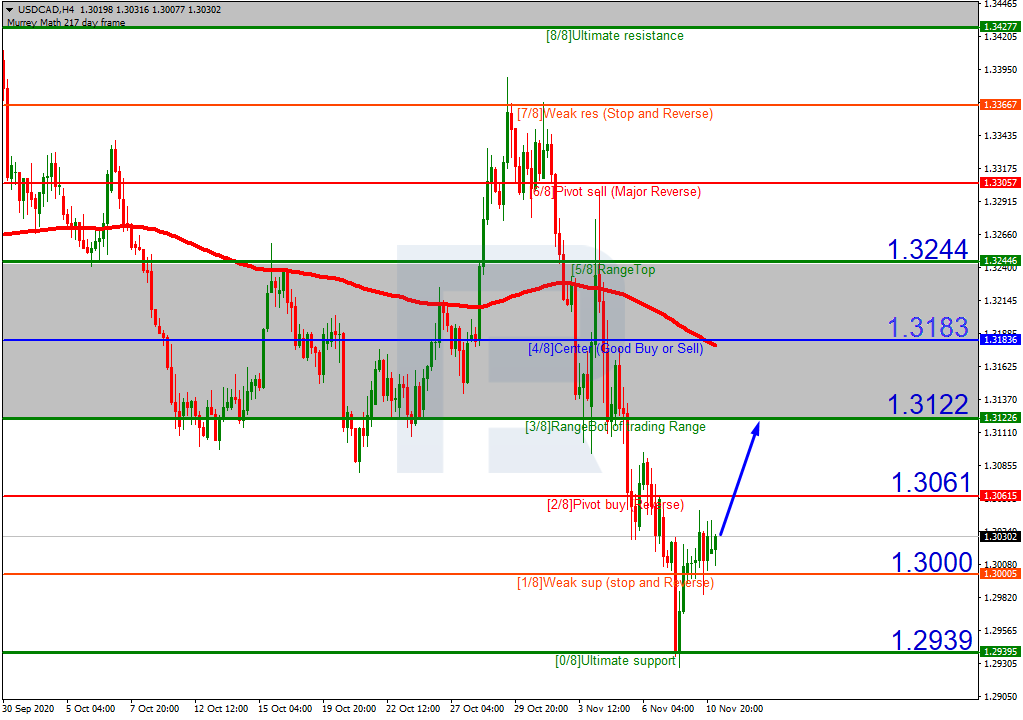
As we can see in the H4 chart, USDCAD is moving below the 200-day Moving Average but the asset rebounded from 0/8 several days ago. In this case, the pair is expected to correct towards 3/8. Still, this scenario may no longer be valid if the price breaks 1/8 to the downside. After that, the instrument may continue moving downwards to reach the support at 0/8.

USDCAD_H4
Risk Warning: the result of previous trading operations do not guarantee the same results in the future

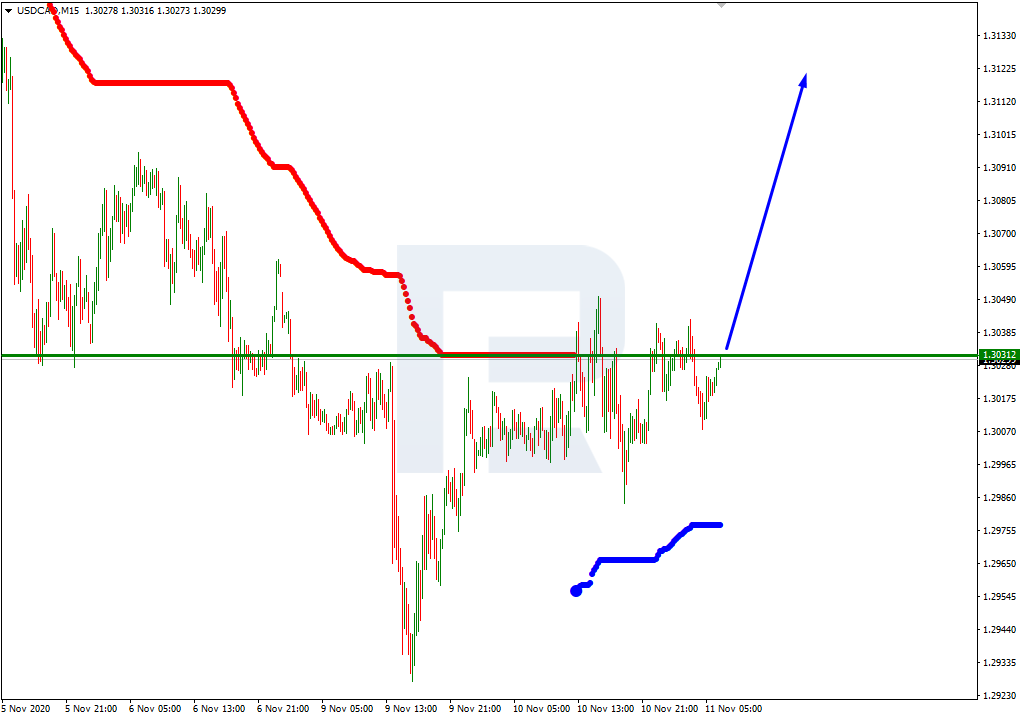
In the M15 chart, the pair may break the upside line of the VoltyChannel indicator and, as a result, continue trading upwards.

USDCAD_M15

Article By RoboForex.com

Attention!
Forecasts presented in this section only reflect the author’s private opinion and should not be considered as guidance for trading. RoboForex LP bears no responsibility for trading results based on trading recommendations described in these analytical reviews.

Biden Declares ‘America Is Back’!

By Orbex

Dollar Remains Cautious

The US index gave way to some of Monday’s gains as it closed slightly lower yesterday.

The dollar continues to look at the US political scenario in the wake of Joe Biden’s victory. Donald Trump is still pressing ahead with filing lawsuits against certain states in the hope of a recount.

However, Biden did not waste any time with contacting world leaders, as he prepares for his four years in the White House.

ECB Warns of Collapse

The EURUSD was another instrument that closed indecisively on Tuesday as the ECB announced a grim reading for the eurozone.

Recent lockdown restrictions across the continent have hit businesses hard, with countries such as Spain, Italy, and France feeling the effects.

On a positive note, the ECB stated that if a vaccine is found that ensures the ripple effects are not long lasting or recurring, then there is hope for the damage to be minimal.

Sterling Punches Through 1.32

The pound closed 0.82% higher yesterday, its fourth consecutive positive session.

Upbeat labor market figures and vaccination optimism spurred on the pound, as bulls keep a keen eye on the ongoing Brexit talks.

Hints of a compromise on fishing rights in trade negotiations also buoyed the GBPUSD pair, as we close in on the UK/EU cross-border divorce at the end of this year.

Uneven Equity Market Caps Tuesday’s Session

The Dow was the main winner in yesterday’s session as it closed 0.89% higher. This was a role reversal of the Nasdaq, as it closed over 1% down.

The tech sell-off became apparent with the strong results from the Pfizer vaccine announcement. Focus shifted on the fact that if a vaccination comes into fruition, then there will be fewer chances of further government fiscal relief.

Gold Attempts to Bounce Back

Gold finished 0.69% higher on Tuesday but remains a long way off regaining Monday’s sell-off, after suffering its largest daily percentage decline since August.

Bulls will be looking at capitalizing on the risk-off mood should further signs of an antidote turn into a reality.

WTI Pushes Higher

Oil rose by another 5% yesterday as the positive reaction to the Pfizer vaccine continues.

In addition, the API reported a significant crude draw as it revealed a more than 5-million-barrel draw for last week.

Attention will now turn to see if the black gold can maintain its $42 grip.

By Orbex

Forex Technical Analysis & Forecast 11.11.2020

Article By RoboForex.com

EURUSD, “Euro vs US Dollar”

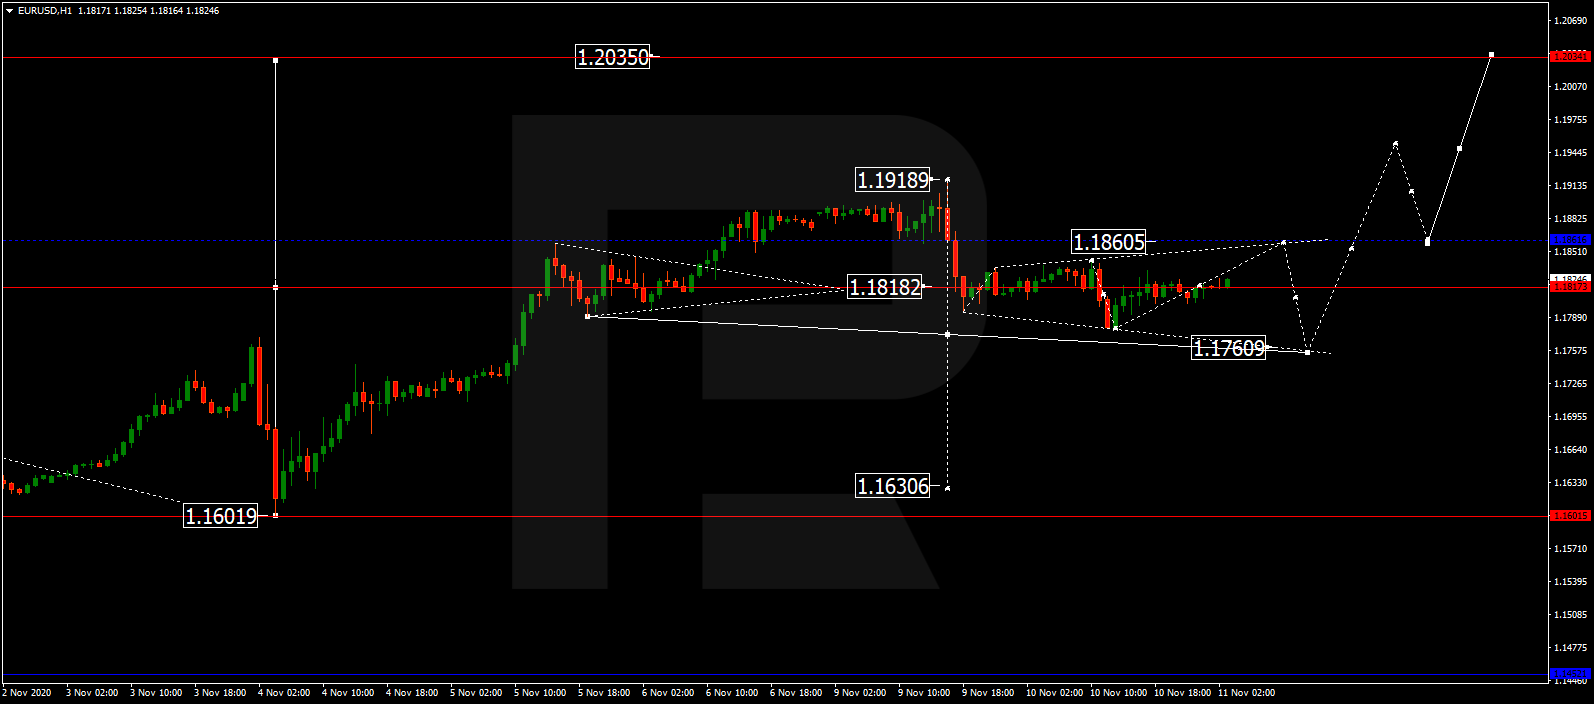
EURUSD is still consolidating around 1.1818. Possibly, today the pair may grow towards 1.1860 and then form a new descending structure to reach 1.1760. After that, the instrument may start another growth to break 1.1860 and then continue trading upwards with the target at 1.1944.

EURUSD
Risk Warning: the result of previous trading operations do not guarantee the same results in the future

GBPUSD, “Great Britain Pound vs US Dollar”

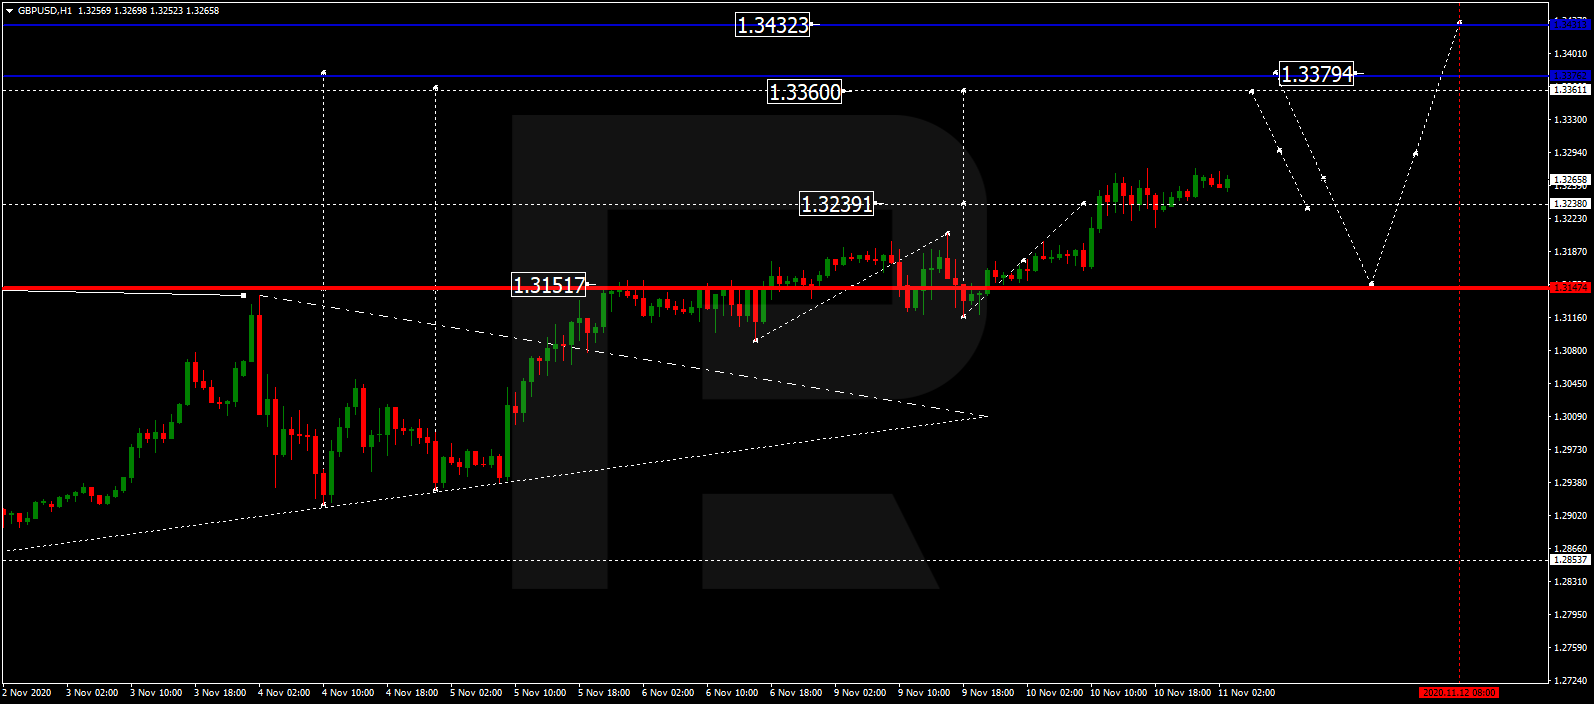
After finishing the ascending structure at 1.3232, GBPUSD is still consolidating around this level; right now, it is trading to break the range to the upside. Possibly, the pair may grow to reach 1.3360 and then start a new correction towards 1.3240. After that, the instrument may form one more ascending structure with the target at 1.3379.

GBPUSD
Risk Warning: the result of previous trading operations do not guarantee the same results in the future

USDRUB, “US Dollar vs Russian Ruble”

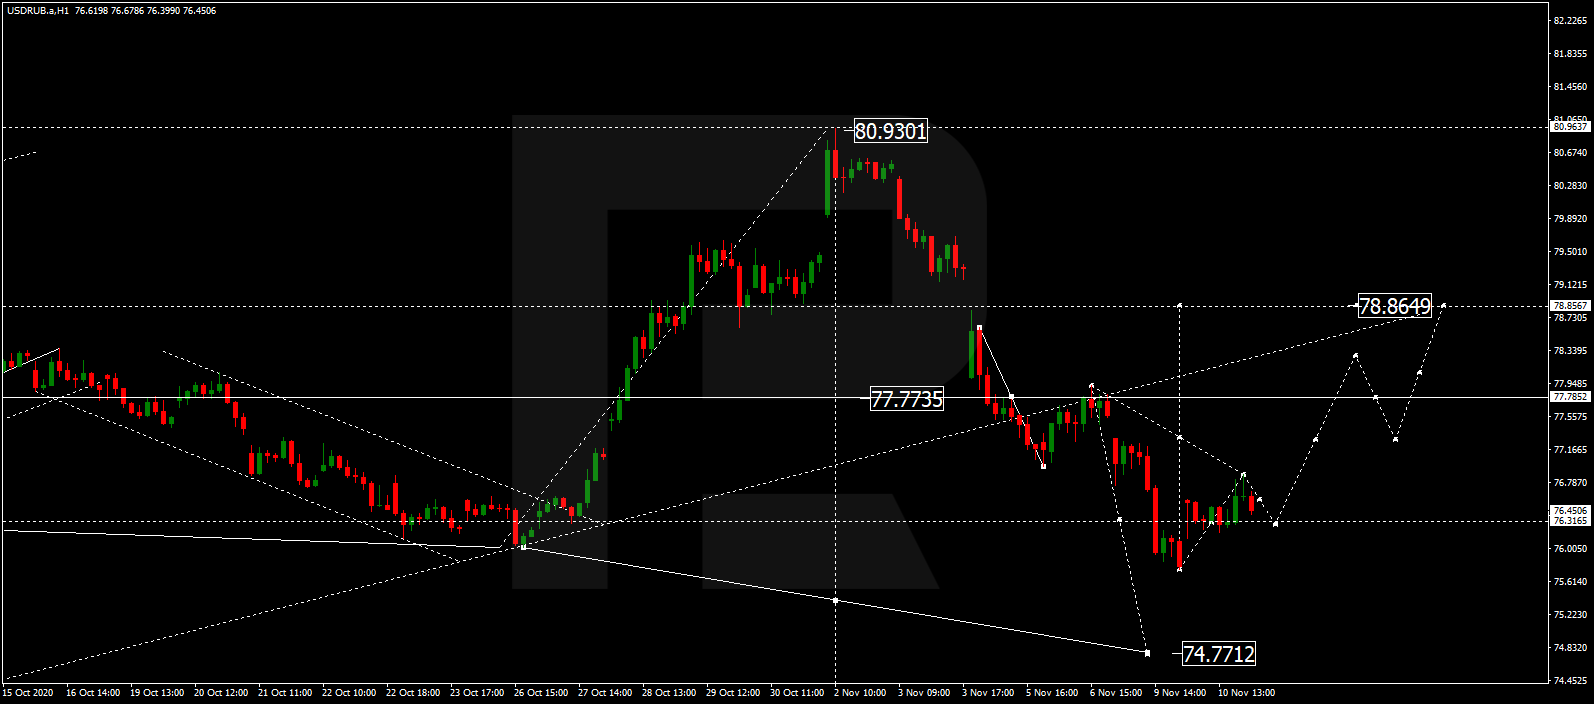
After finishing the ascending structure at 76.86, USDRUB is expected to fall towards 76.26, thus forming a new consolidation range between these two levels. If later the price breaks this range to the upside, the market may start another correction to reach 77.77; if to the downside – resume trading downwards to extend the descending wave with the target at 74.77.

USDRUB
Risk Warning: the result of previous trading operations do not guarantee the same results in the future

USDJPY, “US Dollar vs Japanese Yen”

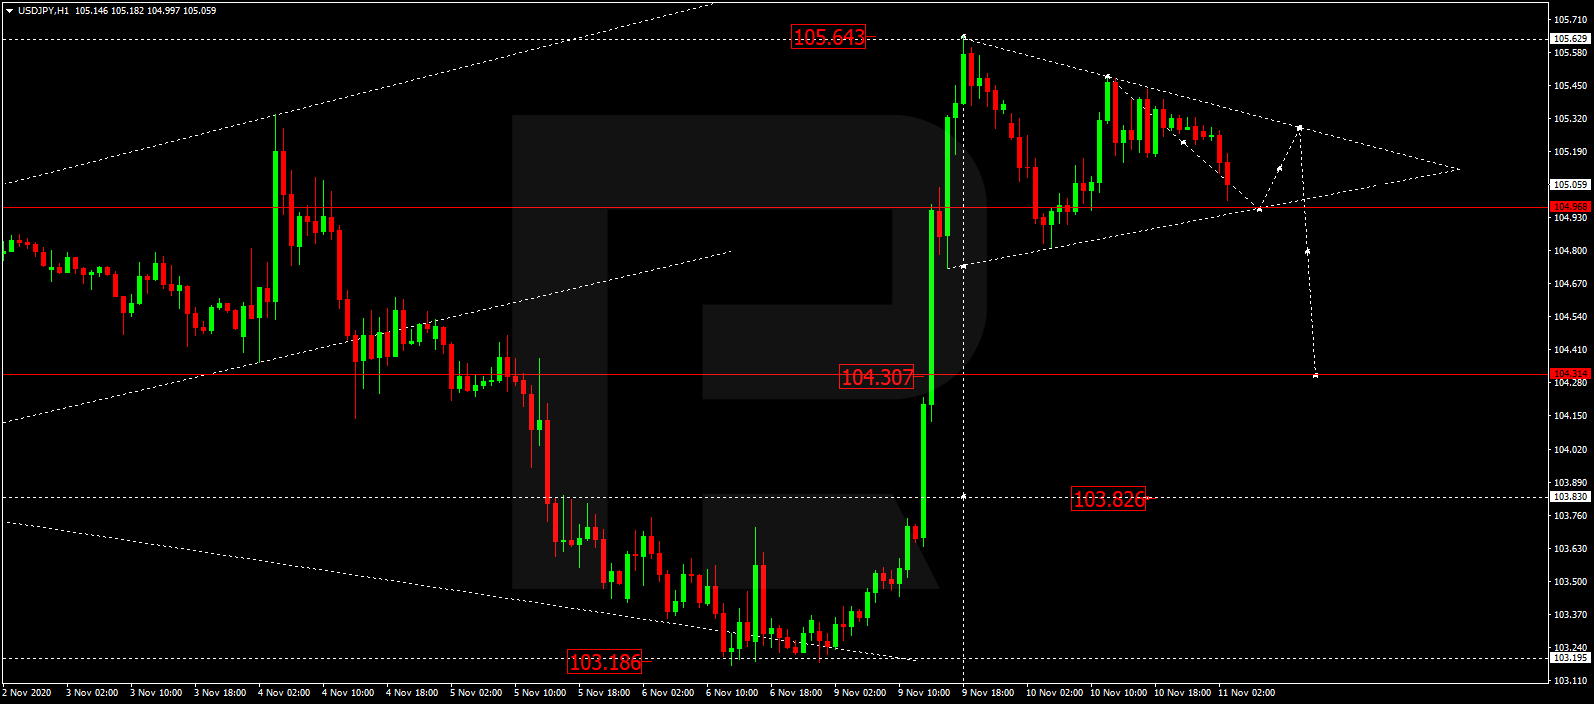
USDJPY has finished the descending impulse at 104.80 along with the correction towards 105.45, thus forming a new consolidation range between these two levels. If later the price breaks this range to the downside, the market may resume trading downwards with the target at 104.34.

USDJPY
Risk Warning: the result of previous trading operations do not guarantee the same results in the future

USDCHF, “US Dollar vs Swiss Franc”

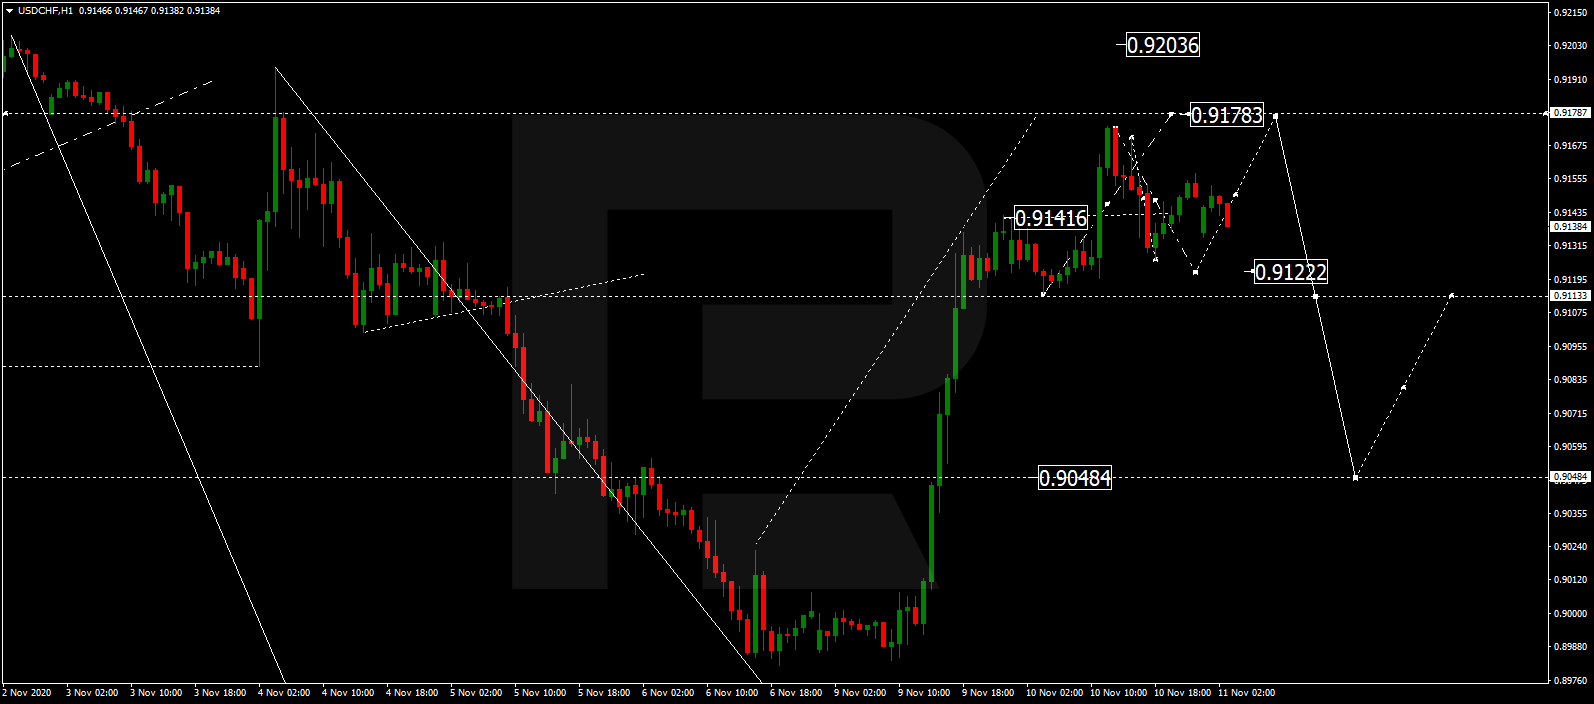
USDCHF is consolidating around 0.9141. Today, the pair may fall to reach 0.9122 and then start another growth towards 0.9178. Later, the market may resume moving downwards with the target at 0.9048.

USDCHF
Risk Warning: the result of previous trading operations do not guarantee the same results in the future

AUDUSD, “Australian Dollar vs US Dollar”

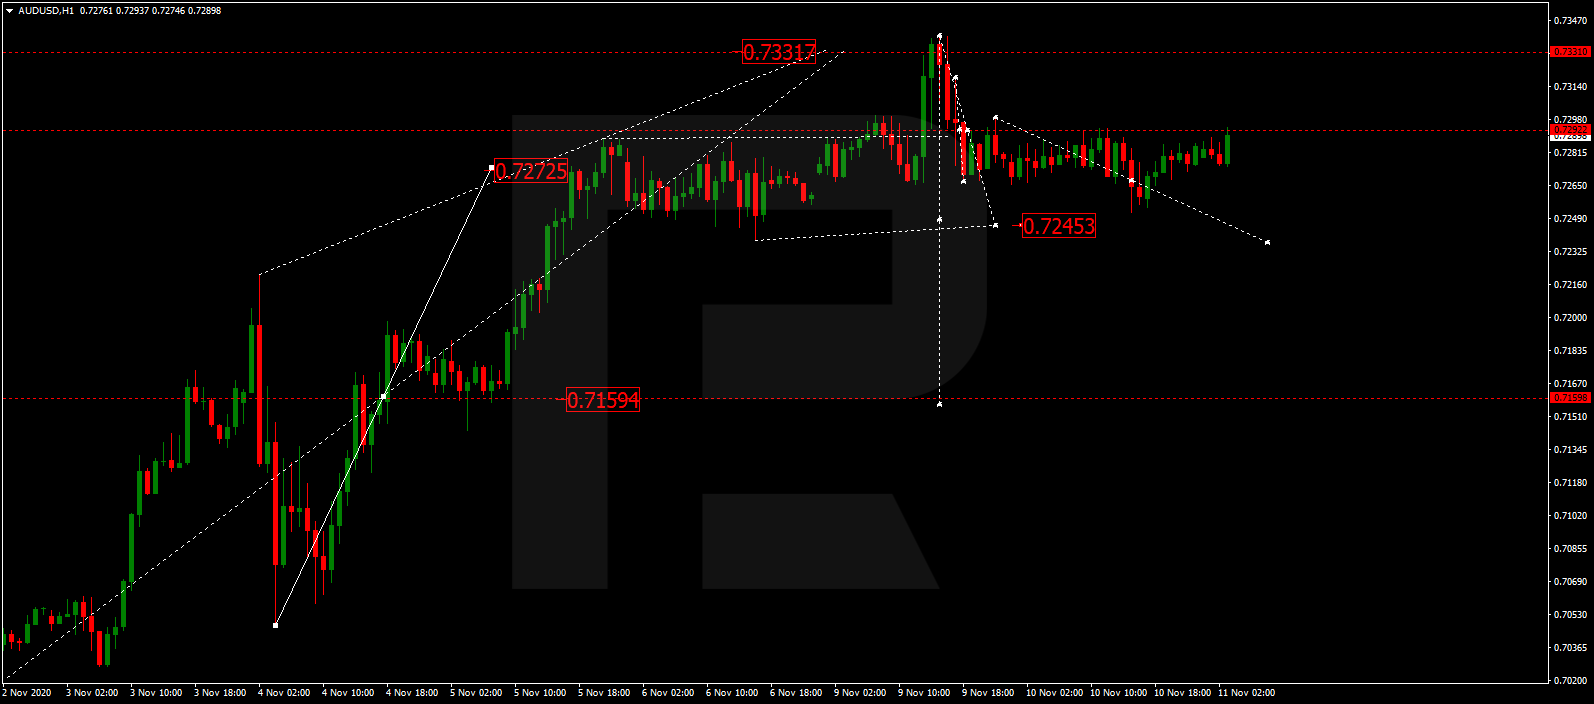
After forming a new consolidation range around 0.7292, AUDUSD is expected to fall towards 0.7245 and may later grow to return to 0.7292, thus forming a new consolidation range between these levels. If later the price breaks this range to the upside, the market may form one more ascending structure to reach 0.7333; if to the downside – start a new correction with the target at 0.7150.

AUDUSD
Risk Warning: the result of previous trading operations do not guarantee the same results in the future

BRENT

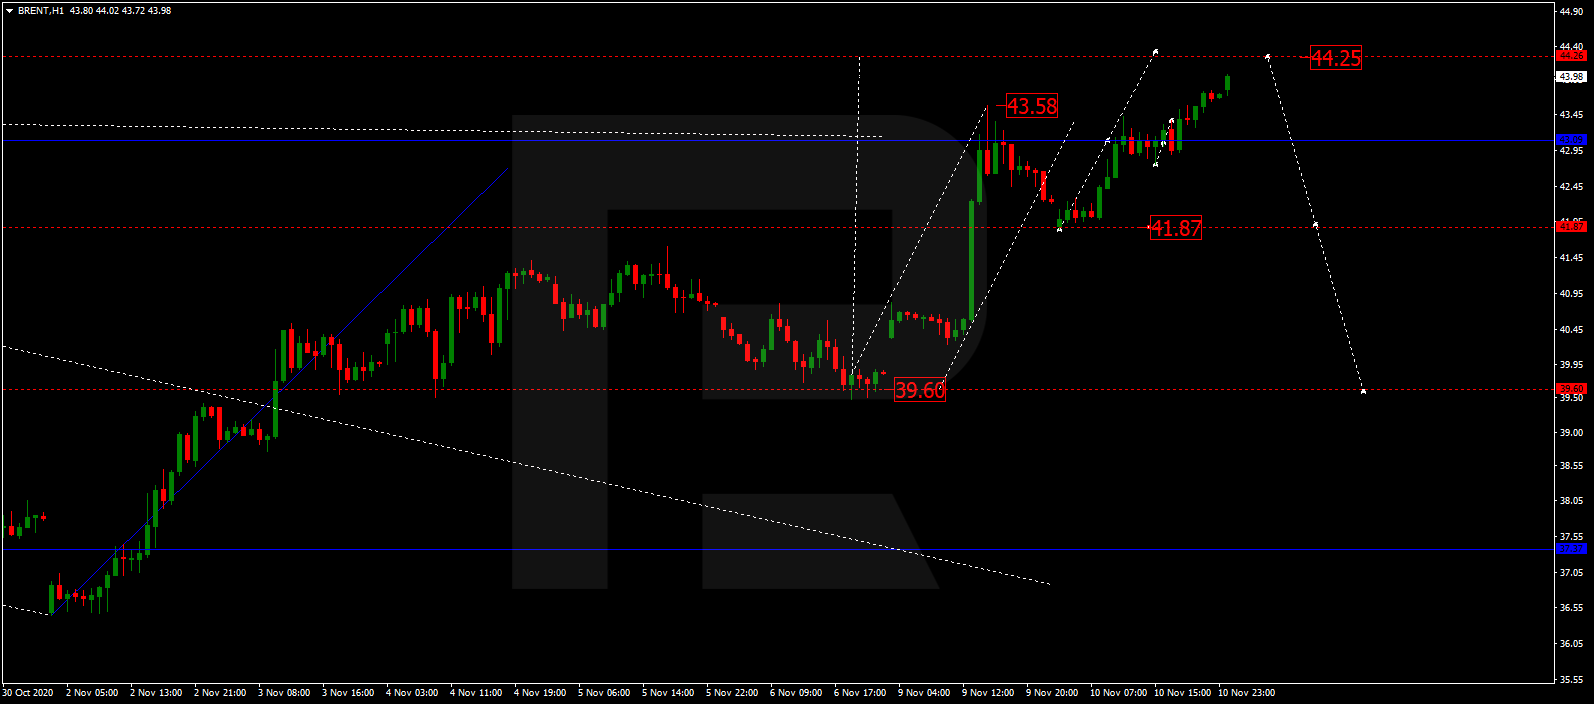
Brent is moving upwards. Possibly, the asset may extend this ascending wave up to 44.25 and then start a new correction with the closest target at 41.87. If later the price breaks this level, the market may continue the correction towards 39.60. After that, the instrument may form one more ascending wave with the target at 46.60.

BRENT
Risk Warning: the result of previous trading operations do not guarantee the same results in the future

XAUUSD, “Gold vs US Dollar”

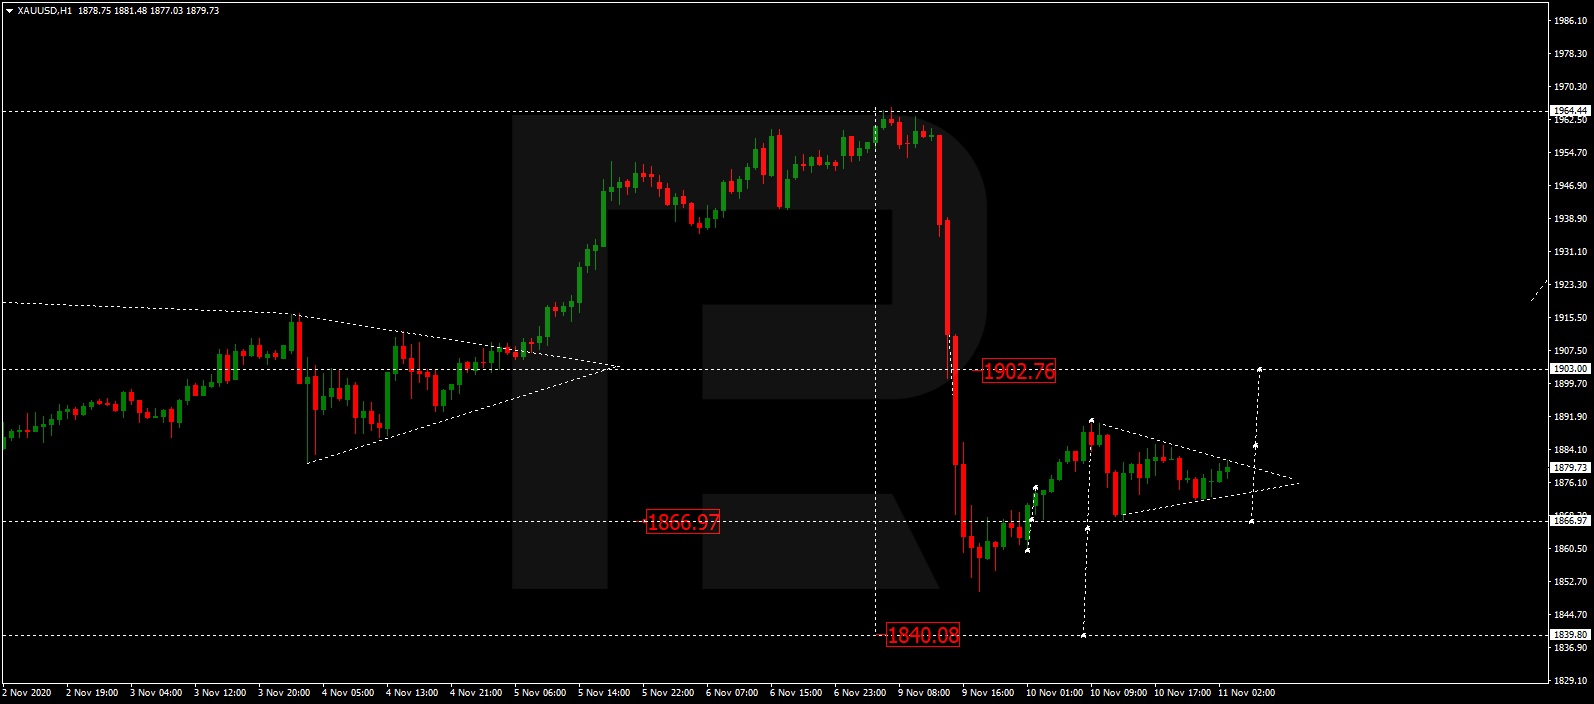
After finishing the ascending wave at 1890.30 along with the correction towards 1867.50, Gold is expected to form a new consolidation range between these levels. If later the price breaks this range to the upside, the market may continue the correction to reach 1902.70, at least, and then resume trading downwards with the target at 1840.08.

GOLD
Risk Warning: the result of previous trading operations do not guarantee the same results in the future

BTCUSD, “Bitcoin vs US Dollar”

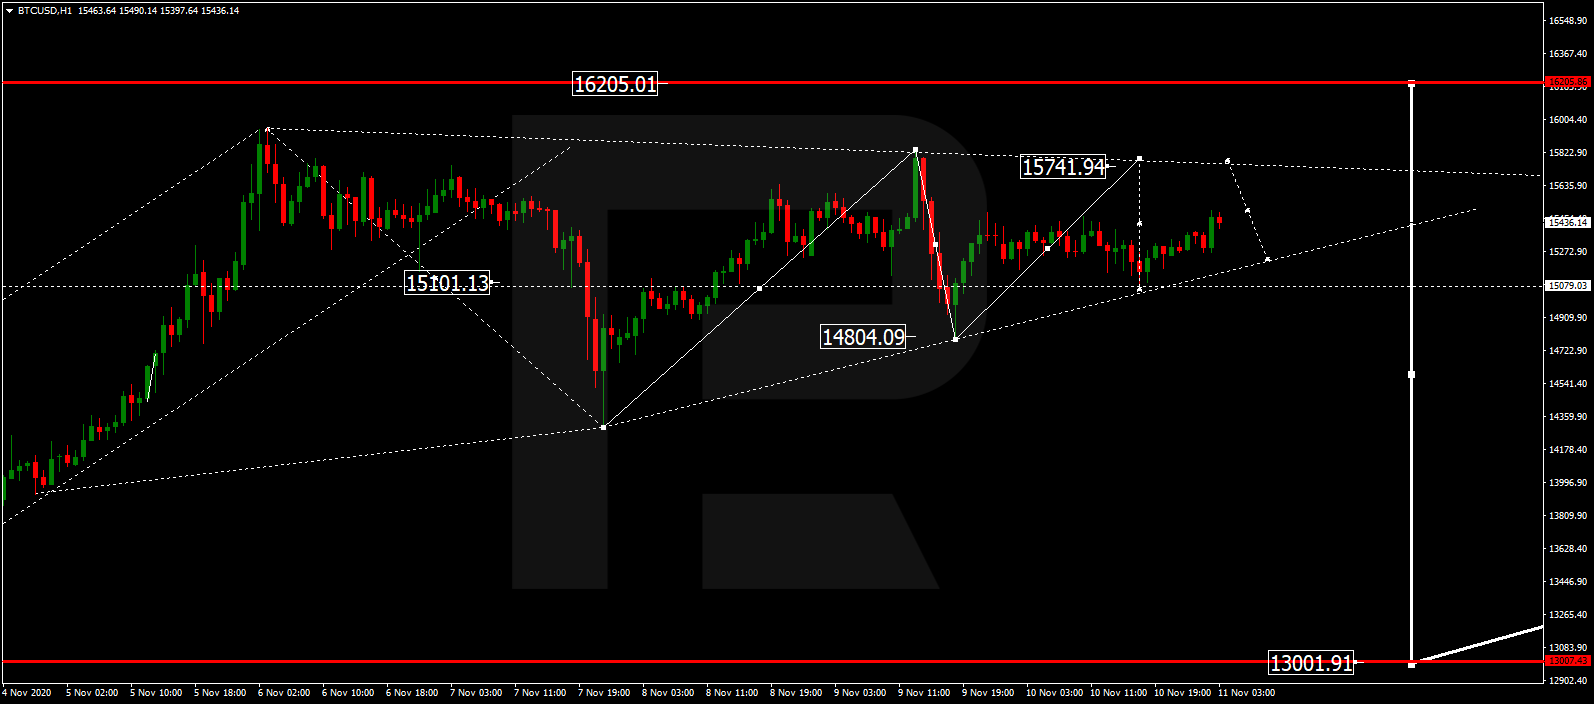
BTCUSD is forming a wide consolidation range around 15100.00. Possibly, today the asset may grow towards 15750.00 and then fall to reach 15200.00. If later the price breaks this range to the upside, the market may start another growth with the target at 16200.00; if to the downside – continue the correction towards 14500.00 and then resume growing to reach the above-mentioned target.

BITCOIN
Risk Warning: the result of previous trading operations do not guarantee the same results in the future

S&P 500

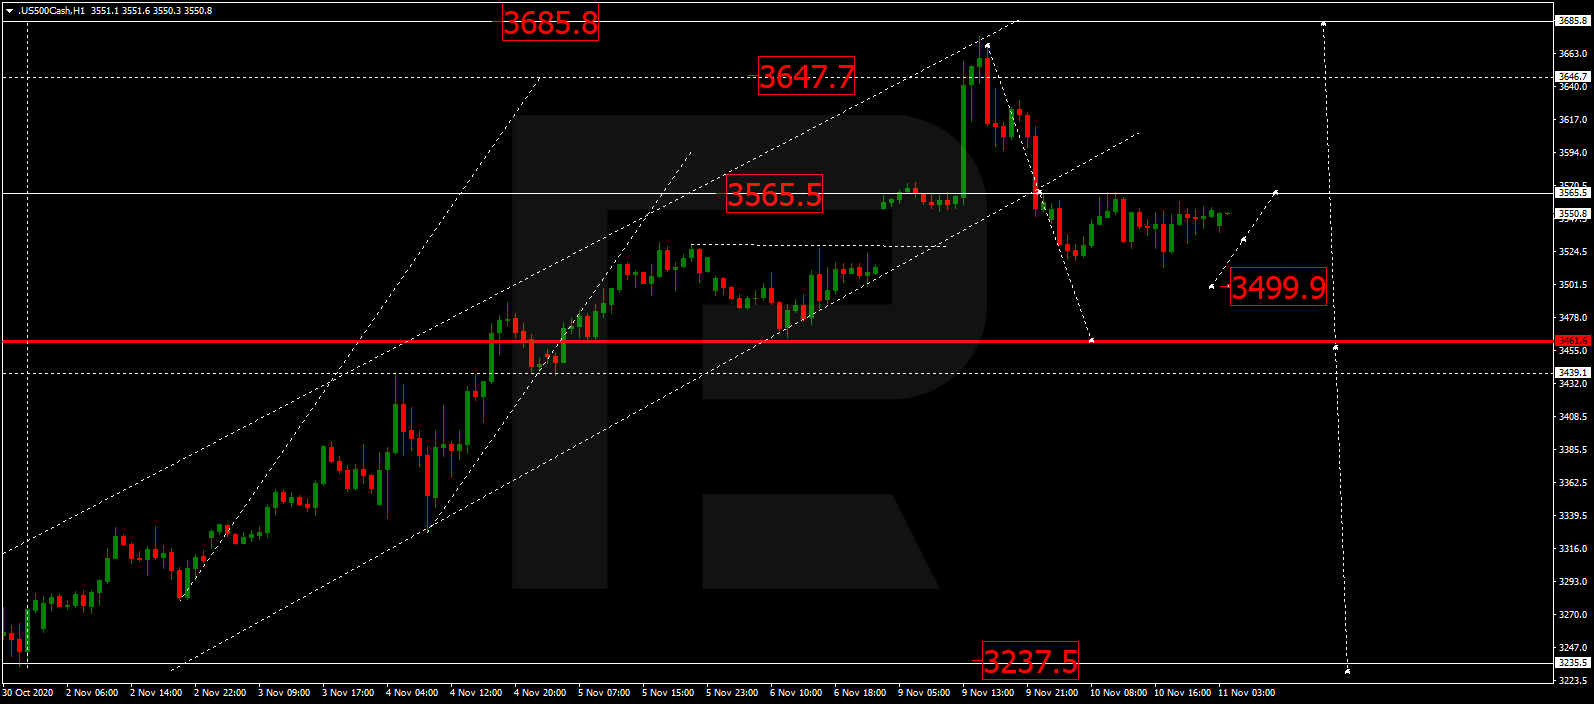
After breaking the ascending channel at 3565.5, the S&P index is consolidating below this level. Possibly, the asset may fall towards 3499.9 and then start another correction to return to 3565.5. After that, the instrument may form a new descending structure with the target at 3461.6.

S&P 500

Article By RoboForex.com

Attention!
Forecasts presented in this section only reflect the author’s private opinion and should not be considered as guidance for trading. RoboForex LP bears no responsibility for trading results based on trading recommendations described in these analytical reviews.

Will the Bank of England’s reliance on quantitative easing work for the UK economy?

By Ghulam Sorwar, Keele University 

– It was the Bank of Japan which first embarked on the experiment known as quantitative easing, or QE, in order to try and stimulate the Japanese economy out of its period of very low growth known as the “lost decade” between 1991 and 2001. Since the global financial crisis and recession of 2007-2009, quantitative easing has been a mainstay of western governments’ monetary policies aimed at stabilising the economy.

However, central banks have spent trillions on QE since in the years since – £895 billion in the UK alone – and as the Bank of England launches a new £150 billion stimulus package there are questions as to whether QE can provide the economic stability governments and markets are hoping for in the face of economic paralysis caused by the pandemic.

QE in a nutshell

With quantitative easing, central banks create money to buy government-issued bonds from banks and other investors, which provides them with cash to lend or invest in the economy. This prompts increased demand for government bonds, which in turn raises their price and causes the returns on the bonds to fall.

Governments issue bonds of different duration, the length of time before the government repays the value of the bond back to the purchaser, which range from a few years to many decades. Each bond of different duration is worth a different amount of money in repayments to the purchaser, known as a yield. Plotting yields against the duration of the bond generates what is called a yield curve.

Under normal economic conditions we expect yield curves to increase as duration increases – a rising yield curve. Quantitative easing has two effects on yield curves: it lowers the curve, so that yields are lower for bonds of all durations, and it forces the yield on longer duration bonds to fall into line with those of shorter duration, flattening the yield curve. Faced with these lowered returns from investing in bonds, banks and investors are more inclined to invest in the real economy where better returns can be found, providing an economic boost.

Has QE been effective, and can it be effective now?

Looking at the 12 years of quantitative easing in western economies since the financial crisis, and 20 years in the case of Japan, the impact of QE has been mixed. For Japan specifically there is some evidence that QE reduced the long-term interest rate, causing the Japanese Yen to depreciate. For other advanced economies, one of the main motivations was to avoid a surge in unemployment, and in this regard QE succeeded in both the UK and the US – at least, until the pandemic.

When QE began it was seen as a temporary, emergency measure. Yet more than a decade later it continues, and grows. One side effect of QE is that it has made the rich richer: borrowers with large mortgages benefit from lower interest rates. The excess cash now washing around the economy has caused stock market bubbles in financial markets.

Coordinated action from the Treasury and the Bank of England indicates that they believe the economy to be in serious trouble. The furlough scheme has been extended to end of March 2021, which may indicate that the government is not convinced the UK will emerge from lockdown in December, and, as comments have hinted, lockdown may extend into the new year. This will lead to a double-digit decline in the UK economy for 2020.

A new round of QE in Britain must be seen in this context, perhaps motivated by additional factors such as the very low inflation rate of 0.7% (as measured by the consumer price index). Given such a low rate it’s possible that the coming period of depressed economic activity may lead to negative inflation rates – otherwise known as deflation, as briefly occurred during 2015-2016. The bank may see QE as a precautionary measure to avoid deflation, which causes problems including a decline in consumer spending and an effective rise in interest rates.

The next 12 months

But what of next spring, in March 2021 when the furlough scheme ends? The Bank of England and the Treasury will be busy: the bank may inject more money into the economy yet more rounds of QE, coupled with lowering the bank interest rate further – from its current all-time low of 0.1% perhaps even into negative territory. This will force commercial banks to invest their money in the real economy, as the only means to generate a return. Looked at in this context, the current QE can be interpreted as preparing the ground for negative interest rates, with the expectation that inflation will remain low for the foreseeable future.

All these factors will make it even cheaper for the Treasury to borrow by issuing bonds with very low yields. Heading towards a post-pandemic world, we should expect more government borrowing in order to support the economy.

We cannot know for sure whether this arrangement of the Treasury issuing bonds to investors and the Bank of England buying them back will be successful until counting the costs, well after the pandemic has ended. That said, if the UK can avoid a substantial rise in unemployment after the furlough scheme ends, or if a short spike quickly recovers by the end of 2021 alongside wider economic growth, then we will be through the worst and may judge the current strategy to have been a success.The Conversation

About the Author:

Ghulam Sorwar, Professor of Finance, Keele University

This article is republished from The Conversation under a Creative Commons license. Read the original article.

Mid-week technical outlook: Time for a Dollar rebound?

By Lukman Otunuga, Research Analyst, ForexTime

The last two days have been wild for financial markets!

After an explosion of vaccine optimism propelled global stocks to record highs earlier in the week, questions were later raised over how the drug will be produced and delivered which essentially dragged investors back to reality. Persistent concerns around the U.S fiscal stimulus and possible delay in the transition of power to President-elect Joe Biden dampened the market mood while surging coronavirus cases in Europe and the United States rubbed salt into the wound. With uncertainty still the name of the game and the core themes weighing on global sentiment firmly intact, king Dollar could make a comeback.

Talking technicals, the Dollar Index (DXY) remains in a wide range on the monthly timeframe with support at 92.00 and resistance at 95.00. The last time prices traded outside these regions was back in June 2020. Over the past few weeks, it has felt like the Dollar has been waiting for a fresh directional catalyst to breakout of the current range. If bulls are able to conquer the 95.00 resistance level, the Dollar Index could challenge 98.00 and beyond. However, a breakdown below 92.00 is seen opening the doors back towards 90.00.

It is the same story on the weekly timeframe. Prices are respecting a bearish channel; however strong support can be found around 92.00. Lagging indicators such as the 20 Simple Moving Average and MACD point to the downside. However, a daily close above 94.00 may trigger a move towards 94.80 and 95.00.

Before we knuckle down on the daily time, it must be kept in mind that there a wide selection of fundamentals themes influencing the Dollar. On Thursday, all eyes will be on the latest US inflation and jobless claims data which should provide fresh insight into the health of the largest economy in the world. Tomorrow’s U.S. inflation numbers expect to see a 0.1% increase to 1.8% in the core number, which excludes food and fuel while CPI is expected to dip to 1.3% this from 1.4%.

Focusing back on the technicals, the Dollar Index is trading above 92.70 as of writing. A solid close above the 93.40 level could pave a way towards 94.00 and 94.65. If 92.70 proves to be unreliable support, the DXY may slip back towards the 92.00 support.

Disclaimer: The content in this article comprises personal opinions and should not be construed as containing personal and/or other investment advice and/or an offer of and/or solicitation for any transactions in financial instruments and/or a guarantee and/or prediction of future performance. ForexTime (FXTM), its affiliates, agents, directors, officers or employees do not guarantee the accuracy, validity, timeliness or completeness, of any information or data made available and assume no liability as to any loss arising from any investment based on the same.


Forex-Time-LogoArticle by ForexTime

ForexTime Ltd (FXTM) is an award winning international online forex broker regulated by CySEC 185/12 www.forextime.com

Gold bulls take a big hit on vaccine headlines – 2,000 USD off the table?

By Admiral Markets

Economic Events November 11, 2020Source: Economic Events November 11, 2020 – Admiral Markets Forex Calendar

On one hand, we were initially right on our latest expectation for Gold. In our last technical piece for Gold last week, we wrote that the true winner of the US presidential election would be a member of neither the democratic or republican party, but the yellow metal: Gold. However, the tide turned dramatically on Monday after Pfizer/BioNTech announced that they are on their way to a Covid-19 vaccine that is said to be effective in preventing the virus in over 90% of cases.

As a result, US yields sharply rose with market participants seeing chances of a massive fiscal stimulus plan dropping. But we are not yet convinced that this news is a real game-changer.

In the Pfizer trial, there were 43,358 people involved, 50% of whom received the vaccine and 50% of whom received a placebo. Upon its first analysis of participants, of the 43,358 patients, 94 contracted Covid-19. Pfizer claims that the efficacy rate of the vaccine is above 90%.

While the first signs are definitely positive, we are still convinced that we are far from returning to “normal”, especially from an economic perspective. As we already pointed out several times in the past (e.g. here), chances of a massive fiscal package to stabilize the US economy and an ultra-dovish approach from the US central bank FED to finance that fresh US debt is likely still on the table, which was underlined by FED chairman Powell last week on Wednesday saying that the FED hasn’t considered slowing the $120 billion per-month pace of bond-buying.

That in mind, leaves us in a very difficult spot right now:

  • The Gold daily chart, technically, looks ugly after the failed attempt to break above 1,975 USD
  • Gold fell straight down to 1,850 USD in one daily candle, leaving an increased chance of a near-term test of 1,800 USD and drop even lower (target around 1,745/750 USD) on the table
  • The next US government, (most likely democratic, but depending on the legal developments) has no other choice than to deliver a massive fiscal stimulus package, financed with freshly printed US-Dollar

However, a stimulus plan should create an overall favorable and bullish environment for the precious metal, since vaccine hopes and, lastly, a vaccine won’t spur the demand needed to initiate higher consumption and economic growth, in general.

In addition to that, Gold finds itself in quite a positive position for Long engagements, risk-reward wise: the precious metal is about to enter a historically known seasonal bullish window in December and January which could drive the price of the yellow metal back towards 2,000 USD.

Gold Daily chartSource: Admiral Markets MT5 with MT5SE Add-on Gold Daily chart (from June 26, 2019, to November 10, 2020). Accessed: November 10, 2020, at 05:30 PM GMT. Please note: Past performance is not a reliable indicator of future results, or future performance.


In 2015, the value of Gold fell by 10.4%, in 2016, it increased by 8.1%, in 2017, it increased by 13.1%, in 2018, it fell by 1.6%, and in 2019, it increased by 18.9%, meaning that in five years, it was up by 28%.

Discover the world’s #1 multi-asset platform

Admiral Markets offers professional traders the ability to trade with MetaTrader 5, allowing you to experience trading at a significantly higher, more rewarding level than with MetaTrader 4. Experience benefits such as the addition of the Market Heat Map, so you can compare various currency pairs to see which ones might be lucrative investments, access real-time trading data, and so much more. Click the banner below to start your FREE download of MT5!

Trade With MetaTrader 5

Disclaimer: The given data provides additional information regarding all analysis, estimates, prognosis, forecasts or other similar assessments or information (hereinafter “Analysis”) published on the website of Admiral Markets. Before making any investment decisions please pay close attention to the following:

  1. This is a marketing communication. The analysis is published for informative purposes only and is in no way to be construed as investment advice or recommendation. It has not been prepared in accordance with legal requirements designed to promote the independence of investment research, and that it is not subject to any prohibition on dealing ahead of the dissemination of investment research.
  2. Any investment decision is made by each client alone whereas Admiral Markets shall not be responsible for any loss or damage arising from any such decision, whether or not based on the Analysis.
  3. Each of the Analysis is prepared by an independent analyst (Jens Klatt, Professional Trader and Analyst, hereinafter “Author”) based on the Author’s personal estimations.
  4. To ensure that the interests of the clients would be protected and objectivity of the Analysis would not be damaged Admiral Markets has established relevant internal procedures for prevention and management of conflicts of interest.
  5. Whilst every reasonable effort is taken to ensure that all sources of the Analysis are reliable and that all information is presented, as much as possible, in an understandable, timely, precise and complete manner, Admiral Markets does not guarantee the accuracy or completeness of any information contained within the Analysis. The presented figures that refer to any past performance is not a reliable indicator of future results.
  6. The contents of the Analysis should not be construed as an express or implied promise, guarantee or implication by Admiral Markets that the client shall profit from the strategies therein or that losses in connection therewith may or shall be limited.
  7. Any kind of previous or modelled performance of financial instruments indicated within the Publication should not be construed as an express or implied promise, guarantee or implication by Admiral Markets for any future performance. The value of the financial instrument may both increase and decrease and the preservation of the asset value is not guaranteed.
  8. The projections included in the Analysis may be subject to additional fees, taxes or other charges, depending on the subject of the Publication. The price list applicable to the services provided by Admiral Markets is publicly available from the website of Admiral Markets.
  9. Leveraged products (including contracts for difference) are speculative in nature and may result in losses or profit. Before you start trading, you should make sure that you understand all the risks.

By Admiral Markets

Alibaba unloved on Singles Day

By Han Tan, Market Analyst, ForexTime

Singles Day is here!

That usually heralds a sales extravaganza for shoppers around the world, and a potential windfall for e-commerce giant Alibaba.

On November 11th 2019, Alibaba’s platforms racked up US$38 billion worth of sales, which is more than Facebook’s total revenue from the first half of 2020. That tally is set to be well-beaten at this year’s Singles Day event, with consumers set to unleash pent-up demand due to months spent at home under the pandemic-induced lockdown.

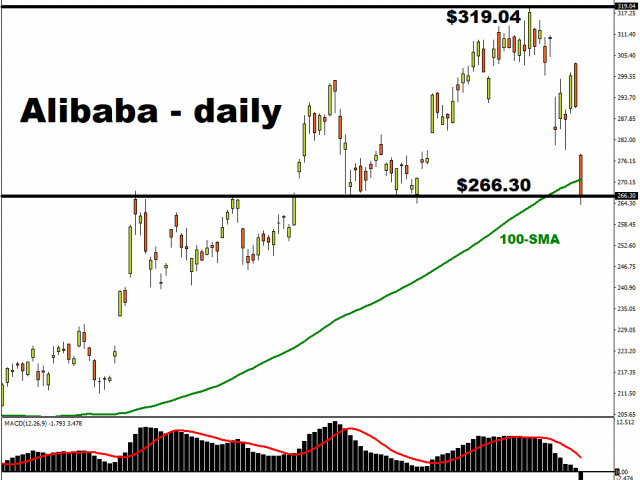
However, the excitement surrounding Alibaba’s offerings in the online marketplace haven’t translated over to its shares. Since posting a new record high on October 27th, Alibaba’s shares in New York have fallen by almost 16 percent to drop below its 100-day simple moving average (SMA) and test a key support level at the $266.30 level at Tuesday’s close.

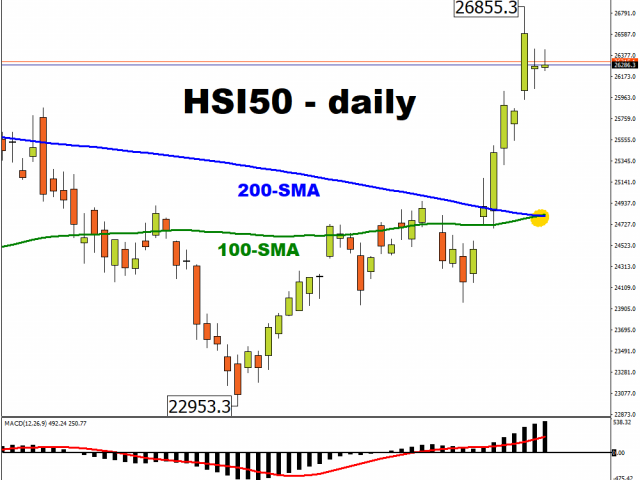
At the time of writing, Alibaba’s shares in Hong Kong are sinking by about 8.8 percent on Wednesday even as the Singles Day sales rage on, with today’s price action dragging it down to now more than 18 percent below its October 28th record high. Meanwhile the broader Hang Seng index edges higher with its 100-day SMA crossing above its 200-day counterpart.

The Singles Day sales this year would also take on additional significance, as it would be used as a barometer to further assess Chinese consumers’ willingness and ability to spend. China’s official retail sales data returned to year-on-year growth in August and September, and that momentum is expected to carry through into the Singles Day bonanza.

And just as Alibaba is domestically-focused, with about 93 percent of its total sales being generated from within China’s borders, so too is the world’s second largest economy having to become more reliant on internal drivers of growth, given that major Western economies are far from winning the battle against Covid-19. Domestic demand has taken on a more crucial role in further enabling China’s ability to lead the world into the post-pandemic era. China’s Q3 GDP expanded by 4.9 percent, in stark contrast to much of the rest of the world that is still contending with negative economic growth.

China’s remarkable economic recovery is also not lost on global brands that are looking to make up for sales lost to the pandemic. Household names such as Nike, Estee Lauder, and Apple are among those vying for a piece of China’s 400-million strong middle class, while another 2600 new foreign brands have jumped on the bandwagon this year.

From the company’s perspective, Alibaba is in real need of a boost, after having reported its slowest revenue growth on record for the Q3 period. Even at a 30 percent year-on-year increase, which would be astounding for most other companies, it wasn’t enough to stop chatter among investors that Alibaba’s e-commerce growth has plateaued. This may force the company to look for other drivers of top-line growth, including its cloud computing division, which posted a 60 percent growth in revenue and is forecasted to turn profitable by March 2021. Still this division is set to face tremendous challenges from other tech behemoths such as Amazon, Microsoft, Google, and even Tencent.

Still there are broader concerns that are exerting downward pressures on Alibaba’s shares. From the markets’ rotation away from tech megacaps, to increased regulatory concerns, to slowing growth prospects, Alibaba’s would need to find some measure of comfort, from somewhere, and fast. Otherwise, the company’s valuation risks unwinding more of its remaining 50 percent of gains since its March trough, with a big chunk having already been wiped out over the past fortnight.

Perhaps, once the dust settles, that’s where the real bargain lies: in beaten-down Alibaba stocks.


Disclaimer: The content in this article comprises personal opinions and should not be construed as containing personal and/or other investment advice and/or an offer of and/or solicitation for any transactions in financial instruments and/or a guarantee and/or prediction of future performance. ForexTime (FXTM), its affiliates, agents, directors, officers or employees do not guarantee the accuracy, validity, timeliness or completeness, of any information or data made available and assume no liability as to any loss arising from any investment based on the same.


Forex-Time-LogoArticle by ForexTime

ForexTime Ltd (FXTM) is an award winning international online forex broker regulated by CySEC 185/12 www.forextime.com