Risk assets march higher despite worsening pandemic

By Hussein Sayed, Chief Market Strategist (Gulf & MENA), ForexTime

With eight days to go until the end of the month, November has already added about a quarter of all US Covid-19 cases since the beginning of the pandemic. The number of daily new cases is rising rapidly and the percentage of positive tests in most US States is above the recommended 5% threshold. The healthcare system is under severe stress with at least 83,000 hospitalised Covid-19 patients and the number continues to go higher.

While European cases are showing signs of leveling off, several other nations such as Russia, Japan, Canada and Turkey among many others continue to struggle with rising infections.

If the pandemic is a barometer for risk, we should have seen equities, commodities and other risk assets tumble. However, several stock indices are hovering near record highs as investors are looking through the gloom to a better future.

According to the BofA monthly survey of 190 global fund managers, cash levels in portfolios fell to 4.1%, the lowest level since January, in a clear sign of the bullish mood among investors.

Whether the vaccine rally resumes in the upcoming weeks or takes a pause remains unknown. However, a lot of the positive news is already priced in and we are yet to see the economic damage caused by the Covid-19 second or third waves. Fiscal and monetary policy should continue to play a significant role in preventing a double dip recession, and investors will monitor those policymakers’ actions very closely until we are confident the economy can run on its own without support.

Today, the market will have a chance to assess how European business activity has been impacted by the latest lockdowns. Manufacturing and services flash PMIs will be released for Germany, France and the UK. The decline is unquestionable, but it is the pace of the declines which could be of concern. A sharp drop in activity will force the ECB and possibly the BoE to provide further stimulus by year end, but without bold fiscal measures central banks will struggle to stimulate aggregate demand.

Minutes from the Federal Reserve’s last policy meeting are due on Wednesday. Investors are looking for any hints on what changes may occur to the asset purchase program in December and beyond. The Fed may increase its quantity of purchased Treasury bonds, currently at $80 billion a month, and even extend the duration of bonds bought to longer-term maturities. While this may insure that borrowing costs remain in check, again it is fiscal support that’s needed to prevent another steep decline in growth.

The next several weeks will be interesting as investors continue to navigate the path of vaccine hope and pandemic reality. However, I continue to see long term opportunities in buying the dips.

Disclaimer: The content in this article comprises personal opinions and should not be construed as containing personal and/or other investment advice and/or an offer of and/or solicitation for any transactions in financial instruments and/or a guarantee and/or prediction of future performance. ForexTime (FXTM), its affiliates, agents, directors, officers or employees do not guarantee the accuracy, validity, timeliness or completeness, of any information or data made available and assume no liability as to any loss arising from any investment based on the same.


Forex-Time-LogoArticle by ForexTime

ForexTime Ltd (FXTM) is an award winning international online forex broker regulated by CySEC 185/12 www.forextime.com

Euro set for eventful week

By Han Tan, Market Analyst, ForexTime

The Euro is starting the trading week on a risk-on note, gaining against safe haven currencies such as the US Dollar, Japanese Yen, and Swiss Franc. However, the shared currency is slightly weaker against most of its G10 peers. EURUSD is now testing the top-end of its recent range, with momentum still pointing north. The FXTM Trader’s Sentiment is also net long on the currency pair.


Euro PMIs may show further signs of economic gloom

The Euro is set to react to the latest assessments as to how the EU economy is holding up under the strain of Covid-19’s resurgence across the continent, and Monday will see the release of its November PMIs.

Although the manufacturing sector is expected to remain in expansionary territory for a fifth consecutive month, perhaps more concerning is the services sector, where conditions improved in July and August only to have deteriorated since. The tightening virus curbs across the continent this quarter are stoking fears of a double-dip recession, and worse-than-expected PMI readings today could prompt the Euro to pull further below the 1.189 level against the Greenback.

Brussels battles internal and external political feuds

Even when faced with such dire economic prospects, the EU’s US$2 trillion economic recovery package is being held up by objections from Hungary and Poland. This economic relief package was due to have been rolled out in January, but will now be delayed. At least in this regard, the EU finds itself in the same boat as the US, which is also contending with delays to a fresh round of fiscal stimulus. Such dynamics in turn is keeping EURUSD mostly within the 1.16 – 1.19 range since September.

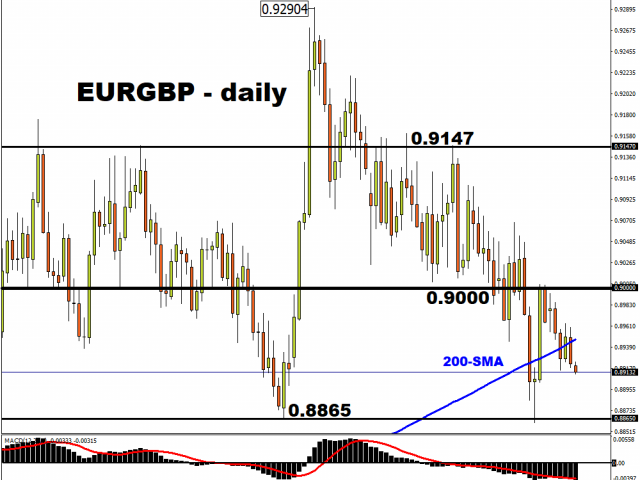
Besides finding itself engaged in political brinksmanship with fellow EU members, Brussels also is also in a deadlock with the UK in its negotiations over a post-Brexit trade deal. News reports over the weekend suggest that an agreement could be announced by early December, prompting EURGBP to pull further below its 200-day simple moving average today.

Should investors be greeted with more signs of a deadlock rather than a major breakthrough over the coming days, that risks unwinding losses in EURGBP, with the currency pair potentially trading back above the psychologically-important 0.90 level, as markets then brace for a hard Brexit come January 1st. After all, the UK is expected to bear the bigger brunt than the EU in the event of a no-deal Brexit.

However, as things stand, the FXTM Trader’s Sentiment is still net short on EURGBP, as traders continue to expect a post-Brexit trade deal being secured at the 11th hour.

Incoming monetary policy support may buffer Euro

Then on Thursday, November 26th, the ECB is set to release the minutes from its October monetary policy meeting, which will be scoured for clues as to when and how the central bank could inject further monetary stimulus. More overt signs of incoming central bank support, likely to be officially announced at the December ECB meeting, could help shore up the Euro’s performance in the interim.

The bloc’s currency has strengthened by more than one percent against the Japanese Yen, Swiss Franc, and the US Dollar so far this month, while also holding year-to-date gains against most of its G10 peers.

Investors will have plenty to digest this week

And with the Euro accounting for 57.6 percent of the Dollar index (DXY), it could well dictate the DXY’s performance this Thanksgiving week. The US will have plenty on its plate besides turkey and stuffing this week, as Thanksgiving’s Eve (Wednesday) will feature the release of the FOMC meeting minutes as well as a US data dump, which includes the second reading of the US Q3 GDP, weekly jobless claims, and October’s personal spending data.

In short, there’s plenty to keep global FX markets on their toes in this final full week of November.


Disclaimer: The content in this article comprises personal opinions and should not be construed as containing personal and/or other investment advice and/or an offer of and/or solicitation for any transactions in financial instruments and/or a guarantee and/or prediction of future performance. ForexTime (FXTM), its affiliates, agents, directors, officers or employees do not guarantee the accuracy, validity, timeliness or completeness, of any information or data made available and assume no liability as to any loss arising from any investment based on the same.


Forex-Time-LogoArticle by ForexTime

ForexTime Ltd (FXTM) is an award winning international online forex broker regulated by CySEC 185/12 www.forextime.com
DAX30 with bullish consolidation before a final attack on All Time High?

By Admiral Markets

Economic Events November 20

Source: Economic Events November 20, 2020 – Admiral Markets Forex Calendar

The past week of trading was astoundingly calm with the German DAX30 index stabilizing in a tight trading range between (roughly) 13,000 and 13,300 points.

“Astoundingly”, because the week of trading started similarly to the week before. The week before, Moderna, an American biotechnology company, announced that its phase 3 study met statistical criteria with a vaccine efficacy of 94.5% (P < 0.0001). What’s probably even more interesting, compared to the Pfizer/Biontech news, is that Moderna announced a longer shelf life for Its COVID-19 vaccine candidate at refrigerated temperatures.

Surprisingly, the DAX30, and Equities in general, didn’t take off like it did the week before, but instead a short bullish stint found stronger resistance around 13,300 points and drifted back towards the 13,000 point-mark in the days after.

One way to interpret that move is that market participants are realizing that a vaccine alone won’t cut it and that we are still far away from returning to “normal”, especially from an economic standpoint.

Nevertheless, we still expect, rather sooner than later, a massive fiscal package from the US government, as well as from European countries after the recent lockdowns, to stabilize the global economy and an ultra-dovish approach from central banks around the globe, especially from the FED to finance that “fresh” debt.

That’s the main reason why we don’t want to be short the DAX30 in the current environment and consider the recent choppy and low-volatility price action more to be a “take a deep breath”, expecting a bullish breakout with a break above 13,300 points making a run up to the current All Time high around 13,800 points very likely, stop-over around the September highs around 13,450 points.

While we consider the following unlikely, a failed attempt to break above 13,300 points and drop back below the psychologically important 13,000 point-mark would confirm a short-term top in the German DAX30 once the index drops and closes below 12,900 points. In such a scenario, a deeper corrective move with a first target around 12,500 points becomes an option:

DAX30 CFD Hourly

Source: Admiral Markets MT5 with MT5SE Add-on DAX30 CFD Hourly chart (from October 30, 2020, to November 20, 2020). Accessed: November 13, 2020, at 10:00 PM GMT.

DAX30 CFD Daily chart

Source: Admiral Markets MT5 with MT5SE Add-on DAX30 CFD Daily chart (between July 01, 2019, to November 20, 2020). Accessed: November 13, 2020, at 10:00 PM GMT. Please note: Past performance is not a reliable indicator of future results, or future performance.

In 2015, the value of the DAX30 CFD increased by 9.56%, in 2016, it increased by 6.87%, in 2017, it increased by 12.51%, in 2018, it fell by 18.26%, and in 2019, it increased by 26.44%, meaning that in five years, it was up by 34.2%.

Check out Admiral Markets’ most competitive conditions on the DAX30 CFD and start trading on the DAX30 CFD with a low 0.8 point spread offering during the main Xetra trading hours.

Discover the world’s #1 multi-asset platform

Admiral Markets offers professional traders the ability to trade with MetaTrader 5, allowing you to experience trading at a significantly higher, more rewarding level than with MetaTrader 4. Experience benefits such as the addition of the Market Heat Map, so you can compare various currency pairs to see which ones might be lucrative investments, access real-time trading data, and so much more. Click the banner below to start your FREE download of MT5!

Trade With MetaTrader 5

Disclaimer: The given data provides additional information regarding all analysis, estimates, prognosis, forecasts or other similar assessments or information (hereinafter “Analysis”) published on the website of Admiral Markets. Before making any investment decisions please pay close attention to the following:

  1. This is a marketing communication. The analysis is published for informative purposes only and is in no way to be construed as investment advice or recommendation. It has not been prepared in accordance with legal requirements designed to promote the independence of investment research, and that it is not subject to any prohibition on dealing ahead of the dissemination of investment research.
  2. Any investment decision is made by each client alone whereas Admiral Markets shall not be responsible for any loss or damage arising from any such decision, whether or not based on the Analysis.
  3. Each of the Analysis is prepared by an independent analyst (Jens Klatt, Professional Trader and Analyst, hereinafter “Author”) based on the Author’s personal estimations.
  4. To ensure that the interests of the clients would be protected and objectivity of the Analysis would not be damaged Admiral Markets has established relevant internal procedures for prevention and management of conflicts of interest.
  5. Whilst every reasonable effort is taken to ensure that all sources of the Analysis are reliable and that all information is presented, as much as possible, in an understandable, timely, precise and complete manner, Admiral Markets does not guarantee the accuracy or completeness of any information contained within the Analysis. The presented figures that refer to any past performance is not a reliable indicator of future results.
  6. The contents of the Analysis should not be construed as an express or implied promise, guarantee or implication by Admiral Markets that the client shall profit from the strategies therein or that losses in connection therewith may or shall be limited.
  7. Any kind of previous or modelled performance of financial instruments indicated within the Publication should not be construed as an express or implied promise, guarantee or implication by Admiral Markets for any future performance. The value of the financial instrument may both increase and decrease and the preservation of the asset value is not guaranteed.
  8. The projections included in the Analysis may be subject to additional fees, taxes or other charges, depending on the subject of the Publication. The price list applicable to the services provided by Admiral Markets is publicly available from the website of Admiral Markets.

Leveraged products (including contracts for difference) are speculative in nature and may result in losses or profit. Before you start trading, you should make sure that you understand all the risks.

By Admiral Markets

US Dollar Index Speculators trimmed their bearish bets. Japanese Yen bets fall

By CountingPips.comReceive our weekly COT Reports by Email


US Dollar Index Speculator Positions

Large currency speculators edged their bearish net positions lower in the US Dollar Index futures markets this week, according to the latest Commitment of Traders (COT) data released by the Commodity Futures Trading Commission (CFTC) on Friday.

The non-commercial futures contracts of US Dollar Index futures, traded by large speculators and hedge funds, totaled a net position of -974 contracts in the data reported through Tuesday November 17th. This was a weekly change of 154 contracts from the previous week which had a total of -1,128 net contracts.

This week’s net position was the result of the gross bullish position (longs) rising by 937 contracts (to a weekly total of 19,540 contracts) compared to the gross bearish position (shorts) which saw a gain by 783 contracts on the week (to a total of 20,514 contracts).

The US Dollar Index speculators slightly reduced their bearish bets this week. The dollar index position is currently at approximately a neutral position in the big scheme of things with the net position under a thousand contracts. The price of the dollar index (DXY) has been on a downtrend after hitting a multiyear high of just about 103 in March. Since then, the dollar has dropped steadily and closed this week just below the 92.40 exchange rate.


Individual Currencies Data this week: Japanese Yen bets fall

In the other major currency contracts data, we saw just one substantial change (+ or – 10,000 contracts) in the speculators category this week.

  • Japanese yen bets dropped sharply this week following strong gains in previous weeks. The yen speculative positions fell by over -12,000 contracts this week after rising in the previous three weeks and by a total of +27,711 contracts over that time-frame. The gains in the yen positions had brought the November 10th level to the highest standing in the past two hundred and eleven weeks before this week’s turnaround. The yen position has now remained in bullish territory for thirty-seven weeks after turning positive in March.

Overall, the major currencies that saw improving speculator positions this week were the US dollar index (154 weekly change in contracts), Canadian dollar (990 contracts), Australian dollar (2,597 contracts), New Zealand dollar (1,151 contracts) and the Mexican peso (2,087 contracts).

The currencies whose speculative bets declined this week were the euro (-1,327 weekly change in contracts), British pound sterling (-2,051 contracts), Japanese yen (-12,227 contracts) and the Swiss franc (-940 contracts).


Chart: Current Strength of Each Currency compared to their 3-Year Range


The above chart depicts each currency’s current speculator strength level compared to data of the past 3 years. A score of 0 percent would mean speculator bets are currently at the lowest level of the past three years. A 100 percent score would be at the highest level while a 50 percent score would mean speculator bets are right in the middle of the data (a neutral score). We use above 80 percent (extreme bullish) and below 20 percent (extreme bearish) as extreme score measurements.

Please see the data table and individual currency charts below.


Table of Large Speculator Levels & Weekly Changes:

CurrencyNet Speculator PositionSpecs Weekly Change
USD Index-974154
EuroFx133,960-1,327
GBP-19,746-2,051
JPY29,667-12,227
CHF14,924-940
CAD-20,359990
AUD-6,1232,597
NZD8,8681,151
MXN20,4092,087

This latest COT data is through Tuesday and shows a quick view of how large speculators or non-commercials (for-profit traders) were positioned in the futures markets. All currency positions are in direct relation to the US dollar where, for example, a bet for the euro is a bet that the euro will rise versus the dollar while a bet against the euro will be a bet that the dollar will gain versus the euro.


Weekly Charts: Large Trader Weekly Positions vs Price

EuroFX:

The Euro large speculator standing this week came in at a net position of 133,960 contracts in the data reported through Tuesday. This was a weekly decrease of -1,327 contracts from the previous week which had a total of 135,287 net contracts.


British Pound Sterling:

The large British pound sterling speculator level came in at a net position of -19,746 contracts in the data reported this week. This was a weekly reduction of -2,051 contracts from the previous week which had a total of -17,695 net contracts.


Japanese Yen:

Large Japanese yen speculators resulted in a net position of 29,667 contracts in this week’s data. This was a weekly decrease of -12,227 contracts from the previous week which had a total of 41,894 net contracts.


Swiss Franc:

The Swiss franc speculator standing this week resulted in a net position of 14,924 contracts in the data through Tuesday. This was a weekly reduction of -940 contracts from the previous week which had a total of 15,864 net contracts.


Canadian Dollar:

Canadian dollar speculators came in at a net position of -20,359 contracts this week. This was a increase of 990 contracts from the previous week which had a total of -21,349 net contracts.


Australian Dollar:

The large speculator positions in Australian dollar futures equaled a net position of -6,123 contracts this week in the data ending Tuesday. This was a weekly gain of 2,597 contracts from the previous week which had a total of -8,720 net contracts.


New Zealand Dollar:

The New Zealand dollar speculative standing resulted in a net position of 8,868 contracts this week in the latest COT data. This was a weekly lift of 1,151 contracts from the previous week which had a total of 7,717 net contracts.


Mexican Peso:

Mexican peso speculators came in at a net position of 20,409 contracts this week. This was a weekly boost of 2,087 contracts from the previous week which had a total of 18,322 net contracts.


Article By CountingPips.comReceive our weekly COT Reports by Email

*COT Report: The COT data, released weekly to the public each Friday, is updated through the most recent Tuesday (data is 3 days old) and shows a quick view of how large speculators or non-commercials (for-profit traders) were positioned in the futures markets.

The CFTC categorizes trader positions according to commercial hedgers (traders who use futures contracts for hedging as part of the business), non-commercials (large traders who speculate to realize trading profits) and nonreportable traders (usually small traders/speculators).

Find CFTC criteria here: (http://www.cftc.gov/MarketReports/CommitmentsofTraders/ExplanatoryNotes/index.htm).

WTI Crude Oil Speculators raised their bullish bets for 2nd week

By CountingPips.comReceive our weekly COT Reports by Email

WTI Crude Oil Futures Sentiment: Updated Data Through: November 17 2020


WTI Crude Oil Large Trader Net Positions:


WTI Crude Oil Non-Commercial Speculator Positions:

Large energy speculators sharply raised their bullish net positions in the WTI Crude Oil futures markets this week, according to the latest Commitment of Traders (COT) data released by the Commodity Futures Trading Commission (CFTC) on Friday.

The non-commercial futures contracts of WTI Crude Oil futures, traded by large speculators and hedge funds, totaled a net position of 480,811 contracts in the data reported through November 17th. This was a weekly gain of 17,273 net contracts from the previous week which had a total of 463,538 net contracts.

The week’s net position was the result of the gross bullish position (longs) ascending by 4,502 contracts (to a weekly total of 638,245 contracts) while the gross bearish position (shorts) dropped by -12,771 contracts for the week (to a total of 157,434 contracts).

Crude oil speculators sharply raised their bullish positions for a second straight week and by a total of +38,351 contracts in these past two weeks. The crude bullish bets have gained for five out of the past seven weeks as well. This recent bullishness has pushed the speculator sentiment to its second highest level of the past eleven weeks at over +480,000 contracts. The current standing, however, remains under the +500,000 net contract level for a twelfth straight week following a twenty-week streak where bullish bets had stayed above that threshold through August 25th.

The large speculators Strength Index level, the current score for traders compared to levels of the past three years, shows that specs are currently at a Bearish level with a score of 44.1 percent.

Speculators are seen as trend followers and usually trade in tandem with the price direction (blue line in above chart). At the extreme levels, specs are very important to watch as they have a tendency to bet the wrong way (that the trend will continue to even more extreme levels).


TRADER TYPE DATA:SPECULATORS
– Percent of Open Interest Longs:30.6
– Percent of Open Interest Shorts:7.6
– Net Position:480,811
– Gross Longs:638,245
– Gross Shorts:157,434
– Long to Short Ratio:4.1 to 1
NET POSITION TREND:
– COT Index Score (3 Year Range Pct):44.1
– COT Index Reading (3 Year Range):Bearish
NET POSITION MOVEMENT INDEX:
– 6-Week Change in Strength Index:2.0

Current Trader Positions as Percent of Open Interest:


Commercial Trader Positions:

The commercial traders position this week came in at a total net position of -504,036 contracts. This was a weekly change of -18,543 contracts from the total net of -485,493 contracts reported the previous week.

The commercials Strength Index level, a score that measures the contract levels of the past three years within a range of 0 to 100, shows that Commercials are currently at a Bullish level with a score of 53.3 percent.

At the extreme levels, commercials are very important to watch as they have a tendency to be correct at the major turning points in price trends.


TRADER TYPE DATA:COMMERCIALS
– Percent of Open Interest Longs:31.7
– Percent of Open Interest Shorts:55.9
– Net Position:-504,036
– Gross Longs:660,992
– Gross Shorts:1,165,028
– Long to Short Ratio:0.6 to 1
NET POSITION TREND:
– COT Index Score (3 Year Range Pct):53.3
– COT Index Reading (3 Year Range):Bullish
NET POSITION MOVEMENT INDEX:
– 6-Week Change in Strength Index:-3.2

Small Trader Positions:

The small traders position this week totaled a net position of 23,225 contracts. This was a weekly change of 1,270 contracts from the total net of 21,955 contracts reported the previous week.

The small traders Strength Index level shows that smalls are currently at a Bullish level with a score of 56.1 percent.

Small traders are less important to watch (in most cases) as their numbers tend to be just a small part of the total trading open interest.


TRADER TYPE DATA:SMALL TRADERS
– Percent of Open Interest Longs:4.1
– Percent of Open Interest Shorts:2.9
– Net Position:23,225
– Gross Longs:84,480
– Gross Shorts:61,255
– Long to Short Ratio:1.4 to 1
NET POSITION TREND:
– COT Index Score (3 Year Range Pct):56.1
– COT Index Reading (3 Year Range):Bullish
NET POSITION MOVEMENT INDEX:
– 6-Week Change in Strength Index:10.6

*COT Report: The COT data, released weekly to the public each Friday, is updated through the most recent Tuesday (data is 3 days old) and shows a quick view of how large speculators or non-commercials (for-profit traders) as well as the commercial traders (hedgers & traders for business purposes) were positioned in the futures markets. The CFTC categorizes trader positions according to commercial hedgers (traders who use futures contracts for hedging as part of the business), non-commercials (large traders who speculate to realize trading profits) and nonreportable traders (usually small traders/speculators). Find CFTC criteria here: (http://www.cftc.gov/MarketReports/CommitmentsofTraders/ExplanatoryNotes/index.htm).


By CountingPips.comReceive our weekly COT Reports by Email

Gold Speculators raised their bullish bets to 17-week high

By CountingPips.comReceive our weekly COT Reports by Email

Gold Futures Sentiment: Updated Data Through: November 17 2020


Gold Large Trader Net Positions:


Gold Non-Commercial Speculator Positions:

Large precious metals speculators boosted their bullish net positions in the Gold futures markets this week, according to the latest Commitment of Traders (COT) data released by the Commodity Futures Trading Commission (CFTC) on Friday.

The non-commercial futures contracts of Gold futures, traded by large speculators and hedge funds, totaled a net position of 251,270 contracts in the data reported through November 17th. This was a weekly gain of 11,534 net contracts from the previous week which had a total of 239,736 net contracts.

The week’s net position was the result of the gross bullish position (longs) going up by 11,182 contracts (to a weekly total of 329,698 contracts) while the gross bearish position (shorts) declined by -352 contracts for the week (to a total of 78,428 contracts).

Gold speculators sharply raised their bullish bets this week by the most of the past seven weeks. Previously, bullish bets had fallen for three straight weeks but this week’s turnaround pushed the bullish position to the highest level of the past seventeen weeks. The gold speculator sentiment has continued to be strongly bullish as net positions have remained above the +200,000 contract level for seventy-five straight weeks, dating back to June of 2019.

The large speculators Strength Index level, the current score for traders compared to levels of the past three years, shows that specs are currently at a Bullish level with a score of 73.9 percent.

Speculators are seen as trend followers and usually trade in tandem with the price direction (blue line in above chart). At the extreme levels, specs are very important to watch as they have a tendency to bet the wrong way (that the trend will continue to even more extreme levels).


TRADER TYPE DATA:SPECULATORS
– Percent of Open Interest Longs:59.1
– Percent of Open Interest Shorts:14.1
– Net Position:251,270
– Gross Longs:329,698
– Gross Shorts:78,428
– Long to Short Ratio:4.2 to 1
NET POSITION TREND:
– COT Index Score (3 Year Range Pct):73.9
– COT Index Reading (3 Year Range):Bullish
NET POSITION MOVEMENT INDEX:
– 6-Week Change in Strength Index:0.7

Current Trader Positions as Percent of Open Interest:


Commercial Trader Positions:

The commercial traders position this week came in at a total net position of -294,572 contracts. This was a weekly change of -11,149 contracts from the total net of -283,423 contracts reported the previous week.

The commercials Strength Index level, a score that measures the contract levels of the past three years within a range of 0 to 100, shows that Commercials are currently at a Bearish level with a score of 22.1 percent.

At the extreme levels, commercials are very important to watch as they have a tendency to be correct at the major turning points in price trends.


TRADER TYPE DATA:COMMERCIALS
– Percent of Open Interest Longs:19.1
– Percent of Open Interest Shorts:72.0
– Net Position:-294,572
– Gross Longs:106,681
– Gross Shorts:401,253
– Long to Short Ratio:0.3 to 1
NET POSITION TREND:
– COT Index Score (3 Year Range Pct):22.1
– COT Index Reading (3 Year Range):Bearish
NET POSITION MOVEMENT INDEX:
– 6-Week Change in Strength Index:-1.5

Small Trader Positions:

The small traders position this week totaled a net position of 43,302 contracts. This was a weekly change of -385 contracts from the total net of 43,687 contracts reported the previous week.

The small traders Strength Index level shows that smalls are currently at a Bullish-Extreme level with a score of 88.9 percent.

Small traders are less important to watch (in most cases) as their numbers tend to be just a small part of the total trading open interest.


TRADER TYPE DATA:SMALL TRADERS
– Percent of Open Interest Longs:11.5
– Percent of Open Interest Shorts:3.8
– Net Position:43,302
– Gross Longs:64,301
– Gross Shorts:20,999
– Long to Short Ratio:3.1 to 1
NET POSITION TREND:
– COT Index Score (3 Year Range Pct):88.9
– COT Index Reading (3 Year Range):Bullish-Extreme
NET POSITION MOVEMENT INDEX:
– 6-Week Change in Strength Index:8.4

*COT Report: The COT data, released weekly to the public each Friday, is updated through the most recent Tuesday (data is 3 days old) and shows a quick view of how large speculators or non-commercials (for-profit traders) as well as the commercial traders (hedgers & traders for business purposes) were positioned in the futures markets. The CFTC categorizes trader positions according to commercial hedgers (traders who use futures contracts for hedging as part of the business), non-commercials (large traders who speculate to realize trading profits) and nonreportable traders (usually small traders/speculators). Find CFTC criteria here: (http://www.cftc.gov/MarketReports/CommitmentsofTraders/ExplanatoryNotes/index.htm).


By CountingPips.com
Receive our weekly COT Reports by Email

10-Year Treasury Note Speculators sharply boosted their bullish bets to 160-week high

By CountingPips.comReceive our weekly COT Reports by Email

10-Year Note Futures Sentiment: Updated Data Through: November 17 2020


10-Year Note Large Trader Net Positions:


10-Year Note Non-Commercial Speculator Positions:

Large bond speculators raised their bullish net positions in the 10-Year Note futures markets this week, according to the latest Commitment of Traders (COT) data released by the Commodity Futures Trading Commission (CFTC) on Friday.

The non-commercial futures contracts of 10-Year Note futures, traded by large speculators and hedge funds, totaled a net position of 152,319 contracts in the data reported through November 17 2020. This was a weekly rise of 57,703 net contracts from the previous week which had a total of 94,616 net contracts.

The week’s net position was the result of the gross bullish position (longs) gaining by 30,059 contracts (to a weekly total of 587,470 contracts) while the gross bearish position (shorts) fell by -27,644 contracts for the week (to a total of 435,151 contracts).

The 10-Year speculators sharply raised their bullish bets this week for a second consecutive week. The speculator position has now gained by a total of +158,009 net contracts in just the past two weeks and brings the current bullish standing to its highest level in the past one hundred and sixty weeks, dating all the way back to October 24th of 2017.

The large speculators Strength Index level (chart below), the current score for traders compared to levels of the past three years, shows that specs are currently at a Bullish-Extreme level with a score of 100.0 percent.

Speculators are seen as trend followers and usually trade in tandem with the price direction (blue line in above chart). At the extreme levels, specs are very important to watch as they have a tendency to bet the wrong way (that the trend will continue to even more extreme levels).


TRADER TYPE DATA:SPECULATORS
– Percent of Open Interest Longs:18.1
– Percent of Open Interest Shorts:13.4
– Net Position:152,319
– Gross Longs:587,470
– Gross Shorts:435,151
– Long to Short Ratio:1.4 to 1
NET POSITION TREND:
– COT Index Score (3 Year Range Pct):100.0
– COT Index Reading (3 Year Range):Bullish-Extreme
NET POSITION MOVEMENT INDEX:
– 6-Week Change in Strength Index:9.1

Current Trader Positions as Percent of Open Interest:


Commercial Trader Positions:

The commercial traders position this week came in at a total net position of -103,569 contracts. This was a weekly change of -50,512 contracts from the total net of -53,057 contracts reported the previous week.

The commercials Strength Index level, a score that measures the contract levels of the past three years within a range of 0 to 100, shows that Commercials are currently at a Bearish-Extreme level with a score of 7.8 percent.

At the extreme levels, commercials are very important to watch as they have a tendency to be correct at the major turning points in price trends.


TRADER TYPE DATA:COMMERCIALS
– Percent of Open Interest Longs:67.1
– Percent of Open Interest Shorts:70.3
– Net Position:-103,569
– Gross Longs:2,181,114
– Gross Shorts:2,284,683
– Long to Short Ratio:1.0 to 1
NET POSITION TREND:
– COT Index Score (3 Year Range Pct):7.8
– COT Index Reading (3 Year Range):Bearish-Extreme
NET POSITION MOVEMENT INDEX:
– 6-Week Change in Strength Index:-1.1

Small Trader Positions:

The small traders position this week totaled a net position of -48,750 contracts. This was a weekly change of -7,191 contracts from the total net of -41,559 contracts reported the previous week.

The small traders Strength Index level shows that smalls are currently at a Bullish level with a score of 63.0 percent.

Small traders are less important to watch (in most cases) as their numbers tend to be just a small part of the total trading open interest.


TRADER TYPE DATA:SMALL TRADERS
– Percent of Open Interest Longs:11.4
– Percent of Open Interest Shorts:12.9
– Net Position:-48,750
– Gross Longs:371,509
– Gross Shorts:420,259
– Long to Short Ratio:0.9 to 1
NET POSITION TREND:
– COT Index Score (3 Year Range Pct):63.0
– COT Index Reading (3 Year Range):Bullish
NET POSITION MOVEMENT INDEX:
– 6-Week Change in Strength Index:-18.6

*COT Report: The COT data, released weekly to the public each Friday, is updated through the most recent Tuesday (data is 3 days old) and shows a quick view of how large speculators or non-commercials (for-profit traders) as well as the commercial traders (hedgers & traders for business purposes) were positioned in the futures markets. The CFTC categorizes trader positions according to commercial hedgers (traders who use futures contracts for hedging as part of the business), non-commercials (large traders who speculate to realize trading profits) and nonreportable traders (usually small traders/speculators). Find CFTC criteria here: (http://www.cftc.gov/MarketReports/CommitmentsofTraders/ExplanatoryNotes/index.htm).

By CountingPips.comReceive our weekly COT Reports by Email

VIX Speculators trimmed their bearish bets for 3rd time in 4 weeks

By CountingPips.comReceive our weekly COT Reports by Email

VIX Futures Sentiment: Updated Data Through: November 17 2020


VIX Large Trader Net Positions:


VIX Non-Commercial Speculator Positions:

Large volatility speculators slightly cut back on their bearish net positions in the VIX futures markets this week, according to the latest Commitment of Traders (COT) data released by the Commodity Futures Trading Commission (CFTC) on Friday.

The non-commercial futures contracts of VIX futures, traded by large speculators and hedge funds, totaled a net position of -87,172 contracts in the data reported through November 17 2020. This was a weekly change of 2,302 net contracts from the previous week which had a total of -89,474 net contracts.

The week’s net position was the result of the gross bullish position (longs) gaining by just 78 contracts (to a weekly total of 41,646 contracts) while the gross bearish position (shorts) fell by -2,224 contracts for the week (to a total of 128,818 contracts).

The VIX speculative position has now seen lower bearish positions in three out of the past four weeks. Previously, bearish bets had risen above the -100,000 net contract level for three straight weeks and hit a thirty-five week high on October 20th.

The large speculators Strength Index level (chart below), the current score for traders compared to levels of the past three years, shows that specs are currently at a Bearish level with a score of 42.1 percent.

Speculators are seen as trend followers and usually trade in tandem with the price direction. At the extreme levels, specs are also very important to watch as they have a tendency to bet the wrong way (that the trend will continue to even more extreme levels).


TRADER TYPE DATA:SPECULATORS
– Percent of Open Interest Longs:14.7
– Percent of Open Interest Shorts:45.5
– Net Position:-87,172
– Gross Longs:41,646
– Gross Shorts:128,818
– Long to Short Ratio:0.3 to 1
NET POSITION TREND:
– COT Index Score (3 Year Range Pct):42.1
– COT Index Reading (3 Year Range):Bearish
NET POSITION MOVEMENT INDEX:
– 6-Week Change in Strength Index:2.0

Current Trader Positions as Percent of Open Interest:


Commercial Trader Positions:

The commercial traders position this week came in at a total net position of 90,772 contracts. This was a weekly change of 1,238 contracts from the total net of 89,534 contracts reported the previous week.

The commercials Strength Index level, a score that measures the contract levels of the past three years within a range of 0 to 100, shows that Commercials are currently at a Bullish level with a score of 57.2 percent.

At the extreme levels, commercials are very important to watch as they have a tendency to be correct at the major turning points in price trends.


TRADER TYPE DATA:COMMERCIALS
– Percent of Open Interest Longs:62.2
– Percent of Open Interest Shorts:30.1
– Net Position:90,772
– Gross Longs:175,978
– Gross Shorts:85,206
– Long to Short Ratio:2.1 to 1
NET POSITION TREND:
– COT Index Score (3 Year Range Pct):57.2
– COT Index Reading (3 Year Range):Bullish
NET POSITION MOVEMENT INDEX:
– 6-Week Change in Strength Index:-1.3

Small Trader Positions:

The small traders position this week totaled a net position of -3,600 contracts. This was a weekly change of -3,540 contracts from the total net of -60 contracts reported the previous week.

The small traders Strength Index level shows that smalls are currently at a Bullish level with a score of 72.3 percent.

Small traders are less important to watch (in most cases) as their numbers tend to be just a small part of the total trading open interest.


TRADER TYPE DATA:SMALL TRADERS
– Percent of Open Interest Longs:6.1
– Percent of Open Interest Shorts:7.4
– Net Position:-3,600
– Gross Longs:17,263
– Gross Shorts:20,863
– Long to Short Ratio:0.8 to 1
NET POSITION TREND:
– COT Index Score (3 Year Range Pct):72.3
– COT Index Reading (3 Year Range):Bullish
NET POSITION MOVEMENT INDEX:
– 6-Week Change in Strength Index:-3.9


*COT Report: The COT data, released weekly to the public each Friday, is updated through the most recent Tuesday (data is 3 days old) and shows a quick view of how large speculators or non-commercials (for-profit traders) as well as the commercial traders (hedgers & traders for business purposes) were positioned in the futures markets. The CFTC categorizes trader positions according to commercial hedgers (traders who use futures contracts for hedging as part of the business), non-commercials (large traders who speculate to realize trading profits) and nonreportable traders (usually small traders/speculators). Find CFTC criteria here: (http://www.cftc.gov/MarketReports/CommitmentsofTraders/ExplanatoryNotes/index.htm).

By CountingPips.comReceive our weekly COT Reports by Email

American timber industry crippled by double whammy of trade war and COVID-19

By Andrew Muhammad, University of Tennessee 

– The forestry sector – landowners, logging companies and sawmills – have lost an estimated US$1.1 billion in 2020. Devastating wildfires and Hurricane Laura have played a part, but the COVID-19 pandemic has also contributed to significant losses. If workers are required to stay home, then no trees will be felled or logs sawed into lumber.

These losses have been exacerbated and amplified because of a longstanding trade war that has severely curbed the sale of U.S. forestry products to foreign markets, particularly China.

I am a professor of economics with a specialty in international agricultural trade, trade policy and global food demand. My work at the University of Tennessee Institute of Agriculture is informed by my nearly 10 years as a senior economist with USDA researching international trade issues affecting agriculture and forestry.

The US-China connection

Forest product exports in the U.S., including logs and lumber, were valued at $9.6 billion in 2018, according to the U.S. Department of Agriculture. Forest products are the third leading U.S. agricultural export sector after soybeans and corn. In 2018, China accounted for nearly $3 billion of U.S. forest product exports.

Logs stripped of branches and bark are stacked and tagged.
Logs and more logs ready for market, some of which will end up in foreign countries like China for furniture manufacturing.
Photo by Mildly Useful for Unsplash, CC BY-ND

The forest products relationship between China and the U.S. is complex. The U.S. sells logs and lumber to China; China uses the logs and lumber to produce finished wood products, such as furniture and hardwood flooring; and China exports these finished wood products to the world. Interestingly, the U.S. market is the leading destination for these exports. In 2018, U.S. imports of wooden furniture and other wood products from China exceeded $9 billion, according to the U.S. Census Bureau.

This raises an obvious question: Why doesn’t the U.S. simply make furniture and flooring? The answer is wages. The wage differential between U.S. and Chinese workers makes it more profitable to sell logs and lumber to China and then buy back finished wood products.

Since the demand for products like logs and lumber is directly linked to the demand for finished wood products like furniture and flooring, any decline in the latter negatively affects U.S. forest product exports. To say that what happens in China does not necessarily stay in China is an understatement.

A vulnerable industry takes the hit

COVID-19 has caused a major disruption on U.S. forest exports and hindered production because of lockdowns, business closures and production stoppages. Many of these supply disruptions started in China, where lumber was being turned into furniture, chairs and other goods where the pandemic began.

However, another major factor has been the interruption of demand because of decreased incomes and delayed purchases by consumers. In the U.S., furniture sales decreased as much as 66% in April 2020 when stay-at-home orders went into effect. As of August of this year, U.S. imports of wood furniture and other wood products from China were down by nearly $2 billion, or 40%.

Rows of modern wooden chairs.
COVID-19 has hit U.S. furniture sales hard, decreasing the global demand for U.S. timber, a primary input in furniture production.
Photo by Nareeta Martin for Unsplash, CC BY-ND

Consequently, U.S. forest product exports as of August 2020 had dropped by more than $670 million overall, with exports to China down by more than $100 million. Geographically, most of these losses are in the South, a loss of $246 million, followed by the West, with losses of $183 million, and the Northeast, with losses of $143 million. In addition, these substantial losses are compounded by a multiplier effect that go beyond the raw export numbers.

In my state of Tennessee, for instance, the forestry sector provided nearly 100,000 jobs and had an annual economic impact of more than $24 billion in 2017, accounting for nearly 3% of Tennessee’s economy. This, of course, was before the COVID-19 pandemic and the U.S. trade war, which has devastated the forestry sector. When considering the related activities associated with the forestry sector, such as trucking or equipment, total income and job losses are likely double the direct losses from export sales.

The economic fallout of the trade war

Prior to the pandemic, the U.S.-China trade war had already made the forestry sector vulnerable because of the tariffs that the Chinese government imposed on U.S. timber and the resulting loss in exports. The industry was in a crisis when COVID-19 hit.

In 2018, President Trump ordered that tariffs be imposed on Chinese imports, including a 10% tariff on furniture and related goods from China. In retaliation, the Chinese government imposed tariffs on many U.S. agricultural goods, including 25% tariffs on U.S. logs and lumber. This double taxation resulted in nearly halving the export to China – from $3 billion in 2018 to $1.6 billion in 2019. The trade war, compounded by COVID-19, has had a major negative effect on forest products export sales – from timber harvest and lumber production to timber exports – which hurts working people including loggers and mill workers. Sawmills, in particular, have taken a serious hit.

How is this related to the current pandemic? In January 2020, the U.S. and China signed the Phase One Trade Agreement. Based on the details of the agreement, timber and other forest product exports to China were expected to reach more than $4 billion in 2020. The fact that current export sales to China, as of August of 2020, were only $1 billion suggests that COVID-19 is having an even larger impact than the numbers reveal.The Conversation

About the Author:

Andrew Muhammad, Professor of Agriculture and Resource Economics, University of Tennessee

This article is republished from The Conversation under a Creative Commons license. Read the original article.


What’s the gold standard, and why does the US benefit from a dollar that isn’t tied to the value of a glittery hunk of metal?

By Michael Klein, Tufts University 

– The phrase “the gold standard” means, in common parlance, the best available benchmark – as in double-blind randomized trials are the gold standard for determining the efficacy of a vaccine.

Its meaning likely comes from my world of economics and refers to what was once the centerpiece of the international monetary system, when the value of most major currencies, including the U.S. dollar, was based on the price of gold.

Some economists and others, including President Donald Trump and his Federal Reserve Board of Governors nominee Judy Shelton, favor a return to the gold standard because it would impose new rules and “discipline” on a central bank they view as too powerful and whose actions they consider flawed.

This is among several reasons Shelton’s nomination is controversial in the Senate, which voted against confirming her on Nov. 17 – though her Republican supporters may have an opportunity to try again.

As an economist whose focus is on exchange rate policies, I have spent a lot of time researching monetary and exchange rate policy. A look back at the gold standard and why the world stopped using it shows it’s best left as a relic of history.

Stability – in good times

A gold standard is an exchange rate system in which each country’s currency is valued as worth a fixed amount of gold.

During the late 19th and early 20th centuries, one ounce of gold cost $20.67 in the United States and ₤4.24 in the U.K.. This meant that someone could convert one British pound to $4.86 and vice versa.

Countries on the gold standard – which included all major industrial countries during the system’s heyday from 1871 to 1914 – had a fixed price for an ounce of gold and thus a fixed exchange rate with others who used the system. They kept the same gold peg throughout the period.

The gold standard stabilized currency values and, in so doing, promoted trade and investment, fostering what’s been called the first age of globalization. The system collapsed in 1914 at the outbreak of World War I, when most countries suspended its use. Afterward, some countries such as the U.K. and U.S. continued to rely on gold as a centerpiece of their monetary policies, but lingering geopolitical tensions and the high costs of the war made it much less stable, showing its severe flaws in times of crisis.

The onset of the Great Depression finally forced the U.S. and the other countries that still pegged their currencies to gold to abandon the system entirely. Economist Barry Eichengreen has found that efforts to maintain the gold standard at the beginning of the Great Depression ended up worsening the downturn because they limited the ability of central banks like the Fed to respond to deteriorating economic conditions. For example, while central banks today typically cut interest rates to boost a faltering economy, the gold standard required them to focus solely on keeping their currency pegged to gold.

The end of gold

After World War II, the leading Western powers adopted a new international monetary system that made the U.S. dollar the world’s reserve currency.

All currencies fluctuated in relation to the dollar, which was convertible to gold at a rate of $35 an ounce. A variety of economic, political and global pressures in the 1960s and 1970s forced President Richard Nixon to abandon the gold standard once and for all by 1971.

Since then, major currencies like the U.S. dollar have traded freely on global exchanges, and their relative value is determined by market forces. The dollar in your pocket is backed by nothing more than your belief that you’ll be able to buy a hot dog with it.

Return to the ‘golden’ years?

Arguments for returning to a gold standard reappear periodically, typically around times when inflation is raging, such as in the late 1970s. Its backers assert that central bankers are responsible for surging inflation, through policies like low interest rates, and so the gold standard is necessary to rein them in.

It is particularly odd, however, to advocate for a gold standard at a time when one of the main problems a gold standard would supposedly address – runaway inflation – has been low for decades.

Moreover, going back to a gold standard would create new problems. For example, the price of gold moves around a lot. A year ago an ounce of gold cost $1,457. The pandemic helped drive up the price by 40% to $2,049 in August. As of Nov. 18, it was about $1,885. Clearly, it would be destabilizing if the dollar were pegged to gold when its prices swings wildly. Exchange rates between major currencies are typically much more stable.

Importantly, going back to a gold standard would handcuff the Fed in its efforts to address changing economic conditions through interest rate policy. The Fed would not be able to lower interest rates in the face of a crisis like the one the world faces today, because doing so would change the value of the dollar relative to gold.

Shelton’s support for the gold standard is just one reason her nomination has run into trouble. Others include her lack of support for an independent Federal Reserve and apparent political motivations in her policy positions. For example, economists generally favor lower interest rates when unemployment is high and the economy is faltering and higher rates when unemployment is low and the economy is strong. Shelton opposed low rates when a Democrat was in the White House and unemployment was high but embraced them under Trump, even though unemployment was low.

While there is often spirited debate about monetary policy, Shelton’s ideas are so far out of the mainstream, and suspicions of the political motivations of her positions are so prominent, that several hundred prominent economists and Fed alumni have urged the Senate to reject her nomination.

The Federal Reserve is an independent agency that is vital to America’s economic stability and prosperity. Like the courts, it is important that it acts with integrity and free from political considerations. It’s equally important that it not adopt discredited policies like the gold standard, which is a very poor example of the aphorism it inspired.The Conversation

About the Author:

Michael Klein, Professor of International Economic Affairs at The Fletcher School, Tufts University

This article is republished from The Conversation under a Creative Commons license. Read the original article.