Is It Better To Trade Stocks Or Forex?

By Orbex

Which is better, forex or stocks, is an important question.

This is true whether you are just starting out or have been trading for a while and are looking to diversify your portfolio.

So, naturally, this question has a frustratingly evident answer: it depends.

Both have their advantages and disadvantages, so it’s worthwhile to explore which advantages match with your strengths as a trader.

Especially if you’ve been having a frustrating experience in one of these areas, trying out the other might give you better results.

Consistency or Opportunity

One of the general characteristics of currencies is that they are intended to be relatively stable.

Currencies don’t work as well if they have wide swings in value, so there is a lot of effort put in by central banks and governments to keep them from changing much over time.

Sure, there are occasions when you can have some pretty wild fluctuations. But, for the major currencies that are traded on the forex market, it’s very unusual to have more than a percentage point of change in a single day.

Stocks, on the other hand, are designed to make money. The faster they move (upwards), the better it is for everyone (except those who sold short).

Consequently, stock prices have a habit of moving around quite a lot. For stock traders, this means our brokers don’t provide us with as much margin, but we have more opportunities to make larger gains.

Fundamental or Technical

A corollary of the above is that stocks tend to trade a lot more based on what’s going on in a particular company.

Did it make a new sale? Was there a law passed that could affect its profitability? Did the CEO just go on Joe Rogan’s podcast and get high?

All of those things can suddenly change the way the market perceives the stock’s value. Consequently, stock traders tend to be more interested in fundamentals.

Currencies change in value mostly based on moves made by large market makers who are accommodating to broader trends. Naturally fundamental issues push the relative value of currencies in the forex market, but it’s quite possible to trade them based almost exclusively on technicals.

You can get away with not knowing who the PM of Australia is when trading the AUD.

But not following Elon Musk on Twitter when trading Tesla can be a bit risky.

Sideways or Growth

Well-managed companies in the medium and long term will grow, and their stock price will go up.

This is why the long term trends of every stock index in the world has been to rise.

The long term trend gives an advantage for people who want to buy and hold over a longer period of time. When it comes to Forex, on the other hand, currencies tend to fluctuate, but generally trend towards equilibrium.

There are different cycles depending on the time frame, but in general, every central bank is trying for currency stability, which means that they are all aiming at approximately the same target.

The advantage here is that for someone looking to get in and out of the market, there are plenty of ups and downs of which you can take advantage.

So, what kind of trader are you?

Which of those characteristics match your trading strengths?

By Orbex

Biden Wins Georgia Recount

By Orbex

Embattled Dollar Heads for Another Weekly Decline

The US index fell a further 0.28% in Thursday’s session as the prospect of yearly lows becomes a reality.

Not only are infection numbers on the rise in the US, but so is the death toll. As a result, several states, including New York, New Jersey, and California have announced lockdown measures to prevent the spread.

America has also witnessed weak retail data this week along with rising initial jobless claims.

This will cap off a 10% decrease on the index since its yearly high, with the anticipation that this will continue into 2021.

In addition, as a Georgia audit confirmed Biden’s victory in the state, the president-elect has criticized Trump’s irresponsibility as he closes in on the White House.

ECB Chief Tells EU Not to Delay Recovery Funds

The euro closed 0.18% higher yesterday as it once again mounted a challenge for the 1.19 handle.

The European Central Bank on Thursday urged EU leaders to pass a Recovery Fund without delay, as the continent battles the second wave of Covid-19.

Hungary and Poland are the only countries to veto the EU budget and coronavirus recovery fund, meaning that the package cannot yet be approved.

Another round of talks will now resume, in the hope that the continent can be injected with an additional €750bn.

Chief Negotiator Barnier Self-isolates

The pound ended Thursday’s session 0.10% lower as another round of Brexit talks switched to a virtual format.

The talks were suspended for a short time after one of the EU negotiators tested positive for Covid-19, forcing Michel Barnier into quarantine.

As talks stumble once again, both sides might turn to preparations for a no-deal outcome.

Indices Mixed

Wall Street remained indecisive during yesterday’s trading session.

The Nasdaq closed 0.77% up, however, the Dow fell by 1.2%.

Mixed sentiment lingers over Senator Mitch McConnell agreeing to resume negotiations with Democrats regarding a potential new Covid-19 relief bill. This breakthrough came as infection rates around the US continue to surge.

Gold Sinks Deeper

Gold closed 0.38% lower on Thursday as it entered the $1850 territory.

Even though there were no further updates to the recent vaccination news, investors looked to have already priced in the data, sending the yellow metal to almost 6-month lows.

The hope of a rise back to $2,000 now seems a world away, as risk appetite temporarily shifts.

Oil Reaches for $42

WTI ended Thursday’s session 0.10% higher as it closed in on the $42 handle.

The black gold has remained buoyant over the vaccination headlines this week, as we now enter the second half of Q4.

However, with an over supply in Libya looking likely, and demand slowing during the upcoming holiday season, will the black gold remain elevated?

By Orbex

Ichimoku Cloud Analysis 20.11.2020 (EURUSD, USDJPY, BTCUSD)

Article By RoboForex.com

EURUSD, “Euro vs US Dollar”

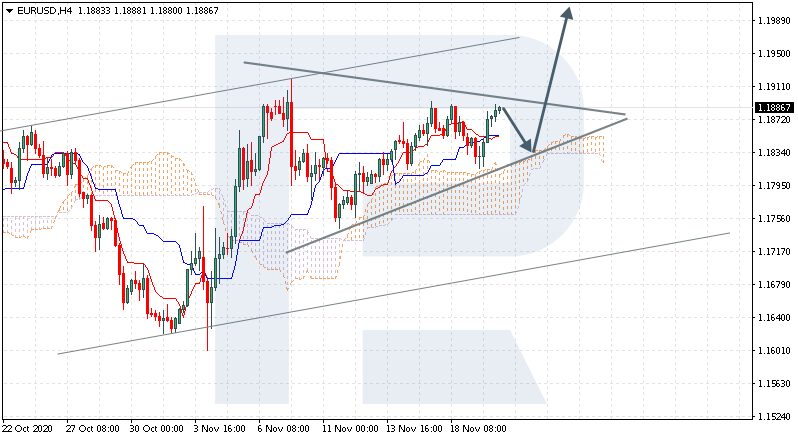
EURUSD is trading at 1.1886; the instrument is moving above Ichimoku Cloud, thus indicating an ascending tendency. The markets could indicate that the price may test the cloud’s upside border at 1.1835 and then resume moving upwards to reach 1.1995. Another signal in favor of further uptrend will be a rebound from the downside border of the Triangle pattern. However, the bullish scenario may be canceled if the price breaks the cloud’s downside border and fixes below 1.1750. In this case, the pair may continue falling towards 1.1665. To confirm further growth, the asset must break the pattern’s upside border and fix above 1.1915.

EURUSD
Risk Warning: the result of previous trading operations do not guarantee the same results in the future

USDJPY, “US Dollar vs Japanese Yen”

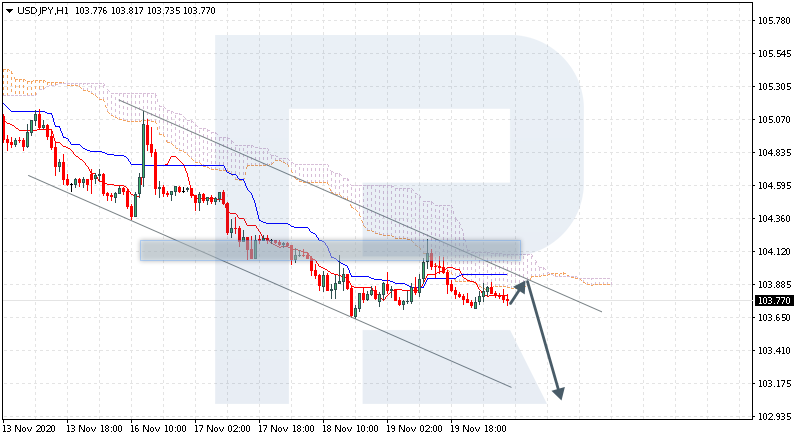
USDJPY is trading at 103.77; the instrument is moving below Ichimoku Cloud, thus indicating a descending tendency. The markets could indicate that the price may test the cloud’s downside border at 103.85 and then resume moving downwards to reach 103.05. Another signal in favor of further downtrend will be a rebound from the descending channel’s upside border. However, the bearish scenario may no longer be valid if the price breaks the cloud’s upside border and fixes above 104.15. In this case, the pair may continue growing towards 106.15. To confirm further decline, the asset must break the support level, from which it has already rebounded several times, and fix below 103.50.

USDJPY
Risk Warning: the result of previous trading operations do not guarantee the same results in the future

BTCUSD, “Bitcoin vs US Dollar”

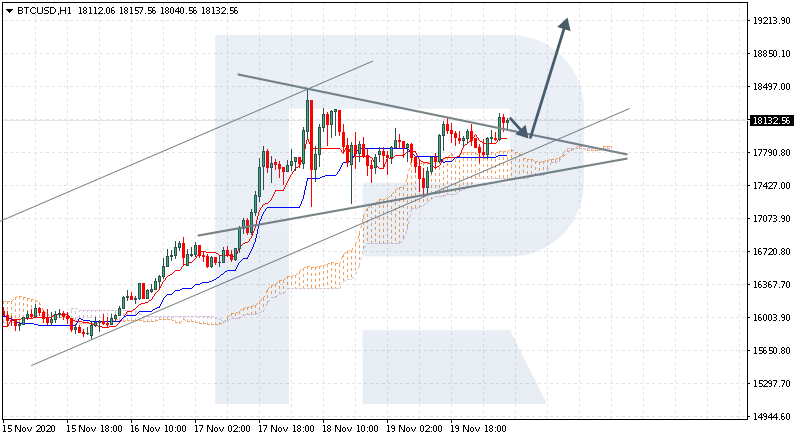
BTCUSD is trading at 18132.00; the instrument is moving above Ichimoku Cloud, thus indicating an ascending tendency. The markets could indicate that the price may test Tenkan-Sen and Kijun-Sen at 17965.00 and then resume moving upwards to reach 19215.00. Another signal in favor of further uptrend will be a rebound from the upside border of a Triangle pattern. However, the bullish scenario may no longer be valid if the price breaks the cloud’s downside border and fixes below 17305.00. In this case, the pair may continue falling towards 16505.00.

BTCUSD

Article By RoboForex.com

Attention!
Forecasts presented in this section only reflect the author’s private opinion and should not be considered as guidance for trading. RoboForex LP bears no responsibility for trading results based on trading recommendations described in these analytical reviews.

Fibonacci Retracements Analysis 20.11.2020 (BITCOIN, ETHEREUM)

Article By RoboForex.com

BTCUSD, “Bitcoin vs US Dollar”

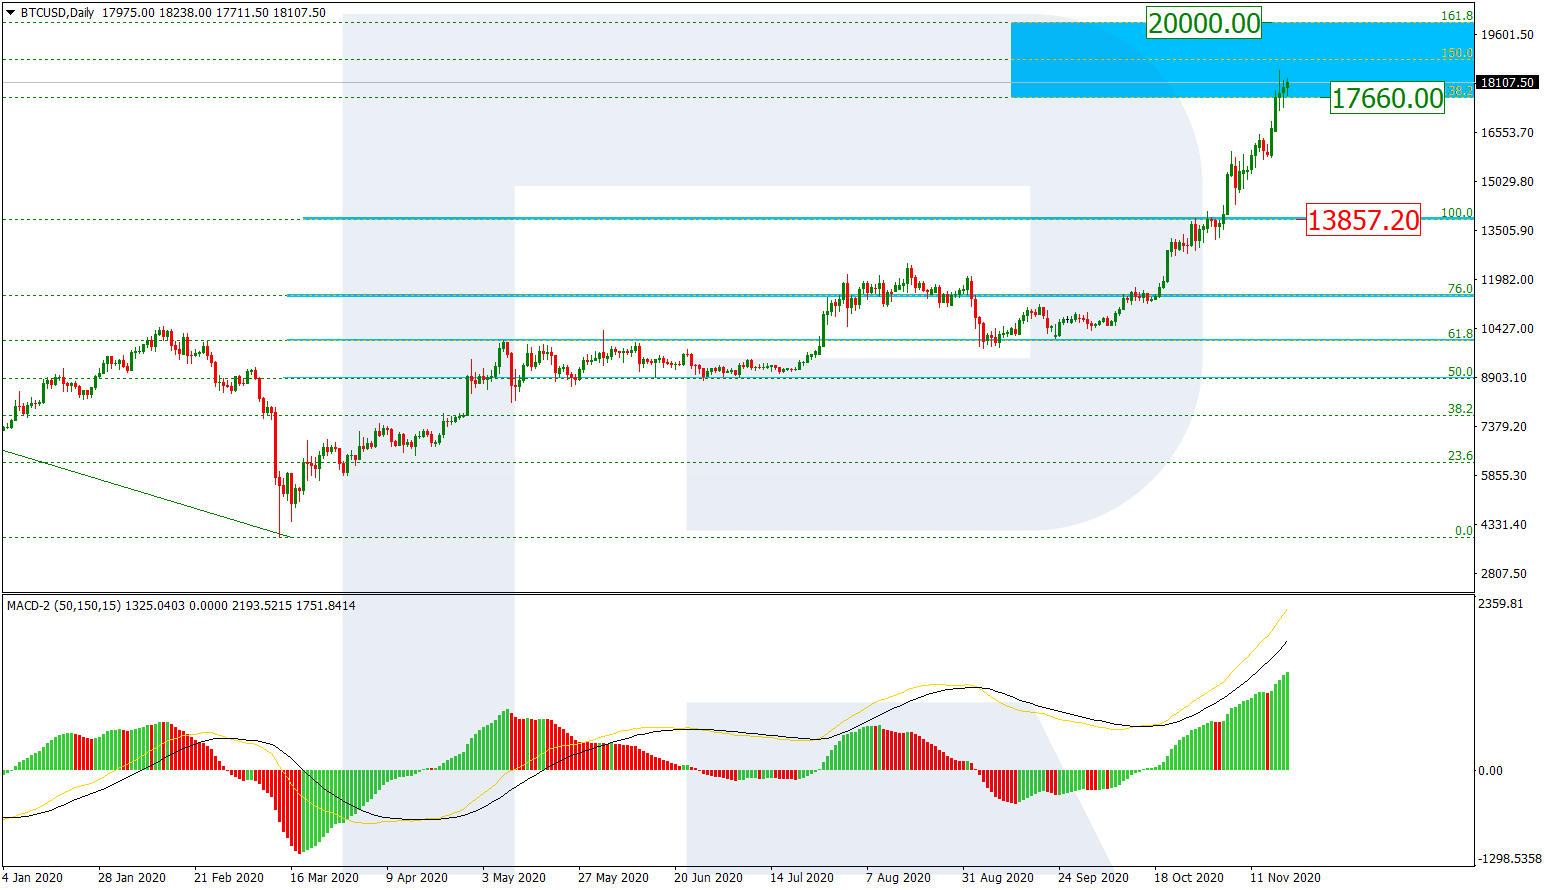
The daily chart shows a quick and steady growth towards the al-time high. After breaking the fractal at 13857.20, BTCUSD is heading towards the post-correctional extension area between 138.2% and 161.8% fibo at 17660.00 and 20000.00 respectively. If the asset decides to start a new pullback, its target will be at 13857.20, which now acts as the support.

BTCUSD_D1
Risk Warning: the result of previous trading operations do not guarantee the same results in the future

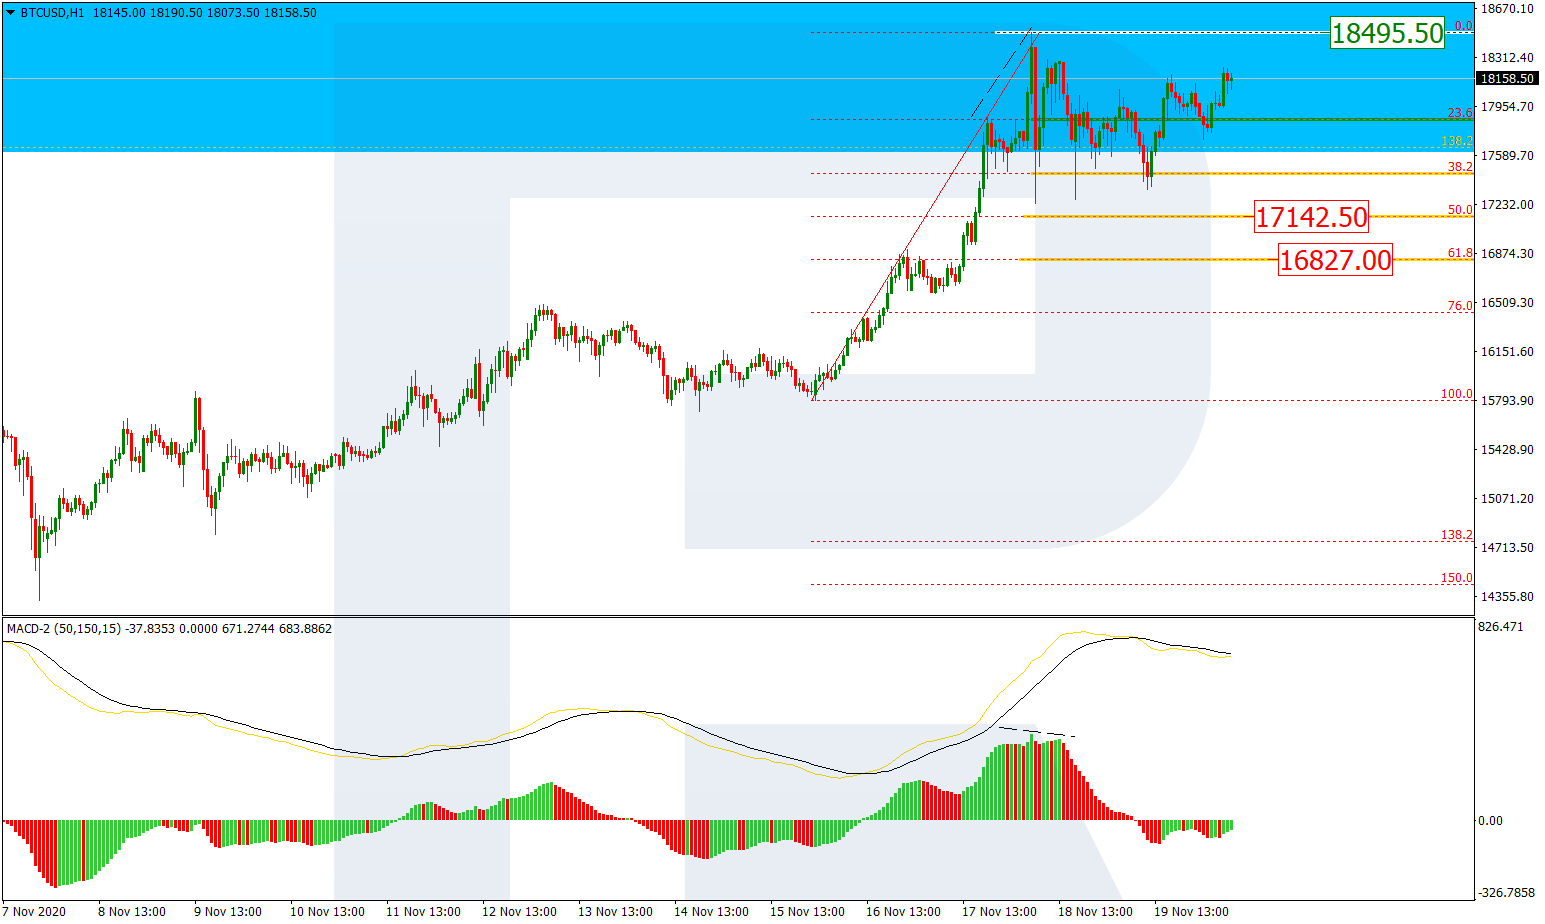
As we can see in the H1 chart, the pair is correcting after a local divergence on MACD and has already tested 38.2% fibo several times. However, judging by a consolidation channel, the price intends to break the high at 18495.50 and then continue moving upwards. Still, the asset may yet rebound from the local high and start a descending correction towards 50.0% and 61.8% fibo at 17142.5, and 16827.00 respectively.

BTCUSD_H1
Risk Warning: the result of previous trading operations do not guarantee the same results in the future

ETHUSD, “Ethereum vs. US Dollar”

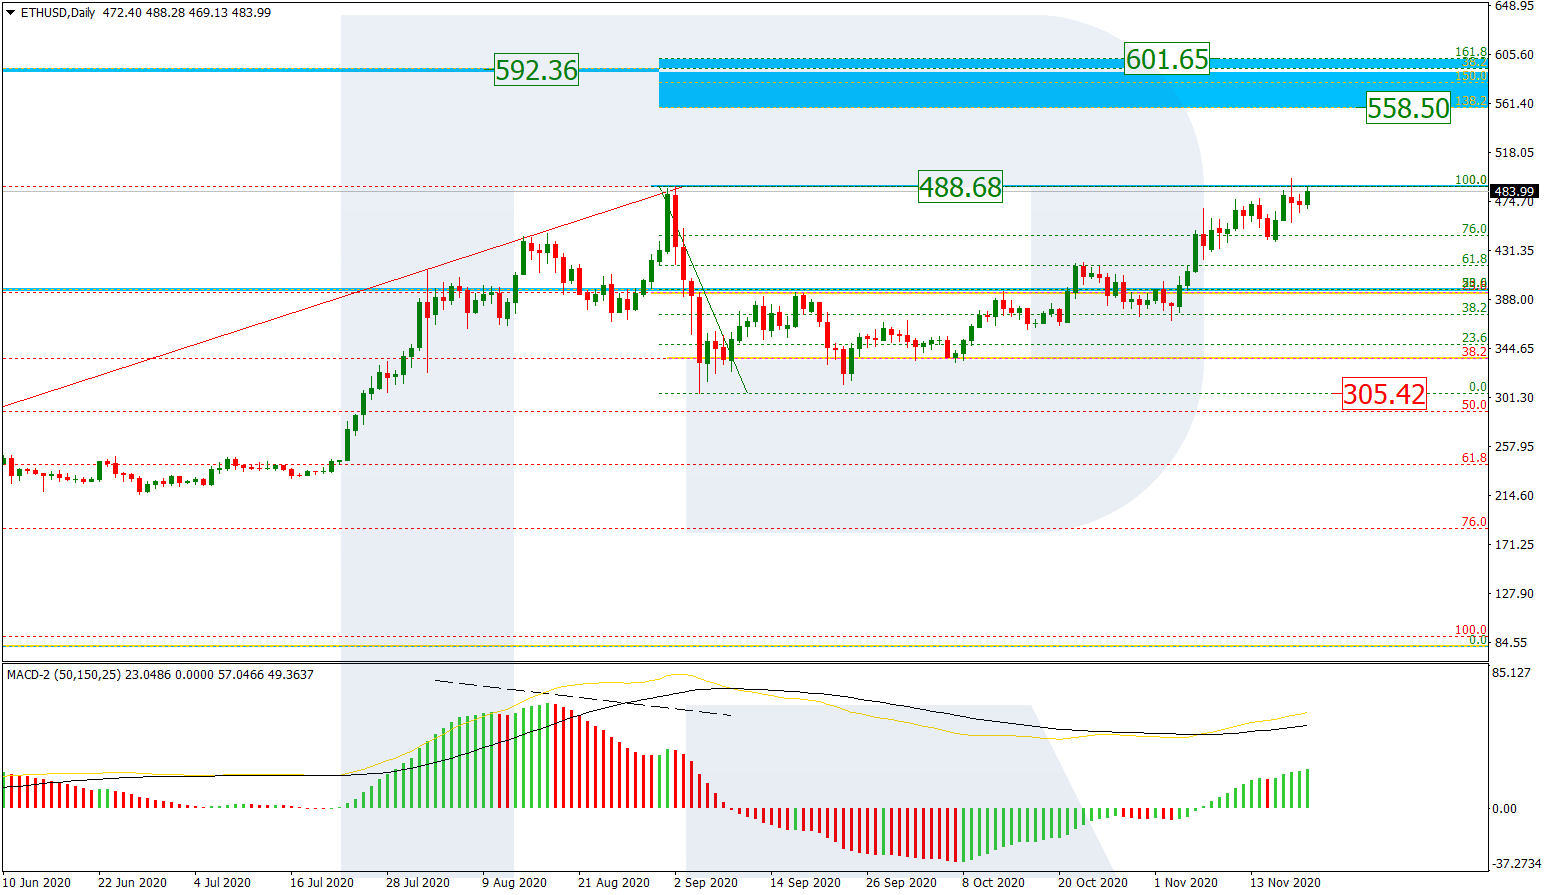
The daily chart shows a breakout of a test of the long-term fractal high at 488.68. If the price fixes above this level, it may continue the ascending tendency towards the post-correctional extension area between 138.2% and 161.8% fibo at 558.50 and 601.65 respectively with the long-term 38.2% fibo (592.36) inside it. The support is the fractal low at 305.42.

ETHUSD_D1
Risk Warning: the result of previous trading operations do not guarantee the same results in the future

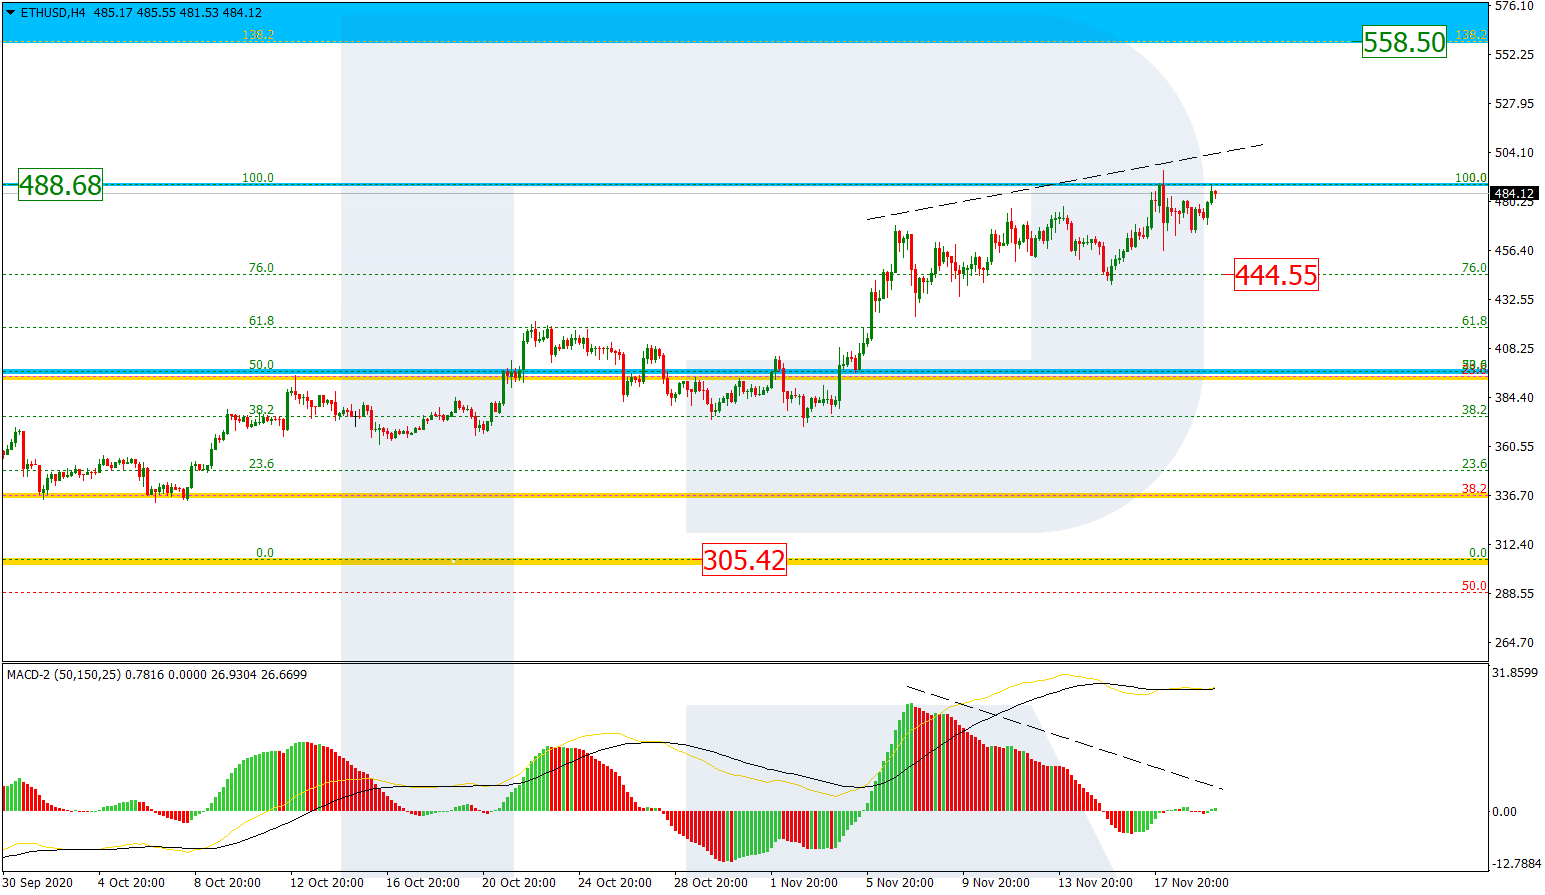
As we can see in the H1 chart, the ascending tendency continues but there is a divergence on MACD. In this case, the pair may start a new pullback to return to 76.0% fibo at 444.55.

ETHUSD_H4

Article By RoboForex.com

Attention!
Forecasts presented in this section only reflect the author’s private opinion and should not be considered as guidance for trading. RoboForex LP bears no responsibility for trading results based on trading recommendations described in these analytical reviews.

Lagarde Gives Confidence in the ECB Functioning

by JustForex

The US dollar has stopped declining on Friday after US Secretary of the Treasury Steven Mnuchin called for the end of some of the Fed’s emergency lending programs. Investors were surprised as they counted on central bank support.

This announcement weakened earlier positive sentiment after reports that Senate Republican and Democratic leaders had agreed to resume talks on a new coronavirus stimulus package. The US Labor Department reported that 742,000 people filed jobless claims in a week ending on November 14, which is higher than economists’ forecasts of 707,000 claims. Signs of weakness in the labor market are likely to persist as the outbreak of virus infections puts businesses on hold again. We recommend trading currency pairs with USD carefully, fixing positions at the nearest levels.

The ECB President Lagarde said the European Central Bank could “neither go bankrupt nor run out of money,” even if it suffered losses on the bonds it has bought under its stimulus programs. She said that as the sole issuer of euro-denominated central bank money, the Eurosystem will always be able to generate additional liquidity as needed.

Responding to a question, Lagarde added that the ECB has no legal basis for canceling the government debt it owns.

At the moment, oil prices are stable, WTI is being traded at $41.56.

Market indicators

US stocks closed with growth on Thursday due to renewed hopes for the stimulus that support market sentiment. The Dow Jones Industrial Average rose by 0.15% to 29.483.23 points, the S&P 500 rose by 0.39% to 3.581.87, and the Nasdaq Composite rose by 0.87% to 11.904.71.

The dollar index fell amid results of unemployment data. Currently, the dollar index is being traded at 92.34.

The 10-year US government bonds yield fell to 0.82% amid weak macro data.

It is worth paying attention to the news feed for today. At this time, we recommend limiting your risks in positions.

The news feed for 2020.11.20:
  • – UK retail sales at 9:00 (GMT+2);
  • – Speech by ECB President Lagarde at 10:15 (GMT+2);
  • – Core consumer price index in Canada at 15:30 (GMT+2);

by JustForex


This article reflects a personal opinion and should not be interpreted as an investment advice, and/or offer, and/or a persistent request for carrying out financial transactions, and/or a guarantee, and/or a forecast of future events.

The Analytical Overview of the Main Currency Pairs on 2020.11.20

by JustForex

The EUR/USD currency pair

Technical indicators of the currency pair:
  • Prev Open: 1.1855
  • Prev Close: 1.1872
  • % chg. over the last day: +0.15%

Yesterday, the EUR/USD currency pair was traded in the range of 1.1815-1.1880 and showed a positive trend of 0.15%. This morning the pair is growing. An uptrend is observed on the chart, which indicates the predominance of purchases on this asset. On the hourly timeframe, the price is being traded above the moving average MA 200. On the H4 timeframe, the situation is similar. The MACD indicator is in the positive zone. Based on the above, it is worth considering buy positions while the price is above MA200 on the H1 timeframe.

Trading recommendations
  • Support levels: 1.1880, 1.1815, 1.1758
  • Resistance levels: 1.1890, 1.1920

The main scenario for trading EUR/USD: look for buy entry points. If the price breaks through and fixes above 1.1890, one should consider purchases. After breaking through the 1.1890 mark, quotes may go to the level of 1.1920.

Alternative scenario: if the price fixes below 1.1815 on the H1 timeframe, the currency pair is likely to decline to 1.1758. There is also a possibility of price manipulation at the 1.1890 level. In case of a false breakout of this level, the price may fall to the level of 1.1815.

EUR/USD
News feed for 2020.11.20:
  • – Speech by ECB President Lagarde at 10:15 (GMT+2).

The GBP/USD currency pair

Technical indicators of the currency pair:
  • Prev Open: 1.3272
  • Prev Close: 1.3261
  • % chg. over the last day: -0.08%

Yesterday, the GBP/USD currency pair was traded in the range of 1.320-1.3270 and closed the day with a result of -0.08%. On the hourly chart, GBP/USD is being traded above the moving average MA (200) H1. The situation is similar on the four-hour chart. The MACD indicator is in the positive zone. Based on the above, it is necessary to look for buy entry points while the currency pair remains above MA 200 H1.

Trading recommendations
  • Support levels: 1.3195, 1.3165, 1.3108
  • Resistance levels: 1.3278, 1.3312

The main scenario: look for buy entry points. We recommend considering purchases on correction on lower timeframes. The movement is tending to the level of 1.3312. If GBP/USD quotes fix above the level of 1.3312, the price may go to the level of 1.3500.

Alternative scenario: if the price fixes below the moving average MA 200 on H1, then the asset may fall to $1.3165.

GBP/USD
News feed for 2020.11.20:
  • – UK retail sales at 9:00 (GMT+2).

The USD/JPY currency pair

Technical indicators of the currency pair:
  • Prev Open: 103.83
  • Prev Close: 103.74
  • % chg. over the last day: -0.08%

Yesterday, the USD/JPY currency pair was traded in the range of 103.70-104.20 and closed the day with a result of -0.08%. Today the currency pair is being traded at yesterday’s close. On the hourly chart, the USD/JPY currency pair has fixed below the MA line (200). On the four-hour chart, the situation is similar. The MACD indicator is in the negative zone. Based on the above, one should probably consider sales while the pair remains below MA 200 on H1.

Trading recommendations
  • Support levels: 103.65, 103.18
  • Resistance levels: 104.21, 104.35, 105.12

The main scenario for trading USD/JPY is considering selling an asset. If the price breaks the 103.65 level and fixes below it, then the currency pair may move to 103.18.

The alternative scenario assumes consolidation above 104.21, with further growth to 105.12 (November 16 high).

USD/JPY
  • The news feed is calm today.

The USD/CAD currency pair

Technical indicators of the currency pair:
  • Prev Open: 1.3082
  • Prev Close: 1.3072
  • % chg. over the last day: -0.07%

Yesterday, the USD/CAD currency pair closed with a result of -0.07%. Today the pair is being traded at yesterday’s close. On the H1 timeframe, USD/CAD is below the moving average MA 200. On the four-hour chart, the price is below the moving average. At the moment, on the currency pair, there is a prolonged consolidation in the range of 1.3060-1.3110. If the price breaks through and fixes below the trading channel, we may consider sales of the asset.

Trading recommendations
  • Support levels: 1.3060, 1.3033
  • Resistance levels: 1.3118, 1.3170

The main scenario: if the price breaks through and fixes below the level of 1.3060, it is worth considering selling with a target up to 1.3033.

Alternative scenario: if the price breaks through the level of 1.3117 and fixes above the MA 200 on H1, one should consider a buy position to the level of 1.3170.

USD/CAD
News feed for 2020.11.20:
  • – Canada core retail sales index at 15:30 (GMT+2).

by JustForex


This article reflects a personal opinion and should not be interpreted as an investment advice, and/or offer, and/or a persistent request for carrying out financial transactions, and/or a guarantee, and/or a forecast of future events.

From RCEP and BRICS to APEC and G20 Summits: World’s Largest Free-Trade Pact Inspiration for Global Recovery

By Dan Steinbock

– After four long years of diminished prospects, stagnation and divisive geopolitics, four summits could show the way toward a better future.

Recently, Moscow hosted the 12th BRICS Summit. Malaysia is hosting the APEC Summit. And Riyadh will welcome the world leaders into the highly-anticipated G20 conference.

Importantly, these high-level events followed the signing of the Regional Comprehensive Economic Partnership (RCEP), the world’s largest free-trade pact, which could help build multiple new paths toward a shared future.

The global economy is expected to shrink by 5 percent in 2020. World trade is likely to plummet by 20 percent. After misguided trade wars and the pandemic, global cooperation across all differences is vital to defeat the pandemic and facilitate economic recovery.

World’s largest free-trade pact, to act as inspiration

In the ASEAN Summit last weekend, after nearly a decade of talks, 15 countries signed the Regional Comprehensive Economic Partnership (RCEP).

The RCEP includes the 10 ASEAN countries, East Asian leaders (China, Japan, South Korea), and Oceania (Australia, New Zealand). Their combined economic muscle is almost a third of the world gross domestic product (GDP).

The RCEP is expected to eliminate 90 percent of the tariffs on imports between its signatory economies within 20 years of coming into effect, which could be by early as next year. It will also seek to establish common rules for e-commerce, trade and intellectual property.

Until recently, the RCEP critics in the West argued that the pact represents “shallow” integration since its requirements are not as stringent as, say, the now defunct Trans-Pacific Partnership (TPP) which was negotiated in secrecy in the Obama era. Typically, when the remaining 11 TPP countries agreed on the revised Comprehensive and Progressive Agreement for Trans-Pacific Partnership (CPTPP), it omitted 20 provisions that US had included in the original TPP.

Second, “shallow” integration is better aligned with the integration needs in emerging Asia, where governments play critical role in economic development, the idea of national sovereignty is vital, and legacies of Western colonialism remain prominent.

Third, the RCEP may be more aligned with the new international landscape that’s overshadowed by protectionism and tariff wars.

BRICS expediting global recovery

Hosted by Russia on November 17, the BRICS Summit brought together major economies of the emerging-market bloc: Brazil, Russia, India, China and South Africa. Together, they account for one quarter of the world economy.

As the second-most affected country by the novel coronavirus pandemic, India’s cumulative Covid-19 cases exceed 9 million, while Brazil has 6 million and Russia 2 million cases, respectively. Unlike the rest, China has managed to keep its cases below 90,000. As a result, Chinese economy is already rebounding.

Due to the tensions in the world economy, the BRICS Summit focused on practical measures to battle the pandemic and support the BRICS’ economic recovery. It also created an early warning system for epidemiological threats to foster BRICS capabilities on medical products. As clinical vaccine tests are moving ahead fast, companies in BRICS countries are getting ready to ramp up large-scale production.

As a result of the pandemic, the BRICS New Development Bank (NDB) has been in great demand. It has already reserved $10 billion to combat the pandemic, but its overall portfolio of investment projects exceeds $20 billion.

Most importantly, the Summit further facilitated trade, investments and small-and-medium size enterprises’ (SMEs) role in international trade. While large multinational corporations fuel the recovery of global GDP, it is the SMEs that have the relatively greatest job-creation effect, which is vital for global recovery.

New APEC vision, roadmap needed

In the Malaysia-hosted APEC Summit on November 20, the bloc is expected to set a new vision to guide the forum’s work in the next decades.

With APEC and its 21 member economies, the idea of regional free trade has been around since 1966 when Japanese economist Kiyoshi Kojima advocated a Pacific Free Trade agreement. Three decades later, APEC leaders opted for free and open trade and investment in the Asia Pacific.

In 2006, C. Fred Bergsten, then chief of an influential US think-tank, advocated the Free Trade Area of the Asia Pacific (FTAAP). If the FTAAP could be achieved, it would represent the largest single liberalization in history.

That’s the FTAAP goal that APEC put forward in 2006, which is supported by many Asian economies, including China. It would be very much in the long-term interest of the United States as well. No single country can any longer have unipolar primacy in world trade; all countries have a critical stake in multilateral world trade.

What APEC needs is a timely roadmap for the effective implementation of its vision.

Cooperation must be focus of G20 summit

Since early spring, the major rich-income economies have been crafting massive stimulus responses against the pandemic. In 2020, fiscal support packages could climb to $15 to $20 trillion worldwide. Meanwhile, many medium- and particularly low-income economies are suffering from excessive debt burden.

On November 21-22, the G20 Summit will focus on addressing the implications of the global pandemic, future health care plans and steps for revising the global economy, including fiscal support, debt reductions and other vital measures.

G20 has the required economic muscle for global change. With 19 largest economies and the European Union, it accounts for 90 percent of the gross world product and 80 percent of world trade.

When the major economies in Western Europe and North America failed to contain the Great Recession in 2007-09, it was G20, led forcefully by its then-chief Dominique Strauss-Kahn, that played a vital role in surpassing fatal headwinds.

More recently, such initiatives have been less evident.

Trade wars have no winners, shared future will benefit all

In January 2017, China’s President Xi Jinping offered a strong defense of more inclusive free trade at the World Economic Forum. Xi likened protectionism to “locking oneself in a dark room” in the hopes of protecting oneself from danger, but in so doing, cutting off all “light and air.”

Xi predicted, quite rightly in retrospect, that “no one will emerge as a winner in a trade war.”

It is this global sense of a shared future that the summit season should promote for success in the battle against the pandemic and for global economic recovery.

 About the Author:

Dr. Dan Steinbock is an internationally recognized strategist of the multipolar world and the founder of Difference Group. He has served at the India, China and America Institute (USA), Shanghai Institutes for International Studies (China) and the EU Center (Singapore). For more, see https://www.differencegroup.net

The original commentary was published by China Daily on Nov. 17, 2020. This is an updated version.


Stimulus spat adds to dark winter woes

By Han Tan, Market Analyst, ForexTime

Global stocks are set to end the week on a downer, as Treasury Secretary Steven Mnuchin and Fed Chair Jerome Powell engage in a public disagreement over how US stimulus funds should be deployed.  Mnuchin had asked for the yet-unused US$455 billion from the Fed’s emergency pandemic lending programme to be returned and injected into the US economy; a proposal that was met with swift rejection by the Fed.

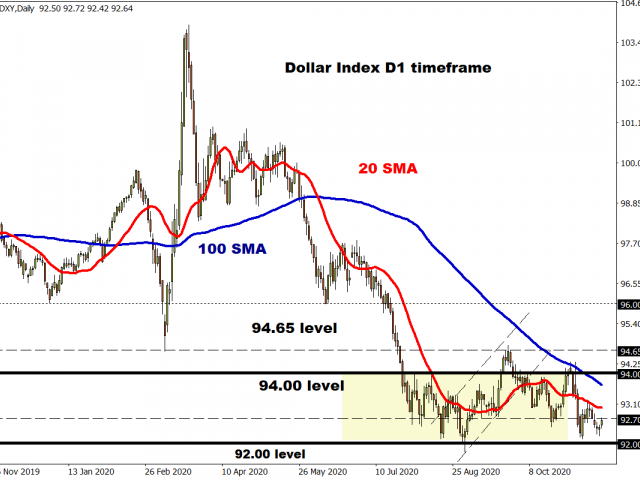
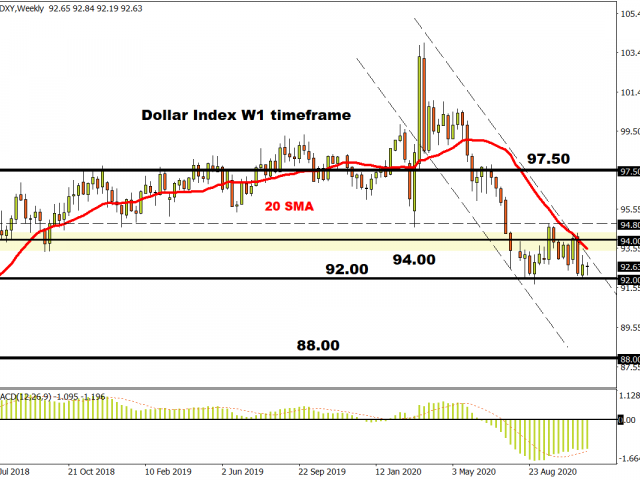
Such frosty exchanges between the US fiscal and monetary sides being exposed to the public arena only further erodes the already-fragile market sentiment, prompting investors to adopt a risk-off stance. The Dollar index remains supported above the 92 psychological level while yields on 10-year Treasuries extend the pullback below the 1% mark.

Vaccine doubts eroding investor confidence

Faced with the merciless pandemic that has triggered a late-night curfew in California and school closures in New York, markets have now come upon yet another fork in the road. Investors are awaiting signals on whether to revert to the pandemic-era playbook of sticking with lockdown beneficiaries such as tech megacaps, or press on with the rotation play which is underpinned by expectations of an incoming Covid-19 vaccine and a fresh round of US fiscal stimulus.

Yet, the euphoria surrounding the vaccine is fast dwindling, as investors are still left to decipher the duration and the extent of the vaccine’s effectiveness. Amid this void of crucial information, biotech stocks are losing some of their mojo, while pandemic-era stalwarts are returning to the fore.

US political impasse dampens market mood

Keep in mind that the Democrat’s agenda is on a knife’s edge, pending the pair of Senate runoffs in Georgia in January. It remains to be seen whether Democrats can gather enough political mass to push through its policies, including a larger stimulus package. In the meantime, the political stalemate is depriving the US economy of some much-needed stimulus, which in turn is denying riskier assets a clear mandate to push even higher.

Note that the latest weekly reading on initial US jobless claims coming in worse than expected at 742,000, which is still more than three times higher compared to pre-pandemic levels. The stubbornly high jobless claims, coupled with the underwhelming October US retail sales data which was released earlier in the week, compound concerns that the US economic recovery is at risk of stalling out.

Winter is coming

Given the uncertain timeline before we can see a world that’s vaccinated from Covid-19, or the chances of attaining herd immunity, coupled with persistent fears of a double-dip recession in major economies, global investors would indeed do well to brace for a dark winter and take care not to slip on the icy path ahead.


Disclaimer: The content in this article comprises personal opinions and should not be construed as containing personal and/or other investment advice and/or an offer of and/or solicitation for any transactions in financial instruments and/or a guarantee and/or prediction of future performance. ForexTime (FXTM), its affiliates, agents, directors, officers or employees do not guarantee the accuracy, validity, timeliness or completeness, of any information or data made available and assume no liability as to any loss arising from any investment based on the same.


Forex-Time-LogoArticle by ForexTime

ForexTime Ltd (FXTM) is an award winning international online forex broker regulated by CySEC 185/12 www.forextime.com

Record levels proving tricky

By Lukman Otunuga, Research Analyst, ForexTime

The trumpets were ready, the bunting unfurled but sadly they’ve all had to be put away for the time being as the Dow failed to break 30,000 and beyond. The broader S&P500 has also struggled at the highs as the markets battle with short-term virus pain and longer-term vaccine joy.

The Dow hit the 20,000 historic milestone on 25 January 2017 after rallying some 1,700 points after President Trump’s election victory in November of the previous year. Wall Street was betting big that Trump’s plans to slash taxes, cut regulation and ramp up infrastructure spending would make the American economy great again. History is probably the best judge of that bet, with the main driver now being, in company specific terms at least, Apple.

Since hitting 29,000, the tech giant has contributed nearly 1,300 points which is more than twice that of any other Dow component. Of course, round numbers are points of interest more for the cover of Time magazine than traders and investors especially with a price-weighted index like the Dow, but we can at least add this landmark (when it happens) to the collection of tech stats which have fuelled this year’s indices performance.

Revealing S&P technical indicator

Interestingly, many observers are talking about the ‘great rotation’ out of growth and the US, and into value stocks and the rest of the world. If we switch our focus to the S&P500, we can see that the distance between the index and its 200-day Moving Average is now two standard deviations above the mean, for the first time since May 1999. This generally means there is a high chance of a major pullback as the market has discounted a lot of good news already. Time will tell as we head into a long winter and with prices nestling on previous cycle highs from September and October.

DXY holding key level

The Dollar is widely expected to struggle next year as low yields, relatively slow growth expectations and reduced trade tensions all deliver a sucker punch to the greenback. The market is already short King Dollar but for the time being seems reluctant to add to these positions. The surge in infection rates is holding up the world’s reserve currency as it bangs on the exit door to levels not seen since April 2018. In fact, the lack of support below the 92 zone is striking with bears eyeing up the 2018 lows just above 88.

With EU leaders struggling today to get agreement on the pandemic relief package, risk assets may be kept in check into the weekend and put a floor below USD for now.

Disclaimer: The content in this article comprises personal opinions and should not be construed as containing personal and/or other investment advice and/or an offer of and/or solicitation for any transactions in financial instruments and/or a guarantee and/or prediction of future performance. ForexTime (FXTM), its affiliates, agents, directors, officers or employees do not guarantee the accuracy, validity, timeliness or completeness, of any information or data made available and assume no liability as to any loss arising from any investment based on the same.


Forex-Time-LogoArticle by ForexTime

ForexTime Ltd (FXTM) is an award winning international online forex broker regulated by CySEC 185/12 www.forextime.com

US yields can’t reclaim 1% – The EUR/USD to capture 1.2000?

By Admiral Markets

Economic events

Source: Economic Events 20 November 2020 – Admiral Markets Forex Calendar

Last week, Pfizer and BioNTech announced that they are on their way to a Covid-19 vaccine which is said to be effective in over 90% of the cases, while new vaccine news came last Monday.

This time it came from Moderna, announcing that its phase 3 study met statistical criteria with a vaccine efficacy of 94.5% (P < 0.0001), and even more interesting compared to the Pfizer/Biontech news, Moderna announced a longer shelf life for Its COVID-19 vaccine candidate at refrigerated temperatures.

But, while US yields spiked substantially higher despite falling short of a test of the 1% mark last week, this week, there was only a short spike higher in US yields, and the US dollar was quickly sold again.

As we pointed out in our last analytical piece for Gold e.g., the subdued bullishness in US yields is surprising, and it can only mean one thing in our opinion: market participants are still convinced that we are far away from returning to “normal” from an economic standpoint. Thus, chances of a massive fiscal package to stabilize the US economy, and an ultra-dovish approach from the US central bank FED to finance that fresh US debt, is probably are still on the table.

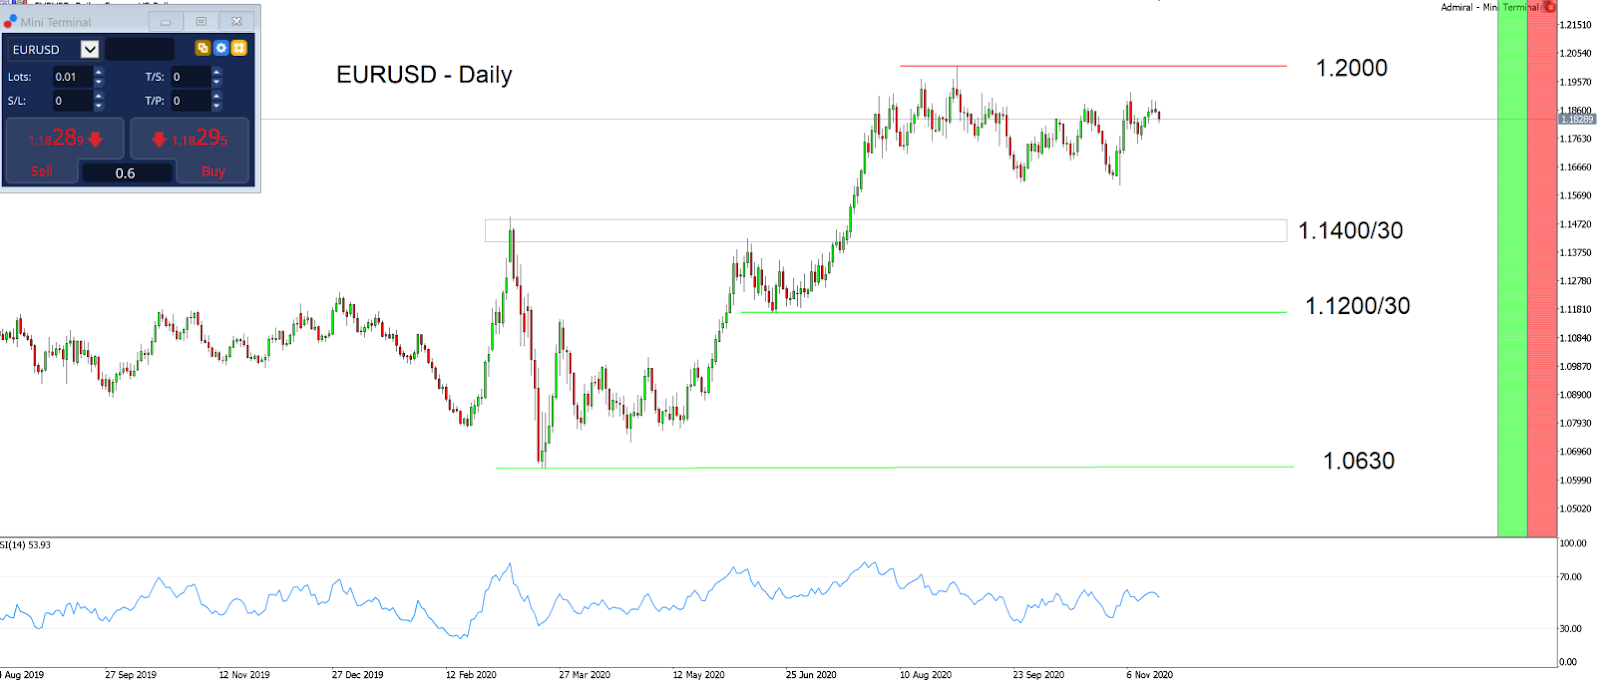
That said, the short-term focus in the EUR/USD is clearly on the 1.1900 mark from a technical standpoint.

In fact, a dynamic break above levels the path up to the current yearly highs around 1.2000 and even higher, coming together with a bullish seasonal window in the EUR/USD which occurs in December, and has so since the mid-1980s.

Technically, the mode in the EUR/USD stays bullish as long as we trade above 1.1600, even though even a drop lower wouldn’t necessarily switch the mode to “ultra”-bearish, since the currency pair still finds solid support in the region around 1.1400/1500:

EUR/USD daily chart

Source: Admiral Markets MT5 with MT5-SE Add-on EUR/USD Daily chart (between August 14, 2019, to November 19, 2020). Accessed: November 19, 2020, at 10:00pm GMT Please note: Past performance is not a reliable indicator of future results, or future performance.

In 2015, the value of the EURUSD fell by 10.2%, in 2016 it fell by 3.2%, in 2017 it increased by 13.92%, 2018 it fell by 4.4%, 2019 it fell by 2.2%, meaning that after five years, it was down by 7.3%.

Discover the world’s #1 multi-asset platform

Admiral Markets offers professional traders the ability to trade with MetaTrader 5, allowing you to experience trading at a significantly higher, more rewarding level than with MetaTrader 4. Experience benefits such as the addition of the Market Heat Map, so you can compare various currency pairs to see which ones might be lucrative investments, access real-time trading data, and so much more. Click the banner below to start your FREE download of MT5!

Trade With MetaTrader 5

Disclaimer: The given data provides additional information regarding all analysis, estimates, prognosis, forecasts or other similar assessments or information (hereinafter “Analysis”) published on the website of Admiral Markets. Before making any investment decisions please pay close attention to the following:

  1. This is a marketing communication. The analysis is published for informative purposes only and is in no way to be construed as investment advice or recommendation. It has not been prepared in accordance with legal requirements designed to promote the independence of investment research, and that it is not subject to any prohibition on dealing ahead of the dissemination of investment research.
  2. Any investment decision is made by each client alone whereas Admiral Markets shall not be responsible for any loss or damage arising from any such decision, whether or not based on the Analysis.
  3. Each of the Analysis is prepared by an independent analyst (Jens Klatt, Professional Trader and Analyst, hereinafter “Author”) based on the Author’s personal estimations.
  4. To ensure that the interests of the clients would be protected and objectivity of the Analysis would not be damaged Admiral Markets has established relevant internal procedures for prevention and management of conflicts of interest.
  5. Whilst every reasonable effort is taken to ensure that all sources of the Analysis are reliable and that all information is presented, as much as possible, in an understandable, timely, precise and complete manner, Admiral Markets does not guarantee the accuracy or completeness of any information contained within the Analysis. The presented figures that refer to any past performance is not a reliable indicator of future results.
  6. The contents of the Analysis should not be construed as an express or implied promise, guarantee or implication by Admiral Markets that the client shall profit from the strategies therein or that losses in connection therewith may or shall be limited.
  7. Any kind of previous or modelled performance of financial instruments indicated within the Publication should not be construed as an express or implied promise, guarantee or implication by Admiral Markets for any future performance. The value of the financial instrument may both increase and decrease and the preservation of the asset value is not guaranteed.
  8. The projections included in the Analysis may be subject to additional fees, taxes or other charges, depending on the subject of the Publication. The price list applicable to the services provided by Admiral Markets is publicly available from the website of Admiral Markets.

Leveraged products (including contracts for difference) are speculative in nature and may result in losses or profit. Before you start trading, you should make sure that you understand all the risks.

By Admiral Markets