Murrey Math Lines 02.12.2020 (USDJPY, USDCAD)

Article By RoboForex.com

USDJPY, “US Dollar vs. Japanese Yen”

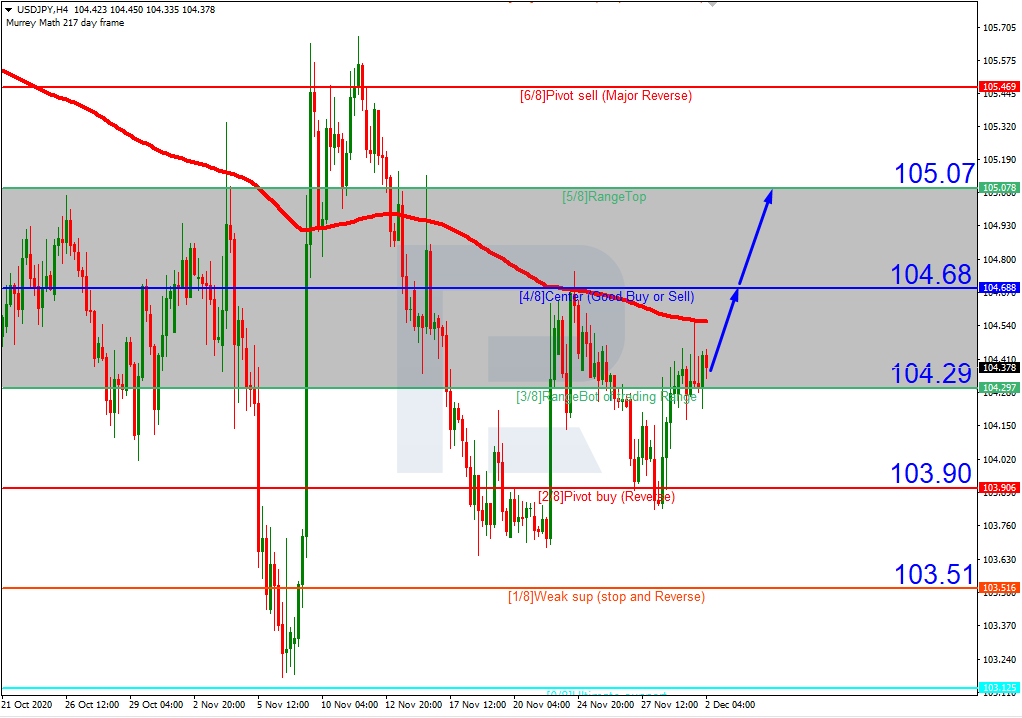
On H4, the USDJPY quotations returned to the consolidation range. We expect the price to grow to 4/8. A breakaway of this level will bring the quotations to the resistance at 5/8. The scenario will be canceled if 3/8 is broken downwards. This will cause further falling to the support at 2/8.

USDJPY_H4
Risk Warning: the result of previous trading operations do not guarantee the same results in the future

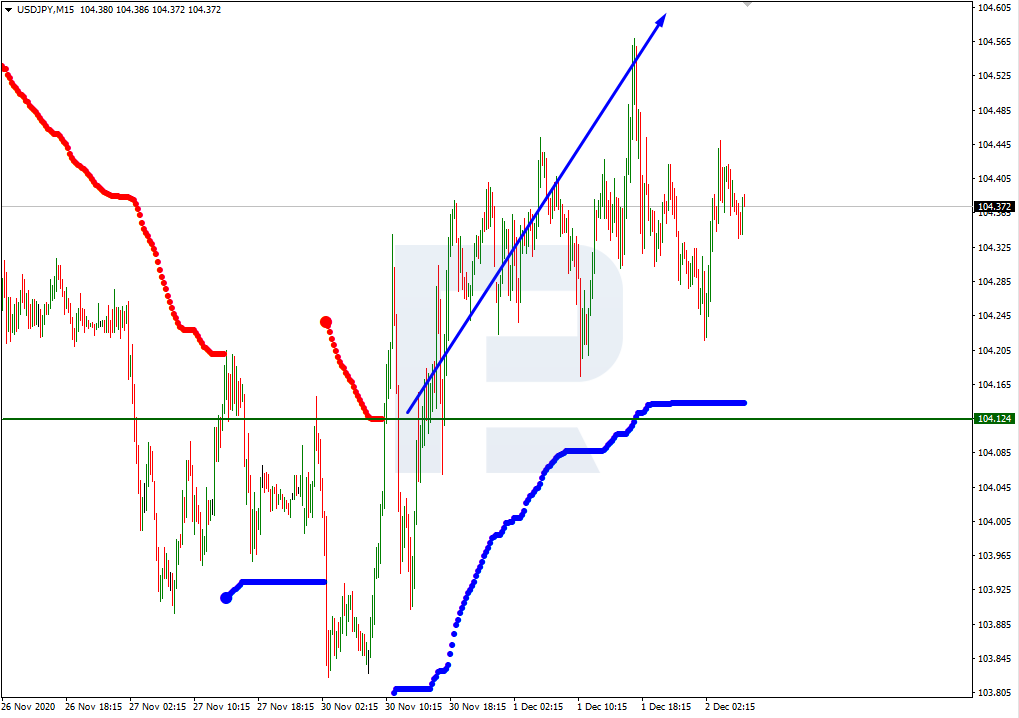
On M15, the upper border of the VoltyChannel indicator is broken. This increases the chances for further growth of the price.
USDJPY_M15
Risk Warning: the result of previous trading operations do not guarantee the same results in the future

USDCAD, “US Dollar vs Canadian Dollar”

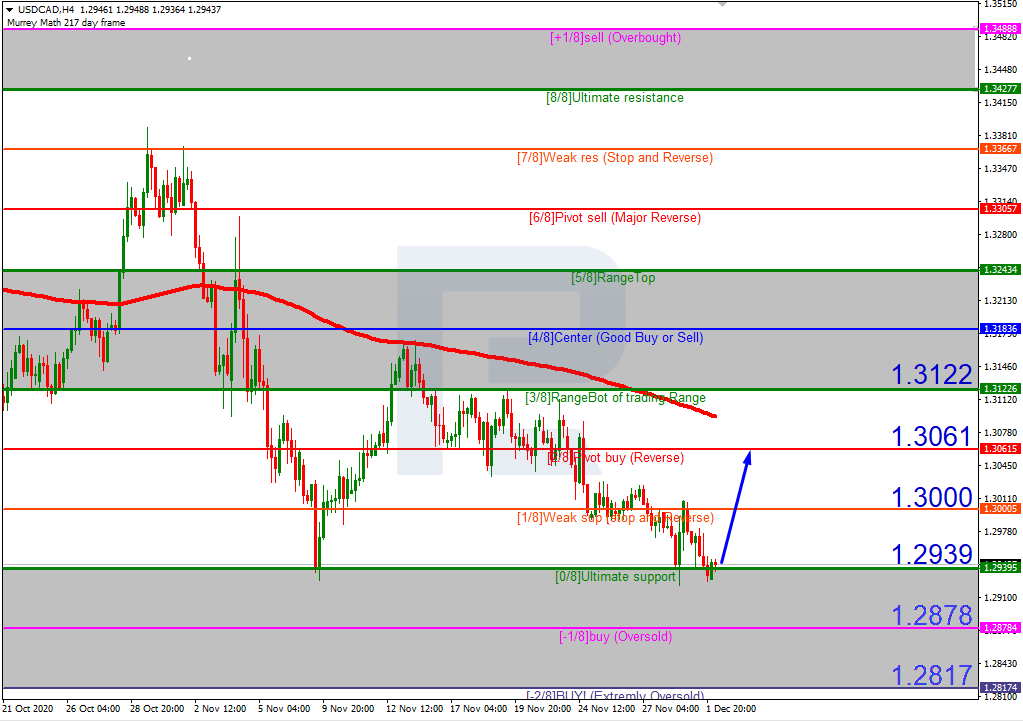
On H4, the quotations are trading under the 200-days Moving Average, which indicates the prevailing of a downtrend. However, the price has already reached the oversold area. We expect a bounce off 0/8 and further growth to the resistance at 2/8. This will be interpreted as a correction. The scenario might no longer be valid if 0/8 is broken downwards, which will bring the price deeper down to the support at -1/8.
USDCAD_H4
Risk Warning: the result of previous trading operations do not guarantee the same results in the future

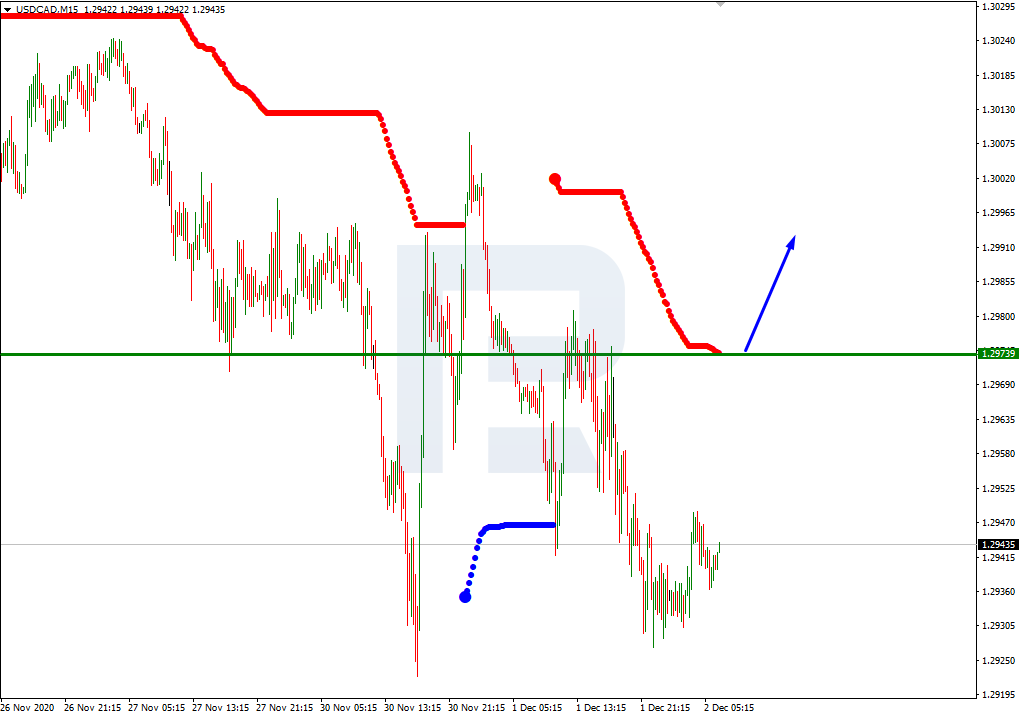
On M15, a breakaway of the upper border of VoltyChannel will additionally support the growth of the price.
USDCAD_M15

Article By RoboForex.com

Attention!
Forecasts presented in this section only reflect the author’s private opinion and should not be considered as guidance for trading. RoboForex LP bears no responsibility for trading results based on trading recommendations described in these analytical reviews.

Fibonacci Retracements Analysis 02.12.2020 (GBPUSD, EURJPY)

Article By RoboForex.com

GBPUSD, “Great Britain Pound vs US Dollar”

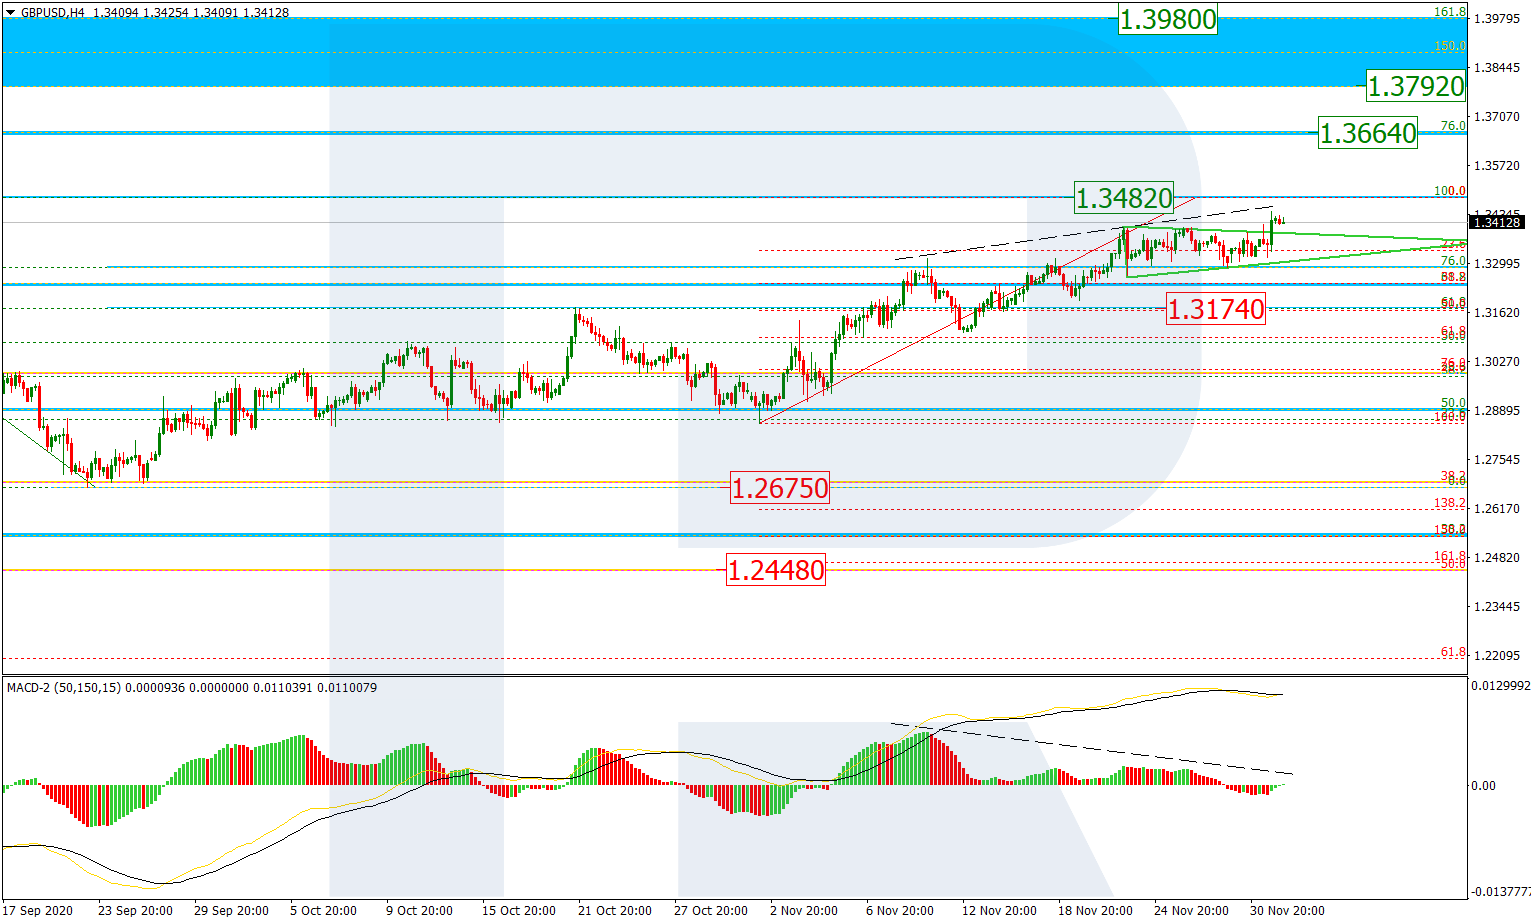
On H4, the pair keeps developing the uptrend, aiming at the long-term high of 1.3482. After a correction in the form of a Triangle, the quotations escaped the pattern upwards. A breakaway of the high will let the quotations rise to the long-term level of 76.0% (1.3664), and later to the post-correctional extension range of 138.2-161.8% (1.3792-1.3980) Fibo. As long as there is a divergence forming, we may expect a pullback to the local support level of 1.3174.

GBPUSD_H4
Risk Warning: the result of previous trading operations do not guarantee the same results in the future

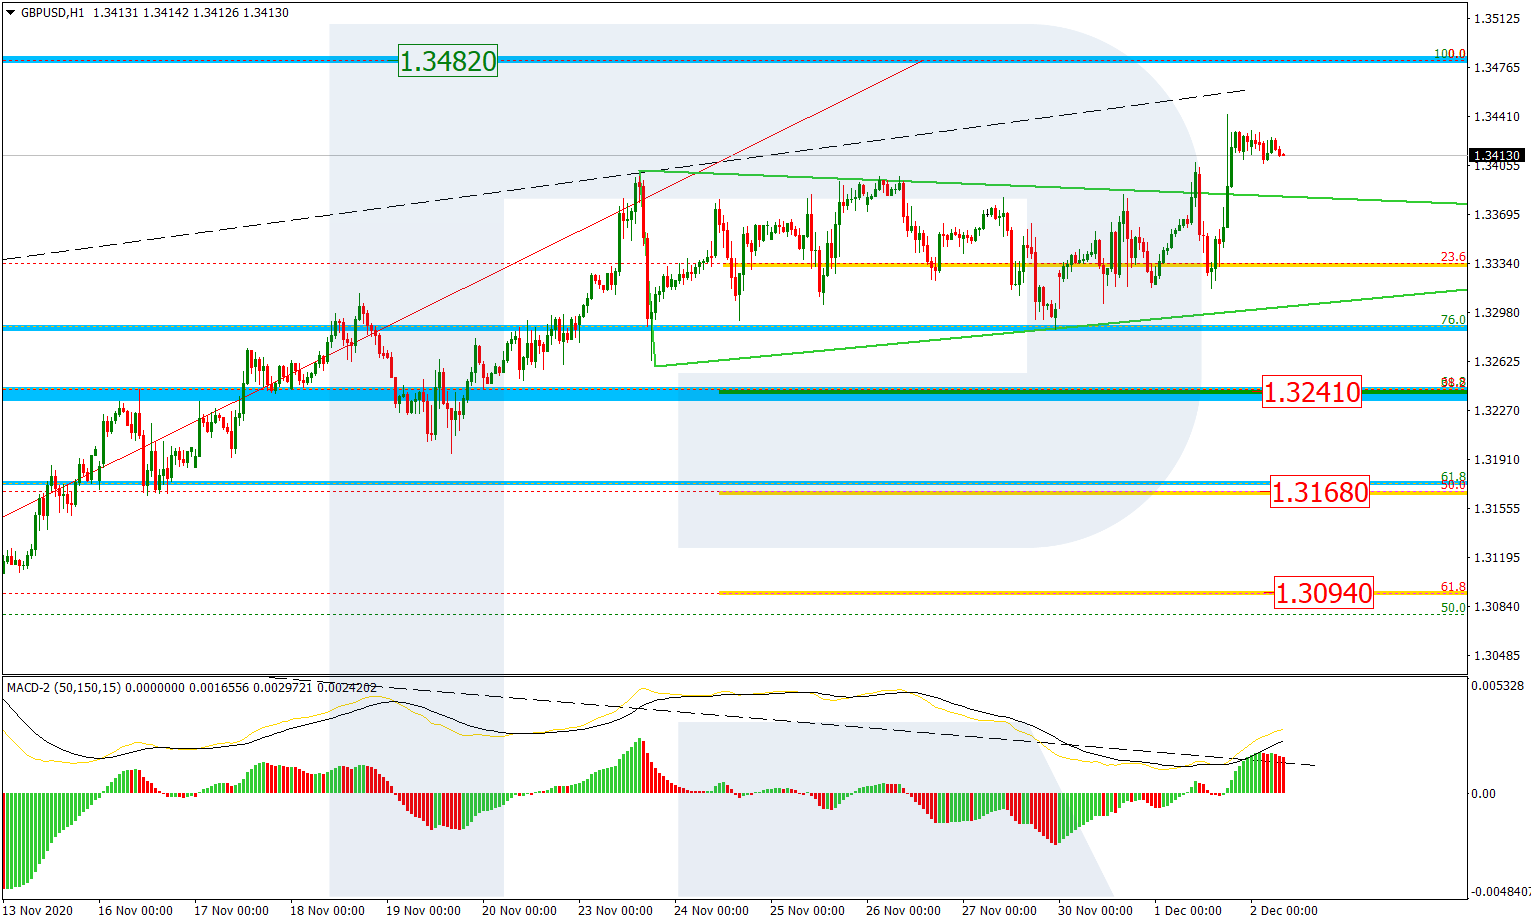
On H1, the quotations have broken through the upper border of a correctional Triangle and are again consolidating before a leap to 1.3482. The growth to the high and a divergence might end in a pullback to 23.6% (1.3334), 38.2% (1.3241), 50.0% (1.3168), and 61.8% (1.3094) Fibo.

GBPUSD_H1
Risk Warning: the result of previous trading operations do not guarantee the same results in the future

EURJPY, “Euro vs. Japanese Yen”

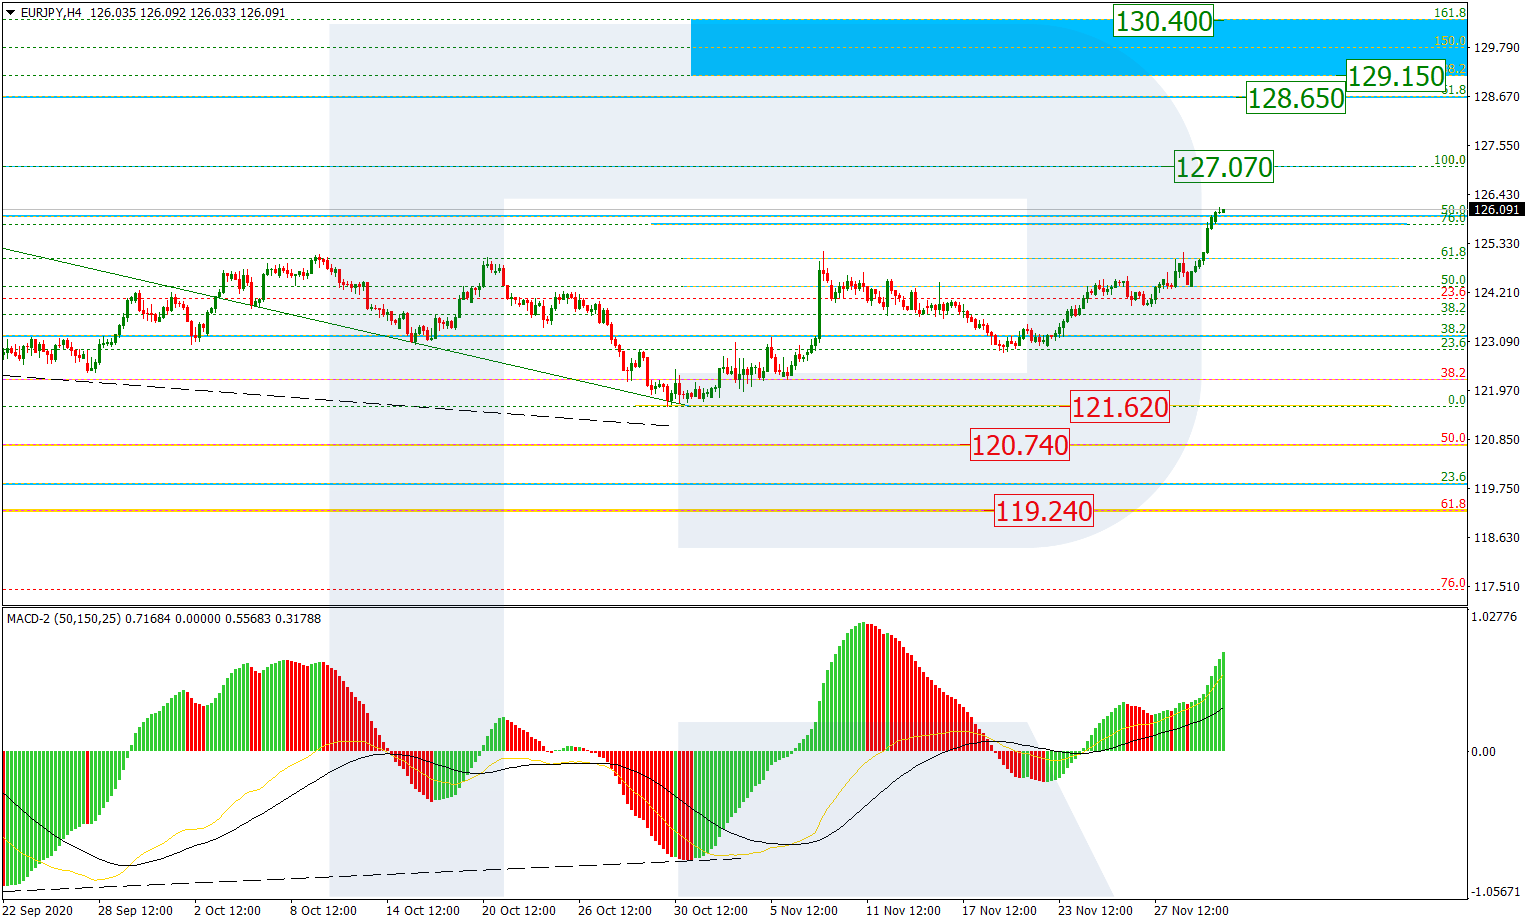
On H4, the market is developing a confident uptrend after a correction. By now, the impulse of growth has reached 76.0% Fibo and might later rise to the high of 127.07. Upon breaking the high, the quotations might rise to the medium-term level of 61.8% (128.65), and when it is broken in its turn, the price might proceed to the upper post-correctional extension range of 138.2-161.8% (129.15-130.40) Fibo. However, the quotations might still bounce off the high, and a wave of decline to 121.62 and 50.0% (120.74) might develop.

EURJPY_H4
Risk Warning: the result of previous trading operations do not guarantee the same results in the future

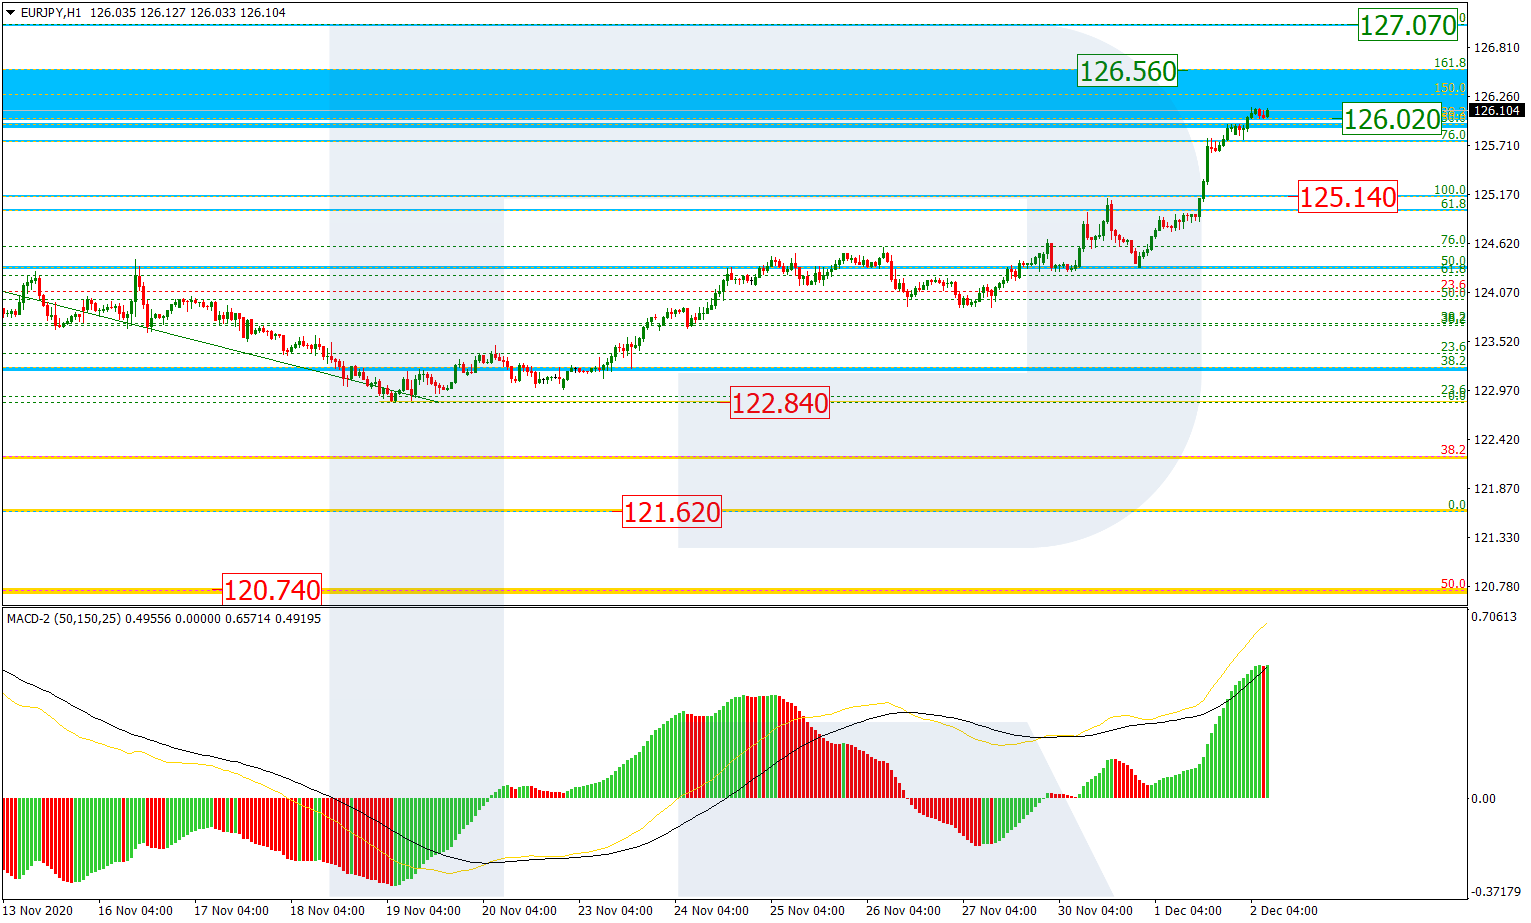
On H1, the quotations are rising to the post-correctional extension range of 138.2-161.8% (126.02-126.56) Fibo. Then they will proceed to the high of 127.07. We expect them to bounce off it and correct to the support level on 125.14.

EURJPY_H1

Article By RoboForex.com

Attention!
Forecasts presented in this section only reflect the author’s private opinion and should not be considered as guidance for trading. RoboForex LP bears no responsibility for trading results based on trading recommendations described in these analytical reviews.
The Analytical Overview of the Main Currency Pairs on 2020.12.02

by JustForex

The EUR/USD currency pair

Technical indicators of the currency pair:
  • Prev Open: 1.1924
  • Prev Close: 1.2071
  • % chg. over the last day: +1.2%

Yesterday, the EUR/USD pair was traded in an uptrend and showed a dynamics of +1.2%. An uptrend is observed on the chart, which indicates the predominance of purchases on this asset. On the hourly timeframe, the price is being traded above the moving average MA 200. On the H4 timeframe, the situation is similar. The MACD indicator is currently in the positive zone on H1. Based on the above, it is worth considering only buy positions while the price is above MA 200 on H1.

Trading recommendations
  • Support levels: 1.2000, 1.1939, 1.1921, 1.1905, 1.1815
  • Resistance levels: 1.2100

The main scenario for trading EUR/USD is looking for buy entry points. Yesterday the price broke through the strong level of 1.2000 and fixed above it. It is best to look for buy entry points when the price rolls back to the trend line or to 1.2000. With the opening of long positions, quotes can go to the level of 1.2100.

Alternative scenario: if the price fixes below the level of 1.2000 on the H1 timeframe and below MA 200 on H1, the currency pair is likely to decline to 1.1939.

EUR/USD
News feed for 2020.12.02:
  • – ADP United States Nonfarm Employment Change at 15:15;
  • – Speech by the Federal Reserve System Chairman Powell at 17:00;
  • – US crude oil stocks at 17:30.

The GBP/USD currency pair

Technical indicators of the currency pair:
  • Prev Open: 1.3321
  • Prev Close: 1.3422
  • % chg. over the last day: +0,75%

Yesterday, the GBP/USD pair was traded in an uptrend and showed 0.75%. On the hourly chart, GBP/USD is being traded above the moving average MA (200) H1. The situation is similar on the four-hour chart. The MACD indicator is in the positive zone on H1. The uptrend maintains.Based on the above, it’s probably worth holding to bull trading and as long as the currency pair remains above MA 200 H1, it’s necessary to look for buy entry points.

Trading recommendations
  • Support levels: 1.3398, 1.3315, 1.3263, 1.3195, 1.3105
  • Resistance levels: 1.3482

The main scenario: look for buy entry points. Yesterday, the currency pair managed to break through the strong level of 1.3398 and fixed above it. When generating signals on lower timeframes, it is worth considering buying an asset. With the opening of long positions, quotes can go to the level of 1.3482. It is also worth noting that divergence is observed on the MACD on the H4 timeframe. This can signal the beginning of a pair correction.

Alternative scenario: if the price fixes below 1.3398, then the asset may fall to 1.3115.

GBP/USD
News feed for 2020.12.02:
  • – ADP United States Nonfarm Employment Change at 15:15;
  • – Speech by the Federal Reserve System Chairman Powell at 17:00;
  • – US crude oil stocks at 17:30.

The USD/JPY currency pair

Technical indicators of the currency pair:
  • Prev Open: 104.28
  • Prev Close: 104.30
  • % chg. over the last day: 0%

Yesterday, the USD/JPY currency pair closed the day with a result of 0%. On the hourly chart, the currency pair fixed above the moving average MA 200. On the four-hour chart, the price is below MA 200. MACD indicator on H1 is in the positive zone. Based on the above, you can try to look for buy entry points on corrections on lower timeframes. It is worth keeping track of how the price will test MA 200 on the H4 timeframe.

Trading recommendations
  • Support levels: 104.22, 103.84, 103.65
  • Resistance levels: 104.57, 104.75, 105.12

The main scenario: consider buying an asset. It is best to look for entry points when the price breaks through and fixes above the level of 104.57. With the opening of long positions, quotes can go to the level of 104.75.

An alternative scenario assumes consolidation below the level of 104.22, followed by a fall to the level of 103.84.

USD/JPY
News feed for 2020.12.02:
  • – ADP United States Nonfarm Employment Change at 15:15;
  • – Speech by the Federal Reserve System Chairman Powell at 17:00;
  • – US crude oil stocks at 17:30.

The USD/CAD currency pair

Technical indicators of the currency pair:
  • Prev Open: 1.3003
  • Prev Close: 1.2933
  • % chg. over the last day: -0,54%

Yesterday, the USD/CAD currency pair was traded in a downtrend and closed with the result of -0.54%. On the H1 timeframe, USD/CAD is below the moving average MA 200. On the four-hour chart, the price is below the moving average. Based on the above, it is worth considering selling an asset.

Trading recommendations
  • Support levels: 1.2928
  • Resistance levels: 1.2985, 1.3010,1.3028, 1.3091, 1.3117, 1.3172

The main scenario: we recommend considering the sale of an asset. If the price breaks through and fixes below the level of 1.2928, it is better to look for a sell entry point.

Alternative scenario: if the price can break through the level of 1.2985 and fix above the 200 moving average of the period on H1, we can consider a buy position to the level of 1.3028.

USD/CAD
News feed for 2020.12.02:
  • – ADP United States Nonfarm Employment Change at 15:15;
  • – Speech by the Federal Reserve System Chairman Powell at 17:00;
  • – US crude oil stocks at 17:30.

by JustForex


This article reflects a personal opinion and should not be interpreted as an investment advice, and/or offer, and/or a persistent request for carrying out financial transactions, and/or a guarantee, and/or a forecast of future events.

US Senators Make Stimulus Progress

By Orbex

No End in Sight for Dollar Freefall

The US index fell 0.78% lower on Tuesday as it traded at its lowest level since April 2018.

Traders continued the sell-off amongst the dollar as risk aversion came into play. Yesterday, a bipartisan group of senators proposed a $908 billion spending package that will help cushion the economy before Biden becomes president.

In addition, ISM manufacturing numbers saw a decline from last month. Although an expansion occurred, struggles with worker absenteeism and temporary plant closures weighed heavily on the dollar.

Euro Soars To 2-Year High

The euro surged over 1% yesterday as it broke through the 1.20 ceiling.

Weakness in the US dollar was part of the catalyst for the jump, as well as policymakers being expected to announce additional monetary easing measures in the next Central Bank meeting.

Could we see 1.21 before the week is out?

Brexit Talks Enter Home Straight

The pound broke the 1.34 handle and ended yesterday’s session 0.74% higher.

Brexit negotiations entered another stage as hopes remained that an agreement would be made by the end of the week.

Though there are no guarantees, it shows a strong willingness from both sides to get to reach a compromise.

We have heard this all before, however. And with the deadline vastly approaching, something will have to give.

Stocks Rally as Investors Turn

The S&P and Nasdaq closed at record highs on Tuesday, as investors bet that a vaccine will drive an economic rebound.

Testimony regarding coronavirus figures from Jerome Powell did little to quash the bullish sentiment, as possible further stimulus fueled the rally.

Optimism toward vaccine rollouts continues to move investor cash to communications, financial, and tech stocks.

Gold Rallies Back Above $1800

Risk sentiment saw investors return to the metal market, as gold closed over 2% higher yesterday.

The biggest jump in over a month saw the yellow metal move past the $1800 handle, as the greenback was licking its wounds.

However, with stimulus talks coming and going before Biden’s inauguration, is this just a temporary jump?

OPEC Weighs in on WTI

Oil closed 1.3% lower yesterday as OPEC failed to agree on production cuts.

Meeting are planned later in the week to allow more time to deliberate on the precarious subject.

Added to this, the API reported a crude build of inventories for the past week, leading the black gold to fall through the $45 handle.

By Orbex

GBPUSD Attempts To Break The Trend Line

By Orbex

gbpusd

The British pound sterling is posting strong gains on the back of a weaker dollar. After price action consolidated above the 1.3300 level, the cable is attempting to push higher.

For the moment, prices are stuck near the trend line. As long as the trend line holds as resistance, we could see the sideways consolidation to continue.

However, in the event of a breakout off the trend line, then the GBPUSD will be aiming for the 1.3500 level next.

For the moment, with the support level firmly established at 1.3300, the GBPUSD will be looking to make further gains to the upside.

By Orbex

Asian stocks taking a break amid broader rally

By Han Tan, Market Analyst, ForexTime

Asian equities are edging lower on Wednesday, unable to keep pace with the new record highs posted by the S&P 500 and the Nasdaq 100 indices overnight. At the time of writing, Japan’s Nikkei 225 are among the regional bourses that are dipping into the red.

For context, the MSCI Asia Pacific index, which measures the overall performance of regional equities, had posted its highest ever closing price on November 27th. November’s advance of 10.18 percent was its largest monthly gain since May 2009. The current pause is likely to be temporary before resuming its search for a new record high.

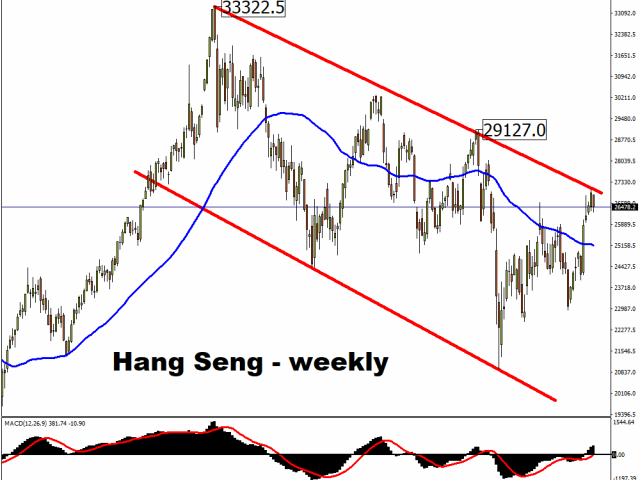
The Hang Seng index may have to rely on technical factors to stick to this upward climb from recent months. The HSI50 has formed a “golden cross”, whereby its 50-day simple moving average (SMA) has crossed above its 100-day counterpart. Such a technical event typically heralds more near-term gains.

And with its 14-day relative strength index having pulled away from the 70 mark, which denotes overbought levels, the index has enough headroom to climb higher over the immediate future.

However, these two moving averages have already crisscrossed on multiple occasions in what has been a tumultuous year for the index. Noting that the momentum has started to trend downwards on the daily chart, the Hang Seng has a lot more work to do before it can erase the 5.9 percent year-to-date decline it still holds, with just a few weeks of trading left before 2020 is over. Also, it still remains a long, long way off from its record high. The index needs to break above January’s 29,127 mark and post a higher-high before it can break out of the downtrend that has remained intact since 2018.


The broader rally in global equities is also taking a breather, with US equity futures also slipping.


Overall, the reasons to remain in risk-on mode remains intact.

There are several companies that are taking major strides towards developing their respective Covid-19 vaccines for the world. The US Congress is still trying to bring more financial support for the world’s largest economy, even as they prepare to transition to a new US President. The global economy is making strides to move into the post-pandemic era, led by China’s resounding recovery, as further evidenced by its better-than-expected November PMIs that were released over the past two days, with the Caixin China PMI services and composite readings due tomorrow. And with global central bankers at the ready to ensure their full support for their respective economies and to uphold orderly functioning of the financial markets, equity markets have a truly condusive environment to explore more of their upside, barring any negative shocks.

In short, as far as risk assets are concerned, all signs point to a joyous ending to what has been a truly unforgettable year.


Disclaimer: The content in this article comprises personal opinions and should not be construed as containing personal and/or other investment advice and/or an offer of and/or solicitation for any transactions in financial instruments and/or a guarantee and/or prediction of future performance. ForexTime (FXTM), its affiliates, agents, directors, officers or employees do not guarantee the accuracy, validity, timeliness or completeness, of any information or data made available and assume no liability as to any loss arising from any investment based on the same.


Forex-Time-LogoArticle by ForexTime

ForexTime Ltd (FXTM) is an award winning international online forex broker regulated by CySEC 185/12 www.forextime.com

WTI Crude Oil Losing The 45.00 Handle

By Orbex

wti crude oil

Oil prices are trading weaker on Tuesday. The declines come despite the US dollar taking a strong hit.

The move to the downside comes after oil prices failed to make any big moves to the upside.

As a result, WTI crude oil was consolidating around the 45.00 level for a considerable period of time.

After losing this handle, oil prices are likely to push lower. The next key support is near the 43.50 level.

However, we expect the pullback to see prices retracing the 45.00 handle.

If resistance is firmly established here, then we could expect to see further declines down to the 43.50 level.

By Orbex

U.K. approves Pfizer COVID-19 vaccine

By Lukman Otunuga, Research Analyst, ForexTime

The United Kingdom has become the first country in the world to approve the Pfizer/BioNtech Covid-19 vaccine!

This emergency authorization marks a historic moment and clears the way for the deployment of a vaccine that is expected to play a critical role in halting the coronavirus outbreak. Given how the vaccine will be available in Britain from next week, this opens the way for mass immunisation and raises the prospects of the European Union and the United States making a similar move.

Such encouraging news is poised to elevate global risk sentiment as investors become increasingly optimistic over the vaccine speeding up the pace of economic recovery. Equity bulls may be injected with a renewed sense of confidence amid the good news while safe-havens like the Dollar, Japanese Yen and Gold are positioned to weaken.

Battered Dollar gets no love

The Dollar descended deeper into the abyss on Tuesday evening as cautious optimism that the United States will revive stimulus talks fuelled risk appetite. News that the United Kingdom has approved Pfizer’s Covid-19 vaccine weakened the currency further.

Over the past few weeks, there was no love for the Dollar thanks to positive vaccine news, mixed economic data and surging coronavirus cases in the United States. The latest developments regarding U.S Treasury Secretary Steve Mnuchin and House of Representatives Speaker Nancy Pelosi holding fresh stimulus talks have offered some light at the end of the long tunnel. However, markets remain skeptical whether these talks will open the doors to more stimulus, since investors were already left empty handed before the presidential election. Nevertheless, the idea of the United States unleashing further stimulus in 2021 to support the economy has dragged the Dollar Index (DXY) to levels not seen since late April 2018.

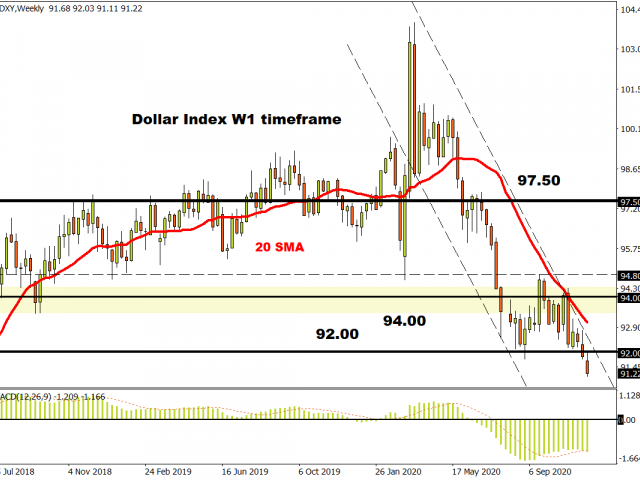
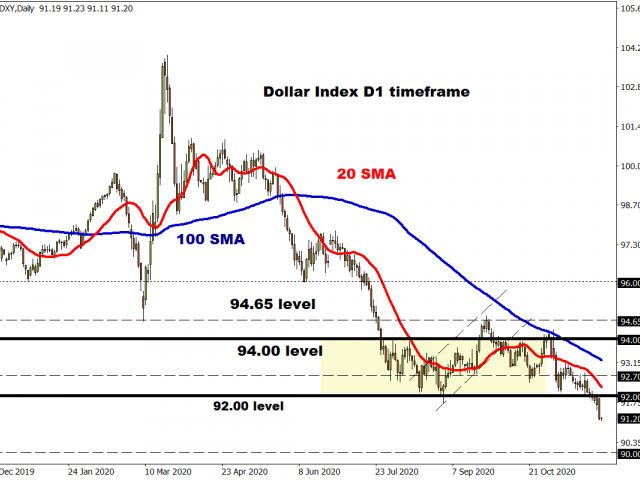
The outlook for the Dollar Index remains bearish as the fundamentals and technical align. After experiencing its worst month in November since July, the Dollar has entered December under intense pressure.  Looking at the technical picture, prices have tumbled roughly 0.7% since the start of December and almost 3% this quarter. The DXY is trading around 91.19 as of writing with bears eyeing the 91.00 support level. A solid breakdown below this point could open a path towards 90.00. Alternatively, prices may experience a technical bounce back towards the 92.00 resistance before bears jump back into the game. This bearish setup becomes invalidated once a weekly close above 92.00 is achieved.

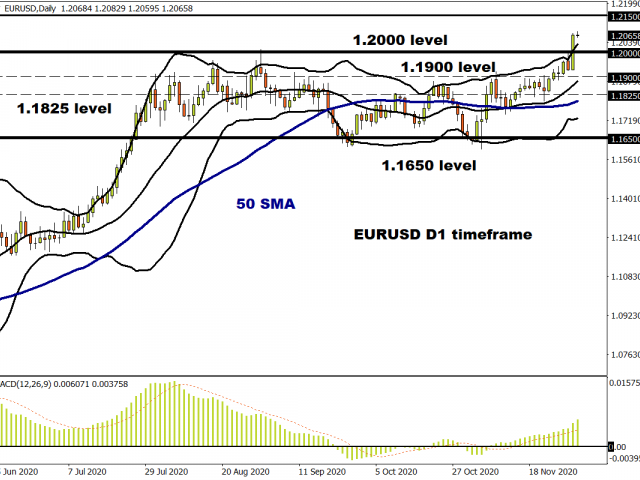
EURUSD blasts above 1.2000

In our FX Week Ahead report on Monday, we discussed the possibility of the EURUSD breaking above the 1.2000 psychological resistance level.

The solid breakout and daily close above this key resistance are likely to signal a move towards levels not seen since April 2018 above 1.2150. Should Dollar weakness remain a key theme in December, this may inject Euro bulls with enough inspiration to challenge prices beyond 1.2150. Although the outlook points north, a move back below 1.2000 could signal a decline back towards 1.1900.

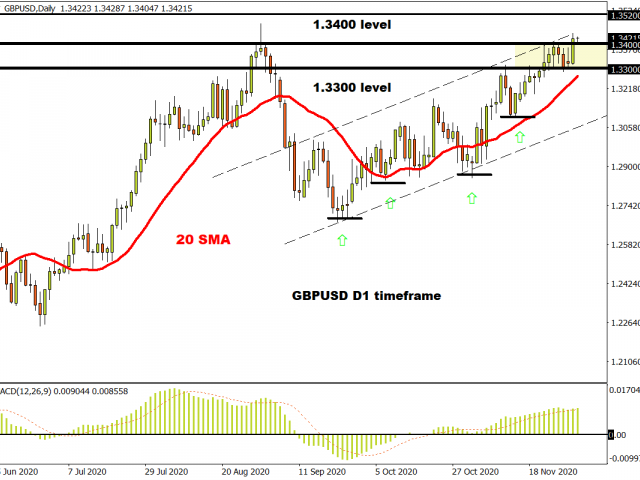
GBPUSD secures daily close above 1.3400

It’s not only the Euro that has welcomed a weaker Dollar. The GBPUSD jumped over 100 pips on Tuesday to close above 1.3400. While prices could push higher in the near term, the medium to longer term outlook remains heavily influenced by Brexit. As the clock ticks closer to the official Brexit transition deadline on the 31st of December, the GBPUSD is likely to turn volatile and sensitive. Focusing on the near-term outlook, the upside momentum may drive prices towards 1.3520

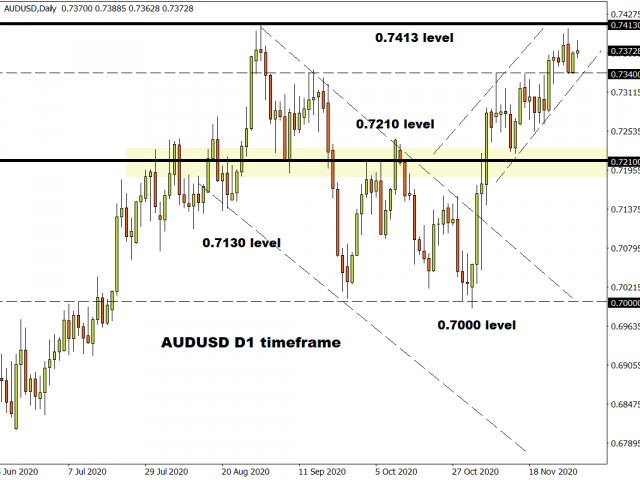
AUDUSD find support above 0.7340

Expect the AUDUSD to push higher if the Dollar continues to weaken. Such a development could open the doors towards 0.7413.

Should 0.7340 prove to be unreliable support, the AUDUSD may decline back towards 0.7250.

Disclaimer: The content in this article comprises personal opinions and should not be construed as containing personal and/or other investment advice and/or an offer of and/or solicitation for any transactions in financial instruments and/or a guarantee and/or prediction of future performance. ForexTime (FXTM), its affiliates, agents, directors, officers or employees do not guarantee the accuracy, validity, timeliness or completeness, of any information or data made available and assume no liability as to any loss arising from any investment based on the same.


Forex-Time-LogoArticle by ForexTime

ForexTime Ltd (FXTM) is an award winning international online forex broker regulated by CySEC 185/12 www.forextime.com

Platinum Begins A New Rally – Gold & Silver Will Follow

By TheTechnicalTraders 

– My researcher team and I have highlighted a number of recent articles about Gold and Silver and how we believed the longer-term price activity and technical analysis supported a broad market advance in Precious Metals over the next 5+ years.  If not, check out Part I and Part II of our recent Gold and Silver research and price predictions.

Today, we are seeing further evidence that metals are on the move – in Platinum. Platinum has been trading below $1000 for quite a while and this is roughly HALF the price level of Gold.  Typically, Platinum rallies before Gold rallies in a traditional trending phase.  Platinum rallies because it is used in industrial and other fields – thus it rallies in an advanced market rally phase.  Gold begins to rally when a certain level of fear enters the markets or the markets enter a depreciation phase.

Currently, we are watching Platinum rally above $1000 for the first time since August 2020 and it appears new all-time highs in Platinum are on the horizon.  This suggests Gold and Silver will follow this upward trend in another rally phase and attempt to set new all-time highs as well.

DAILY PLATINUM BREAKOUT PENDING

This Daily Platinum chart highlights the Rounded Bottom formation that setup between September and November 2020 after the August highs peaked out near $1020.  The recent rally in Platinum has begun to accelerate and we believe an upside breakout move is pending.  This may prompt Platinum to rally above $1250 or more over the next few weeks/months.

THE WEEKLY PLATINUM CHART

This Weekly Platinum Chart highlights the broader market trend in Platinum and the resistance level (RED LINE) that is currently about to be broken.  Once this resistance level is breached, a bigger upside move may begin where Platinum may target $1250 or higher fairly quickly.

As you can see from We believe this move in precious metals aligns with our previous research that a broader market Depreciation phase has set up in the global markets.  We believe precious metals are about 24 months into a 100+ month broad market depreciation cycle.  This means that we may see a rally in metals that lasts for several more years.

As many of you may already know, we love the metals and we love to apply our technical analysis skills and pattern research onto these charts.  Could you imagine the scope of the rally that is setting up in Platinum mirrors the 2003 to 2010 price rally – just waiting for this breakout pattern to complete?

Get ready because this could be one of the biggest upside price moves in precious metals in over a decade.   Sign up now to get a pre-market video every day before the opening bell that walks you through the charts and my proprietary technical analysis of all of the major assets classes. You will also receive my easy-to-follow ETF swing trades that always include an entry price, a stop, two exit targets, as well as a recommended position sizing.

Our signals can help you preserve and even grow your long term capital. If you have any type of long-term or buy-and-hold account and are looking for signals as to when to own equities, bonds, or cash, be sure to become a member of my Long-Term ETF Investing Signals, which includes a weekly market update and trade alerts to catch big market rotations.

Chris Vermeulen
Chief Market Strategist
www.TheTechnicalTraders.com

NOTICE AND DISCLAIMER: Our free research does not constitute a trade recommendation or solicitation for readers to take any action regarding this research.  We are not registered financial advisors and provide our research for educational and informational purposes only. Read our FULL DISCLAIMER here.


Ichimoku Cloud Analysis 01.12.2020 (BTCUSD, USDCAD, GOLD)

Article By RoboForex.com

BTCUSD, “Bitcoin vs US Dollar”

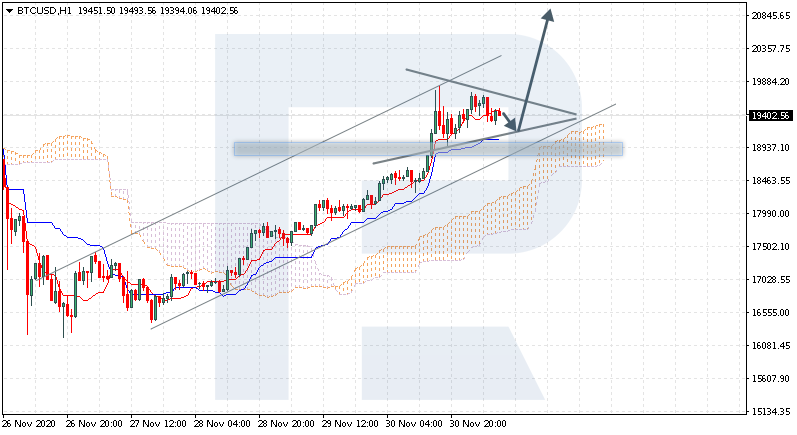
BTCUSD is trading at 19,402 above the Ichimoku Cloud, suggesting an uptrend. A test of the signal lines of the indicator at 19,205 is expected, followed by growth to 20,845. An additional signal confirming the growth will be a bounce off the lower border of the Triangle pattern. The growth will be canceled in the case of a breakaway of the lower border of the Cloud and securing under 17,475, which will mean further decline to 16,705. The growth will be confirmed by a breakaway of the upper border of the Triangle and securing above 19,885.

BTCUSD
Risk Warning: the result of previous trading operations do not guarantee the same results in the future

USDCAD, “US Dollar vs Canadian Dollar”

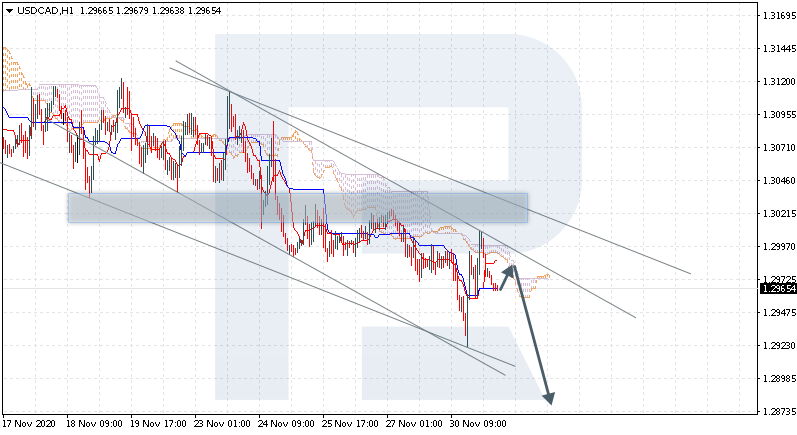
USDCAD is trading at 1.2965 under the Ichimoku Cloud, indicating a downtrend. A test of the upper border of the Cloud near 1.2985 is expected, followed by falling to 1.2875. An additional signal confirming the falling will be a bounce off the upper border of the descending channel. The decline will be canceled in the case of a breakaway of the upper border of the Cloud and securing above 1.3005, which will mean further growth to 1.3095.

USDCAD
Risk Warning: the result of previous trading operations do not guarantee the same results in the future

XAUUSD, “Gold vs US Dollar”

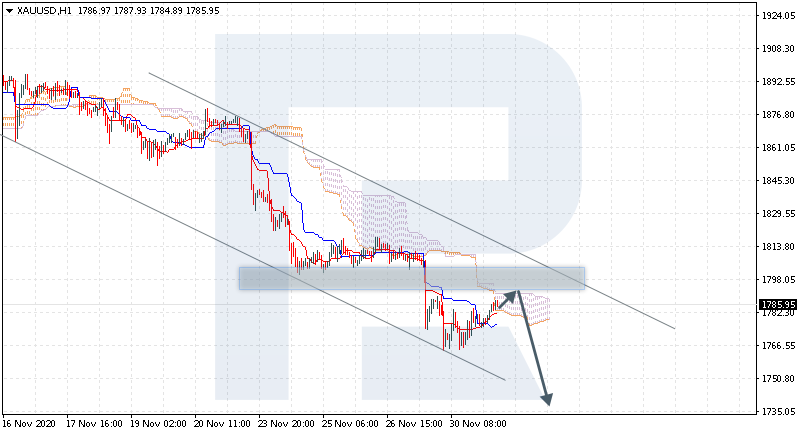
GOLD is trading at 1785 under the Ichimoku Cloud, indicating a downtrend. A test of the upper border of the Cloud near 1790 is expected, followed by falling to 1735. An additional signal confirming the falling will be a bounce off the resistance level. The decline will be canceled in the case of a breakaway of the upper border of the Cloud and securing above 1805, which will mean further growth to 1845.

XAUUSD

Article By RoboForex.com

Attention!
Forecasts presented in this section only reflect the author’s private opinion and should not be considered as guidance for trading. RoboForex LP bears no responsibility for trading results based on trading recommendations described in these analytical reviews.