By InvestMacro

Here are the latest charts and statistics for the Commitment of Traders (COT) data published by the Commodities Futures Trading Commission (CFTC).
The latest COT data is updated through Tuesday April 8th and shows a quick view of how large traders (for-profit speculators and commercial entities) were positioned in the futures markets.
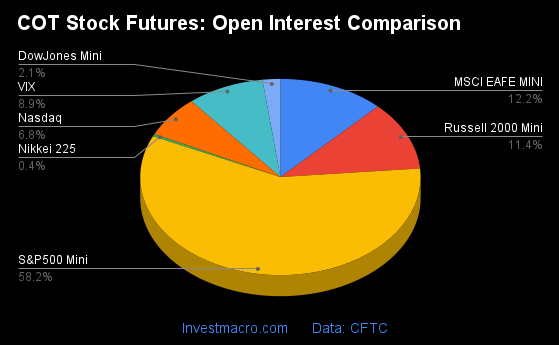
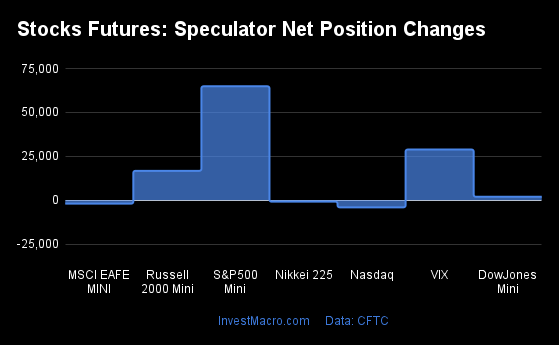
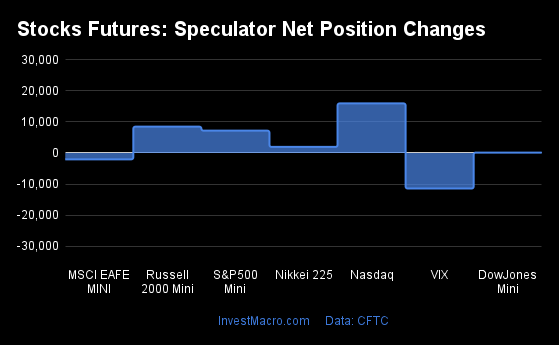
Weekly Speculator Changes led by Nasdaq, Russell & DowJones

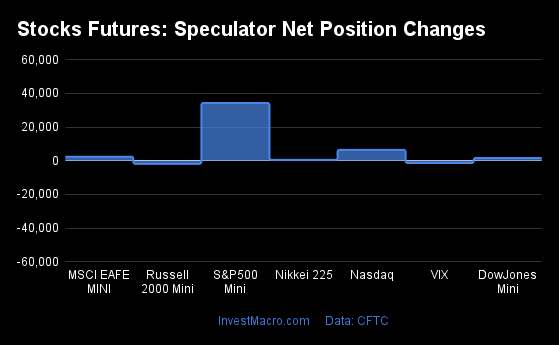
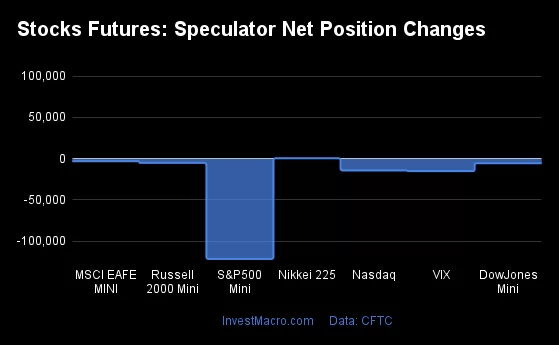
The COT stock markets speculator bets were overall higher this week as five out of the seven stock markets we cover had higher positioning while the other two markets had lower speculator contracts.
Leading the gains for the stock markets was the Nasdaq-Mini (9,086 contracts) with the Russell-Mini (4,426 contracts), the DowJones-Mini (3,924 contracts), the Nikkei 225 (2,025 contracts) and the MSCI EAFE-Mini (1,117 contracts) also showing positive weeks.
The market leading the declines in speculator bets this week was with the S&P500-Mini (-9,665 contracts) and with the VIX (-3,615 contracts) also registering lower bets on the week.
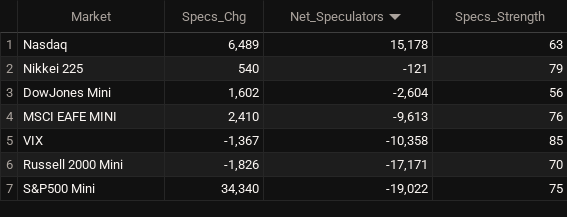
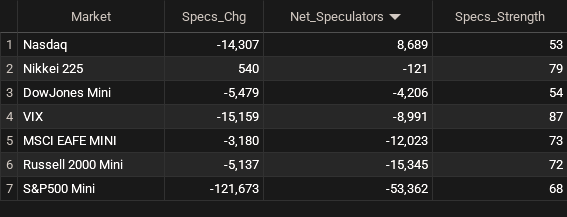
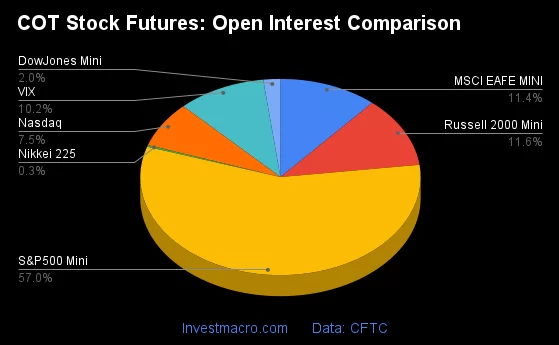
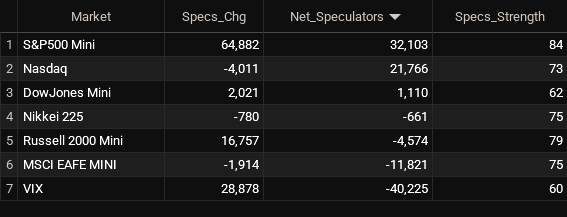
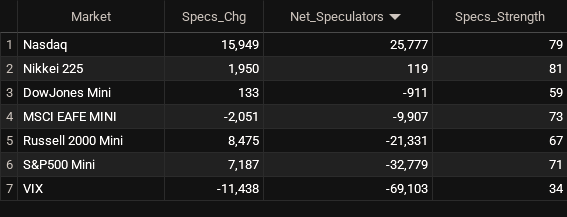
Stocks Data:
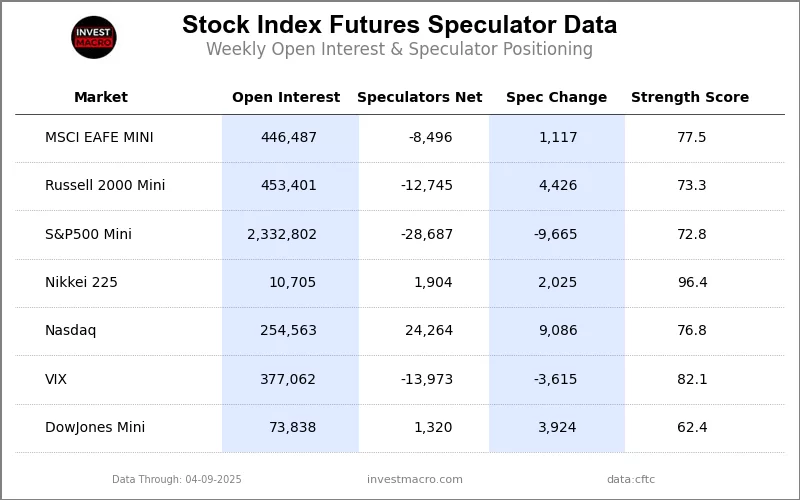
Legend: Open Interest | Weekly Speculators Change | Speculators Current Net Position | Strength Score compared to last 3-Years (0-100 range)
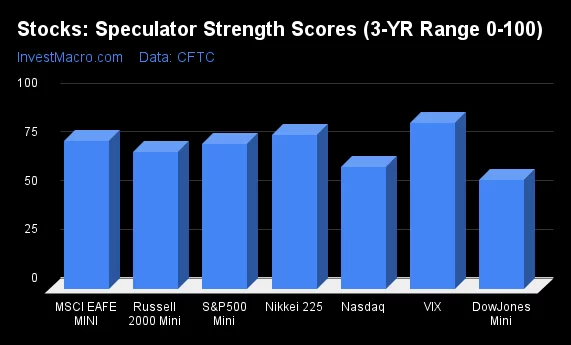
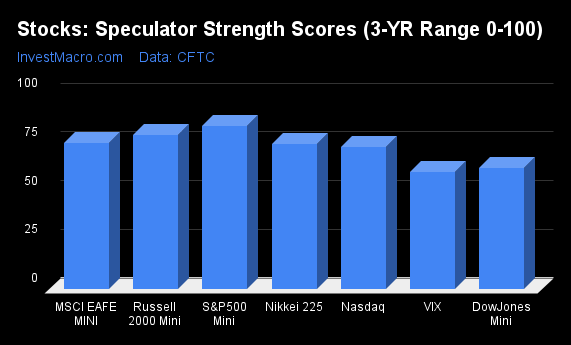
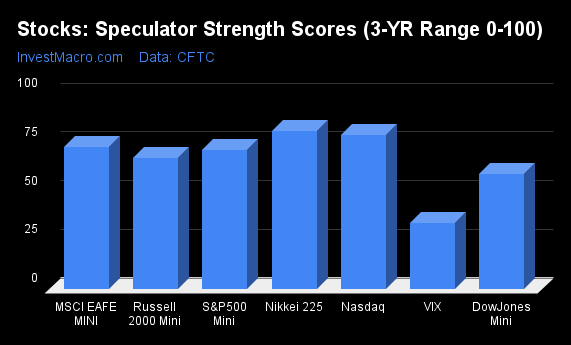
Strength Scores led by Nikkei 225 & VIX

COT Strength Scores (a normalized measure of Speculator positions over a 3-Year range, from 0 to 100 where above 80 is Extreme-Bullish and below 20 is Extreme-Bearish) showed that the Nikkei 225 (96 percent) and the VIX (82 percent) lead the stock markets this week. The MSCI EAFE-Mini (78 percent) and Nasdaq-Mini (77 percent) come in as the next highest in the weekly strength scores.
The DowJones-Mini (62 percent) comes in at the lowest strength level currently but is above 50 percent which is the mid-point for the past 3 years.
Strength Statistics:
VIX (82.1 percent) vs VIX previous week (85.3 percent)
S&P500-Mini (72.8 percent) vs S&P500-Mini previous week (74.5 percent)
DowJones-Mini (62.4 percent) vs DowJones-Mini previous week (56.1 percent)
Nasdaq-Mini (76.8 percent) vs Nasdaq-Mini previous week (62.7 percent)
Russell2000-Mini (73.3 percent) vs Russell2000-Mini previous week (70.3 percent)
Nikkei USD (96.4 percent) vs Nikkei USD previous week (79.1 percent)
EAFE-Mini (77.5 percent) vs EAFE-Mini previous week (76.0 percent)
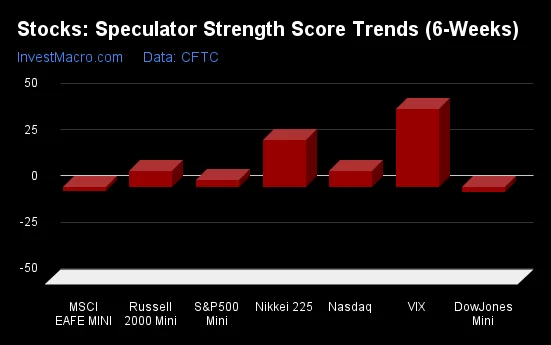
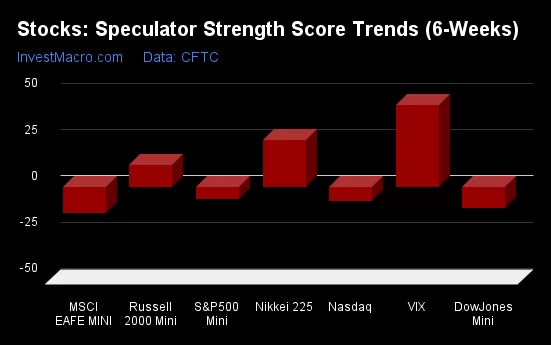
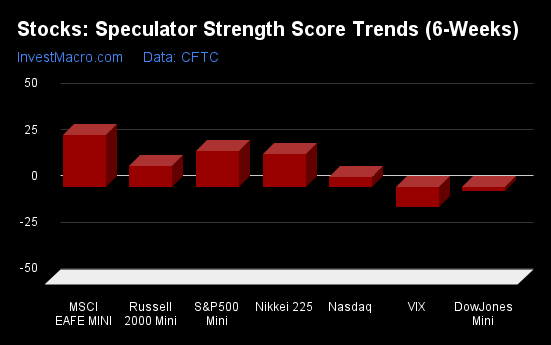
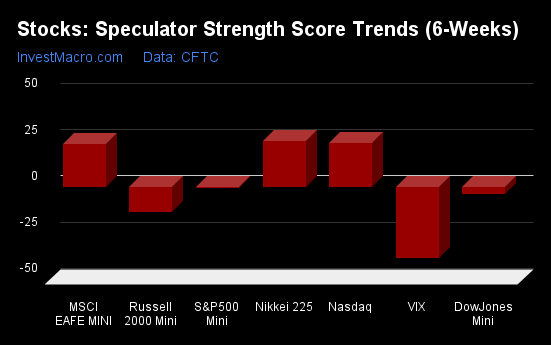
VIX & Nikkei 225 top the 6-Week Strength Trends
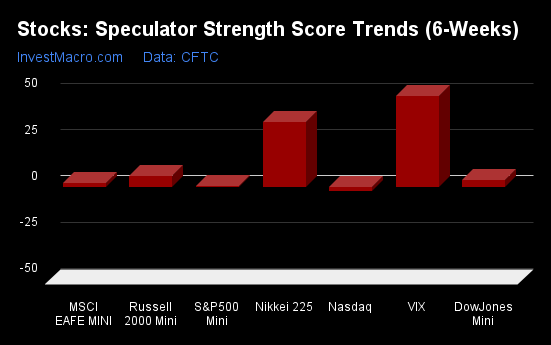
COT Strength Score Trends (or move index, calculates the 6-week changes in strength scores) showed that the VIX (49 percent) leads the past six weeks trends for the stock markets. The Nikkei 225 (35 percent) and the Russell-Mini (6 percent) are the next highest positive movers in the latest trends data.
The Nasdaq-Mini (-2 percent) is the only market with a lower trend score currently.
Strength Trend Statistics:
VIX (49.0 percent) vs VIX previous week (42.0 percent)
S&P500-Mini (0.7 percent) vs S&P500-Mini previous week (3.8 percent)
DowJones-Mini (3.6 percent) vs DowJones-Mini previous week (-2.5 percent)
Nasdaq-Mini (-2.3 percent) vs Nasdaq-Mini previous week (8.3 percent)
Russell2000-Mini (5.9 percent) vs Russell2000-Mini previous week (8.6 percent)
Nikkei USD (35.0 percent) vs Nikkei USD previous week (25.1 percent)
EAFE-Mini (2.0 percent) vs EAFE-Mini previous week (-2.4 percent)
Individual Stock Market Charts:
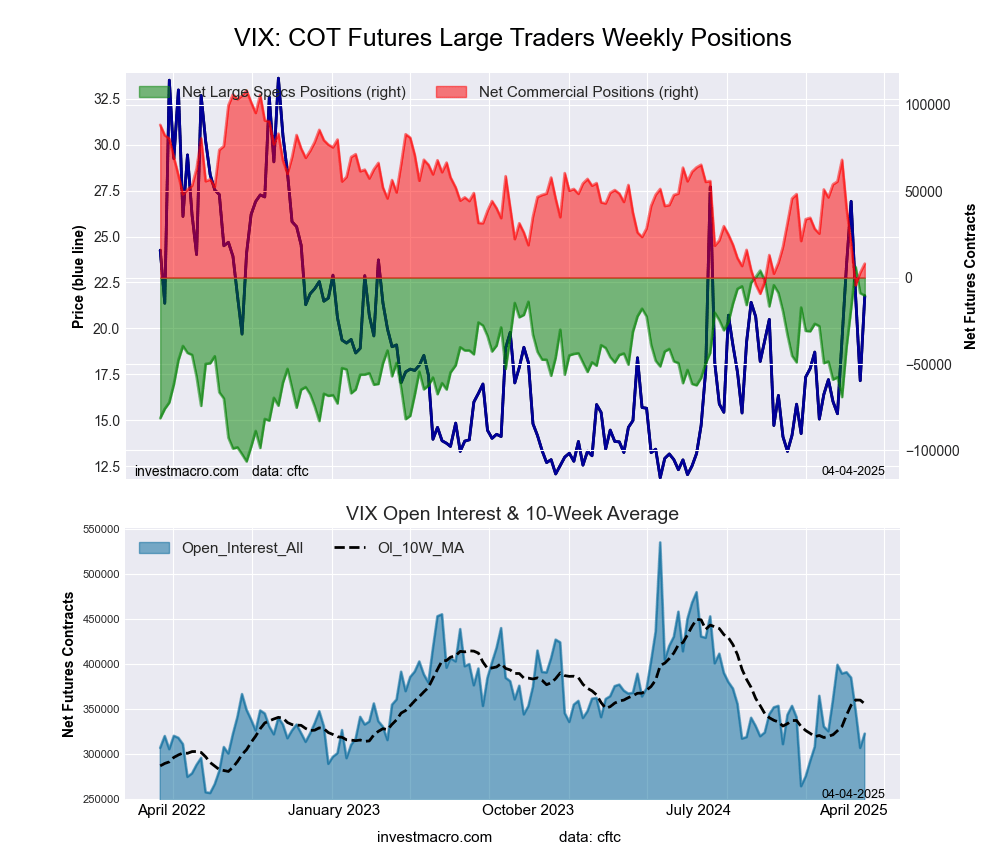
VIX Volatility Futures:
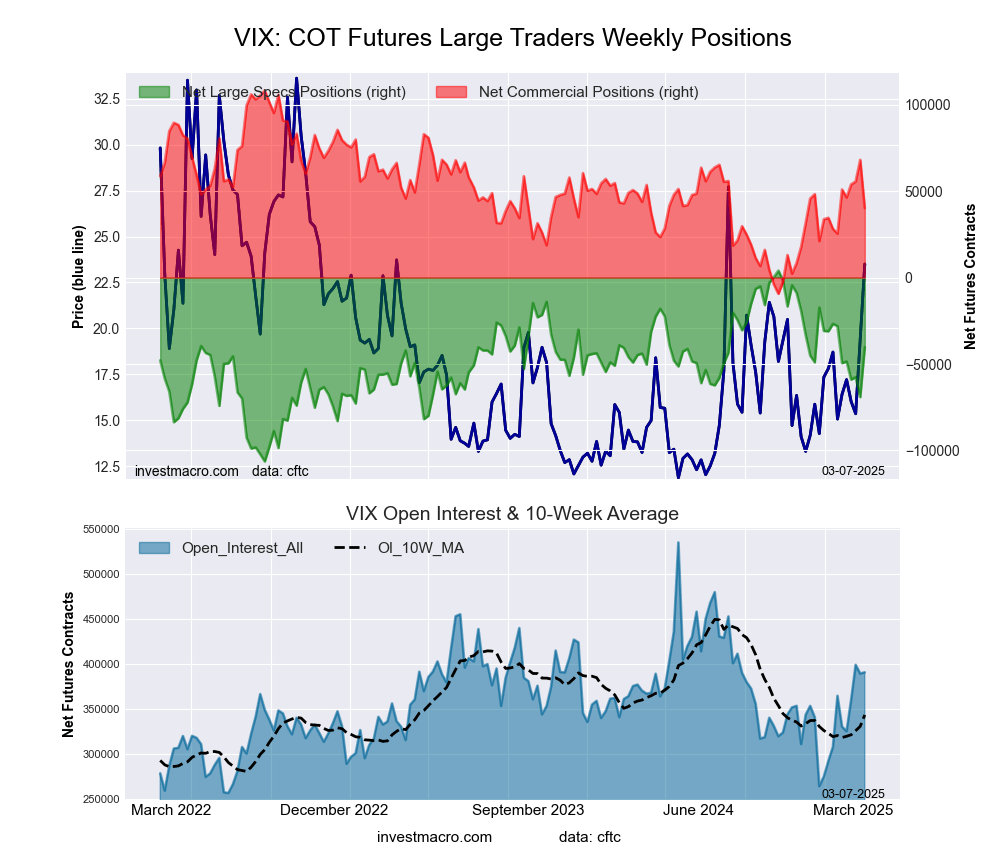
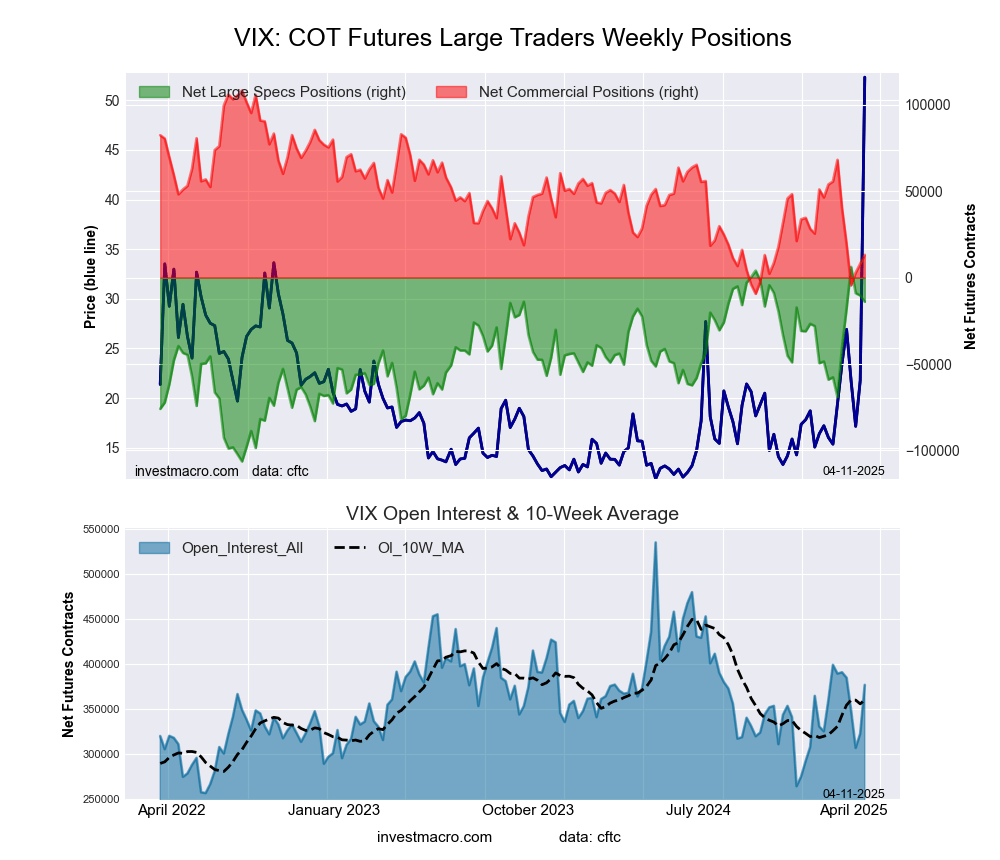 The VIX Volatility large speculator standing this week recorded a net position of -13,973 contracts in the data reported through Tuesday. This was a weekly fall of -3,615 contracts from the previous week which had a total of -10,358 net contracts.
This week’s current strength score (the trader positioning range over the past three years, measured from 0 to 100) shows the speculators are currently Bullish-Extreme with a score of 82.1 percent. The commercials are Bearish-Extreme with a score of 19.1 percent and the small traders (not shown in chart) are Bullish with a score of 71.2 percent.
Price Trend-Following Model: Strong Uptrend
Our weekly trend-following model classifies the current market price position as: Strong Uptrend.
| VIX Volatility Futures Statistics | SPECULATORS | COMMERCIALS | SMALL TRADERS |
| – Percent of Open Interest Longs: | 28.2 | 44.4 | 9.3 |
| – Percent of Open Interest Shorts: | 31.9 | 40.9 | 9.1 |
| – Net Position: | -13,973 | 13,134 | 839 |
| – Gross Longs: | 106,385 | 167,484 | 35,156 |
| – Gross Shorts: | 120,358 | 154,350 | 34,317 |
| – Long to Short Ratio: | 0.9 to 1 | 1.1 to 1 | 1.0 to 1 |
| NET POSITION TREND: | |||
| – Strength Index Score (3 Year Range Pct): | 82.1 | 19.1 | 71.2 |
| – Strength Index Reading (3 Year Range): | Bullish-Extreme | Bearish-Extreme | Bullish |
| NET POSITION MOVEMENT INDEX: | |||
| – 6-Week Change in Strength Index: | 49.0 | -46.8 | -0.9 |
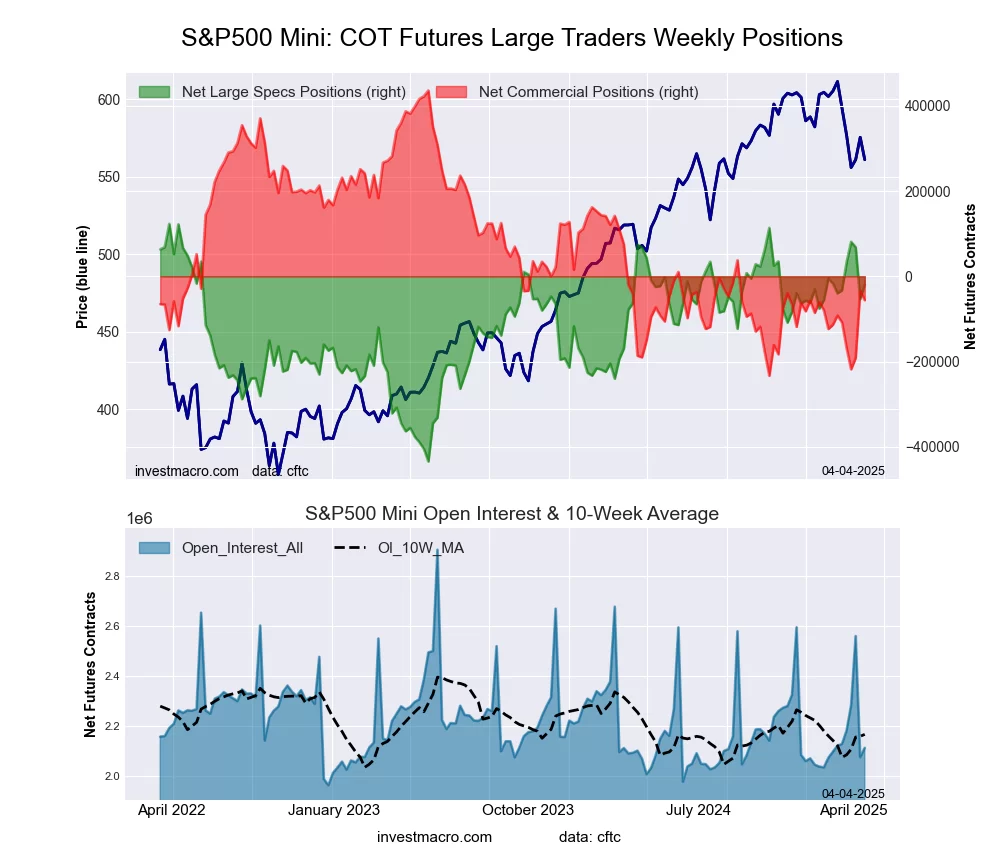
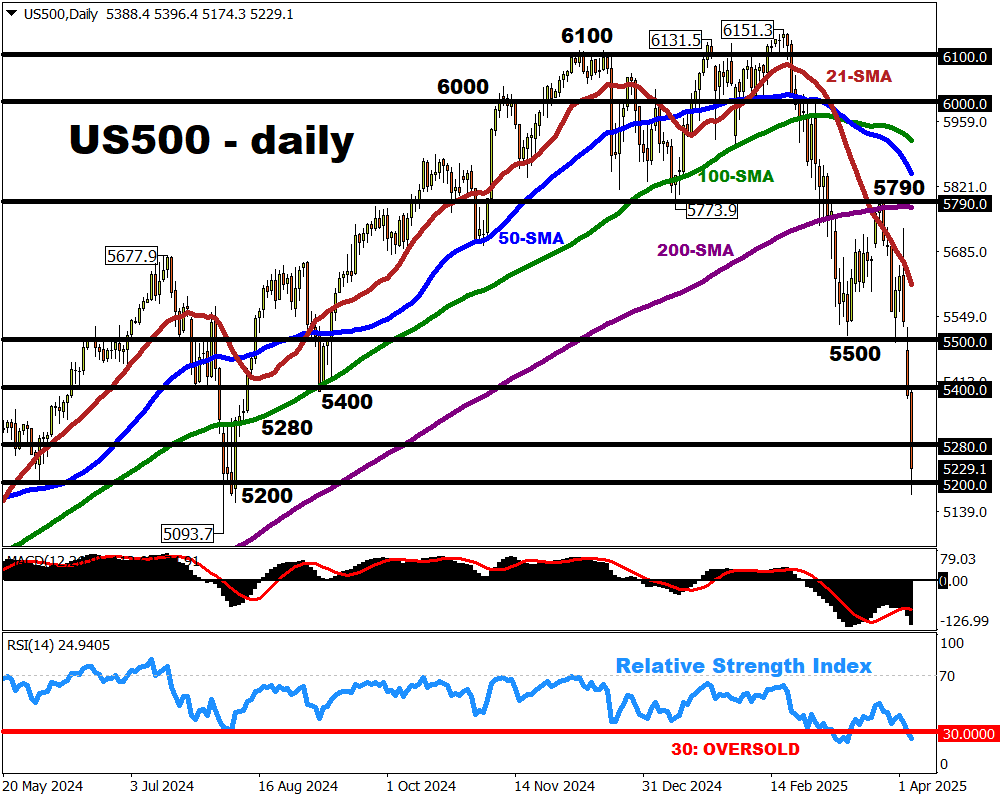
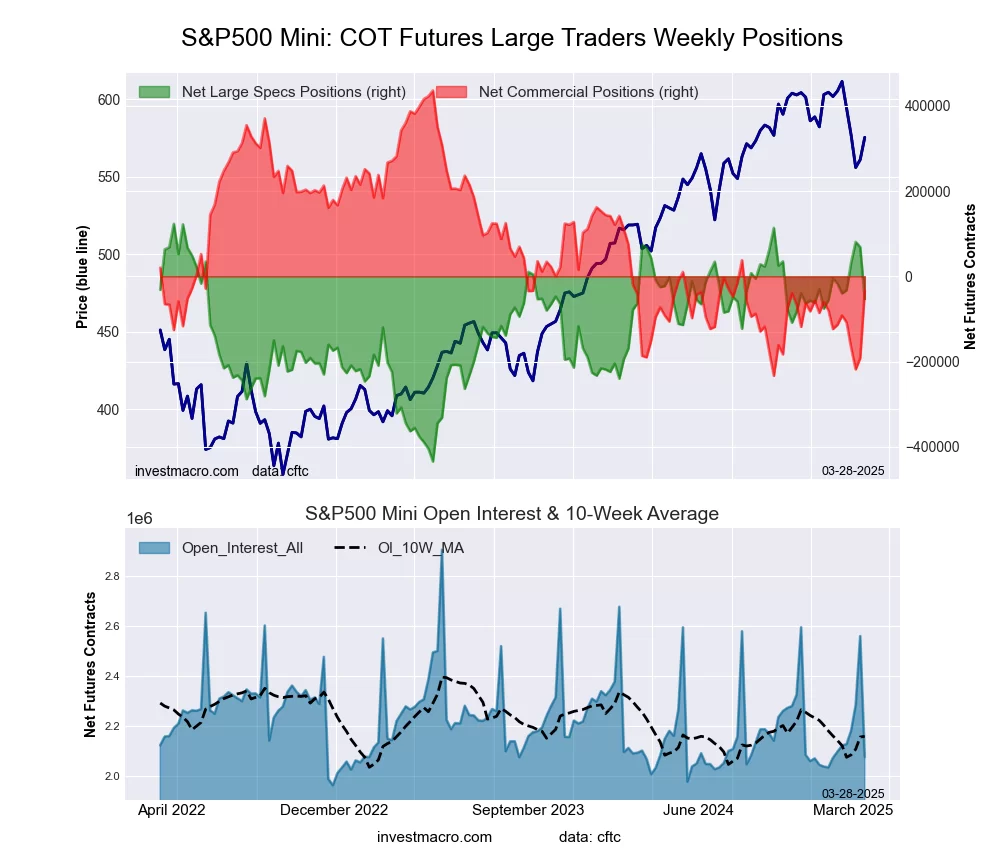
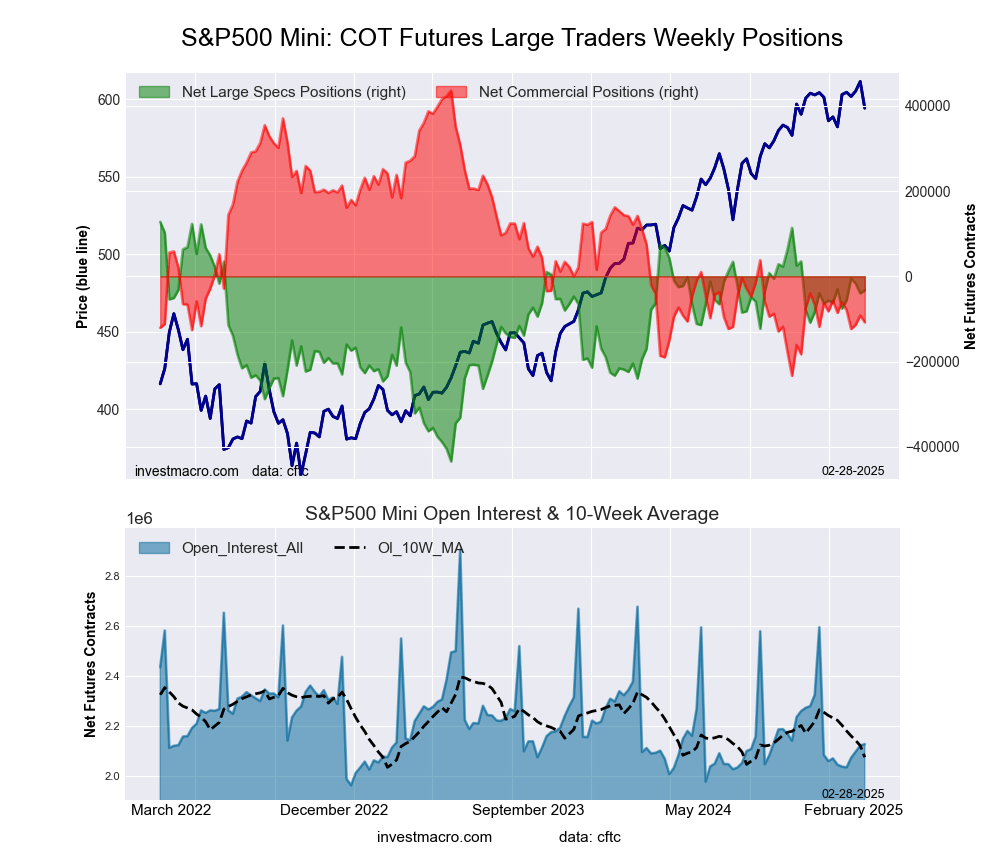
S&P500 Mini Futures:
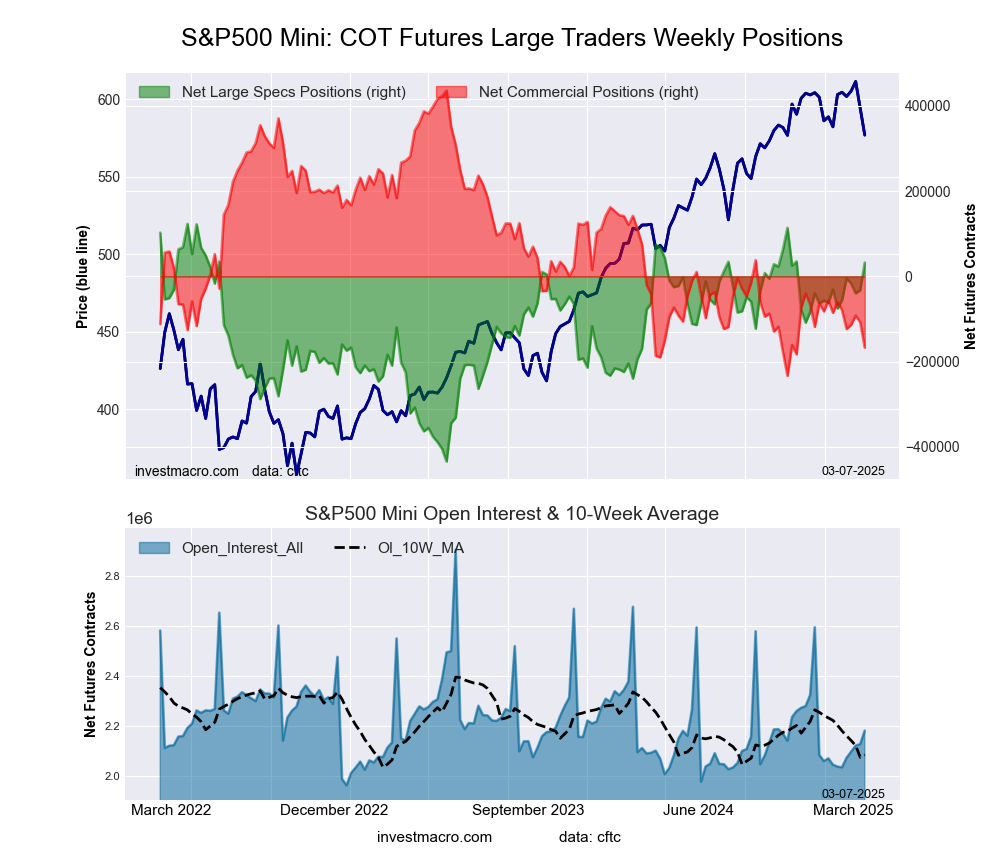
 The S&P500 Mini large speculator standing this week recorded a net position of -28,687 contracts in the data reported through Tuesday. This was a weekly fall of -9,665 contracts from the previous week which had a total of -19,022 net contracts.
This week’s current strength score (the trader positioning range over the past three years, measured from 0 to 100) shows the speculators are currently Bullish with a score of 72.8 percent. The commercials are Bearish with a score of 33.4 percent and the small traders (not shown in chart) are Bullish with a score of 52.6 percent.
Price Trend-Following Model: Strong Downtrend
Our weekly trend-following model classifies the current market price position as: Strong Downtrend.
| S&P500 Mini Futures Statistics | SPECULATORS | COMMERCIALS | SMALL TRADERS |
| – Percent of Open Interest Longs: | 13.8 | 71.9 | 10.8 |
| – Percent of Open Interest Shorts: | 15.0 | 72.3 | 9.2 |
| – Net Position: | -28,687 | -9,951 | 38,638 |
| – Gross Longs: | 321,451 | 1,677,831 | 252,928 |
| – Gross Shorts: | 350,138 | 1,687,782 | 214,290 |
| – Long to Short Ratio: | 0.9 to 1 | 1.0 to 1 | 1.2 to 1 |
| NET POSITION TREND: | |||
| – Strength Index Score (3 Year Range Pct): | 72.8 | 33.4 | 52.6 |
| – Strength Index Reading (3 Year Range): | Bullish | Bearish | Bullish |
| NET POSITION MOVEMENT INDEX: | |||
| – 6-Week Change in Strength Index: | 0.7 | 14.6 | -40.4 |
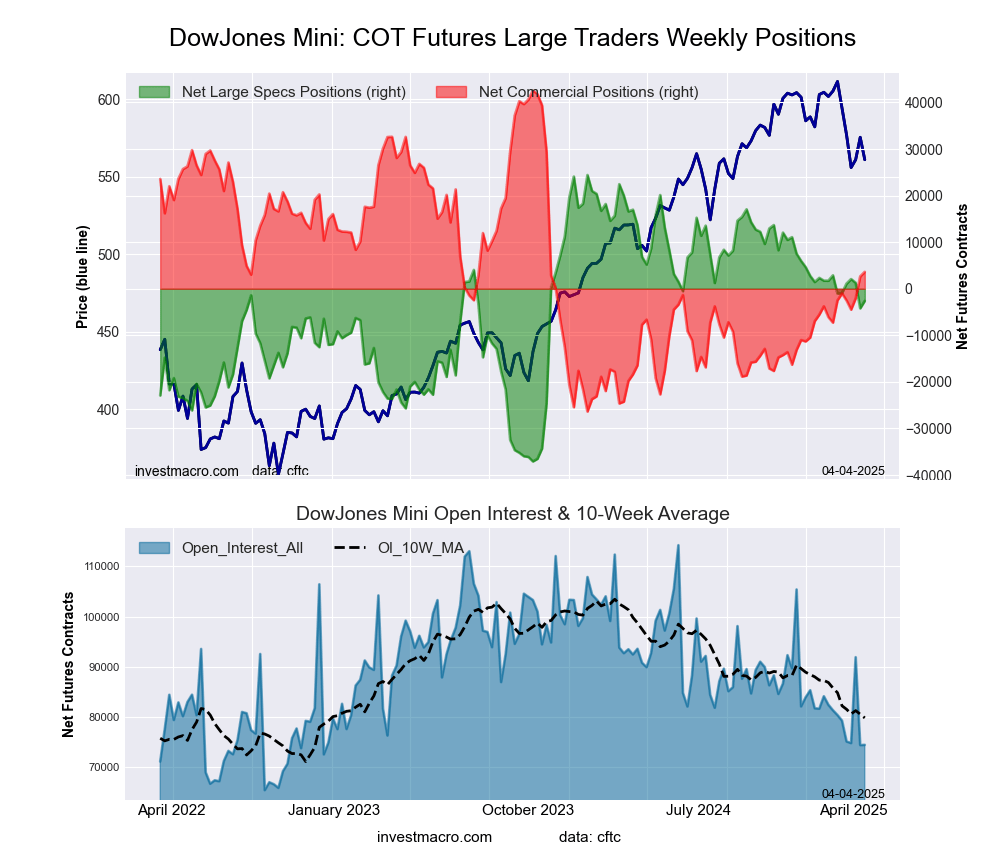
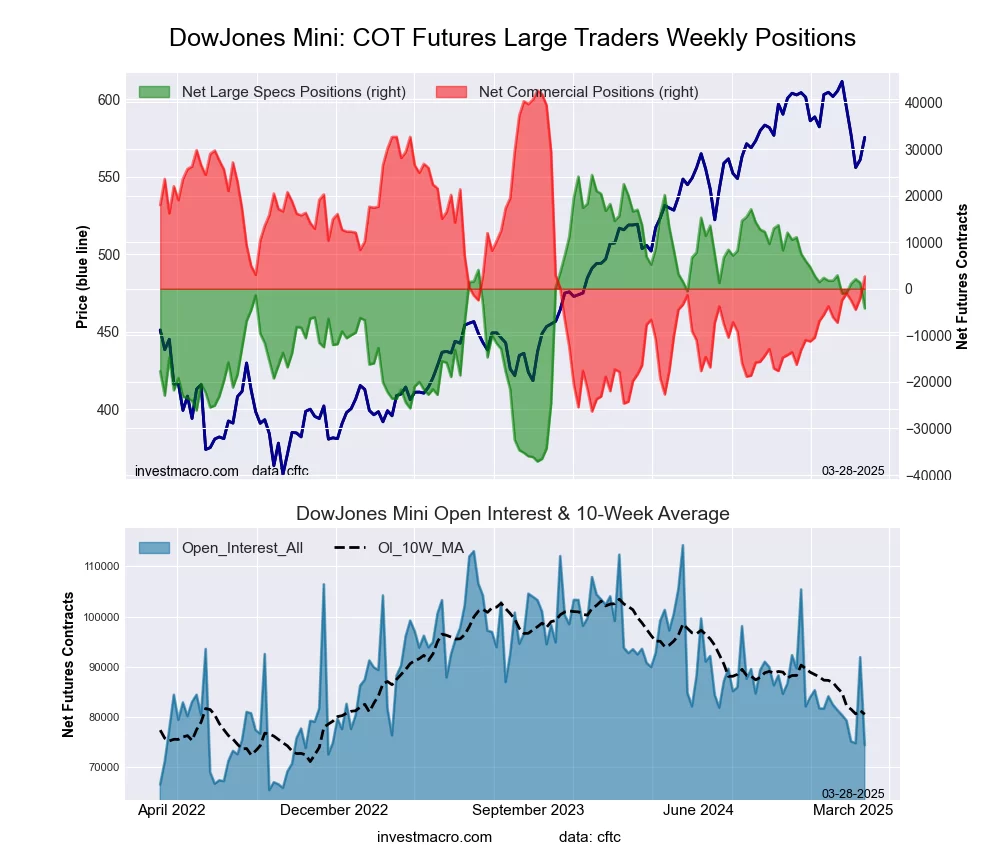
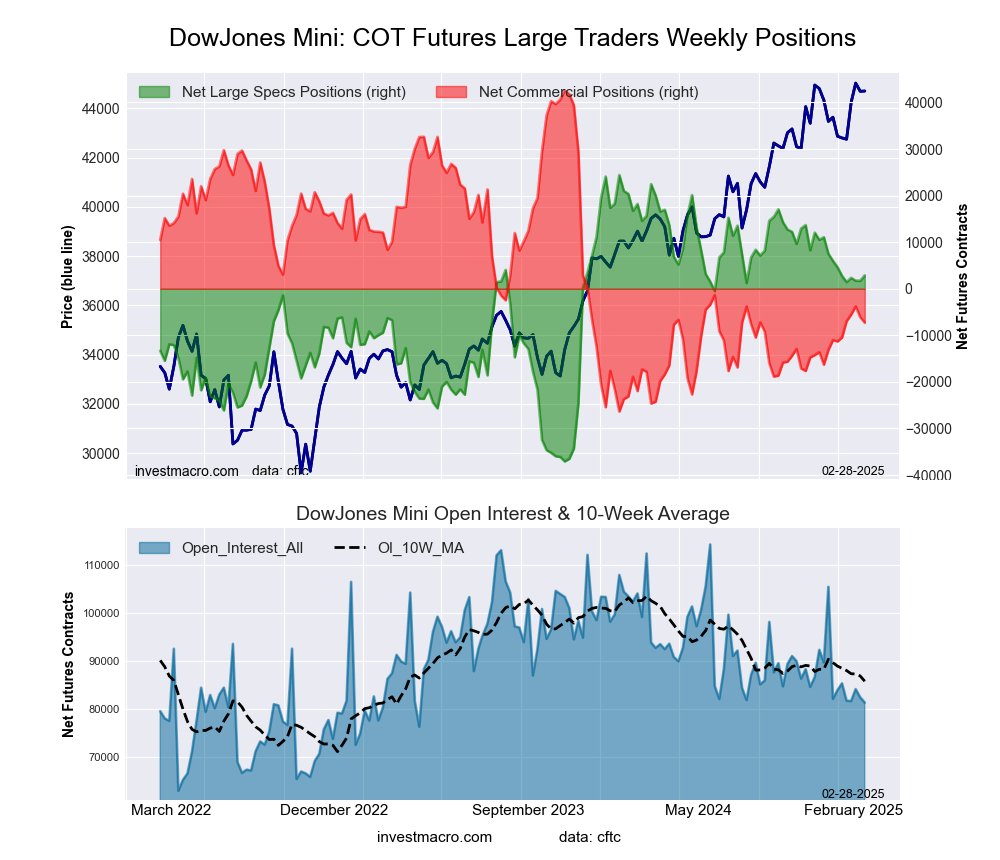
Dow Jones Mini Futures:
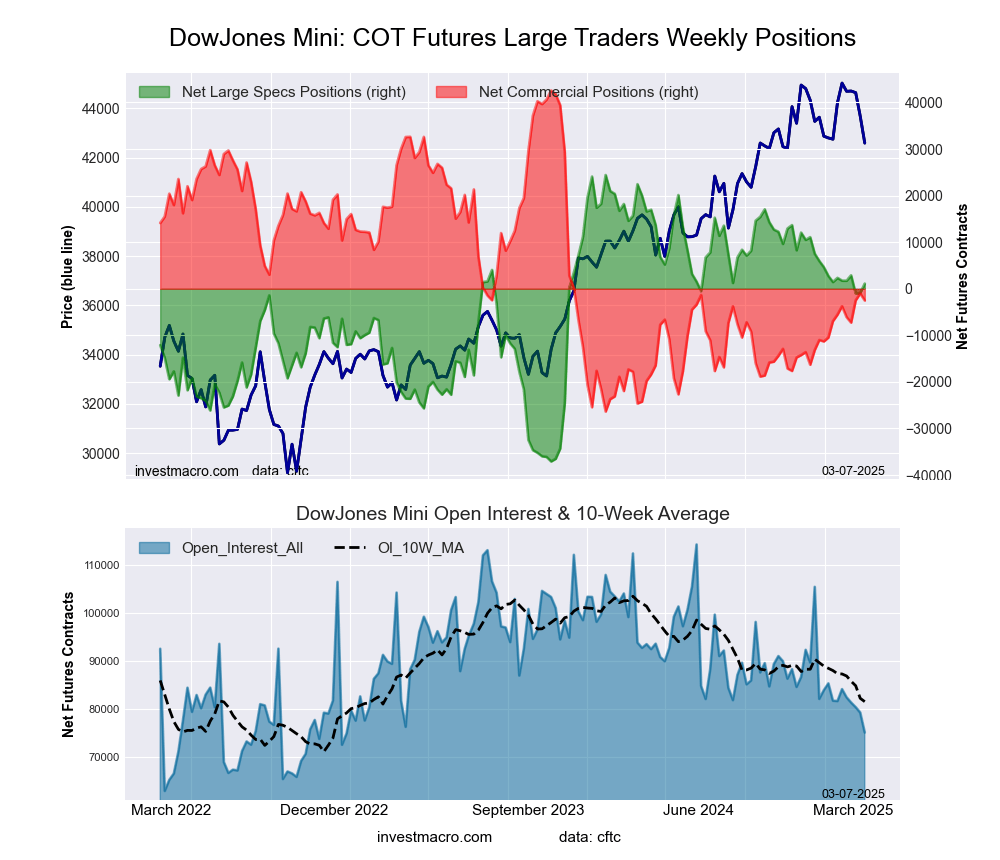
 The Dow Jones Mini large speculator standing this week recorded a net position of 1,320 contracts in the data reported through Tuesday. This was a weekly lift of 3,924 contracts from the previous week which had a total of -2,604 net contracts.
This week’s current strength score (the trader positioning range over the past three years, measured from 0 to 100) shows the speculators are currently Bullish with a score of 62.4 percent. The commercials are Bearish with a score of 38.8 percent and the small traders (not shown in chart) are Bearish with a score of 43.4 percent.
Price Trend-Following Model: Strong Downtrend
Our weekly trend-following model classifies the current market price position as: Strong Downtrend.
| Dow Jones Mini Futures Statistics | SPECULATORS | COMMERCIALS | SMALL TRADERS |
| – Percent of Open Interest Longs: | 12.4 | 65.8 | 12.5 |
| – Percent of Open Interest Shorts: | 10.7 | 65.2 | 14.8 |
| – Net Position: | 1,320 | 419 | -1,739 |
| – Gross Longs: | 9,192 | 48,549 | 9,211 |
| – Gross Shorts: | 7,872 | 48,130 | 10,950 |
| – Long to Short Ratio: | 1.2 to 1 | 1.0 to 1 | 0.8 to 1 |
| NET POSITION TREND: | |||
| – Strength Index Score (3 Year Range Pct): | 62.4 | 38.8 | 43.4 |
| – Strength Index Reading (3 Year Range): | Bullish | Bearish | Bearish |
| NET POSITION MOVEMENT INDEX: | |||
| – 6-Week Change in Strength Index: | 3.6 | 2.1 | -21.8 |
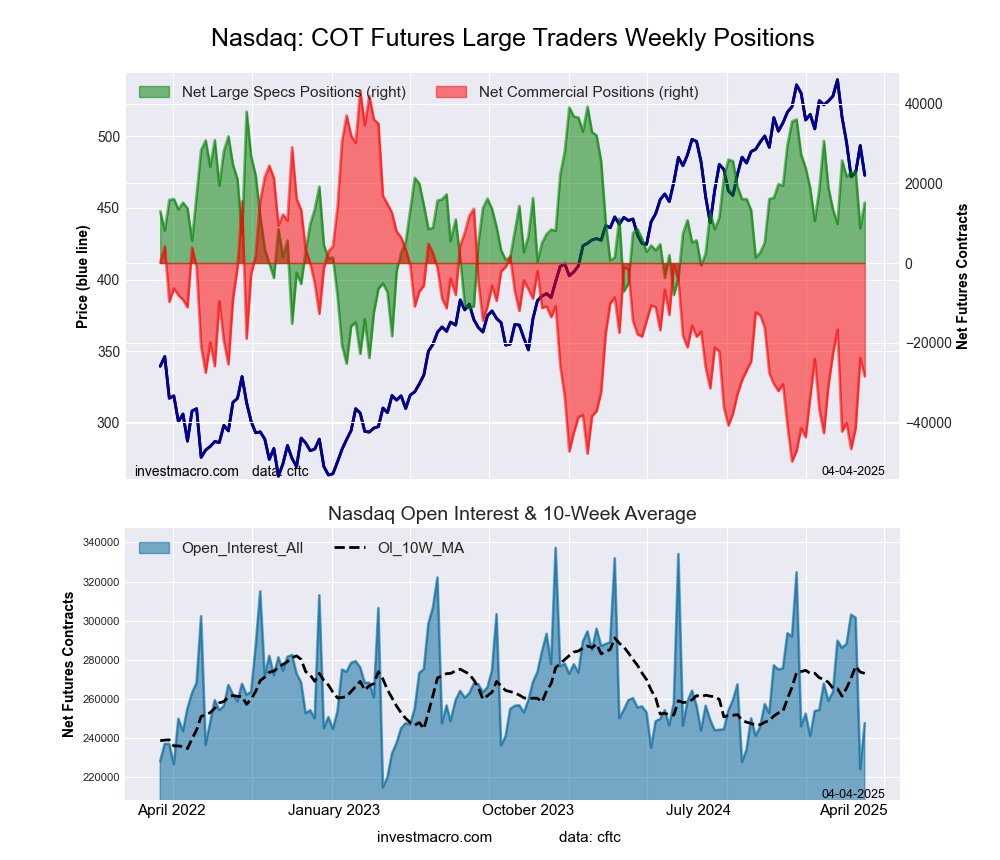
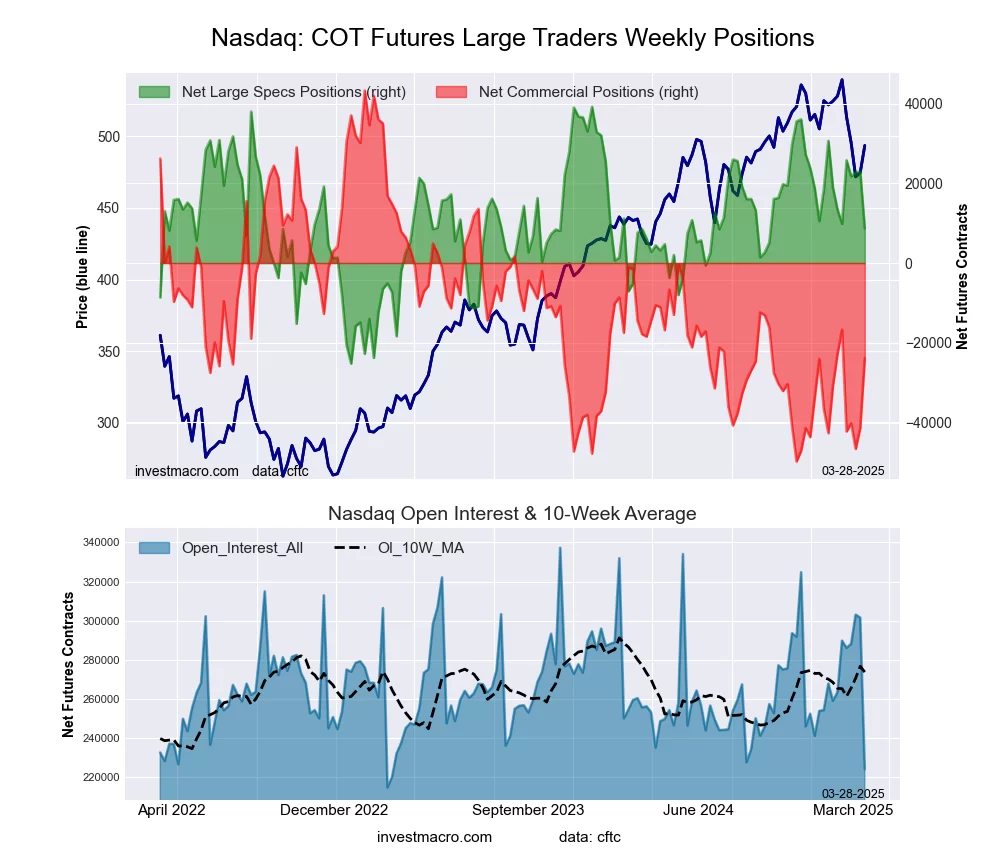
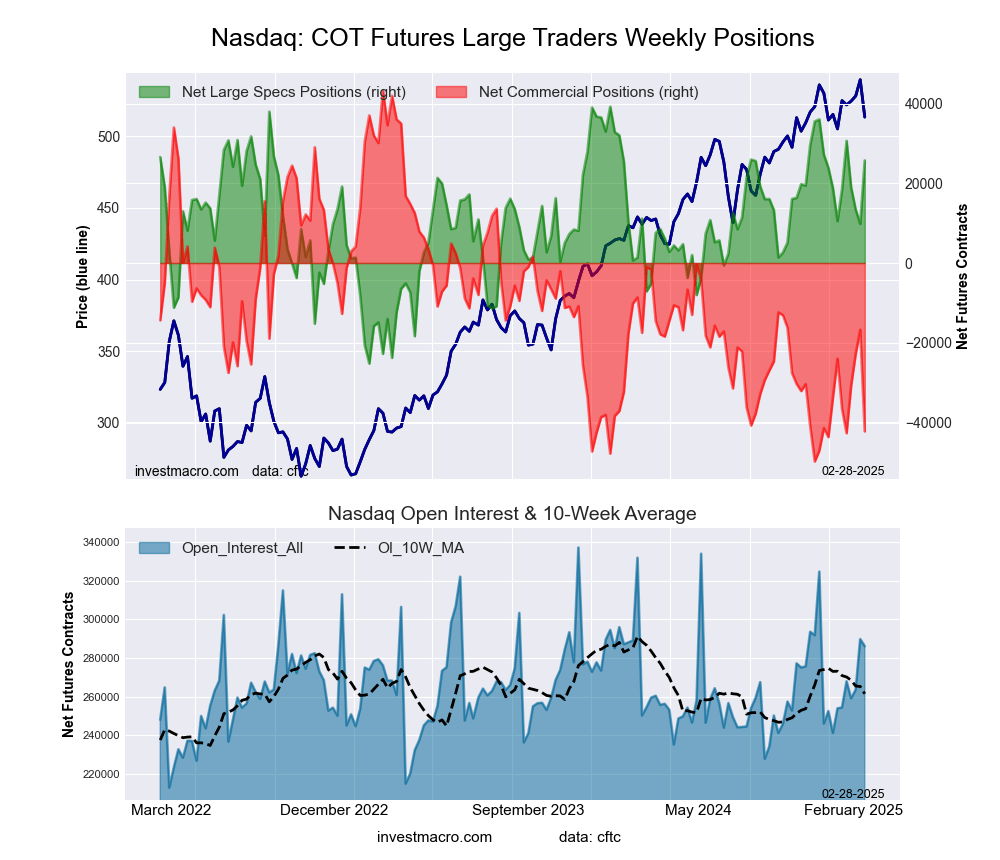
Nasdaq Mini Futures:
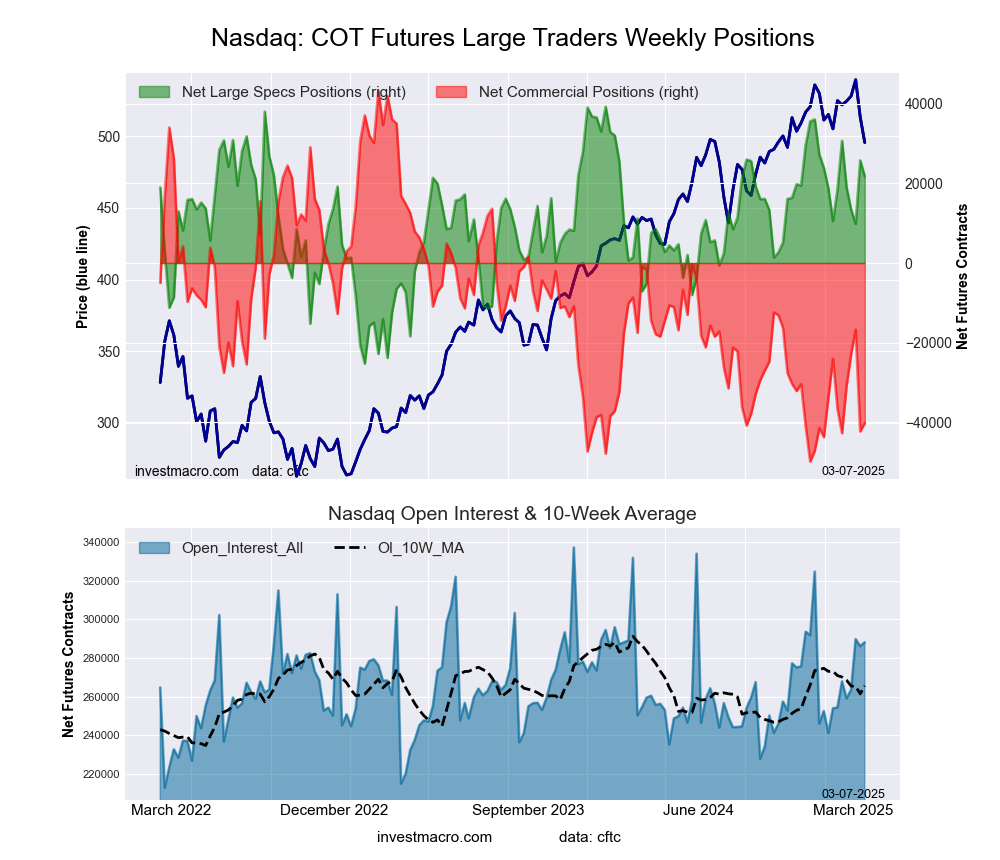
 The Nasdaq Mini large speculator standing this week recorded a net position of 24,264 contracts in the data reported through Tuesday. This was a weekly rise of 9,086 contracts from the previous week which had a total of 15,178 net contracts.
This week’s current strength score (the trader positioning range over the past three years, measured from 0 to 100) shows the speculators are currently Bullish with a score of 76.8 percent. The commercials are Bearish with a score of 20.9 percent and the small traders (not shown in chart) are Bullish with a score of 66.1 percent.
Price Trend-Following Model: Strong Downtrend
Our weekly trend-following model classifies the current market price position as: Strong Downtrend.
| Nasdaq Mini Futures Statistics | SPECULATORS | COMMERCIALS | SMALL TRADERS |
| – Percent of Open Interest Longs: | 28.9 | 56.4 | 13.8 |
| – Percent of Open Interest Shorts: | 19.4 | 68.4 | 11.4 |
| – Net Position: | 24,264 | -30,431 | 6,167 |
| – Gross Longs: | 73,557 | 143,676 | 35,189 |
| – Gross Shorts: | 49,293 | 174,107 | 29,022 |
| – Long to Short Ratio: | 1.5 to 1 | 0.8 to 1 | 1.2 to 1 |
| NET POSITION TREND: | |||
| – Strength Index Score (3 Year Range Pct): | 76.8 | 20.9 | 66.1 |
| – Strength Index Reading (3 Year Range): | Bullish | Bearish | Bullish |
| NET POSITION MOVEMENT INDEX: | |||
| – 6-Week Change in Strength Index: | -2.3 | 12.8 | -19.7 |
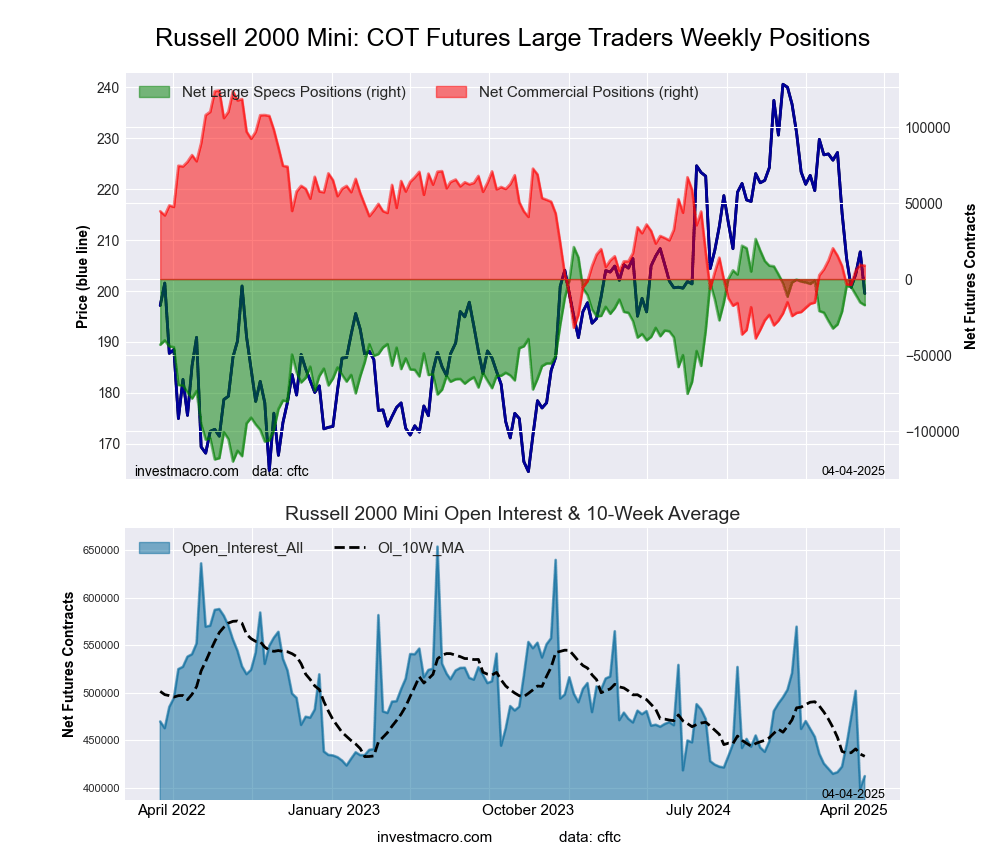
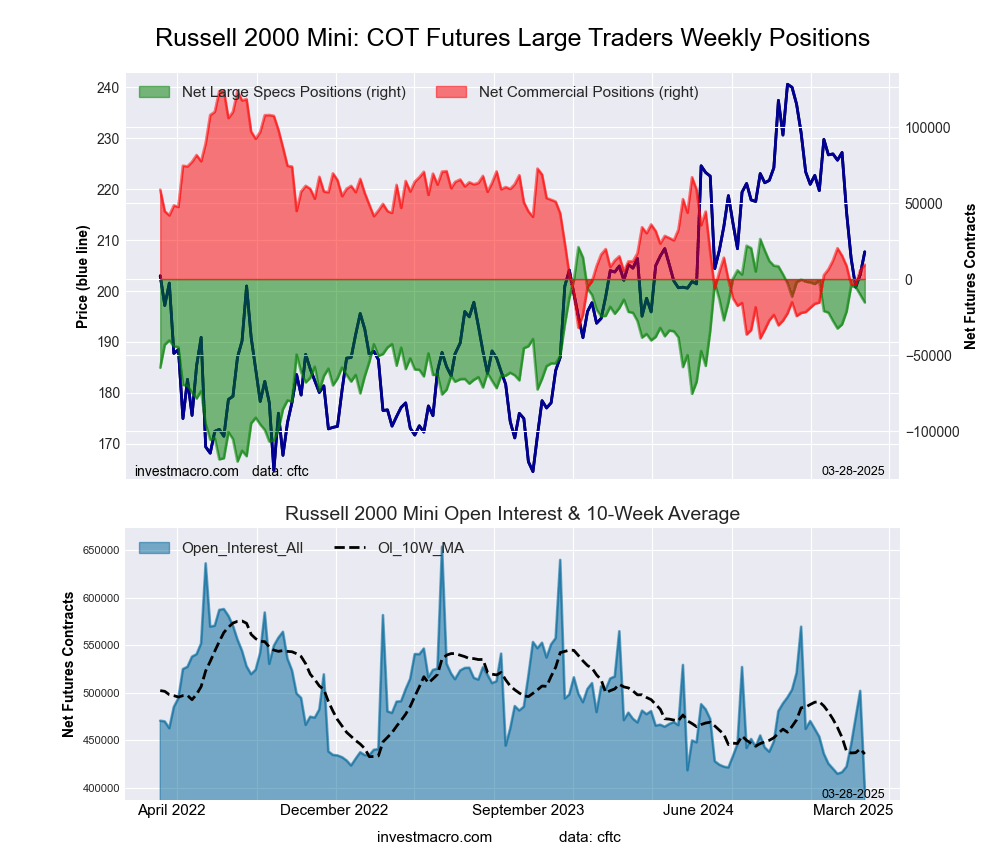
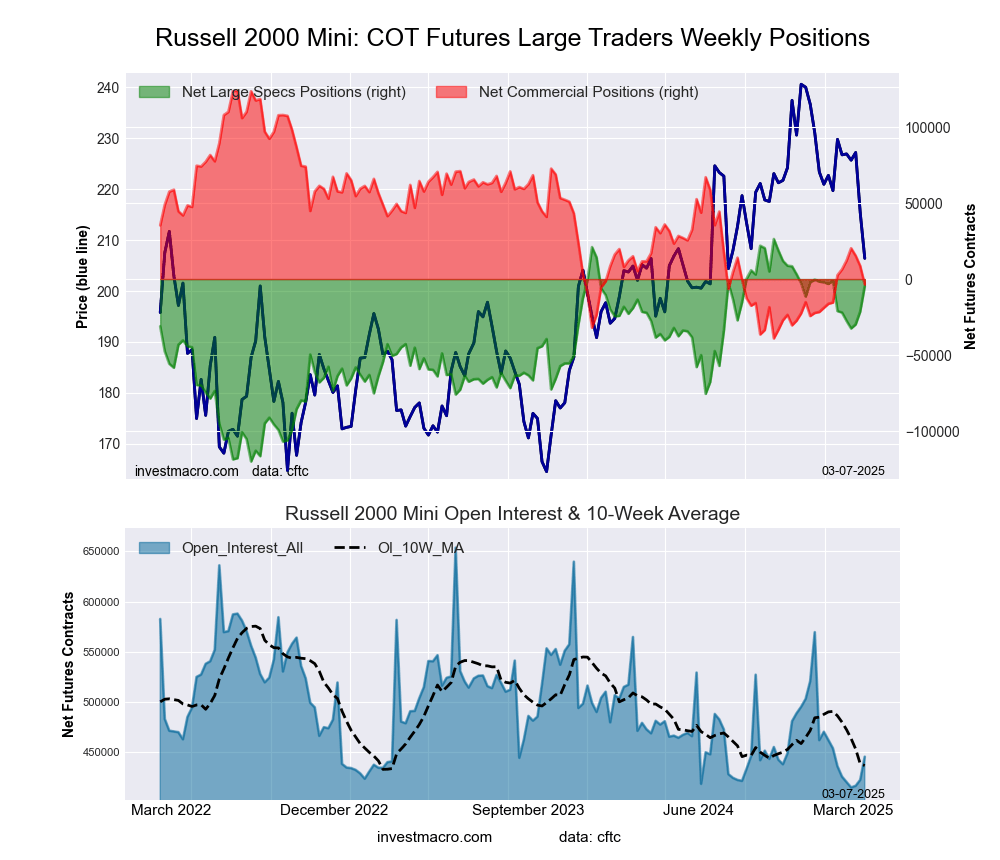
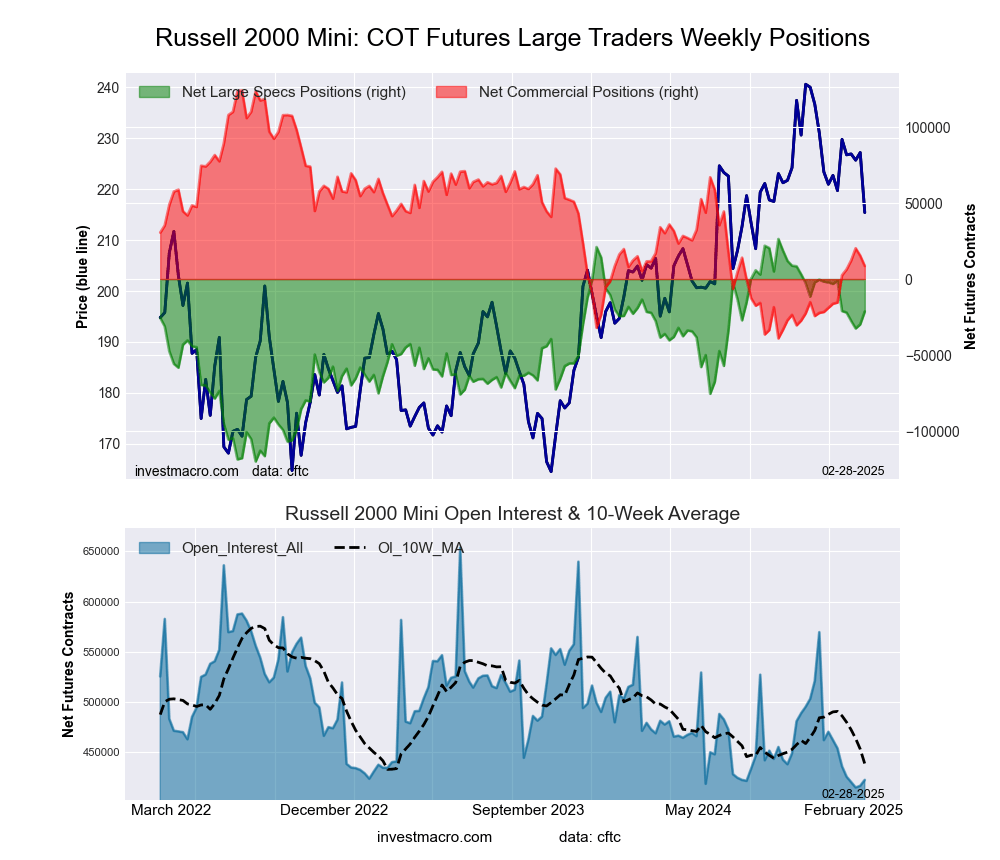
Russell 2000 Mini Futures:
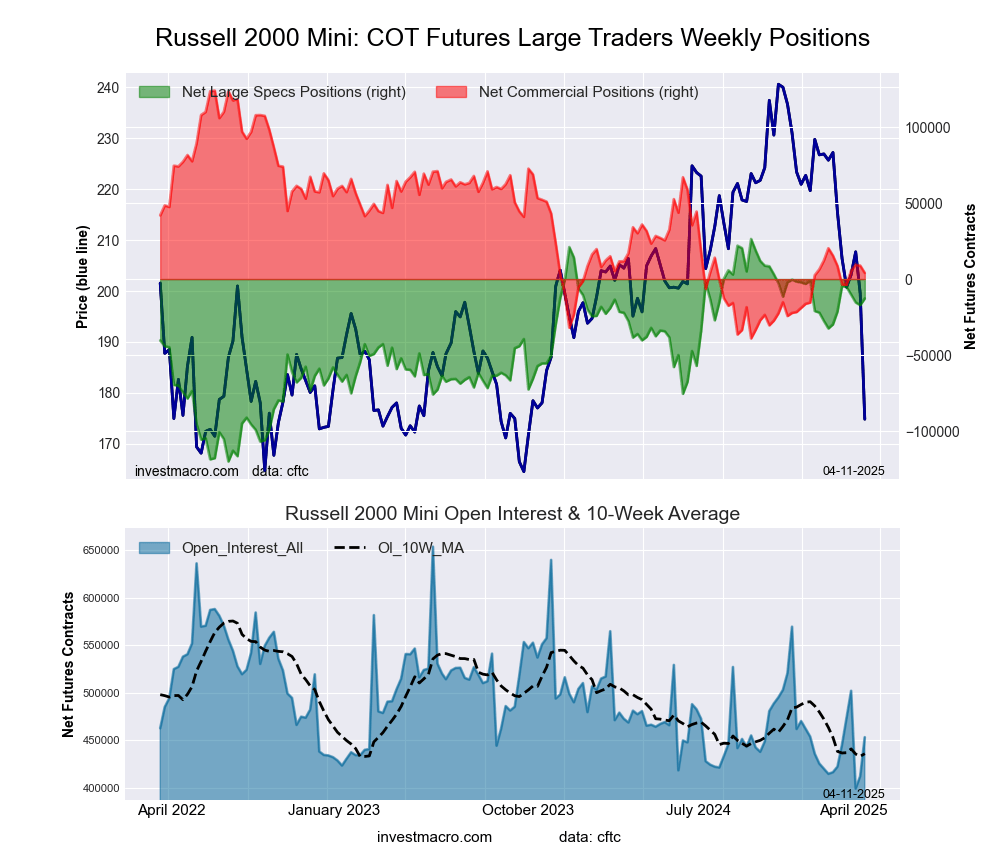 The Russell 2000 Mini large speculator standing this week recorded a net position of -12,745 contracts in the data reported through Tuesday. This was a weekly advance of 4,426 contracts from the previous week which had a total of -17,171 net contracts.
This week’s current strength score (the trader positioning range over the past three years, measured from 0 to 100) shows the speculators are currently Bullish with a score of 73.3 percent. The commercials are Bearish with a score of 26.4 percent and the small traders (not shown in chart) are Bearish with a score of 48.9 percent.
Price Trend-Following Model: Strong Downtrend
Our weekly trend-following model classifies the current market price position as: Strong Downtrend.
| Russell 2000 Mini Futures Statistics | SPECULATORS | COMMERCIALS | SMALL TRADERS |
| – Percent of Open Interest Longs: | 18.9 | 71.4 | 5.9 |
| – Percent of Open Interest Shorts: | 21.7 | 70.5 | 4.0 |
| – Net Position: | -12,745 | 4,057 | 8,688 |
| – Gross Longs: | 85,645 | 323,667 | 26,618 |
| – Gross Shorts: | 98,390 | 319,610 | 17,930 |
| – Long to Short Ratio: | 0.9 to 1 | 1.0 to 1 | 1.5 to 1 |
| NET POSITION TREND: | |||
| – Strength Index Score (3 Year Range Pct): | 73.3 | 26.4 | 48.9 |
| – Strength Index Reading (3 Year Range): | Bullish | Bearish | Bearish |
| NET POSITION MOVEMENT INDEX: | |||
| – 6-Week Change in Strength Index: | 5.9 | -2.8 | -11.4 |
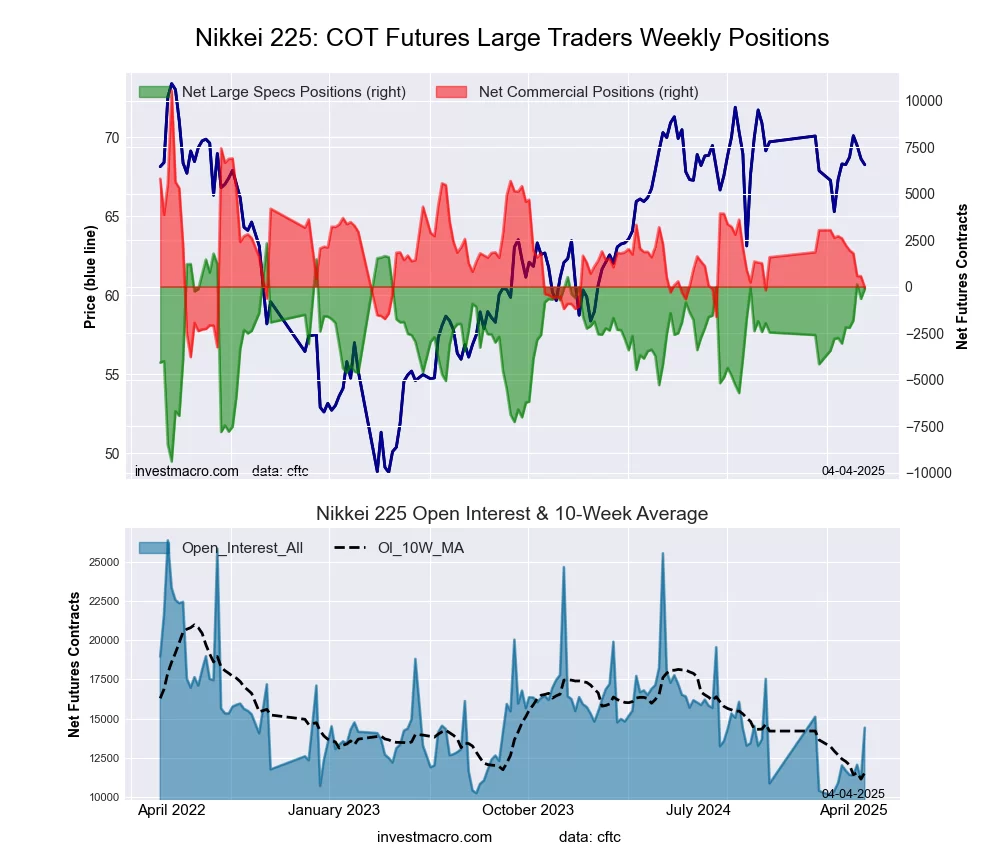
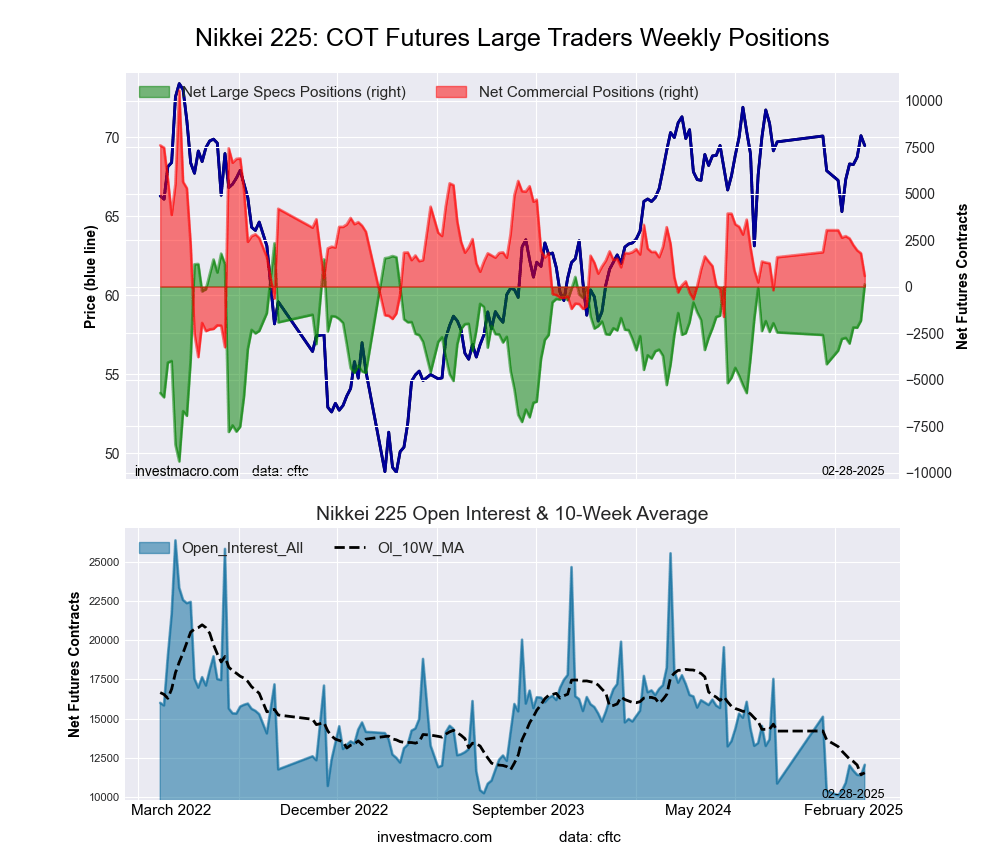
Nikkei Stock Average (USD) Futures:
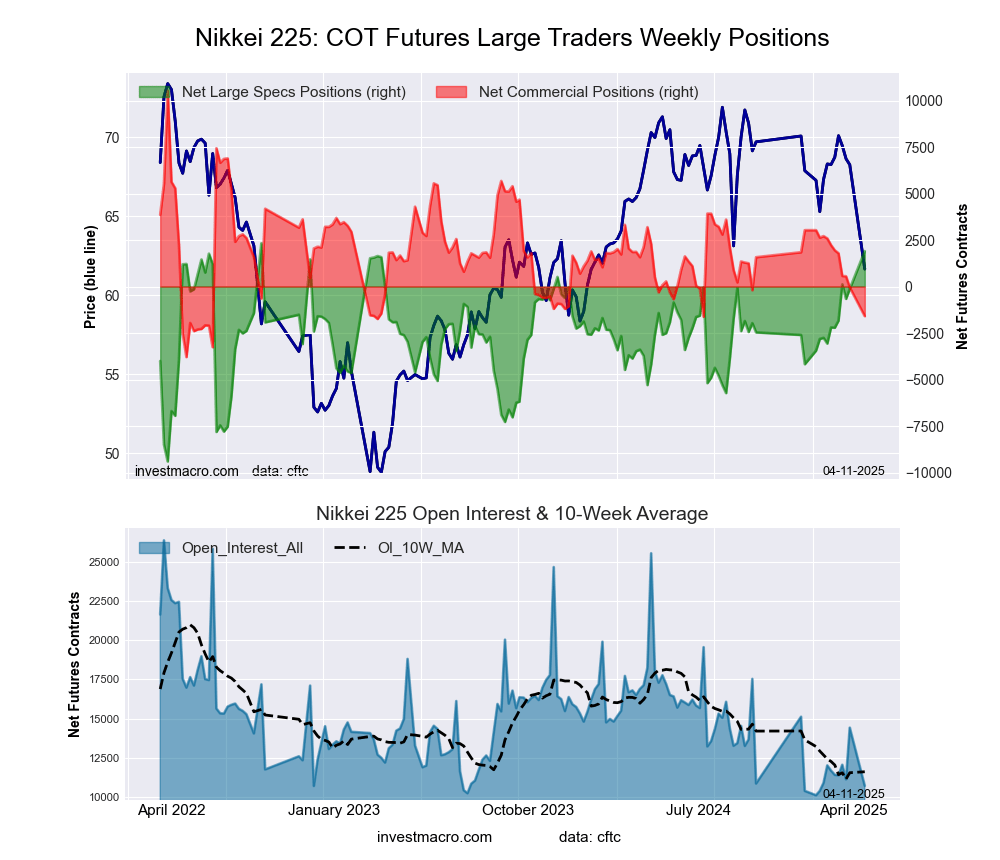 The Nikkei Stock Average (USD) large speculator standing this week recorded a net position of 1,904 contracts in the data reported through Tuesday. This was a weekly advance of 2,025 contracts from the previous week which had a total of -121 net contracts.
This week’s current strength score (the trader positioning range over the past three years, measured from 0 to 100) shows the speculators are currently Bullish-Extreme with a score of 96.4 percent. The commercials are Bearish-Extreme with a score of 15.4 percent and the small traders (not shown in chart) are Bearish with a score of 37.1 percent.
Price Trend-Following Model: Strong Downtrend
Our weekly trend-following model classifies the current market price position as: Strong Downtrend.
| Nikkei Stock Average Futures Statistics | SPECULATORS | COMMERCIALS | SMALL TRADERS |
| – Percent of Open Interest Longs: | 20.3 | 60.5 | 19.2 |
| – Percent of Open Interest Shorts: | 2.5 | 75.4 | 22.1 |
| – Net Position: | 1,904 | -1,590 | -314 |
| – Gross Longs: | 2,169 | 6,480 | 2,056 |
| – Gross Shorts: | 265 | 8,070 | 2,370 |
| – Long to Short Ratio: | 8.2 to 1 | 0.8 to 1 | 0.9 to 1 |
| NET POSITION TREND: | |||
| – Strength Index Score (3 Year Range Pct): | 96.4 | 15.4 | 37.1 |
| – Strength Index Reading (3 Year Range): | Bullish-Extreme | Bearish-Extreme | Bearish |
| NET POSITION MOVEMENT INDEX: | |||
| – 6-Week Change in Strength Index: | 35.0 | -26.7 | -5.5 |
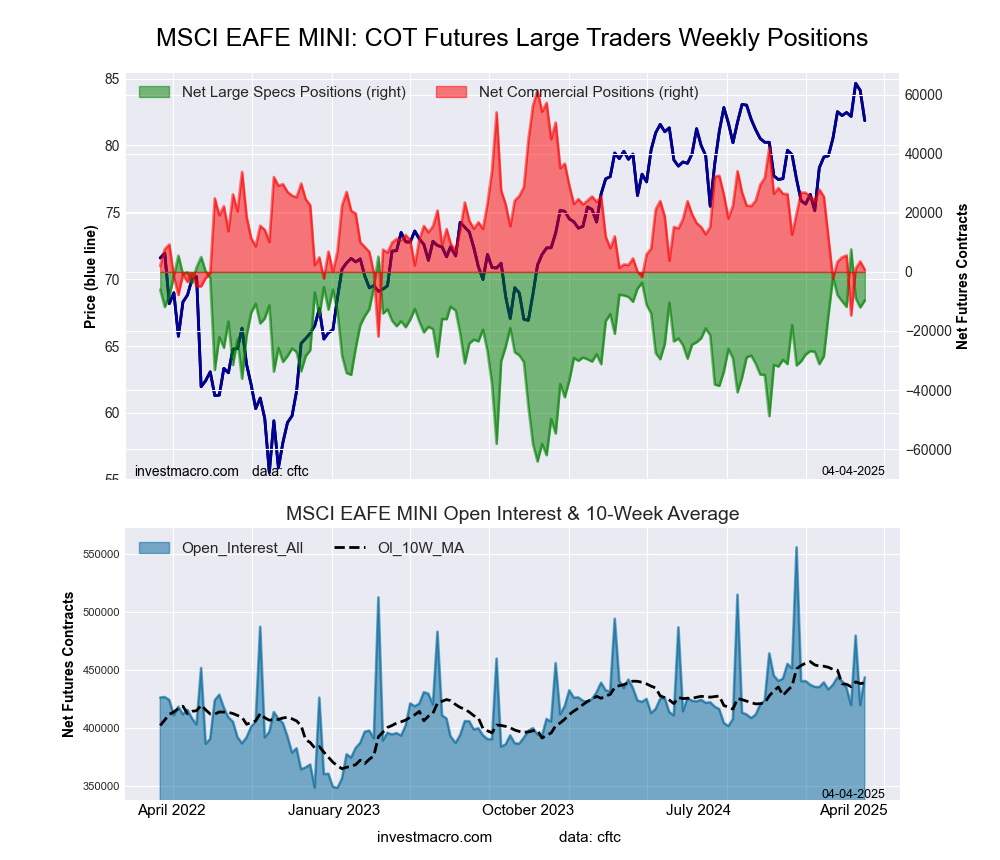
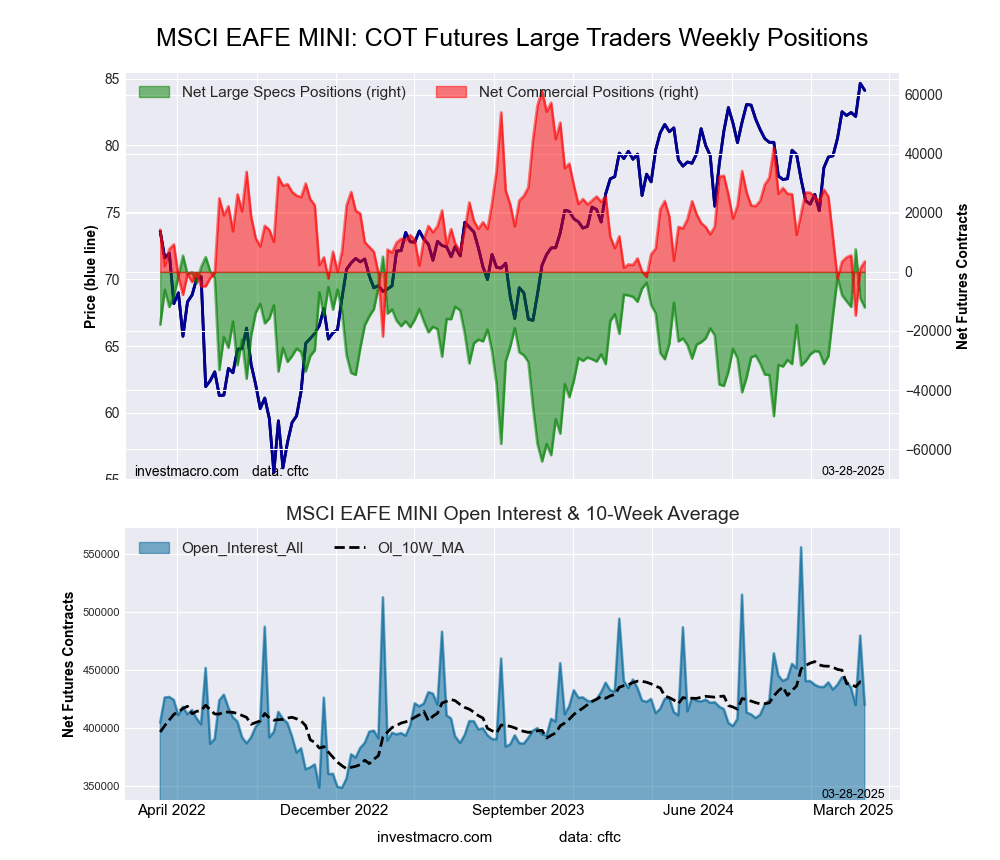
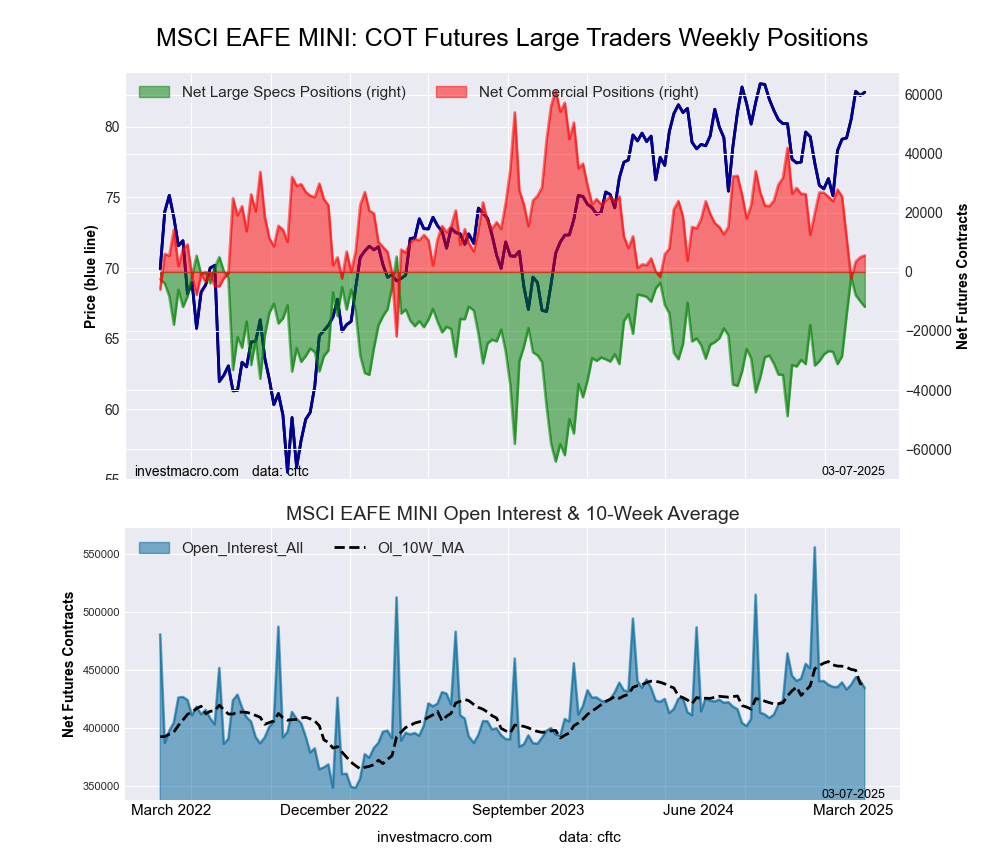
MSCI EAFE Mini Futures:
 The MSCI EAFE Mini large speculator standing this week recorded a net position of -8,496 contracts in the data reported through Tuesday. This was a weekly rise of 1,117 contracts from the previous week which had a total of -9,613 net contracts.
This week’s current strength score (the trader positioning range over the past three years, measured from 0 to 100) shows the speculators are currently Bullish with a score of 77.5 percent. The commercials are Bearish with a score of 26.0 percent and the small traders (not shown in chart) are Bullish with a score of 60.1 percent.
Price Trend-Following Model: Strong Downtrend
Our weekly trend-following model classifies the current market price position as: Strong Downtrend.
| MSCI EAFE Mini Futures Statistics | SPECULATORS | COMMERCIALS | SMALL TRADERS |
| – Percent of Open Interest Longs: | 9.3 | 87.3 | 3.2 |
| – Percent of Open Interest Shorts: | 11.2 | 87.3 | 1.3 |
| – Net Position: | -8,496 | -168 | 8,664 |
| – Gross Longs: | 41,546 | 389,655 | 14,324 |
| – Gross Shorts: | 50,042 | 389,823 | 5,660 |
| – Long to Short Ratio: | 0.8 to 1 | 1.0 to 1 | 2.5 to 1 |
| NET POSITION TREND: | |||
| – Strength Index Score (3 Year Range Pct): | 77.5 | 26.0 | 60.1 |
| – Strength Index Reading (3 Year Range): | Bullish | Bearish | Bullish |
| NET POSITION MOVEMENT INDEX: | |||
| – 6-Week Change in Strength Index: | 2.0 | -6.1 | 18.4 |
Article By InvestMacro – Receive our weekly COT Newsletter
*COT Report: The COT data, released weekly to the public each Friday, is updated through the most recent Tuesday (data is 3 days old) and shows a quick view of how large speculators or non-commercials (for-profit traders) were positioned in the futures markets.
The CFTC categorizes trader positions according to commercial hedgers (traders who use futures contracts for hedging as part of the business), non-commercials (large traders who speculate to realize trading profits) and nonreportable traders (usually small traders/speculators) as well as their open interest (contracts open in the market at time of reporting). See CFTC criteria here.