Archive for Stock Market News – Page 22

Why empathy constitutes the ultimate leadership skill

By Julia Milner, EDHEC Business School 

When asked what traits constitute a good leader, you may be tempted to list traditional qualities such as rationality, cool-headedness, and overall, an ability to detach oneself from one’s emotions. However, research has shown that the ability to feel empathy toward one’s colleagues is in fact the most critical leadership skills, and much-overlooked. Empathy is on record for boosting employees’ ability to innovate, engage with the task at hand, balance work and life demands, and not least, motivate them to stay within the company.

So, what stands in the way of more of the good stuff spreading across companies’ higher echelons?

Thinking errors and empathy

For the past decade, I have devoted my career to studying how leaders learn coaching skills, working with young professionals and experienced executives as well as consulting with organisations on leadership development. Empathy was one of the nine core skills we looked into in our latest paper on effective leadership.

Managers, it turns out, rated expressing empathy as the most challenging communication skills, above asking questions and providing feedback.

The trend appears to be linked to a number of old-school thinking errors, such as:

  • All or nothing approach: “If I show a little empathy then I will have crying employees in front of me.”
  • Heavens-reward fallacy: “If I give my empathy, then I expect to be rewarded for it, so the other person owes me something and if they don’t give it back this proves I’m wasting my time.”
  • Implicit stereotype: “Leaders who show empathy are weak, so I better appear strong and tough.”

In truth, a strong leader is an empathic one. We are not weak because we care about others.

Dans un contexte d’augmentation des risques psychosociaux, ignorer les émotions au travail n’aide pas…
Melissa Hogan/Wikimedia commons, CC BY-SA

The challenge of remote working

Another perceived obstacle to empathy has been the culture of remote working. CEOs noted that virtual interactions, be them through e-meetings or e-mails, robbed them of in-person communication cues, such as body language.

However, workers on the receiving end did not appear to believe that remote working inherently privileged unsympathetic behaviour. In fact, some employees preferred e-mails on the basis that they gave them time to think and not react immediately, and sometimes impulsively.

Executives blaming remote working for their behaviour might therefore wish to reflect upon whether cognitive bias or stereotypes listed above, rather than working from home, might be impeding them from tapping into empathy.

Moreover, there are steps that can be taken to translate emotions to the virtual world. Remember: the important thing is not what you say, but how you say it. One of the things we’ve observed is that on video calls, participants often think that a screen means they can forget their own facial expressions. Conversely, some managers are so focused on how they present themselves that they stare at their own image and lose focus on listening.

It’s all about finding the right balance and getting used to showing empathy virtually. Managers should not forget their voice either, particularly during video calls, because the voice becomes very important when participants are doing several things at once, listening without necessarily looking at you all the time. In other words, signs of agitation or stress in the voice, or leaving little room for questions, will send signals of a lack of empathy.

Strengthen the empathy muscle

To get around these obstacles, here are a few tips on how to start showing empathy:

  • In every interaction, always remember to listen, ask questions and signal that show you’ve understood the messages – without falling into artificial communication. This will strengthen your empathy “muscle” through training and experience.
  • Record a video during daily interactions. Even if it’s initially strange to see ourselves on video or to analyse the “how” of our communication, these debriefing sessions can help identify certain mistakes.
  • Try to find someone who is known for their empathy. Observe and ask questions to improve.

Ignoring emotions at work doesn’t help to foster a productive environment. It’s high time we recognised empathy as the essential leadership skill that it is.The Conversation

Empathy at work: How to do it in four practical steps (Julien Milner).

About the Author:

Julia Milner, Professeure de leadership, EDHEC Business School

This article is republished from The Conversation under a Creative Commons license. Read the original article.


COT Stock Market Charts: Speculator Bets led this week by VIX & Russell-Mini

By InvestMacro

Here are the latest charts and statistics for the Commitment of Traders (COT) data published by the Commodities Futures Trading Commission (CFTC).

The latest COT data is updated through Tuesday December 12th and shows a quick view of how large traders (for-profit speculators and commercial entities) were positioned in the futures markets.

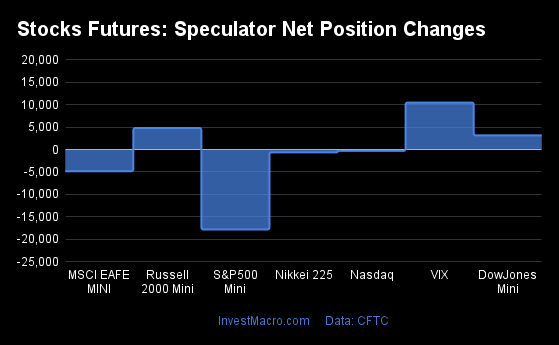
Weekly Speculator Changes led by the VIX & Russell-Mini

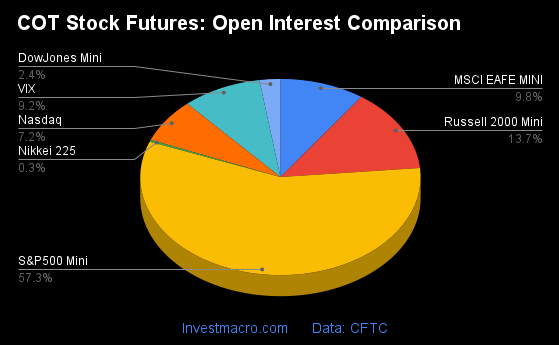
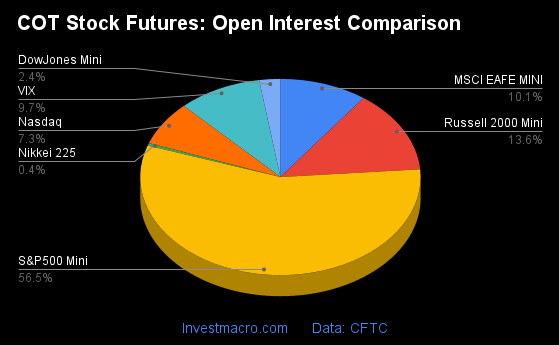
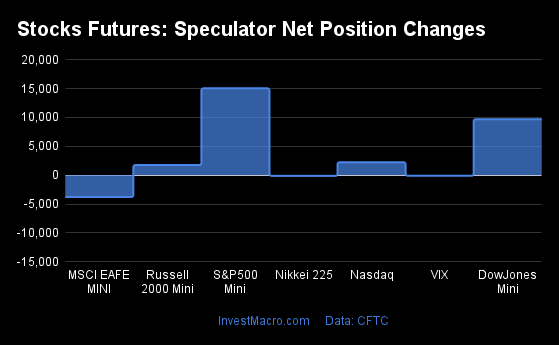
The COT stock markets speculator bets were slightly lower this week as three out of the seven stock markets we cover had higher positioning while the other four markets had lower speculator contracts.

Leading the gains for the stock markets was the VIX (10,461 contracts) with the Russell-Mini (4,800 contracts) and the DowJones-Mini (3,143 contracts) also showing positive weeks.

The markets with the declines in speculator bets this week were the S&P500-Mini (-17,822 contracts), the MSCI EAFE-Mini (-4,851 contracts), the Nikkei 225 (-627 contracts) and the Nasdaq-Mini (-298 contracts) also registering lower bets on the week.


Data Snapshot of Stock Market Traders | Columns Legend
Dec-12-2023OIOI-IndexSpec-NetSpec-IndexCom-NetCOM-IndexSmalls-NetSmalls-Index
S&P500-Mini2,670,45461-65,0835521,4954343,58855
Nikkei 22514,75628-2,317501,8074751045
Nasdaq-Mini337,2361008,10451-10,817312,71390
DowJones-Mini112,076853,4518819929-3,65026
VIX427,22986-46,3167845,7241859299
Nikkei 225 Yen40,280179,71464-3,8811-5,83389


Strength Scores led by DowJones-Mini & VIX

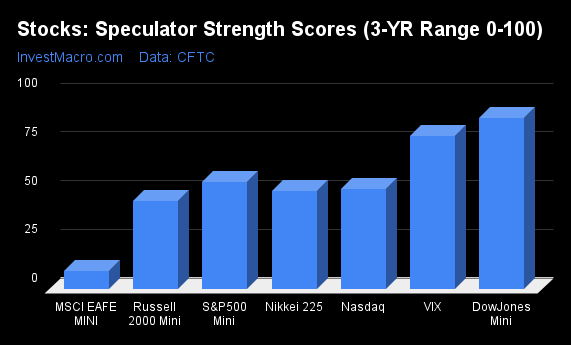
COT Strength Scores (a normalized measure of Speculator positions over a 3-Year range, from 0 to 100 where above 80 is Extreme-Bullish and below 20 is Extreme-Bearish) showed that the DowJones-Mini (88 percent) and the VIX (78 percent) lead the stock markets this week. The Nikkei 225 Yen (64 percent) and S&P500-Mini (55 percent) come in as the next highest in the weekly strength scores and above a 50 percent score.

On the downside, the MSCI EAFE-Mini (9 percent) comes in at the lowest strength level currently and is in Extreme-Bearish territory (below 20 percent).

Strength Statistics:
VIX (78.3 percent) vs VIX previous week (71.3 percent)
S&P500-Mini (55.0 percent) vs S&P500-Mini previous week (57.7 percent)
DowJones-Mini (87.6 percent) vs DowJones-Mini previous week (80.8 percent)
Nasdaq-Mini (51.4 percent) vs Nasdaq-Mini previous week (51.9 percent)
Russell2000-Mini (45.3 percent) vs Russell2000-Mini previous week (42.2 percent)
Nikkei USD (50.1 percent) vs Nikkei USD previous week (54.5 percent)
EAFE-Mini (9.3 percent) vs EAFE-Mini previous week (14.1 percent)


DowJones-Mini & Nikkei 225 Yen top the 6-Week Strength Trends

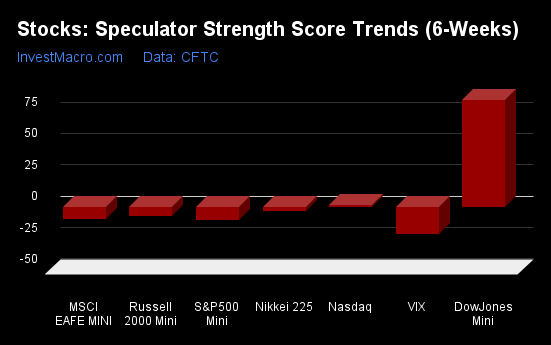
COT Strength Score Trends (or move index, calculates the 6-week changes in strength scores) showed that the DowJones-Mini (85 percent) overwhelmingly leads the past six weeks trends for the stock markets. The Nasdaq-Mini (2 percent) is  the next highest positive movers in the latest trends data.

The VIX (-22 percent) leads the downside trend scores currently with the S&P500-Mini (-10 percent) coming in as the next market with lower trend scores.

Strength Trend Statistics:
VIX (-21.7 percent) vs VIX previous week (-23.6 percent)
S&P500-Mini (-10.4 percent) vs S&P500-Mini previous week (-8.6 percent)
DowJones-Mini (85.5 percent) vs DowJones-Mini previous week (78.4 percent)
Nasdaq-Mini (2.1 percent) vs Nasdaq-Mini previous week (8.8 percent)
Russell2000-Mini (-7.3 percent) vs Russell2000-Mini previous week (-7.4 percent)
Nikkei USD (-3.1 percent) vs Nikkei USD previous week (3.1 percent)
EAFE-Mini (-9.1 percent) vs EAFE-Mini previous week (-19.1 percent)


Individual Stock Market Charts:

VIX Volatility Futures:

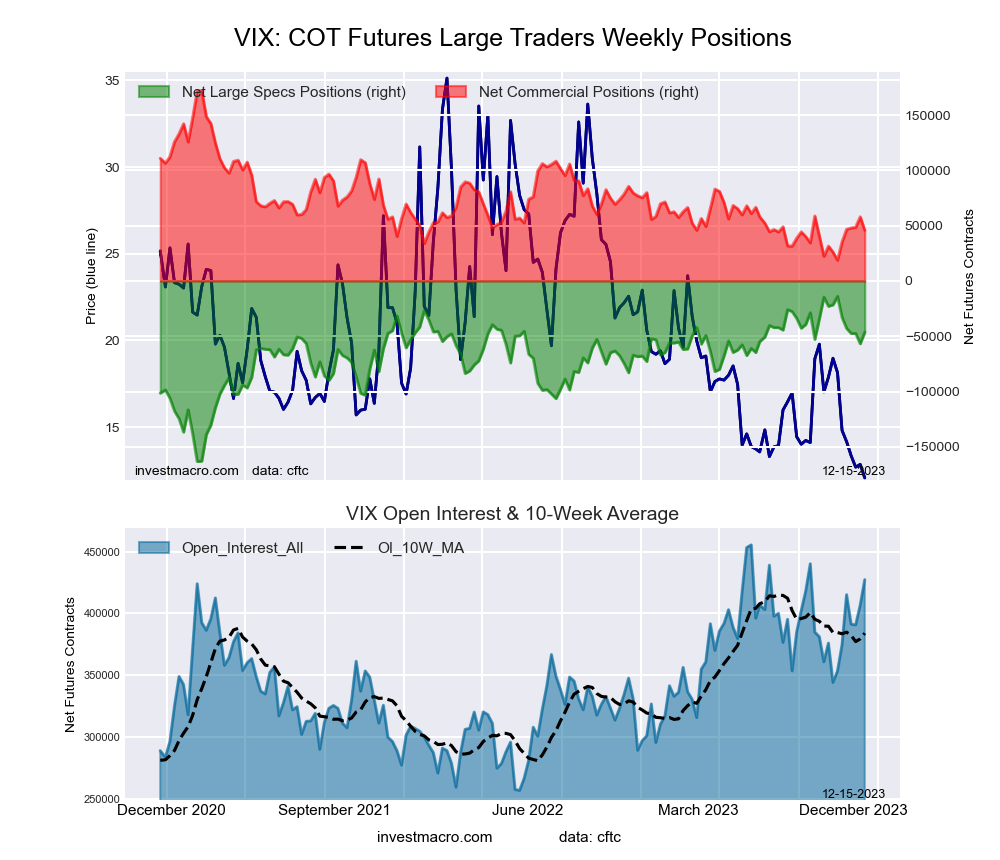
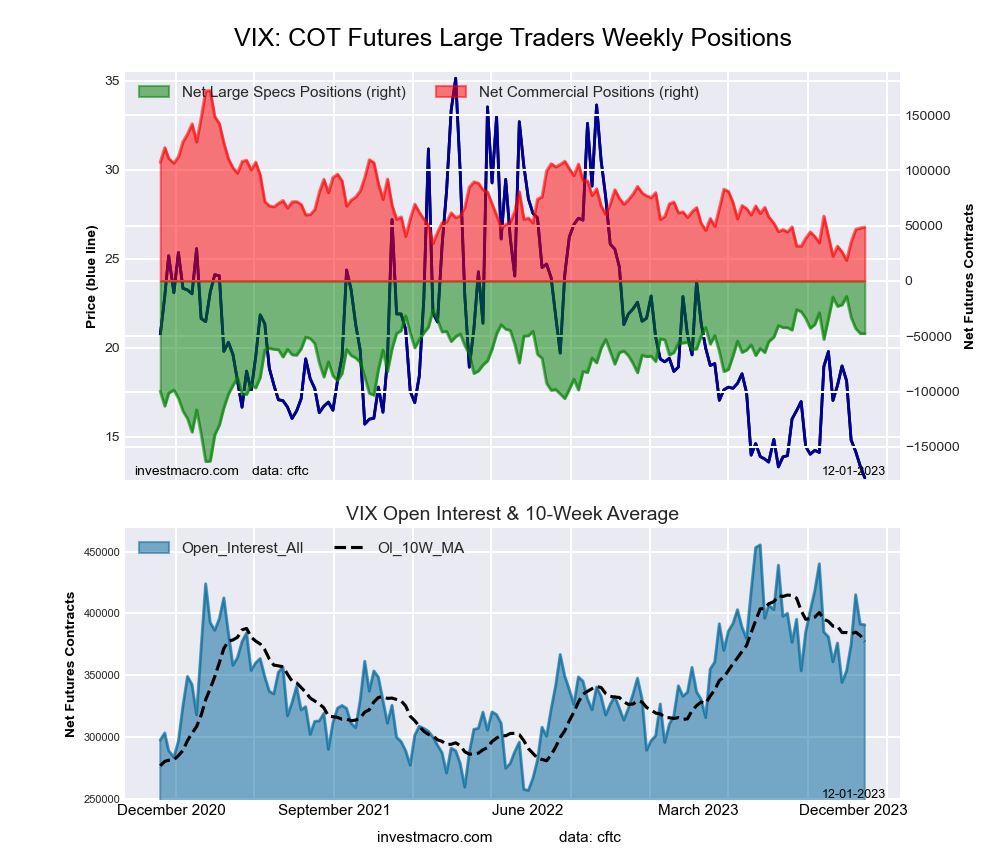
VIX Volatility Futures COT ChartThe VIX Volatility large speculator standing this week totaled a net position of -46,316 contracts in the data reported through Tuesday. This was a weekly rise of 10,461 contracts from the previous week which had a total of -56,777 net contracts.

This week’s current strength score (the trader positioning range over the past three years, measured from 0 to 100) shows the speculators are currently Bullish with a score of 78.3 percent. The commercials are Bearish-Extreme with a score of 17.6 percent and the small traders (not shown in chart) are Bullish-Extreme with a score of 99.5 percent.

Price Trend-Following Model: Strong Downtrend

Our weekly trend-following model classifies the current market price position as: Strong Downtrend. The current action for the model is considered to be: Hold – Maintain Short Position.

VIX Volatility Futures StatisticsSPECULATORSCOMMERCIALSSMALL TRADERS
– Percent of Open Interest Longs:22.847.67.3
– Percent of Open Interest Shorts:33.736.97.2
– Net Position:-46,31645,724592
– Gross Longs:97,484203,21531,240
– Gross Shorts:143,800157,49130,648
– Long to Short Ratio:0.7 to 11.3 to 11.0 to 1
NET POSITION TREND:
– Strength Index Score (3 Year Range Pct):78.317.699.5
– Strength Index Reading (3 Year Range):BullishBearish-ExtremeBullish-Extreme
NET POSITION MOVEMENT INDEX:
– 6-Week Change in Strength Index:-21.717.627.2


S&P500 Mini Futures:

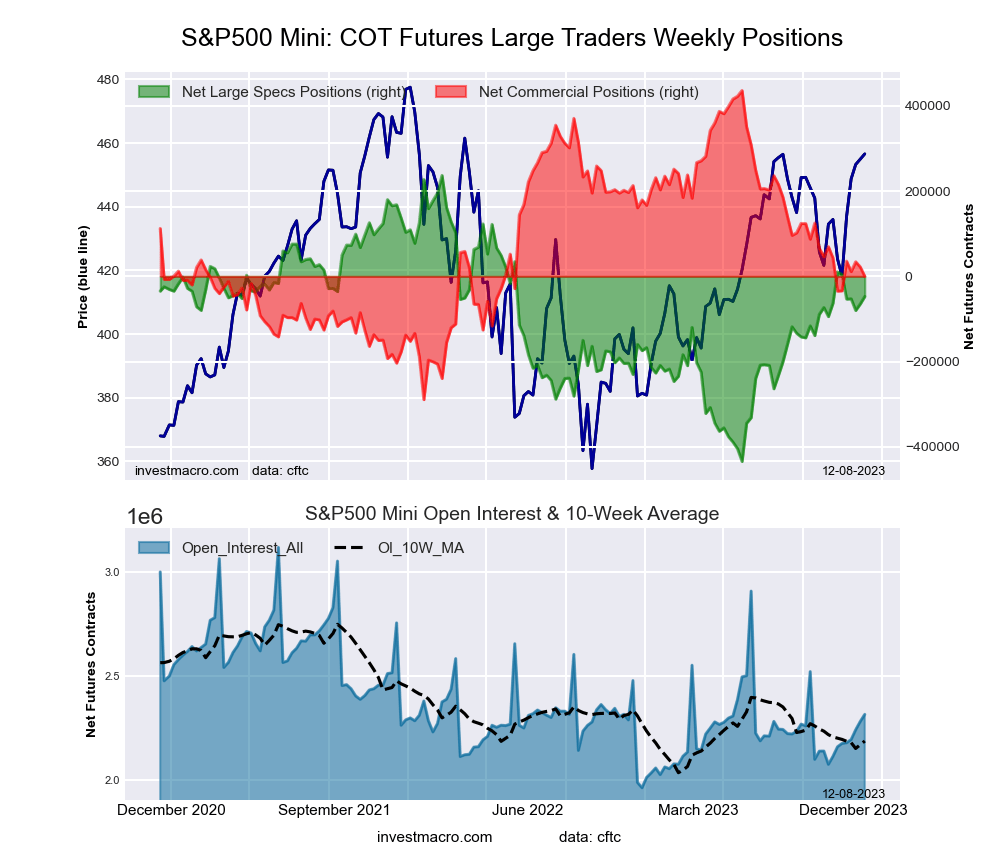
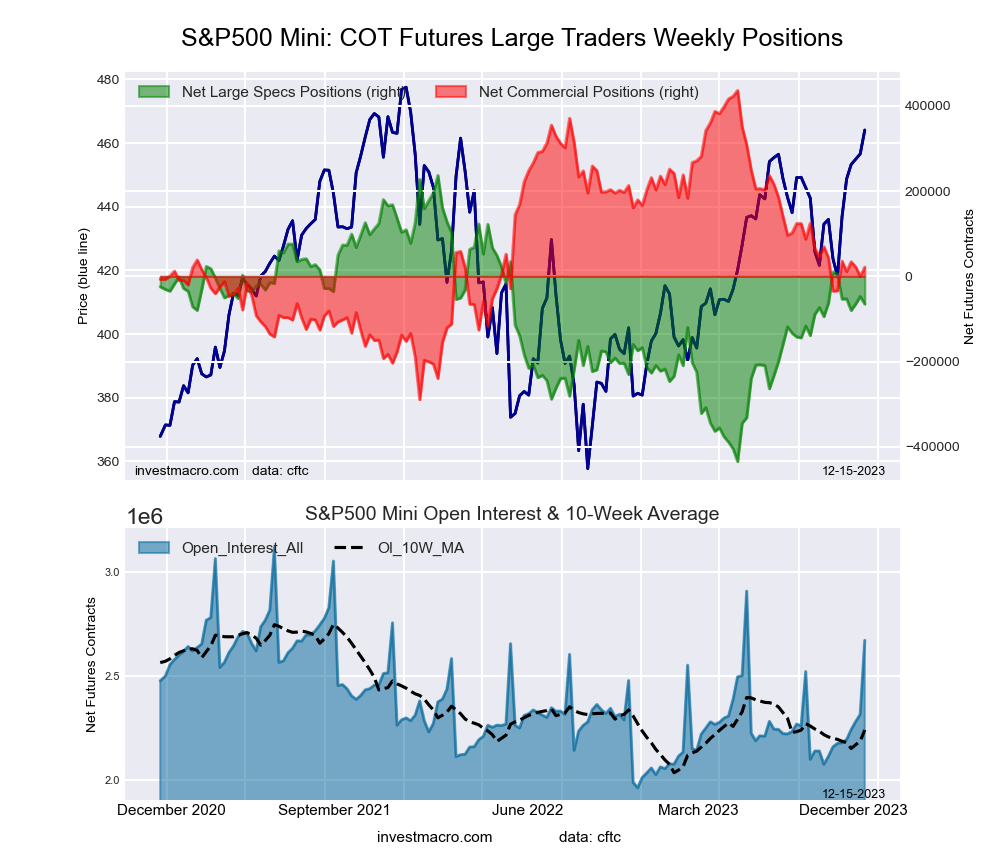
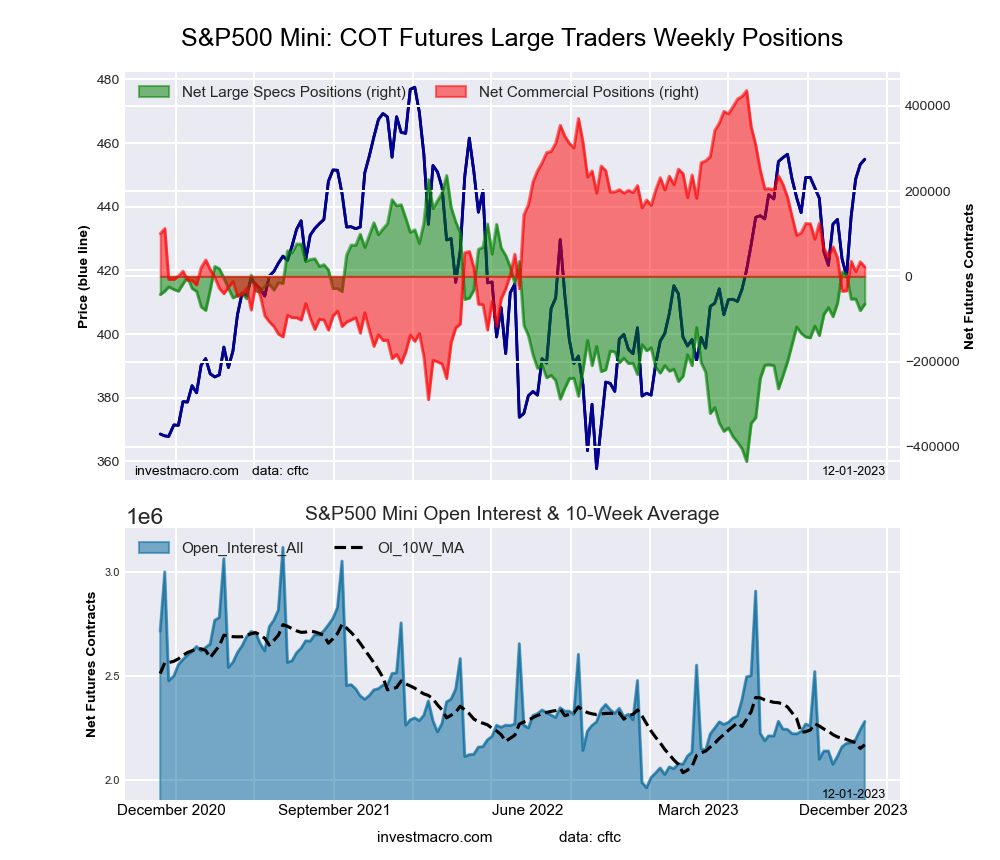
SP500 Mini Futures COT ChartThe S&P500 Mini large speculator standing this week totaled a net position of -65,083 contracts in the data reported through Tuesday. This was a weekly fall of -17,822 contracts from the previous week which had a total of -47,261 net contracts.

This week’s current strength score (the trader positioning range over the past three years, measured from 0 to 100) shows the speculators are currently Bullish with a score of 55.0 percent. The commercials are Bearish with a score of 42.9 percent and the small traders (not shown in chart) are Bullish with a score of 54.5 percent.

Price Trend-Following Model: Strong Uptrend

Our weekly trend-following model classifies the current market price position as: Strong Uptrend. The current action for the model is considered to be: New Buy – Long Position.

S&P500 Mini Futures StatisticsSPECULATORSCOMMERCIALSSMALL TRADERS
– Percent of Open Interest Longs:9.670.711.5
– Percent of Open Interest Shorts:12.169.99.8
– Net Position:-65,08321,49543,588
– Gross Longs:257,5331,888,239306,616
– Gross Shorts:322,6161,866,744263,028
– Long to Short Ratio:0.8 to 11.0 to 11.2 to 1
NET POSITION TREND:
– Strength Index Score (3 Year Range Pct):55.042.954.5
– Strength Index Reading (3 Year Range):BullishBearishBullish
NET POSITION MOVEMENT INDEX:
– 6-Week Change in Strength Index:-10.47.75.5


Dow Jones Mini Futures:

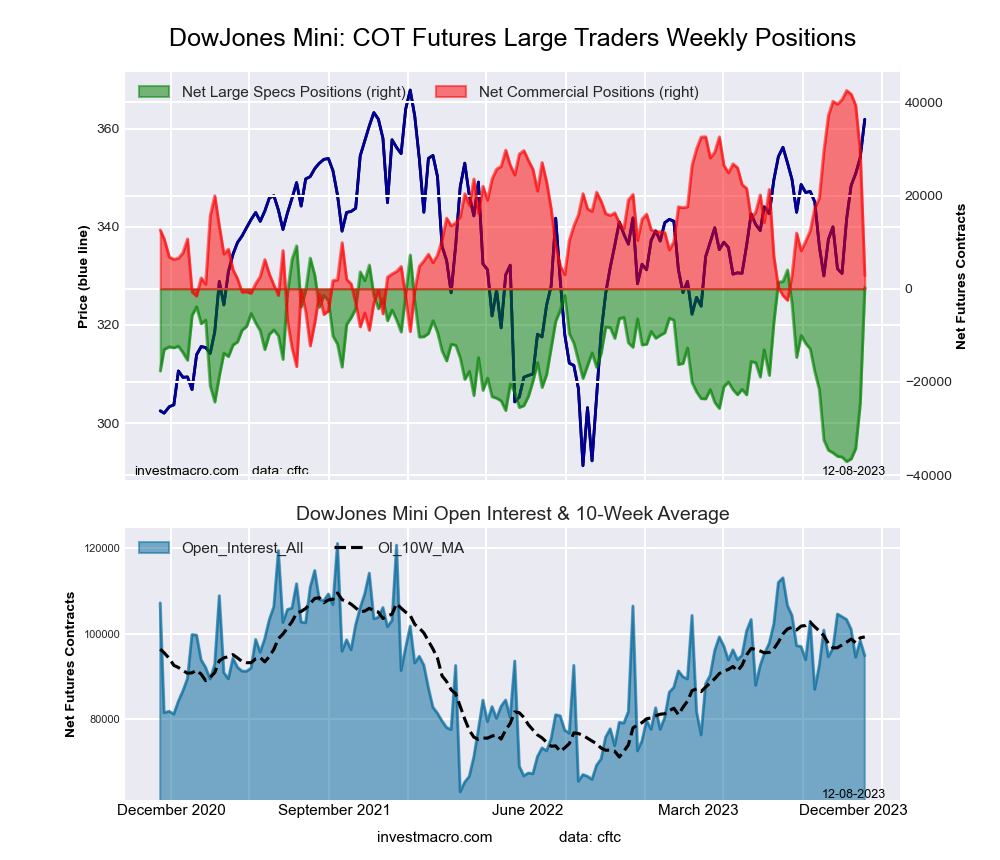
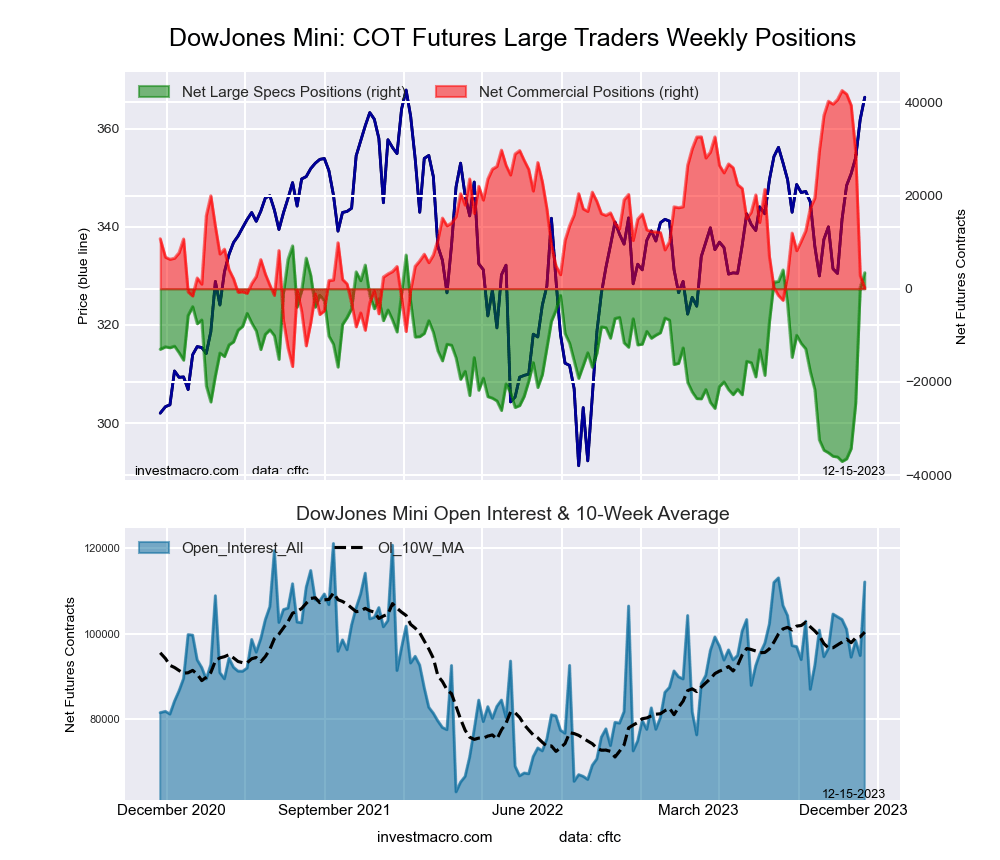
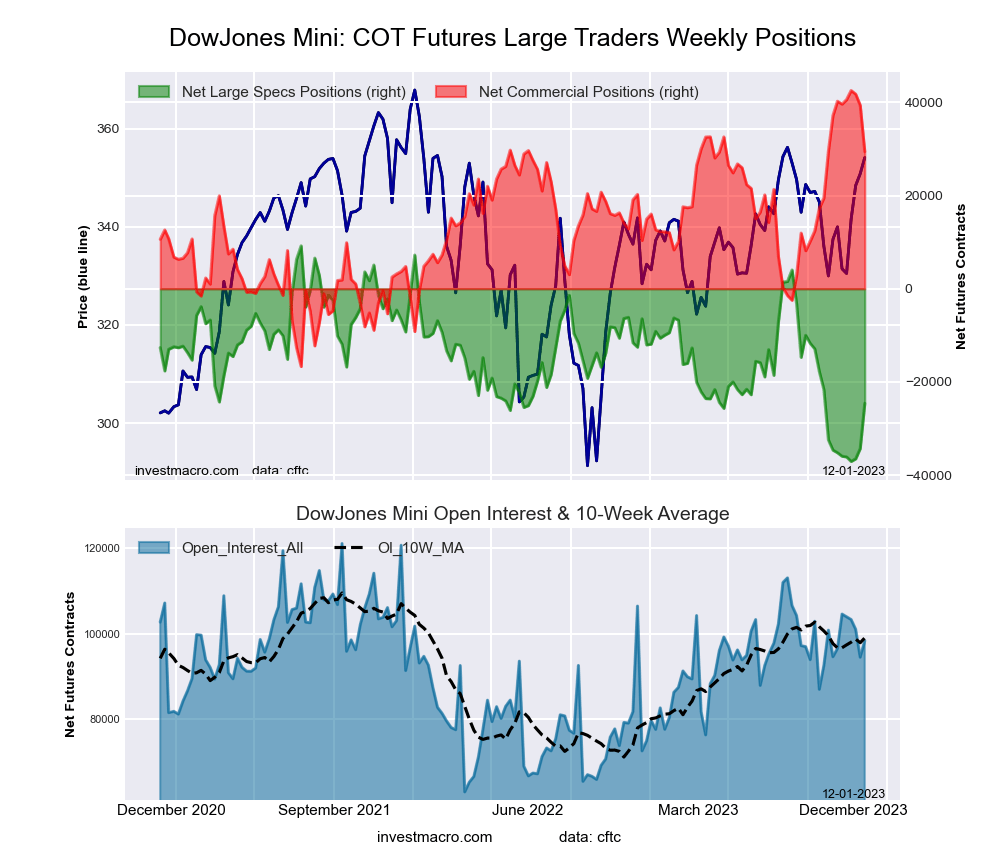
Dow Jones Mini Futures COT ChartThe Dow Jones Mini large speculator standing this week totaled a net position of 3,451 contracts in the data reported through Tuesday. This was a weekly boost of 3,143 contracts from the previous week which had a total of 308 net contracts.

This week’s current strength score (the trader positioning range over the past three years, measured from 0 to 100) shows the speculators are currently Bullish-Extreme with a score of 87.6 percent. The commercials are Bearish with a score of 28.5 percent and the small traders (not shown in chart) are Bearish with a score of 26.1 percent.

Price Trend-Following Model: Strong Uptrend

Our weekly trend-following model classifies the current market price position as: Strong Uptrend. The current action for the model is considered to be: Hold – Maintain Long Position.

Dow Jones Mini Futures StatisticsSPECULATORSCOMMERCIALSSMALL TRADERS
– Percent of Open Interest Longs:23.258.712.8
– Percent of Open Interest Shorts:20.158.516.0
– Net Position:3,451199-3,650
– Gross Longs:25,96865,77914,302
– Gross Shorts:22,51765,58017,952
– Long to Short Ratio:1.2 to 11.0 to 10.8 to 1
NET POSITION TREND:
– Strength Index Score (3 Year Range Pct):87.628.526.1
– Strength Index Reading (3 Year Range):Bullish-ExtremeBearishBearish
NET POSITION MOVEMENT INDEX:
– 6-Week Change in Strength Index:85.5-68.24.2


Nasdaq Mini Futures:

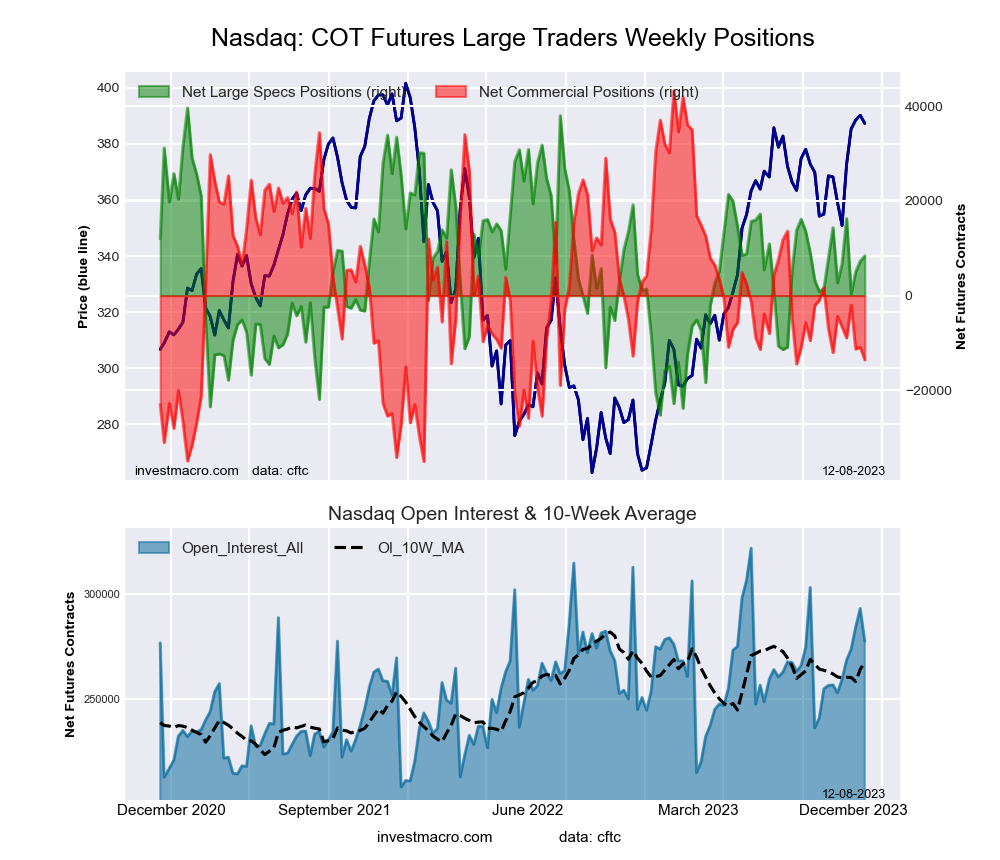
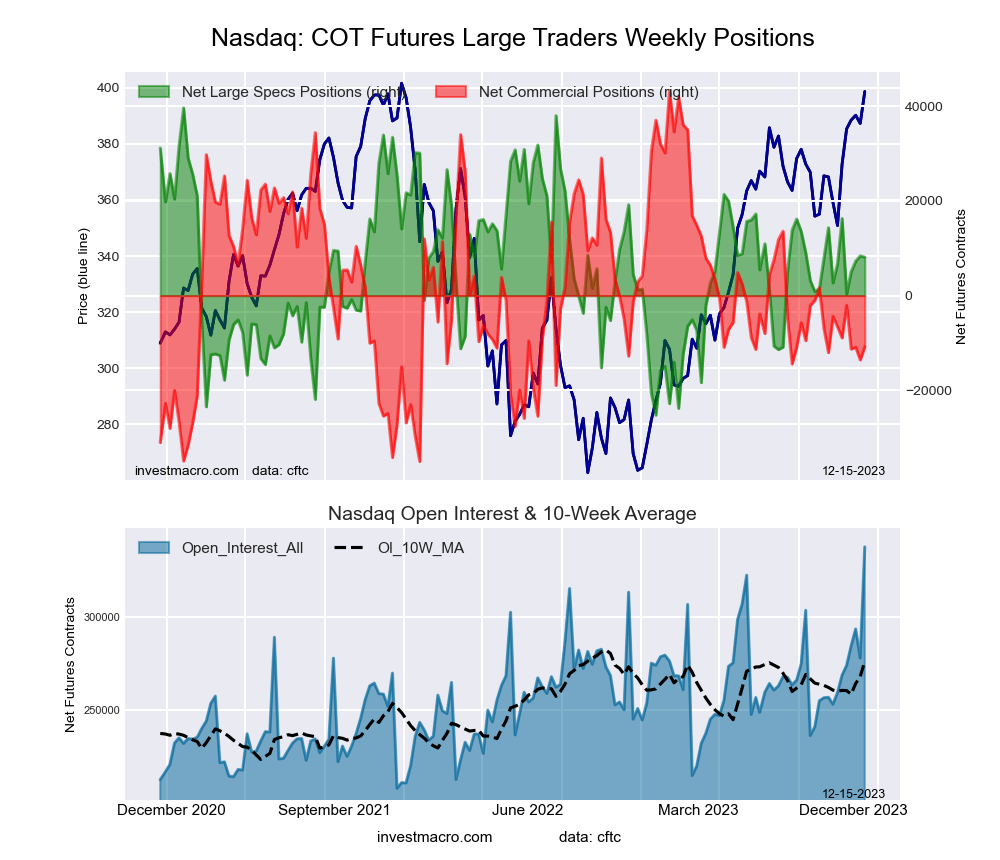
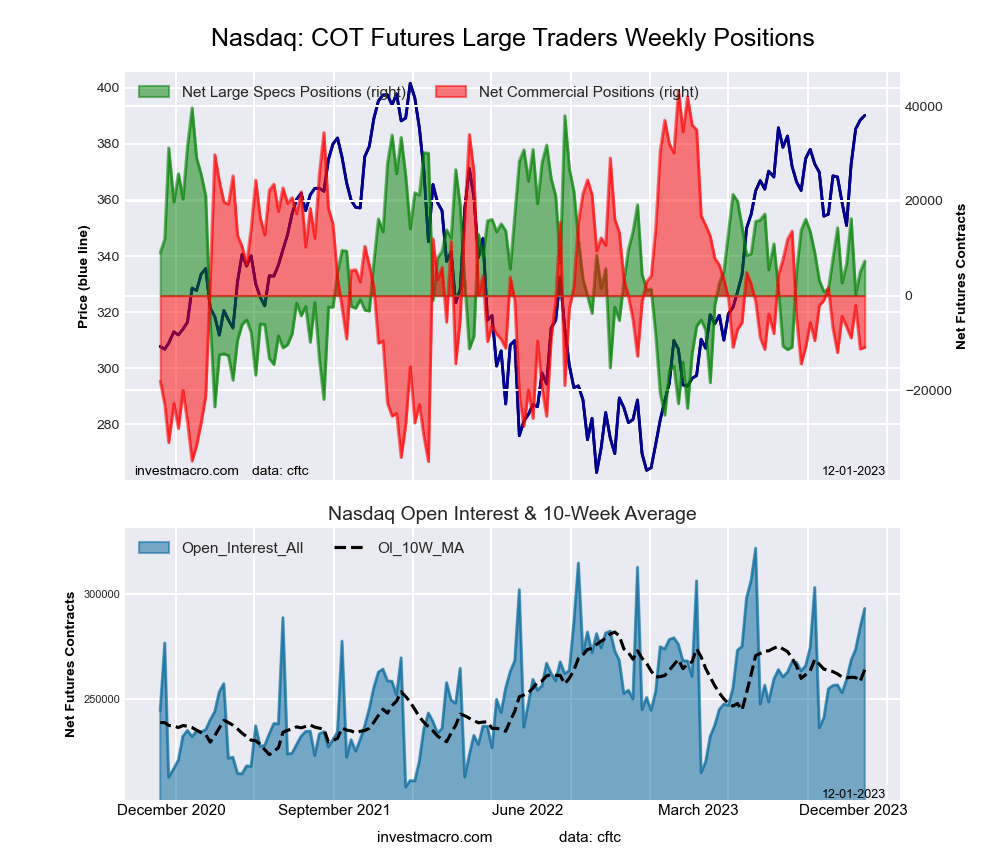
Nasdaq Mini Futures COT ChartThe Nasdaq Mini large speculator standing this week totaled a net position of 8,104 contracts in the data reported through Tuesday. This was a weekly lowering of -298 contracts from the previous week which had a total of 8,402 net contracts.

This week’s current strength score (the trader positioning range over the past three years, measured from 0 to 100) shows the speculators are currently Bullish with a score of 51.4 percent. The commercials are Bearish with a score of 30.9 percent and the small traders (not shown in chart) are Bullish-Extreme with a score of 89.9 percent.

Price Trend-Following Model: Strong Uptrend

Our weekly trend-following model classifies the current market price position as: Strong Uptrend. The current action for the model is considered to be: Hold – Maintain Long Position.

Nasdaq Mini Futures StatisticsSPECULATORSCOMMERCIALSSMALL TRADERS
– Percent of Open Interest Longs:21.262.913.2
– Percent of Open Interest Shorts:18.866.112.4
– Net Position:8,104-10,8172,713
– Gross Longs:71,616212,00144,538
– Gross Shorts:63,512222,81841,825
– Long to Short Ratio:1.1 to 11.0 to 11.1 to 1
NET POSITION TREND:
– Strength Index Score (3 Year Range Pct):51.430.989.9
– Strength Index Reading (3 Year Range):BullishBearishBullish-Extreme
NET POSITION MOVEMENT INDEX:
– 6-Week Change in Strength Index:2.1-5.48.2


Russell 2000 Mini Futures:

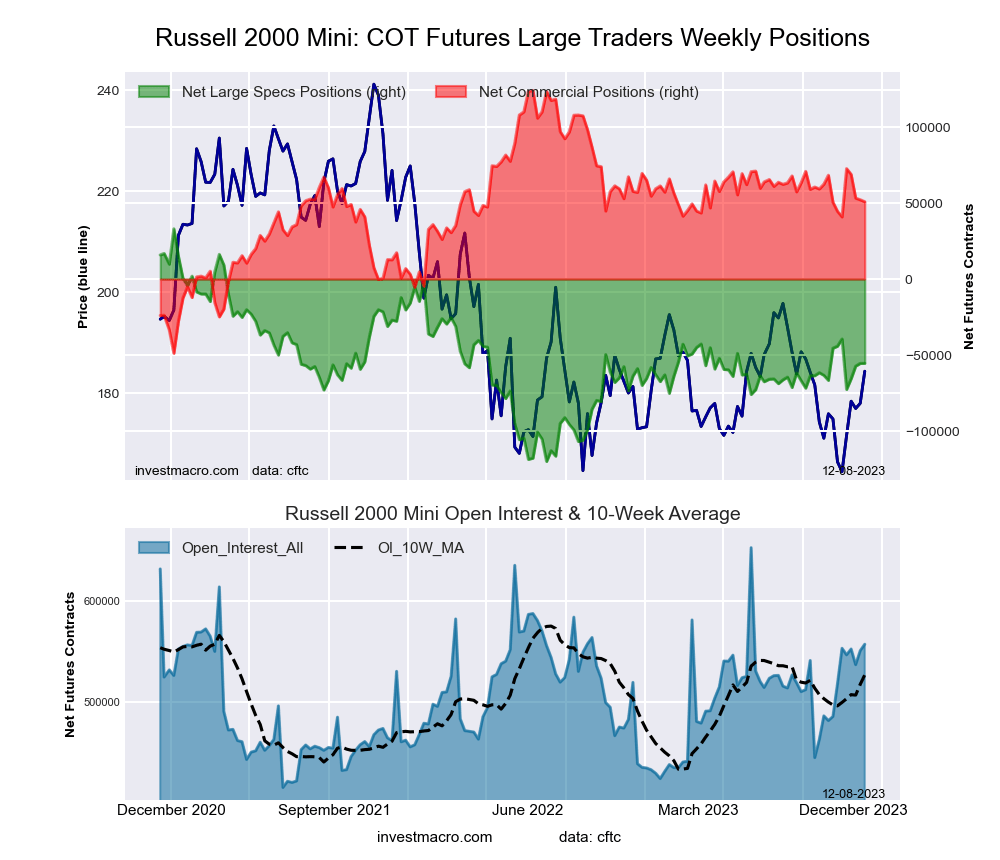
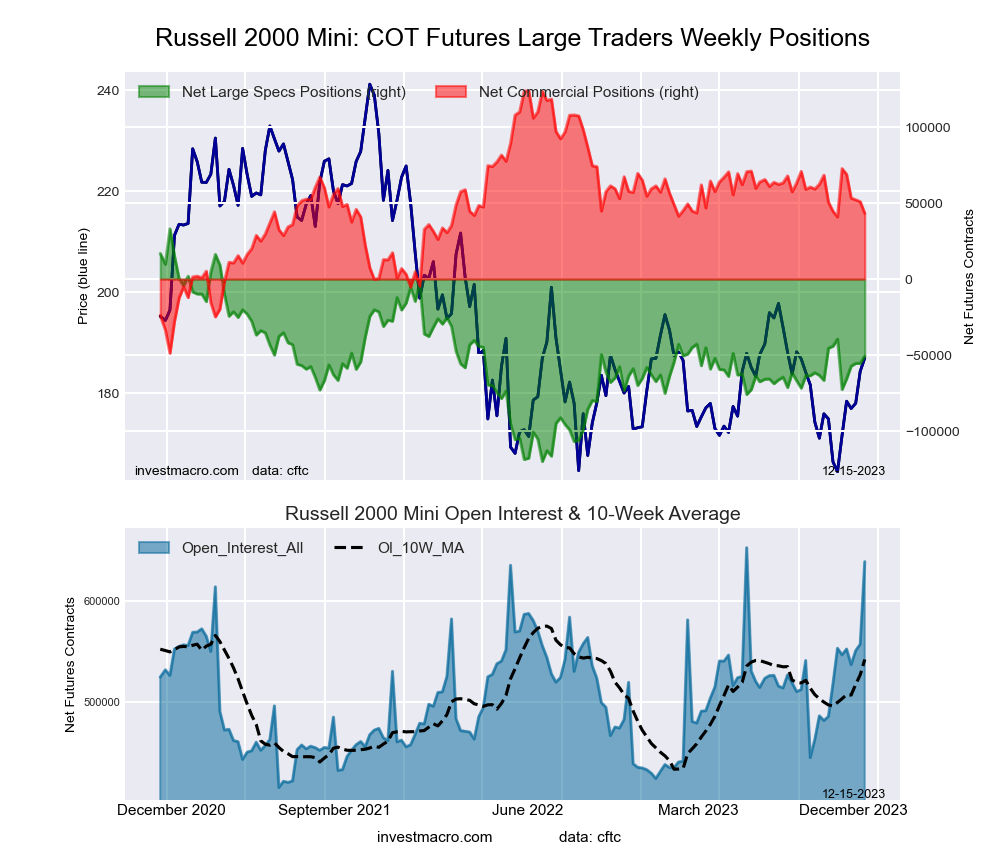
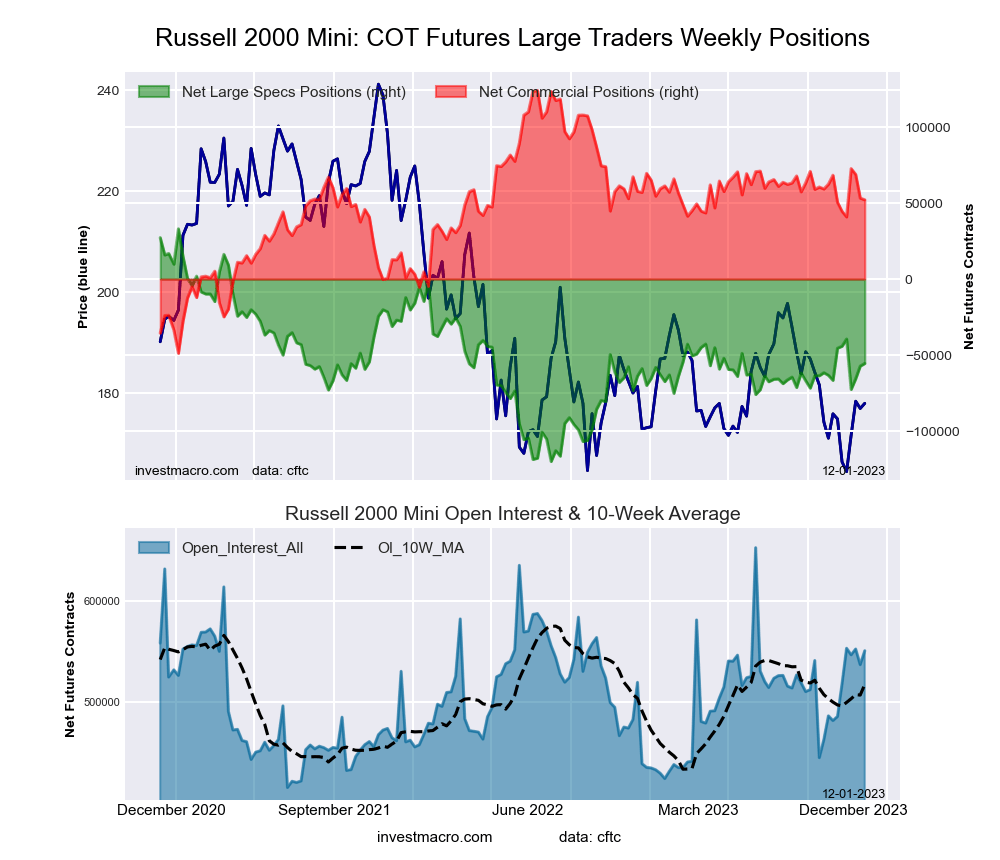
Russell 2000 Mini Futures COT ChartThe Russell 2000 Mini large speculator standing this week totaled a net position of -50,629 contracts in the data reported through Tuesday. This was a weekly boost of 4,800 contracts from the previous week which had a total of -55,429 net contracts.

This week’s current strength score (the trader positioning range over the past three years, measured from 0 to 100) shows the speculators are currently Bearish with a score of 45.3 percent. The commercials are Bullish with a score of 53.2 percent and the small traders (not shown in chart) are Bearish with a score of 49.5 percent.

Price Trend-Following Model: Weak Downtrend (Possible Trend Change)

Our weekly trend-following model classifies the current market price position as: Weak Downtrend. The current action for the model is considered to be: Hold – Maintain Short Position.

Russell 2000 Mini Futures StatisticsSPECULATORSCOMMERCIALSSMALL TRADERS
– Percent of Open Interest Longs:10.280.46.2
– Percent of Open Interest Shorts:18.273.65.0
– Net Position:-50,62943,2047,425
– Gross Longs:65,483513,99139,542
– Gross Shorts:116,112470,78732,117
– Long to Short Ratio:0.6 to 11.1 to 11.2 to 1
NET POSITION TREND:
– Strength Index Score (3 Year Range Pct):45.353.249.5
– Strength Index Reading (3 Year Range):BearishBullishBearish
NET POSITION MOVEMENT INDEX:
– 6-Week Change in Strength Index:-7.31.327.4


Nikkei Stock Average (USD) Futures:

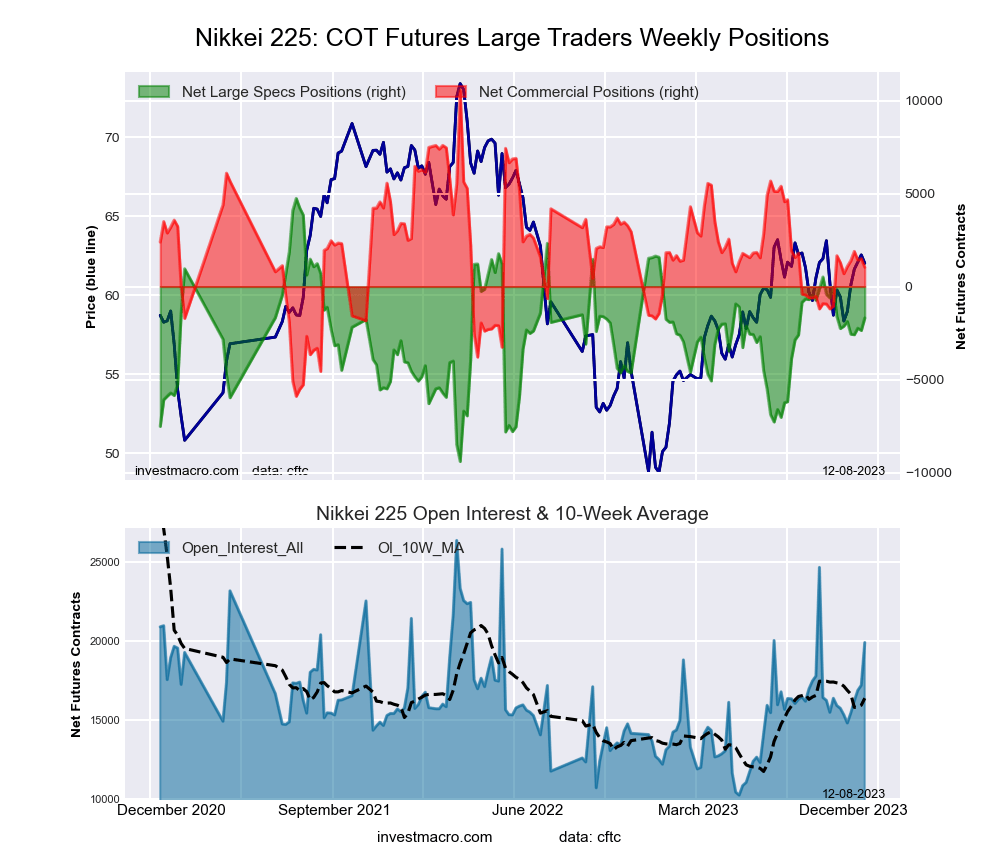
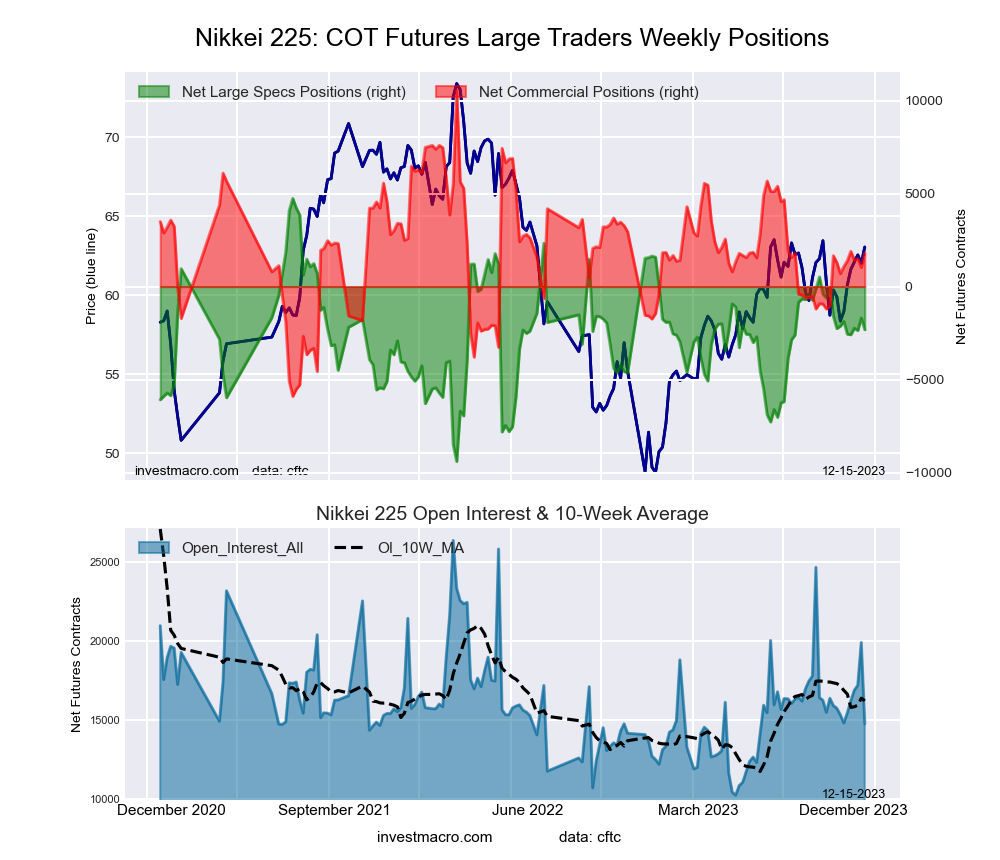
Nikkei Stock Average (USD) Futures COT ChartThe Nikkei Stock Average (USD) large speculator standing this week totaled a net position of -2,317 contracts in the data reported through Tuesday. This was a weekly decline of -627 contracts from the previous week which had a total of -1,690 net contracts.

This week’s current strength score (the trader positioning range over the past three years, measured from 0 to 100) shows the speculators are currently Bullish with a score of 50.1 percent. The commercials are Bearish with a score of 46.9 percent and the small traders (not shown in chart) are Bearish with a score of 45.3 percent.

Price Trend-Following Model: Strong Uptrend

Our weekly trend-following model classifies the current market price position as: Strong Uptrend. The current action for the model is considered to be: New Buy – Long Position.

Nikkei Stock Average Futures StatisticsSPECULATORSCOMMERCIALSSMALL TRADERS
– Percent of Open Interest Longs:12.966.121.0
– Percent of Open Interest Shorts:28.653.817.5
– Net Position:-2,3171,807510
– Gross Longs:1,9109,7483,098
– Gross Shorts:4,2277,9412,588
– Long to Short Ratio:0.5 to 11.2 to 11.2 to 1
NET POSITION TREND:
– Strength Index Score (3 Year Range Pct):50.146.945.3
– Strength Index Reading (3 Year Range):BullishBearishBearish
NET POSITION MOVEMENT INDEX:
– 6-Week Change in Strength Index:-3.14.4-4.6


MSCI EAFE Mini Futures:

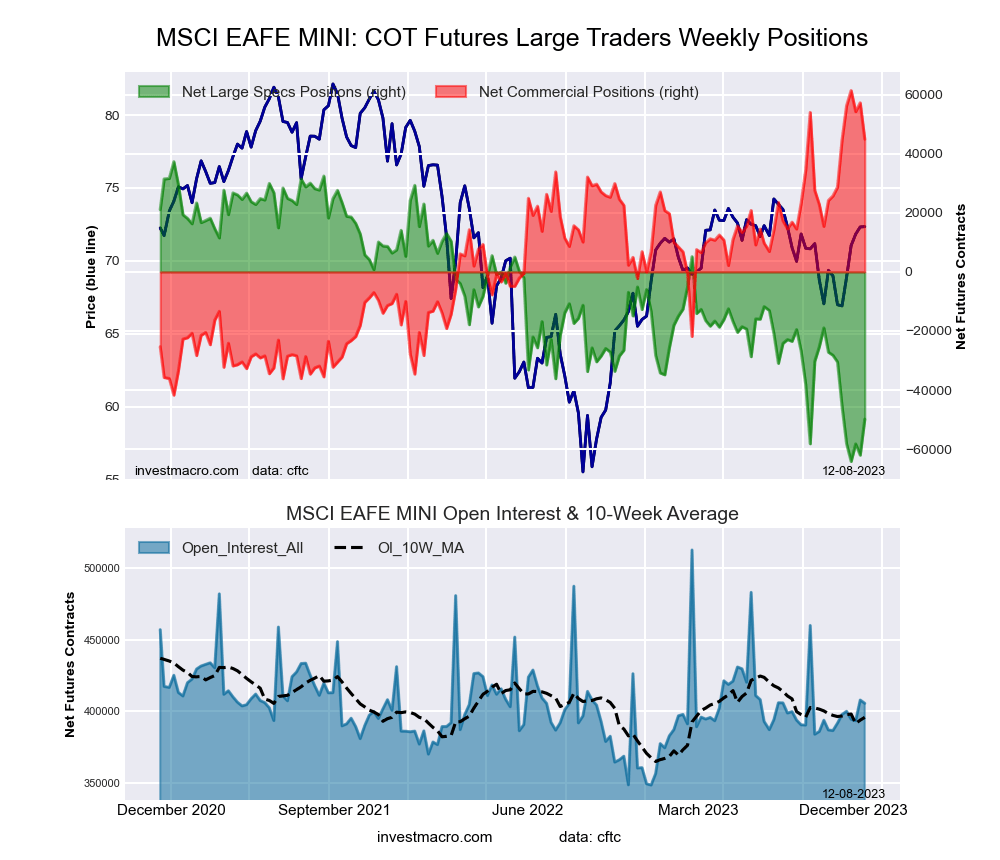
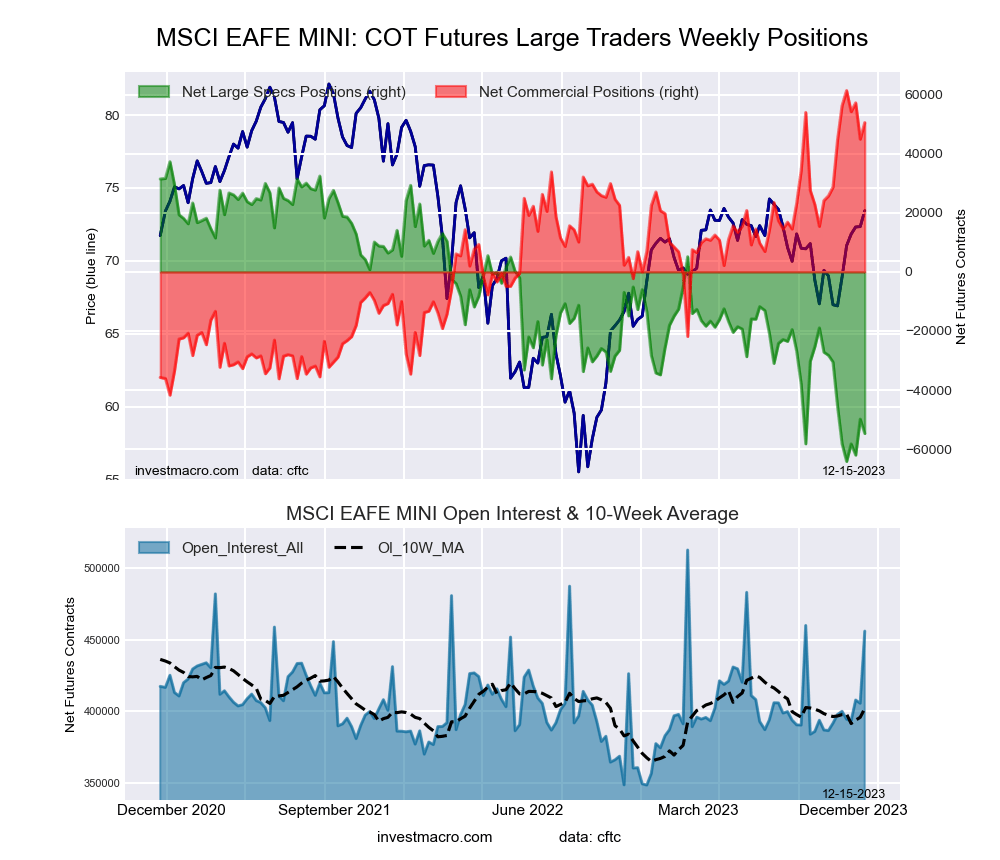
MSCI EAFE Mini Futures COT ChartThe MSCI EAFE Mini large speculator standing this week totaled a net position of -54,709 contracts in the data reported through Tuesday. This was a weekly decline of -4,851 contracts from the previous week which had a total of -49,858 net contracts.

This week’s current strength score (the trader positioning range over the past three years, measured from 0 to 100) shows the speculators are currently Bearish-Extreme with a score of 9.3 percent. The commercials are Bullish-Extreme with a score of 89.5 percent and the small traders (not shown in chart) are Bearish with a score of 37.7 percent.

Price Trend-Following Model: Strong Uptrend

Our weekly trend-following model classifies the current market price position as: Strong Uptrend. The current action for the model is considered to be: New Buy – Long Position.

MSCI EAFE Mini Futures StatisticsSPECULATORSCOMMERCIALSSMALL TRADERS
– Percent of Open Interest Longs:5.092.02.2
– Percent of Open Interest Shorts:17.081.01.2
– Net Position:-54,70950,5644,145
– Gross Longs:22,631419,8089,840
– Gross Shorts:77,340369,2445,695
– Long to Short Ratio:0.3 to 11.1 to 11.7 to 1
NET POSITION TREND:
– Strength Index Score (3 Year Range Pct):9.389.537.7
– Strength Index Reading (3 Year Range):Bearish-ExtremeBullish-ExtremeBearish
NET POSITION MOVEMENT INDEX:
– 6-Week Change in Strength Index:-9.15.716.5


Article By InvestMacroReceive our weekly COT Newsletter

*COT Report: The COT data, released weekly to the public each Friday, is updated through the most recent Tuesday (data is 3 days old) and shows a quick view of how large speculators or non-commercials (for-profit traders) were positioned in the futures markets.

The CFTC categorizes trader positions according to commercial hedgers (traders who use futures contracts for hedging as part of the business), non-commercials (large traders who speculate to realize trading profits) and nonreportable traders (usually small traders/speculators) as well as their open interest (contracts open in the market at time of reporting). See CFTC criteria here.

Mid-Week Technical Outlook: NQ100_m waits on Fed rate decision

By ForexTime 

  • NQ100_m hits fresh 2023 high yesterday
  • Index could be rocked by looming Fed decision
  • Bulls in control but RSI overbought on D1 chart
  • Levels of interest at 16770.6, 16100 & 15800

The NQ100_m jumped to a fresh 2023 high in the previous session after signs of slowing inflation supported hopes around the Fed cutting interest rates next year.

November’s inflation report painted a mixed picture with annual consumer prices slipping to 3.1%, down from 3.2% in October. The annual core figure, which strips out volatile energy and food prices rose by 4% in line with the prior month. However, the monthly core figure rose 0.3%, slightly faster than 0.2% in the previous month.

While traders are still pricing in a 25-basis point cut by May 2024, this could be influenced by the Fed decision later today.

As highlighted in our week ahead report, the central bank is widely expected to leave rates unchanged, so focus will be on the updated economic projections, “dot plot” and Powell’s press conference.

Whatever the outcome of the Fed meeting, it could rock the NQ100_m which is filled with tech stocks that remain sensitive to interest rates.

Redirecting our attention back to the technicals…

The NQ100_m is respecting a bullish channel on the weekly charts with the next key level at the all-time high of 16770.6 created back in November 2021.

It is a similar story on the daily charts with bulls clearly in a position of power. There have been consistently higher highs and higher lows while prices are trading well above the 50, 100, and 200-day SMA. However, the Relative Strength Index (RSI) is trading above 70, signalling that prices are heavily overbought, suggesting a potential throwback down the road.

  • Should 16100 prove to be reliable support, this may provide a foundation for bulls to charge towards 16770.6

  • A move back below 16100 could trigger a selloff towards 15800 and 15540.


Forex-Time-LogoArticle by ForexTime

ForexTime Ltd (FXTM) is an award winning international online forex broker regulated by CySEC 185/12 www.forextime.com

AI’s impact on 3 key industries will pique investors’ interest in 2024

By George Prior 

Investors should strategically position their portfolios in 2024 to capitalize on the opportunities offered by AI for certain sectors, says the CEO and founder of one of the world’s largest financial advisory and asset management organizations.

deVere Group’s Nigel Green is speaking out after what has been a pivotal year in the AI space, characterized by major company moves from tech titans, pioneering initiatives, groundbreaking product launches, huge investments and strategic acquisitions.

He says: “AI stands at the forefront of technological innovation, poised to catalyze a profound transformation across industries. The potential for a significant boost in productivity is particularly evident in sectors such as financials, airlines, and healthcare.

“The financial industry is experiencing a paradigm shift with the integration of AI technologies. Machine learning algorithms, natural language processing, and predictive analytics are revolutionising processes, from risk management to customer service.

“AI-driven insights enable financial institutions to make data-driven decisions, enhance fraud detection, and streamline operations. Investors should consider seizing potential opportunities in this sector by looking at investments in fintech companies and financial institutions embracing AI to gain a competitive edge.

He continues: “AI-powered algorithms can analyze vast datasets and execute trades with speed and precision, providing a potential boost to investment returns – as such, investors could consider exposure to funds or companies specializing in algorithmic trading strategies.

“Also, as AI enhances risk assessment by analyzing complex patterns and identifying potential threats, investors may find opportunities in companies developing innovative risk management solutions for financial institutions.”

The aviation industry is ripe for AI-driven productivity enhancements, from optimizing flight routes to enhancing customer experience. AI’s potential impact on airlines extends to fuel efficiency, predictive maintenance, and personalised services.

Algorithms can analyse historical data, weather patterns, and other variables to optimize flight routes, reducing fuel consumption and operational costs. In addition, chatbots and virtual assistants powered by AI can streamline customer interactions, providing real-time support and personalized services.

“Savvy investors are likely to explore opportunities in airlines adopting AI for route optimization; and companies investing in AI-driven customer service solutions may present attractive investment opportunities.”

Moving onto healthcare, AI is becoming a transformative force, contributing to improved diagnostics, personalized treatment plans, and operational efficiencies. As the industry embraces AI-driven innovations, investors can position their portfolios to benefit from the growth potential.

AI algorithms can analyze medical images and data to enhance diagnostic accuracy. It can also accelerate the drug discovery process by studying biological data and identifying potential drug candidates.

“Companies developing AI-powered diagnostic tools and technologies may present investment opportunities in the healthcare sector, and investors may consider pharma companies leveraging AI for drug development.”

The deVere CEO says there are three main reasons why investors should position their portfolios accordingly.

First, innovation potential. “Industries integrating AI are likely to experience unprecedented innovation, creating opportunities for investors to capitalise on the growth of forward-thinking companies at the forefront of technological advancement.

Second, competitive advantage: “Companies embracing AI technologies gain a competitive edge by improving efficiency, reducing costs, and enhancing decision-making processes. Investors positioning their portfolios in such companies could benefit from their ability to outperform industry peers.”

Third long-term growth: “AI’s transformative impact is not a fleeting trend; it represents a long-term paradigm shift. As such, investors with a strategic focus on AI-driven sectors could position their portfolios for sustained growth over the coming years.

Nigel Green concludes: “Artificial Intelligence’s potential to boost productivity in industries like financials, airlines, and healthcare is a compelling narrative for investors.

“By strategically positioning portfolios to capture opportunities in companies at the forefront of AI adoption, investors can align themselves with the transformative forces shaping the future of these industries.”

About:

deVere Group is one of the world’s largest independent advisors of specialist global financial solutions to international, local mass affluent, and high-net-worth clients.  It has a network of more than 70 offices across the world, over 80,000 clients and $12bn under advisement.


Trade Of The Week: SPX500_m gearing up for event heavy week

By ForexTime 

  • SPX500_m hits new 2023 high last Friday
  • Stock index set to be injected with fresh volatility
  • Keep eye on US CPI and Fed decision
  • SPX500_m bullish on D1 chart but RSI signals overbought
  • Key levels of interest at 4640, 4600 and 4545

After hitting a new 2023 high last Friday, the SPX500_m could be injected with fresh volatility this week due to a series of high-risk events.

US equity bulls remain in the driver’s seat with the SPX500_m bagging its sixth week of gains after the strong US jobs data boosted hopes around the US economy avoiding a recession. The stock Index has also drawn strength from growing bets over the Federal Reserve cutting interest rates next year amid slowing inflation.

Taking a brief peek at the technicals, prices are trending higher on the daily charts. Despite the recent breakout above 4600, it may be worth keeping an eye on the range with support found at 4545.

The next few days could be wild for the SPX500_m and here are 3 reasons why:

       1. US data dump

It’s a big week for the US economy thanks to top-tier economic reports including the highly anticipated US CPI report on Tuesday.

This crucial inflation report along with the latest retail sales and industrial production among others could influence bets around what the Fed will do beyond 2023. As highlighted in our week ahead report, headline inflation is expected to have cooled further due to falling energy prices, while the annual core inflation to remain unchanged.

Given how the S&P 500 Index has a handful of tech stocks that remain sensitive to interest rate expectations, the incoming US inflation figures have the ability to rock the index.

  • The SPX500_m could pull away from the 2023 high if the inflation report exceeds market forecasts.
  • Should the inflation numbers print below expectations, this could push the index higher as Fed rate cut bets jump.

       2. Fed rate decision

Markets widely expect the Federal Reserve to leave rates unchanged on Wednesday, so the focus falls on the updated economic projections and dot plots for fresh clarity on its next move.

  • The SPX500_m could push higher if the doves dominate the scene with the Fed signalling cuts in 2024.
  • If the Fed pushes back hopes for rate cuts and reiterates the higher for longer mantra, this may pull the SPX500_m lower.

Note: Looking beyond US data and the Fed decision, it may be worth keeping an eye on the “Triple witching”. 

US markets may see a sudden jump in volumes on Friday as Futures and Options contracts on Stocks and Indices expire in what is called “Triple witching”. This happens once a quarter and has the potential to cause some market volatility.

       3. Technical forces

Regarding the technical picture, prices are firmly bullish on the daily charts. There have been consistently higher highs and higher lows while prices are trading above the 50, 100 and 200-day SMA. However, the Relative Strength Index (RSI) remains around 70 suggesting that prices are heavily overbought. A technical throwback could be on the table before the index pushes higher.

  • Should prices stay above the 4600 level, this may open a path towards the 4640 level – the highest level touched in March 2022.
  • Sustained below 4600 may trigger a selloff back towards 4525
  • Should 4525 prove to be unreliable support, a decline back towards 4500 and 4470 could be on the cards.


Forex-Time-LogoArticle by ForexTime

ForexTime Ltd (FXTM) is an award winning international online forex broker regulated by CySEC 185/12 www.forextime.com

COT Stock Market Charts: Speculator Bets led higher by DowJones & S&P500 Minis

By InvestMacro

Here are the latest charts and statistics for the Commitment of Traders (COT) data published by the Commodities Futures Trading Commission (CFTC).

The latest COT data is updated through Tuesday December 5th and shows a quick view of how large traders (for-profit speculators and commercial entities) were positioned in the futures markets.

Weekly Speculator Changes led by DowJones-Mini & S&P500-Mini
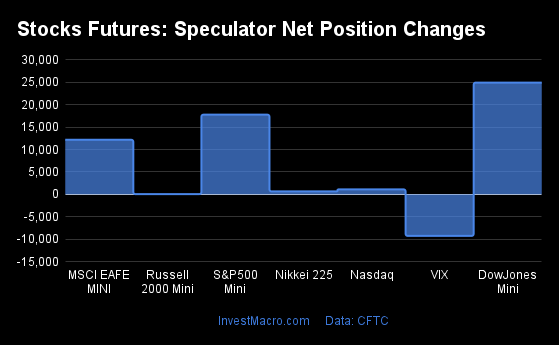
The COT stock markets speculator bets were higher this week as six out of the seven stock markets we cover had higher positioning while one market had lower speculator contracts.

Leading the gains for the stock markets was the DowJones-Mini (24,916 contracts) with the S&P500-Mini (17,766 contracts) the MSCI EAFE-Mini (12,174 contracts), the Nikkei 225 Yen (2,394 contracts), the Nasdaq-Mini (1,124 contracts), the Nikkei 225 (670 contracts) and the Russell-Mini (64 contracts),also showing positive weeks.

The only market with a decline in the speculator bets this week was the VIX (-9,241 contracts).


Data Snapshot of Stock Market Traders | Columns Legend
Dec-05-2023OIOI-IndexSpec-NetSpec-IndexCom-NetCOM-IndexSmalls-NetSmalls-Index
S&P500-Mini2,314,40031-47,26158-954047,35656
Nikkei 22519,91460-1,690551,0364265439
Nasdaq-Mini277,746618,40252-13,580275,17885
DowJones-Mini94,87055308812,83333-3,14129
VIX406,71175-56,7777157,87126-1,09491
Nikkei 225 Yen65,6776517,459882,06117-19,52044


Strength Scores led by DowJones-Mini & VIX
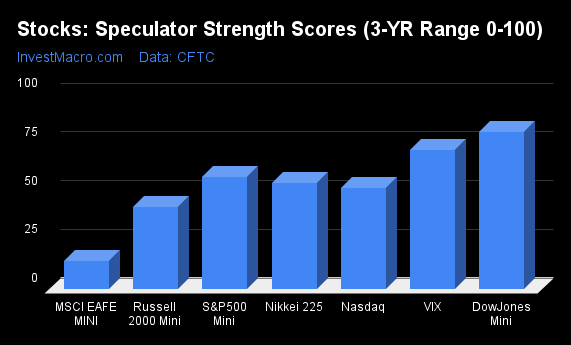
COT Strength Scores (a normalized measure of Speculator positions over a 3-Year range, from 0 to 100 where above 80 is Extreme-Bullish and below 20 is Extreme-Bearish) showed that the DowJones-Mini (81 percent) leads the stock markets this week. The VIX (71 percent) and S&P500-Mini (58 percent) come in as the next highest in the weekly strength scores.

On the downside, the MSCI EAFE-Mini (14 percent) comes in at the lowest strength level currently and is in Extreme-Bearish territory (below 20 percent).

Strength Statistics:
VIX (71.3 percent) vs VIX previous week (77.5 percent)
S&P500-Mini (57.7 percent) vs S&P500-Mini previous week (55.0 percent)
DowJones-Mini (80.8 percent) vs DowJones-Mini previous week (26.9 percent)
Nasdaq-Mini (51.9 percent) vs Nasdaq-Mini previous week (50.1 percent)
Russell2000-Mini (42.2 percent) vs Russell2000-Mini previous week (42.1 percent)
Nikkei USD (54.5 percent) vs Nikkei USD previous week (49.8 percent)
EAFE-Mini (14.1 percent) vs EAFE-Mini previous week (2.1 percent)


DowJones-Mini top the 6-Week Strength Trends
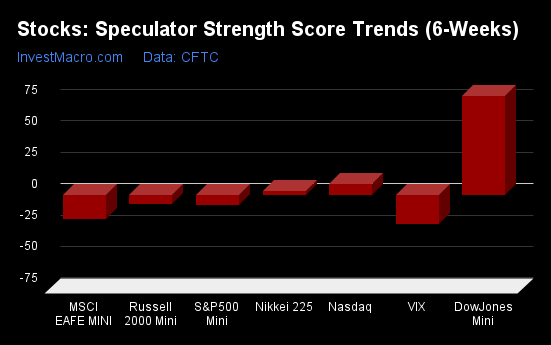
COT Strength Score Trends (or move index, calculates the 6-week changes in strength scores) showed that the DowJones-Mini (78 percent) leads the past six weeks trends for the stock markets. The  Nasdaq-Mini (9 percent) and the Nikkei 225 (3 percent) are the next highest positive movers in the latest trends data.

The VIX (-24 percent) leads the downside trend scores currently with the MSCI EAFE-Mini (-19 percent) coming in as the next market with lower trend scores.

Strength Trend Statistics:
VIX (-23.6 percent) vs VIX previous week (-16.5 percent)
S&P500-Mini (-8.6 percent) vs S&P500-Mini previous week (-0.3 percent)
DowJones-Mini (78.4 percent) vs DowJones-Mini previous week (22.9 percent)
Nasdaq-Mini (8.8 percent) vs Nasdaq-Mini previous week (-10.9 percent)
Russell2000-Mini (-7.4 percent) vs Russell2000-Mini previous week (-6.6 percent)
Nikkei USD (3.1 percent) vs Nikkei USD previous week (-0.7 percent)
EAFE-Mini (-19.1 percent) vs EAFE-Mini previous week (-33.3 percent)


Individual Stock Market Charts:

VIX Volatility Futures:
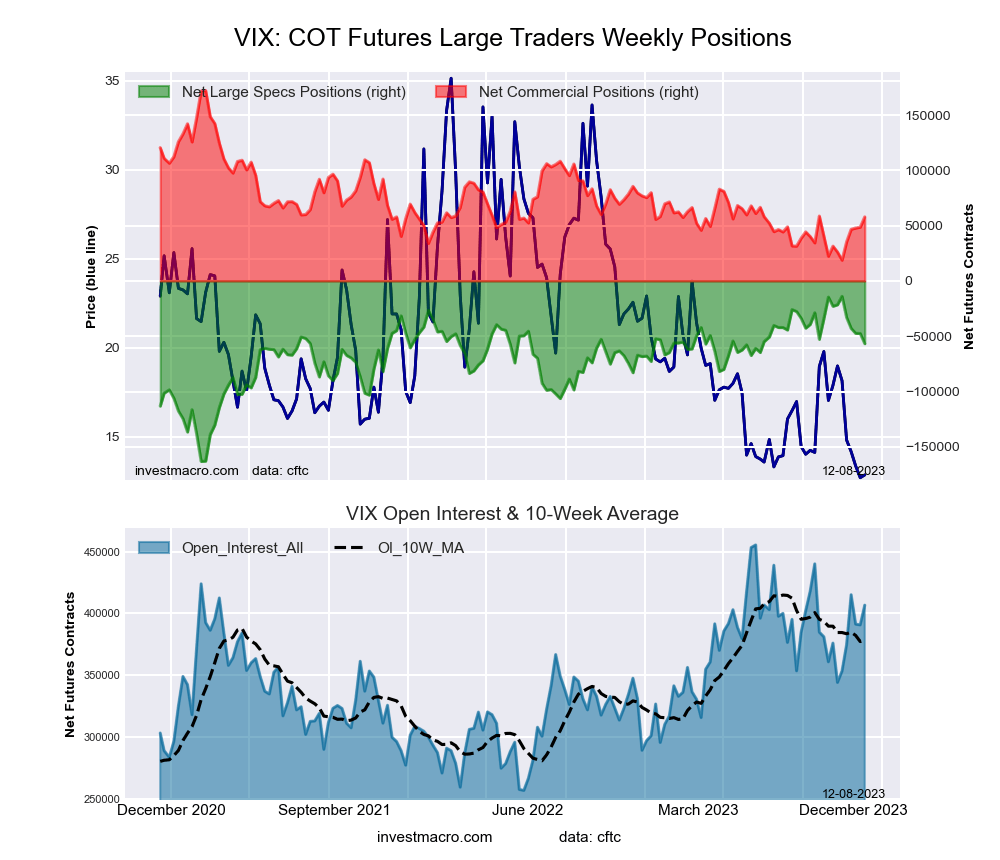
VIX Volatility Futures COT ChartThe VIX Volatility large speculator standing this week reached a net position of -56,777 contracts in the data reported through Tuesday. This was a weekly reduction of -9,241 contracts from the previous week which had a total of -47,536 net contracts.

This week’s current strength score (the trader positioning range over the past three years, measured from 0 to 100) shows the speculators are currently Bullish with a score of 71.3 percent. The commercials are Bearish with a score of 25.5 percent and the small traders (not shown in chart) are Bullish-Extreme with a score of 90.9 percent.

Price Trend-Following Model: Strong Downtrend

Our weekly trend-following model classifies the current market price position as: Strong Downtrend. The current action for the model is considered to be: New Sell – Short Position.

VIX Volatility Futures StatisticsSPECULATORSCOMMERCIALSSMALL TRADERS
– Percent of Open Interest Longs:22.649.96.8
– Percent of Open Interest Shorts:36.635.77.1
– Net Position:-56,77757,871-1,094
– Gross Longs:92,021202,88927,743
– Gross Shorts:148,798145,01828,837
– Long to Short Ratio:0.6 to 11.4 to 11.0 to 1
NET POSITION TREND:
– Strength Index Score (3 Year Range Pct):71.325.590.9
– Strength Index Reading (3 Year Range):BullishBearishBullish-Extreme
NET POSITION MOVEMENT INDEX:
– 6-Week Change in Strength Index:-23.620.717.2


S&P500 Mini Futures:

SP500 Mini Futures COT ChartThe S&P500 Mini large speculator standing this week reached a net position of -47,261 contracts in the data reported through Tuesday. This was a weekly rise of 17,766 contracts from the previous week which had a total of -65,027 net contracts.

This week’s current strength score (the trader positioning range over the past three years, measured from 0 to 100) shows the speculators are currently Bullish with a score of 57.7 percent. The commercials are Bearish with a score of 39.9 percent and the small traders (not shown in chart) are Bullish with a score of 56.0 percent.

Price Trend-Following Model: Weak Downtrend (Possible Trend Change)

Our weekly trend-following model classifies the current market price position as: Weak Downtrend. The current action for the model is considered to be: Hold – Maintain Short Position.

S&P500 Mini Futures StatisticsSPECULATORSCOMMERCIALSSMALL TRADERS
– Percent of Open Interest Longs:11.473.711.3
– Percent of Open Interest Shorts:13.573.79.3
– Net Position:-47,261-9547,356
– Gross Longs:264,2091,706,068261,634
– Gross Shorts:311,4701,706,163214,278
– Long to Short Ratio:0.8 to 11.0 to 11.2 to 1
NET POSITION TREND:
– Strength Index Score (3 Year Range Pct):57.739.956.0
– Strength Index Reading (3 Year Range):BullishBearishBullish
NET POSITION MOVEMENT INDEX:
– 6-Week Change in Strength Index:-8.64.89.0


Dow Jones Mini Futures:

Dow Jones Mini Futures COT ChartThe Dow Jones Mini large speculator standing this week reached a net position of 308 contracts in the data reported through Tuesday. This was a weekly increase of 24,916 contracts from the previous week which had a total of -24,608 net contracts.

This week’s current strength score (the trader positioning range over the past three years, measured from 0 to 100) shows the speculators are currently Bullish-Extreme with a score of 80.8 percent. The commercials are Bearish with a score of 32.9 percent and the small traders (not shown in chart) are Bearish with a score of 28.6 percent.

Price Trend-Following Model: Strong Uptrend

Our weekly trend-following model classifies the current market price position as: Strong Uptrend. The current action for the model is considered to be: New Buy – Long Position.

Dow Jones Mini Futures StatisticsSPECULATORSCOMMERCIALSSMALL TRADERS
– Percent of Open Interest Longs:27.756.413.9
– Percent of Open Interest Shorts:27.353.417.3
– Net Position:3082,833-3,141
– Gross Longs:26,25353,46513,228
– Gross Shorts:25,94550,63216,369
– Long to Short Ratio:1.0 to 11.1 to 10.8 to 1
NET POSITION TREND:
– Strength Index Score (3 Year Range Pct):80.832.928.6
– Strength Index Reading (3 Year Range):Bullish-ExtremeBearishBearish
NET POSITION MOVEMENT INDEX:
– 6-Week Change in Strength Index:78.4-62.12.7


Nasdaq Mini Futures:

Nasdaq Mini Futures COT ChartThe Nasdaq Mini large speculator standing this week reached a net position of 8,402 contracts in the data reported through Tuesday. This was a weekly boost of 1,124 contracts from the previous week which had a total of 7,278 net contracts.

This week’s current strength score (the trader positioning range over the past three years, measured from 0 to 100) shows the speculators are currently Bullish with a score of 51.9 percent. The commercials are Bearish with a score of 27.4 percent and the small traders (not shown in chart) are Bullish-Extreme with a score of 85.3 percent.

Price Trend-Following Model: Strong Uptrend

Our weekly trend-following model classifies the current market price position as: Strong Uptrend. The current action for the model is considered to be: Hold – Maintain Long Position.

Nasdaq Mini Futures StatisticsSPECULATORSCOMMERCIALSSMALL TRADERS
– Percent of Open Interest Longs:27.156.014.9
– Percent of Open Interest Shorts:24.160.813.0
– Net Position:8,402-13,5805,178
– Gross Longs:75,200155,41841,346
– Gross Shorts:66,798168,99836,168
– Long to Short Ratio:1.1 to 10.9 to 11.1 to 1
NET POSITION TREND:
– Strength Index Score (3 Year Range Pct):51.927.485.3
– Strength Index Reading (3 Year Range):BullishBearishBullish-Extreme
NET POSITION MOVEMENT INDEX:
– 6-Week Change in Strength Index:8.8-11.88.9


Russell 2000 Mini Futures:

Russell 2000 Mini Futures COT ChartThe Russell 2000 Mini large speculator standing this week reached a net position of -55,429 contracts in the data reported through Tuesday. This was a weekly lift of 64 contracts from the previous week which had a total of -55,493 net contracts.

This week’s current strength score (the trader positioning range over the past three years, measured from 0 to 100) shows the speculators are currently Bearish with a score of 42.2 percent. The commercials are Bullish with a score of 57.7 percent and the small traders (not shown in chart) are Bearish with a score of 40.6 percent.

Price Trend-Following Model: Weak Downtrend (Possible Trend Change)

Our weekly trend-following model classifies the current market price position as: Weak Downtrend. The current action for the model is considered to be: Hold – Maintain Short Position.

Russell 2000 Mini Futures StatisticsSPECULATORSCOMMERCIALSSMALL TRADERS
– Percent of Open Interest Longs:12.481.84.9
– Percent of Open Interest Shorts:22.372.64.1
– Net Position:-55,42950,9004,529
– Gross Longs:69,069455,71027,535
– Gross Shorts:124,498404,81023,006
– Long to Short Ratio:0.6 to 11.1 to 11.2 to 1
NET POSITION TREND:
– Strength Index Score (3 Year Range Pct):42.257.740.6
– Strength Index Reading (3 Year Range):BearishBullishBearish
NET POSITION MOVEMENT INDEX:
– 6-Week Change in Strength Index:-7.43.715.1


Nikkei Stock Average (USD) Futures:

Nikkei Stock Average (USD) Futures COT ChartThe Nikkei Stock Average (USD) large speculator standing this week reached a net position of -1,690 contracts in the data reported through Tuesday. This was a weekly increase of 670 contracts from the previous week which had a total of -2,360 net contracts.

This week’s current strength score (the trader positioning range over the past three years, measured from 0 to 100) shows the speculators are currently Bullish with a score of 54.5 percent. The commercials are Bearish with a score of 42.2 percent and the small traders (not shown in chart) are Bearish with a score of 39.4 percent.

Price Trend-Following Model: Strong Uptrend

Our weekly trend-following model classifies the current market price position as: Strong Uptrend. The current action for the model is considered to be: New Buy – Long Position.

Nikkei Stock Average Futures StatisticsSPECULATORSCOMMERCIALSSMALL TRADERS
– Percent of Open Interest Longs:10.268.219.9
– Percent of Open Interest Shorts:18.763.016.6
– Net Position:-1,6901,036654
– Gross Longs:2,02913,5873,953
– Gross Shorts:3,71912,5513,299
– Long to Short Ratio:0.5 to 11.1 to 11.2 to 1
NET POSITION TREND:
– Strength Index Score (3 Year Range Pct):54.542.239.4
– Strength Index Reading (3 Year Range):BullishBearishBearish
NET POSITION MOVEMENT INDEX:
– 6-Week Change in Strength Index:3.12.1-10.6


MSCI EAFE Mini Futures:

MSCI EAFE Mini Futures COT ChartThe MSCI EAFE Mini large speculator standing this week reached a net position of -49,858 contracts in the data reported through Tuesday. This was a weekly increase of 12,174 contracts from the previous week which had a total of -62,032 net contracts.

This week’s current strength score (the trader positioning range over the past three years, measured from 0 to 100) shows the speculators are currently Bearish-Extreme with a score of 14.1 percent. The commercials are Bullish-Extreme with a score of 84.0 percent and the small traders (not shown in chart) are Bearish with a score of 41.5 percent.

Price Trend-Following Model: Weak Downtrend (Possible Trend Change)

Our weekly trend-following model classifies the current market price position as: Weak Downtrend. The current action for the model is considered to be: Hold – Maintain Short Position.

MSCI EAFE Mini Futures StatisticsSPECULATORSCOMMERCIALSSMALL TRADERS
– Percent of Open Interest Longs:5.591.02.9
– Percent of Open Interest Shorts:17.879.91.7
– Net Position:-49,85844,9414,917
– Gross Longs:22,286369,01511,661
– Gross Shorts:72,144324,0746,744
– Long to Short Ratio:0.3 to 11.1 to 11.7 to 1
NET POSITION TREND:
– Strength Index Score (3 Year Range Pct):14.184.041.5
– Strength Index Reading (3 Year Range):Bearish-ExtremeBullish-ExtremeBearish
NET POSITION MOVEMENT INDEX:
– 6-Week Change in Strength Index:-19.115.715.5


Article By InvestMacroReceive our weekly COT Newsletter

*COT Report: The COT data, released weekly to the public each Friday, is updated through the most recent Tuesday (data is 3 days old) and shows a quick view of how large speculators or non-commercials (for-profit traders) were positioned in the futures markets.

The CFTC categorizes trader positions according to commercial hedgers (traders who use futures contracts for hedging as part of the business), non-commercials (large traders who speculate to realize trading profits) and nonreportable traders (usually small traders/speculators) as well as their open interest (contracts open in the market at time of reporting). See CFTC criteria here.

COT Stock Market Charts: Speculator Bets led by S&P500-Mini & DowJones-Mini

By InvestMacro

Here are the latest charts and statistics for the Commitment of Traders (COT) data published by the Commodities Futures Trading Commission (CFTC).

The latest COT data is updated through Tuesday November 28th and shows a quick view of how large traders (for-profit speculators and commercial entities) were positioned in the futures markets.

Weekly Speculator Changes led by S&P500-Mini & DowJones-Mini

The COT stock markets speculator bets were higher this week as four out of the seven stock markets we cover had higher positioning while the other three markets had lower speculator contracts.

Leading the gains for the stock markets was the S&P500-Mini (15,053 contracts) with the DowJones-Mini (9,700 contracts), the Nasdaq-Mini (2,234 contracts) and the Russell-Mini (1,753 contracts) also showing positive weeks.

The markets with the declines in speculator bets this week were the MSCI EAFE-Mini (-3,786 contracts), the VIX (-105 contracts) and the Nikkei 225 (-121 contracts) also registering lower bets on the week.


Data Snapshot of Stock Market Traders | Columns Legend
Nov-28-2023OIOI-IndexSpec-NetSpec-IndexCom-NetCOM-IndexSmalls-NetSmalls-Index
S&P500-Mini2,279,89428-65,0275521,9594343,06854
Nikkei 22517,20443-2,360501,5044585639
Nasdaq-Mini293,315757,27850-10,902313,62481
DowJones-Mini98,35761-24,6082729,42778-4,81920
VIX390,75267-47,5367848,57619-1,04091
Nikkei 225 Yen65,6796515,065814,80124-19,86643


Strength Scores led by the VIX

COT Strength Scores (a normalized measure of Speculator positions over a 3-Year range, from 0 to 100 where above 80 is Extreme-Bullish and below 20 is Extreme-Bearish) showed that the VIX (78 percent) leads the stock markets this week. The S&P500-Mini (55 percent) and the Nikkei 225 (50 percent) come in as the next highest in the weekly strength scores.

On the downside, the MSCI EAFE-Mini (2 percent) comes in at the lowest strength level currently and is in Extreme-Bearish territory (below 20 percent). The next lowest strength score is the DowJones-Mini (27 percent).

Strength Statistics:
VIX (77.5 percent) vs VIX previous week (77.6 percent)
S&P500-Mini (55.0 percent) vs S&P500-Mini previous week (52.8 percent)
DowJones-Mini (26.9 percent) vs DowJones-Mini previous week (6.0 percent)
Nasdaq-Mini (50.1 percent) vs Nasdaq-Mini previous week (46.7 percent)
Russell2000-Mini (42.1 percent) vs Russell2000-Mini previous week (41.0 percent)
Nikkei USD (49.8 percent) vs Nikkei USD previous week (50.7 percent)
EAFE-Mini (2.0 percent) vs EAFE-Mini previous week (5.4 percent)


DowJones-Mini tops the 6-Week Strength Trends

COT Strength Score Trends (or move index, calculates the 6-week changes in strength scores) showed that the DowJones-Mini (23 percent) leads the past six weeks trends for the stock markets.

The MSCI EAFE-Mini (-31 percent) leads the downside trend scores currently with the VIX (-16 percent) coming in as the next market with lower trend scores.

Strength Trend Statistics:
VIX (-16.5 percent) vs VIX previous week (-21.9 percent)
S&P500-Mini (-0.3 percent) vs S&P500-Mini previous week (2.1 percent)
DowJones-Mini (22.9 percent) vs DowJones-Mini previous week (0.7 percent)
Nasdaq-Mini (-10.9 percent) vs Nasdaq-Mini previous week (-4.3 percent)
Russell2000-Mini (-6.6 percent) vs Russell2000-Mini previous week (6.1 percent)
Nikkei USD (-0.7 percent) vs Nikkei USD previous week (-4.5 percent)
EAFE-Mini (-30.9 percent) vs EAFE-Mini previous week (-28.4 percent)


Individual Stock Market Charts:

VIX Volatility Futures:

VIX Volatility Futures COT ChartThe VIX Volatility large speculator standing this week resulted in a net position of -47,536 contracts in the data reported through Tuesday. This was a weekly decrease of -105 contracts from the previous week which had a total of -47,431 net contracts.

This week’s current strength score (the trader positioning range over the past three years, measured from 0 to 100) shows the speculators are currently Bullish with a score of 77.5 percent. The commercials are Bearish-Extreme with a score of 19.5 percent and the small traders (not shown in chart) are Bullish-Extreme with a score of 91.1 percent.

Price Trend-Following Model: Weak Uptrend (Possible Trend Change)

Our weekly trend-following model classifies the current market price position as: Weak Uptrend. The current action for the model is considered to be: Hold – Maintain Long Position.

VIX Volatility Futures StatisticsSPECULATORSCOMMERCIALSSMALL TRADERS
– Percent of Open Interest Longs:23.148.96.7
– Percent of Open Interest Shorts:35.336.57.0
– Net Position:-47,53648,576-1,040
– Gross Longs:90,304191,02526,270
– Gross Shorts:137,840142,44927,310
– Long to Short Ratio:0.7 to 11.3 to 11.0 to 1
NET POSITION TREND:
– Strength Index Score (3 Year Range Pct):77.519.591.1
– Strength Index Reading (3 Year Range):BullishBearish-ExtremeBullish-Extreme
NET POSITION MOVEMENT INDEX:
– 6-Week Change in Strength Index:-16.511.238.0


S&P500 Mini Futures:

SP500 Mini Futures COT ChartThe S&P500 Mini large speculator standing this week resulted in a net position of -65,027 contracts in the data reported through Tuesday. This was a weekly lift of 15,053 contracts from the previous week which had a total of -80,080 net contracts.

This week’s current strength score (the trader positioning range over the past three years, measured from 0 to 100) shows the speculators are currently Bullish with a score of 55.0 percent. The commercials are Bearish with a score of 42.9 percent and the small traders (not shown in chart) are Bullish with a score of 54.3 percent.

Price Trend-Following Model: Weak Downtrend (Possible Trend Change)

Our weekly trend-following model classifies the current market price position as: Weak Downtrend. The current action for the model is considered to be: Hold – Maintain Short Position.

S&P500 Mini Futures StatisticsSPECULATORSCOMMERCIALSSMALL TRADERS
– Percent of Open Interest Longs:12.473.311.4
– Percent of Open Interest Shorts:15.272.39.5
– Net Position:-65,02721,95943,068
– Gross Longs:281,7091,671,401258,805
– Gross Shorts:346,7361,649,442215,737
– Long to Short Ratio:0.8 to 11.0 to 11.2 to 1
NET POSITION TREND:
– Strength Index Score (3 Year Range Pct):55.042.954.3
– Strength Index Reading (3 Year Range):BullishBearishBullish
NET POSITION MOVEMENT INDEX:
– 6-Week Change in Strength Index:-0.3-2.99.1


Dow Jones Mini Futures:

Dow Jones Mini Futures COT ChartThe Dow Jones Mini large speculator standing this week resulted in a net position of -24,608 contracts in the data reported through Tuesday. This was a weekly advance of 9,700 contracts from the previous week which had a total of -34,308 net contracts.

This week’s current strength score (the trader positioning range over the past three years, measured from 0 to 100) shows the speculators are currently Bearish with a score of 26.9 percent. The commercials are Bullish with a score of 77.8 percent and the small traders (not shown in chart) are Bearish with a score of 20.4 percent.

Price Trend-Following Model: Weak Downtrend (Possible Trend Change)

Our weekly trend-following model classifies the current market price position as: Weak Downtrend. The current action for the model is considered to be: Hold – Maintain Short Position.

Dow Jones Mini Futures StatisticsSPECULATORSCOMMERCIALSSMALL TRADERS
– Percent of Open Interest Longs:22.665.011.9
– Percent of Open Interest Shorts:47.635.116.8
– Net Position:-24,60829,427-4,819
– Gross Longs:22,19663,96311,679
– Gross Shorts:46,80434,53616,498
– Long to Short Ratio:0.5 to 11.9 to 10.7 to 1
NET POSITION TREND:
– Strength Index Score (3 Year Range Pct):26.977.820.4
– Strength Index Reading (3 Year Range):BearishBullishBearish
NET POSITION MOVEMENT INDEX:
– 6-Week Change in Strength Index:22.9-18.31.1


Nasdaq Mini Futures:

Nasdaq Mini Futures COT ChartThe Nasdaq Mini large speculator standing this week resulted in a net position of 7,278 contracts in the data reported through Tuesday. This was a weekly gain of 2,234 contracts from the previous week which had a total of 5,044 net contracts.

This week’s current strength score (the trader positioning range over the past three years, measured from 0 to 100) shows the speculators are currently Bullish with a score of 50.1 percent. The commercials are Bearish with a score of 30.8 percent and the small traders (not shown in chart) are Bullish-Extreme with a score of 81.4 percent.

Price Trend-Following Model: Strong Uptrend

Our weekly trend-following model classifies the current market price position as: Strong Uptrend. The current action for the model is considered to be: New Buy – Long Position.

Nasdaq Mini Futures StatisticsSPECULATORSCOMMERCIALSSMALL TRADERS
– Percent of Open Interest Longs:26.856.714.5
– Percent of Open Interest Shorts:24.460.413.3
– Net Position:7,278-10,9023,624
– Gross Longs:78,702166,32942,502
– Gross Shorts:71,424177,23138,878
– Long to Short Ratio:1.1 to 10.9 to 11.1 to 1
NET POSITION TREND:
– Strength Index Score (3 Year Range Pct):50.130.881.4
– Strength Index Reading (3 Year Range):BullishBearishBullish-Extreme
NET POSITION MOVEMENT INDEX:
– 6-Week Change in Strength Index:-10.91.515.0


Russell 2000 Mini Futures:

Russell 2000 Mini Futures COT ChartThe Russell 2000 Mini large speculator standing this week resulted in a net position of -55,493 contracts in the data reported through Tuesday. This was a weekly increase of 1,753 contracts from the previous week which had a total of -57,246 net contracts.

This week’s current strength score (the trader positioning range over the past three years, measured from 0 to 100) shows the speculators are currently Bearish with a score of 42.1 percent. The commercials are Bullish with a score of 58.4 percent and the small traders (not shown in chart) are Bearish with a score of 36.9 percent.

Price Trend-Following Model: Downtrend

Our weekly trend-following model classifies the current market price position as: Downtrend. The current action for the model is considered to be: Hold – Maintain Short Position.

Russell 2000 Mini Futures StatisticsSPECULATORSCOMMERCIALSSMALL TRADERS
– Percent of Open Interest Longs:13.780.64.9
– Percent of Open Interest Shorts:23.771.14.2
– Net Position:-55,49352,1493,344
– Gross Longs:75,264444,00126,746
– Gross Shorts:130,757391,85223,402
– Long to Short Ratio:0.6 to 11.1 to 11.1 to 1
NET POSITION TREND:
– Strength Index Score (3 Year Range Pct):42.158.436.9
– Strength Index Reading (3 Year Range):BearishBullishBearish
NET POSITION MOVEMENT INDEX:
– 6-Week Change in Strength Index:-6.60.926.0


Nikkei Stock Average (USD) Futures:

Nikkei Stock Average (USD) Futures COT ChartThe Nikkei Stock Average (USD) large speculator standing this week resulted in a net position of -2,360 contracts in the data reported through Tuesday. This was a weekly fall of -121 contracts from the previous week which had a total of -2,239 net contracts.

This week’s current strength score (the trader positioning range over the past three years, measured from 0 to 100) shows the speculators are currently Bearish with a score of 49.8 percent. The commercials are Bearish with a score of 45.0 percent and the small traders (not shown in chart) are Bearish with a score of 39.1 percent.

Price Trend-Following Model: Weak Downtrend

Our weekly trend-following model classifies the current market price position as: Weak Downtrend. The current action for the model is considered to be: Hold – Maintain Short Position.

Nikkei Stock Average Futures StatisticsSPECULATORSCOMMERCIALSSMALL TRADERS
– Percent of Open Interest Longs:13.165.121.5
– Percent of Open Interest Shorts:26.856.416.5
– Net Position:-2,3601,504856
– Gross Longs:2,25011,2043,693
– Gross Shorts:4,6109,7002,837
– Long to Short Ratio:0.5 to 11.2 to 11.3 to 1
NET POSITION TREND:
– Strength Index Score (3 Year Range Pct):49.845.039.1
– Strength Index Reading (3 Year Range):BearishBearishBearish
NET POSITION MOVEMENT INDEX:
– 6-Week Change in Strength Index:-0.71.3-1.4


MSCI EAFE Mini Futures:

MSCI EAFE Mini Futures COT ChartThe MSCI EAFE Mini large speculator standing this week resulted in a net position of -62,032 contracts in the data reported through Tuesday. This was a weekly reduction of -3,786 contracts from the previous week which had a total of -58,246 net contracts.

This week’s current strength score (the trader positioning range over the past three years, measured from 0 to 100) shows the speculators are currently Bearish-Extreme with a score of 2.0 percent. The commercials are Bullish-Extreme with a score of 96.1 percent and the small traders (not shown in chart) are Bearish with a score of 40.9 percent.

Price Trend-Following Model: Weak Downtrend

Our weekly trend-following model classifies the current market price position as: Weak Downtrend. The current action for the model is considered to be: Hold – Maintain Short Position.

MSCI EAFE Mini Futures StatisticsSPECULATORSCOMMERCIALSSMALL TRADERS
– Percent of Open Interest Longs:4.891.43.0
– Percent of Open Interest Shorts:20.077.31.9
– Net Position:-62,03257,2524,780
– Gross Longs:19,593372,69312,373
– Gross Shorts:81,625315,4417,593
– Long to Short Ratio:0.2 to 11.2 to 11.6 to 1
NET POSITION TREND:
– Strength Index Score (3 Year Range Pct):2.096.140.9
– Strength Index Reading (3 Year Range):Bearish-ExtremeBullish-ExtremeBearish
NET POSITION MOVEMENT INDEX:
– 6-Week Change in Strength Index:-30.929.211.4


Article By InvestMacroReceive our weekly COT Newsletter

*COT Report: The COT data, released weekly to the public each Friday, is updated through the most recent Tuesday (data is 3 days old) and shows a quick view of how large speculators or non-commercials (for-profit traders) were positioned in the futures markets.

The CFTC categorizes trader positions according to commercial hedgers (traders who use futures contracts for hedging as part of the business), non-commercials (large traders who speculate to realize trading profits) and nonreportable traders (usually small traders/speculators) as well as their open interest (contracts open in the market at time of reporting). See CFTC criteria here.

Week Ahead: SPX500_m poised for a ‘Santa Rally’?

By ForexTime 

  • S&P 500 gains 8.9% in November
  • December historically good month for stocks
  • Keep eye on US jobs report and ‘Santa Rally’ chatter
  • Prices trending higher but RSI signals overbought
  • Can SPX500_m bulls maintain hunger for gains?

Christmas may have come early for investors after the S&P 500 ended November 8.9% higher!

This was not only its biggest monthly gain since July 2022 but also its fourth-best month in 10 years.

As we enter December, the stock index could see heightened volatility thanks to key US economic data and growing chatter about a ‘Santa Claus Rally’.

Monday, 4th December

  • USD: US factory orders, durable goods

Tuesday, 5th December

  • CNH: China Caixin services PMI
  • AUD: Reserve Bank of Australia rate decision
  • EUR: Eurozone S&P Global Services PMI, PPI
  • JPY: Japan Tokyo CPI
  • USD: US ISM Services, Job openings

Wednesday, 6th December

  • AUD: Australia GDP
  • CAD: Bank of Canada rate decision
  • EUR: Eurozone retail sales, Germany factory orders
  • GBP: Bank of England biannual stability report
  • USD: US trade

Thursday, 7th December

  • CNH: China trade, forex reserves
  • AUD: Australia trade balance
  • EUR: Eurozone GDP, Germany industrial production
  • USD: US initial jobless claims

Friday, 8th December

  • JPY: Japan household spending, GDP
  • EUR: Germany CPI
  • USD: US jobs report, University of Michigan consumer sentiment

US equity bulls remain supported by cooling inflation, positive US economic data, and growing speculation around the Fed cutting interest rates in 2024. This is reflected in the SPX500_m which has created consistently higher highs and higher lows on the daily timeframe.

Note: SPX500_m tracks the S&P 500 index (the benchmark used to measure the stock performance of the 500 largest listed US companies)

With exactly one month left until the end of 2023, the question is whether SPX500_m bulls can maintain their hunger for gains.

Here are 3 factors to keep an eye on in the week ahead:

  1. ‘Santa Rally’ chatter 

With Christmas just around the corner, discussion around a potential ‘Santa Clause Rally’ is likely to be widely discussed across the board.

This financial phenomenon is where stocks generally rise in the last week of December and the first two trading days of the new year. 

It is not fully clear whether it’s purely psychological or triggered by some underlying financial forces, but history has shown that this is a recurring seasonal pattern.

Indeed, December has been a historically positive month for the S&P500 which has produced positive returns 75% of the time since 1994.

Markets seem to be in good spirits with chatter about a ‘Santa Rally’ possibly influencing the index over the next few weeks.

  1. US November jobs report 

On the data front, the US non-farm payrolls could offer fresh clues about what action the Federal Reserve will take beyond 2023.

The US economy is expected to have created 200,000 jobs in November, a noticeable pickup from the 150,000 jobs in October. The unemployment rate is forecast to remain unchanged at 3.9% while average hourly earnings are expected to tick lower to 4.0% year-on-year.

Given how tech stocks account for roughly 29% of the S&P 500 weighting, the incoming jobs report could spark volatility.

Note: Tech stocks influenced by interest rates because their value is based on earnings forecasted in the future.

Traders are currently pricing in a 60% probability of a 25-basis point cut by March 2024, with a cut by May 2024 fully priced, according to Fed Funds futures.

  • The SPX500_m is likely to trade lower if the US jobs report meets or exceeds forecasts and investors re-evaluate when the Fed will cut rates in 2024.
  • Should the US jobs report market expectations, this could reinforce bets around the Fed cutting rates – supporting the SPX500_m as a result.
  1. Technical forces

The SPX500_m remains in a bullish channel on the daily charts with prices trading above the 50, 100, and 200-day SMA. Although the path of least resistance points north, the Relative Strength Index (RSI) remains around 70 – suggesting that prices are heavily overbought. A technical rebound could be a possibility before bulls return to the driving seat.

  • The support at 4525 could provide bulls the foundation to attack the 2023 high at 4611 and 4660 – a level not seen since January 2022.
  • Should prices slip back under 4525, this may open a path back towards 4500 and 4470, respectively.


Forex-Time-LogoArticle by ForexTime

ForexTime Ltd (FXTM) is an award winning international online forex broker regulated by CySEC 185/12 www.forextime.com

Mid-Week Technical Outlook: SPX500_m eyes 2023 high

By ForexTime 

  • SPX500_m up roughly 9% in November
  • Key US data and Powell speech may rock index
  • Prices trending higher with bulls eyeing 2023 high
  • Watch out for RSI which remains in overbought territory

The SPX500_m is on track for its biggest monthly gain since July 2022 and fourth-best month in the last 10 years!

November has been a stellar month for the stock index which is currently up roughly 9% as of writing.

Equity bulls remain empowered by growing speculation around the Fed cutting interest rates in 2024. With the upside momentum in full swing after prices blasted through a previous resistance level, the next key level of interest may be the 2023 high.

Should economic data and dovish remarks from Fed officials reinforce bets around Fed cuts next year, this could keep SPX500_m bulls in a position of power.

Taking a look at the technical picture, prices are firmly bullish on the daily charts. There have been consistently higher highs and higher lows while prices are trading above the 50, 100 and 200-day SMA.

It is a similar story on the weekly timeframe with prices approaching the 4600 resistance level. Beyond this point, the next key level of interest can be found at 4820 – a level not seen since January 2022.

One key thing that stands out in the daily timeframe is the Relative Strength Index (RSI) which remains around 70. With prices deep in overbought territory, a technical throwback could be around the corner before prices push higher.

  • Bulls remain in control above the 4525 level with the next key point of interest at 4611.

  • Should prices slip back under 4525, this may trigger a decline toward 4500 and 4470, respectively.


Forex-Time-LogoArticle by ForexTime

ForexTime Ltd (FXTM) is an award winning international online forex broker regulated by CySEC 185/12 www.forextime.com

Analysts: Apple Stock Still Has Room To Grow

Source: Streetwise Reports  (11/17/23)

Some analysts say the stock of tech giant Apple Inc., the world’s most valuable company with a US$2.95 trillion market cap, still has room to grow.

Tech giant Apple Inc. (AAPL:NASDAQ), the world’s most valuable company with a US$2.95 trillion market cap, met some Wall Street expectations with its recent fourth-quarter results but missed others. However, some analysts agree there is still room to grow with the stock.

AAPL earlier this month posted revenue of US$89.5 billion for the fourth quarter ending Sept. 30, down 1% over the same quarter in 2022, and quarterly earnings per diluted share of US$1.46, up 13% YoY.

While Apple’s revenue has slipped in the last few quarters compared with 2022, its gross margins are expanding, Bernstein analyst Toni Sacconaghi wrote, according to Barrons.

“Fundamentally, it has been an improvement in product gross margins, which have grown an average of ~170 bps per year since 2020, vs. declining ~140 bps per year between 2015 and 2020,” wrote Sacconaghi about basis points, or hundredths of a percentage point.

The analyst has a Market Perform rating on Apple’s stock with a target of US$195 per share.

The company’s Q4 FY2023 iPhone revenue went up 3% to US$43.8 billion YoY, which is in line with Wall Street predictions.

The Catalyst: Services Growth Beats Estimates

While the revenue for some of Apple’s product categories declined — wearables were down 3%, iPad revenue was down 10%, and Mac revenue was down 33% — some analysts pointed to the strong performance of the company’s Services segment as a bright spot. The division includes the App Store, AppleCare, iCloud data storage, Apple Pay, Apple Music, and Apple TV+.

“Fundamentally, it has been an improvement in product gross margins, which have grown an average of ~170 bps per year since 2020, vs. declining ~140 bps per year between 2015 and 2020,” wrote Sacconaghi.

That segment was up 16% YoY to US$22.3 billion and beat analysts’ estimates.

“Underlying iPhone and Services growth looks relatively healthy in the holiday quarter and generally in line with whisper numbers,” wrote Wedbush analyst Dan Ives, according to Benzinga. Ives rated the stock Outperform with a price target of US$240 per share.

Goldman Sachs analyst Michael Ng, who has a Buy rating with a price target of US$227 per share on AAPL, agreed.

“iPhone installed base continues to compound, with the iPhone active installed base reaching a record F4Q23 and benefitting from a record number of switchers in F2023 driven in part by expansion into emerging markets and a growing installed base in Apple Watch, Mac, and iPad,” Ng said.

Personal Computer Pioneer

Apple started in 1976, and its Apple II became one of the first mass-produced microcomputers. Its Macintosh computer, released in 1984, pioneered a graphical-user interface that directly influenced how we use our computers even now.

Goldman Sachs analyst Michael Ng, who has a Buy rating with a price target of US$227 per share on AAPL, agreed.

The company’s software now provides a connected ecosystem across several platforms – Macs, iPhones, iPads, Apple Watches, and Apple TVs. In 2018, it became the first publicly traded U.S. company to be valued at more than US$1 trillion, and its market capitalization rose to over US$3 trillion earlier this year. Its other products include AirPods wireless headphones and HomePod Mini smart speakers.

This year, Apple introduced its much-anticipated new virtual reality headset, Vision Pro, which is scheduled for availability early next year at US$3,499.

“Apple is pleased to report a September quarter revenue record for iPhone and an all-time revenue record in Services,” Apple Chief Executive Office Tim Cook said on the release of the figures. “We now have our strongest lineup of products ever heading into the holiday season, including the iPhone 15 lineup and our first carbon-neutral Apple Watch models, a major milestone in our efforts to make all Apple products carbon neutral by 2030.”

China Fears ‘Overblown,’ Analysts Say

Some analysts also agreed that fears of Apple losing iPhone market share in China could be overstated. Oppenheimer analyst Martin Yang rates Apple Outperform with a US$200 per share price target.

“Fears of iPhone’s share loss in Mainland China to Huawei seem overblown when iPhone likely gained share in F4Q,” Yang wrote, according to Benzinga. “We expect investor concerns over China share loss to mostly dissolve heading into FY24.”

Yang said Apple’s financial results were solid given a “very tough macro backdrop,” Barrons reported.

Oppenheimer analyst Martin Yang rates Apple Outperform with a US$200 per share price target.

“We continue to favor its long-term growth potential and unchallenged market positioning,” Yang wrote.

Wedbush analyst Ives said iPhone 15 demand in China was a highlight of Apple’s results.

“While overall, China revenues missed the Street in the September quarter, this was due to softer Mac/iPad sales, which marks the underlying growth the Street is truly focused on,” Ives said.

Apple’s numbers should cause analysts to “breathe a sea of relief,” he said.

“Underlying iPhone and Services growth looks relatively healthy in the holiday quarter and generally in line with whisper numbers,” he said, adding that iPhone China demand concerns were “a great fictional story by the bears.”

Heading Into the Holiday Season

Bernstein’s Sacconaghi said, Apple’s “guided below consensus revenues for the December quarter, (are) largely driven by a weak iPhone cycle. The December quarter typically sets the tone for the year.”

The analyst said he sees the stock’s quality as holding, but encourages investors to “‘be like Buffett’ and buy on dips.”

Raymond James analyst Srini Pajjuri agreed with Sacconaghi that Apple is seeing higher margins, the China numbers were encouraging.

“iPhone was in line and more importantly, China was an area of strength, which should help allay recent slowdown concerns,” Pajjuri said.

Pajjuri rates APPL Outperform with a price target of US$200 to US$195.

Apple recently filled in its holiday lineup with the new iPhone 15 and Apple Watch Series 9 smartwatches, plus new MacBook Pro and iMac computers that run on the company’s new M3 family of chips, which are based on a smaller and more efficient 3-nanometer process.

Services: Next Big Growth Driver?

Writing for Investor’s Business Daily, Patrick Seitz also noted that the Services division may be

AAPL’s next big growth driver.

“On Oct. 25, Apple raised prices for multiple subscription services, including Apple TV+ and its Apple One bundles,” Seitz wrote.

Investor’s Business Daily gave AAPL a Composite Rating of 90 out of 99. The rating combines “five separate proprietary ratings of fundamental and technical performance,” with the best growth stocks having a rating of 90 or better. It also gave the stock a Relative Strength Rating, looking at how the stock performs against others in the last year, of 90 out of 99.

“Wall Street sees the iPhone maker returning to growth in the December quarter,” Seitz wrote.

Streetwise Ownership Overview*

Apple Inc. (AAPL:NASDAQ)

Institutional: 54%
Retail: 45%
Insiders & Management: 0%
54%
46%
*Share Structure as of 11/16/2023


The company’s next earnings report is due in late January and could be a catalyst for the stock, he said.

Ownership and Share Structure

About 54% of Apple is owned by institutions and about 0.06% by insiders, according to Yahoo! Finance. The rest, about 46%, is in retail.

Top shareholders include The Vanguard Group Inc. with 8.32% or 1.32 billion shares, Berkshire Hathaway Inc. with 5.89% or 916 million shares, BlackRock Institutional Trust Co. with 4.32% or 672 million shares, State Street Global Advisors (US) with 3.66% or 569 million shares, and Geode Capital Management LLC with 1.9% or 296 million shares.

Top individual shareholders include Arthur D. Levinson with 0.03% or 4.59 million shares, CEO Cook with 0.02% or 3.28 million shares, Jeffrey E. Williams with 0% 560,000 shares, and former Vice President Al Gore with 0% or 470,000 shares.

Apple’s market cap is US$2.95 trillion, with 15.55 billion shares outstanding, 15.54 of them free-floating. It trades in a 52-week range of US$198.23 and US$124.17.


Important Disclosures:

  1. As of the date of this article, officers and/or employees of Streetwise Reports LLC (including members of their household) own securities of Apple Inc.
  2. Steve Sobek wrote this article for Streetwise Reports LLC and provides services to Streetwise Reports as an employee.
  3. The article does not constitute investment advice. Each reader is encouraged to consult with his or her individual financial professional. By opening this page, each reader accepts and agrees to Streetwise Reports’ terms of use and full legal disclaimer. This article is not a solicitation for investment. Streetwise Reports does not render general or specific investment advice and the information on Streetwise Reports should not be considered a recommendation to buy or sell any security. Streetwise Reports does not endorse or recommend the business, products, services or securities of any company mentioned on Streetwise Reports.

For additional disclosures, please click here.