By InvestMacro
Here are the latest charts and statistics for the Commitment of Traders (COT) data published by the Commodities Futures Trading Commission (CFTC).
The latest COT data is updated through Tuesday March 19th and shows a quick view of how large traders (for-profit speculators and commercial entities) were positioned in the futures markets.
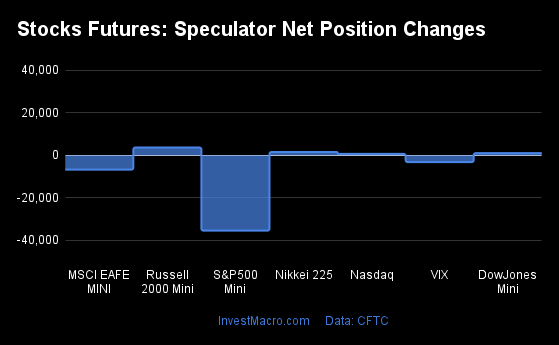
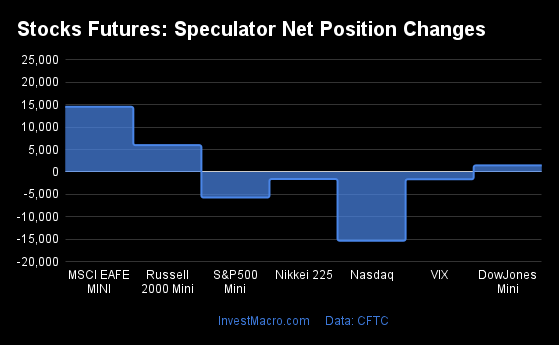
Weekly Speculator Changes led by SP500 & EAFE
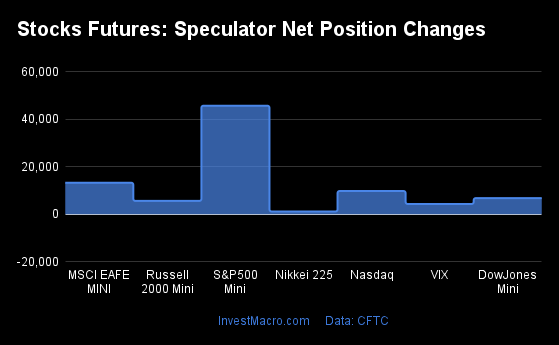
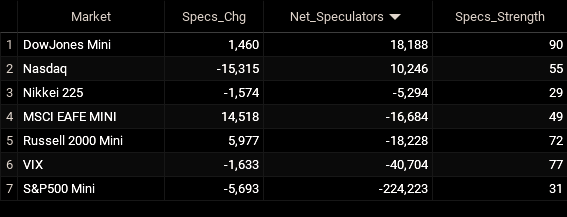
The COT stock markets speculator bets were higher this week as all seven out of the seven stock markets we cover had higher positioning.
Leading the gains for the stock markets was the S&P500-Mini (45,658 contracts) with the MSCI EAFE-Mini (13,261 contracts), the Nasdaq-Mini (9,765 contracts), the DowJones-Mini (6,774 contracts), the VIX (4,316 contracts), the Russell-Mini (5,610 contracts) and the Nikkei 225 (1,171 contracts) also having positive weeks.
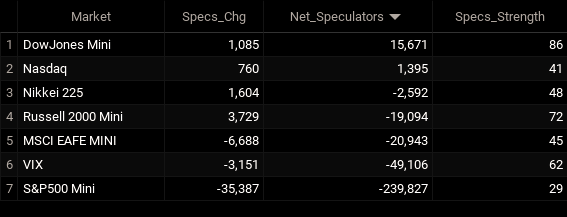
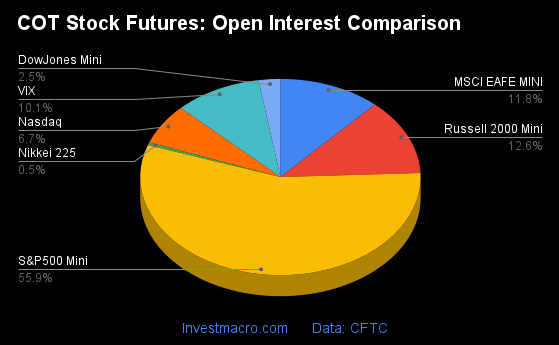
Stock Market Net Speculators Leaderboard
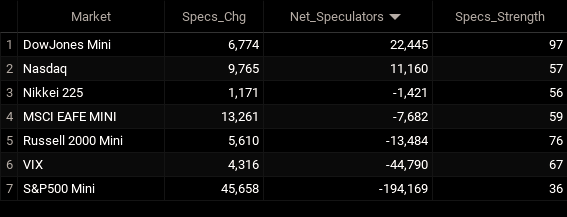
Legend: Weekly Speculators Change | Speculators Current Net Position | Speculators Strength Score compared to last 3-Years (0-100 range)
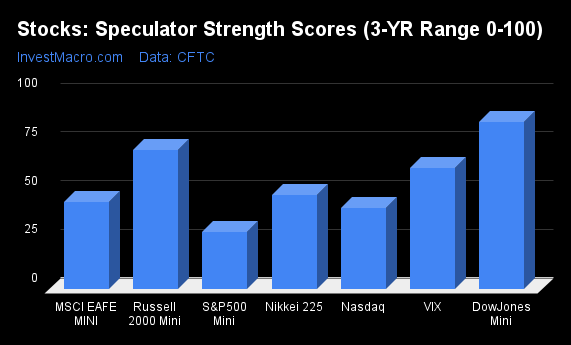
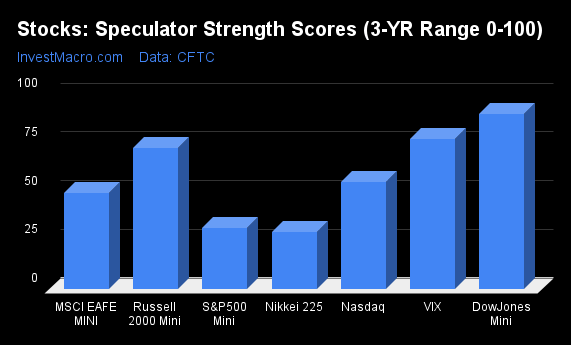
Strength Scores led by DowJones-Mini & Russell-Mini
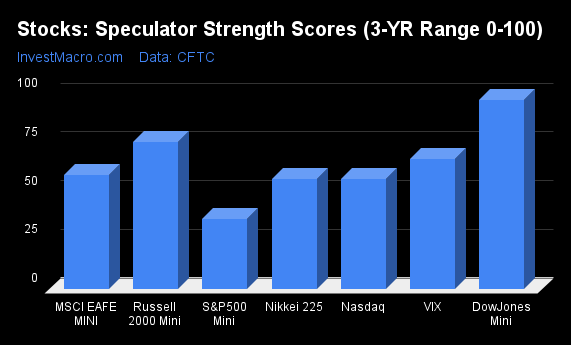
COT Strength Scores (a normalized measure of Speculator positions over a 3-Year range, from 0 to 100 where above 80 is Extreme-Bullish and below 20 is Extreme-Bearish) showed that the DowJones-Mini (97 percent) and the Russell-Mini (76 percent) lead the stock markets this week. The VIX (67 percent) and Nikkei 225 Yen (61 percent) come in as the next highest in the weekly strength scores.
On the downside, the S&P500-Mini (36 percent) comes in at the lowest strength level currently.
Strength Statistics:
VIX (66.6 percent) vs VIX previous week (62.0 percent)
S&P500-Mini (35.8 percent) vs S&P500-Mini previous week (29.0 percent)
DowJones-Mini (96.8 percent) vs DowJones-Mini previous week (85.8 percent)
Nasdaq-Mini (56.5 percent) vs Nasdaq-Mini previous week (41.3 percent)
Russell2000-Mini (75.5 percent) vs Russell2000-Mini previous week (71.5 percent)
Nikkei USD (56.4 percent) vs Nikkei USD previous week (48.2 percent)
EAFE-Mini (58.5 percent) vs EAFE-Mini previous week (44.7 percent)
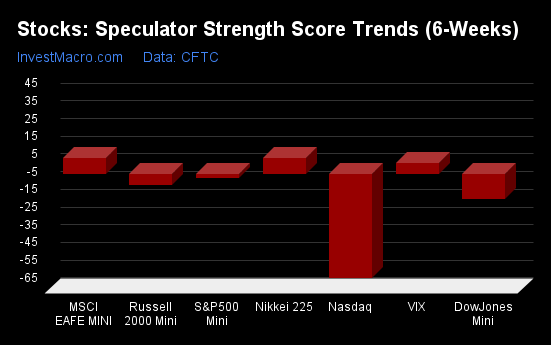
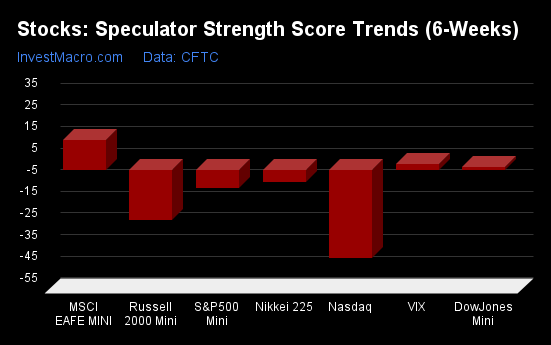
MSCI EAFE-Mini & Nikkei 225 top the 6-Week Strength Trends
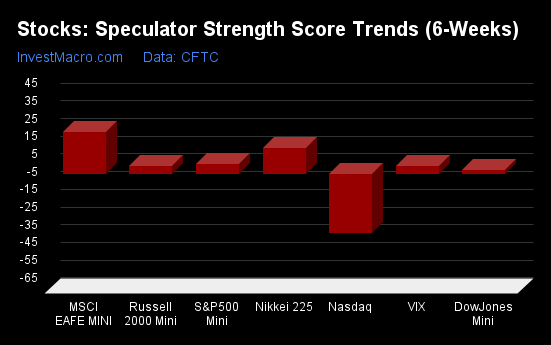
COT Strength Score Trends (or move index, calculates the 6-week changes in strength scores) showed that the MSCI EAFE-Mini (23 percent) leads the past six weeks trends for the stock markets. The Nikkei 225 (15 percent), the S&P500-Mini (6 percent) and the VIX (5 percent) are the next highest positive movers in the latest trends data.
The Nasdaq-Mini (-34 percent) leads the downside trend scores currently.
Strength Trend Statistics:
VIX (4.5 percent) vs VIX previous week (5.9 percent)
S&P500-Mini (5.8 percent) vs S&P500-Mini previous week (-2.1 percent)
DowJones-Mini (2.4 percent) vs DowJones-Mini previous week (-14.2 percent)
Nasdaq-Mini (-33.7 percent) vs Nasdaq-Mini previous week (-58.7 percent)
Russell2000-Mini (4.6 percent) vs Russell2000-Mini previous week (-6.1 percent)
Nikkei USD (14.6 percent) vs Nikkei USD previous week (9.0 percent)
EAFE-Mini (23.4 percent) vs EAFE-Mini previous week (8.9 percent)
Individual Stock Market Charts:
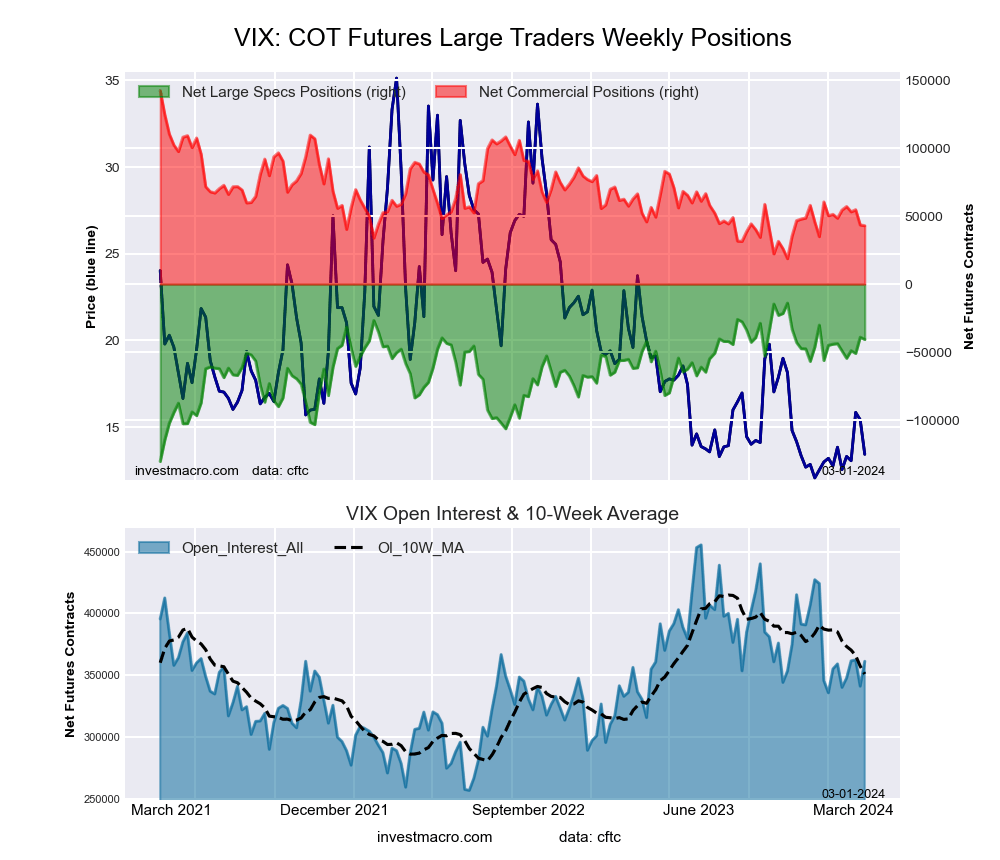
VIX Volatility Futures:
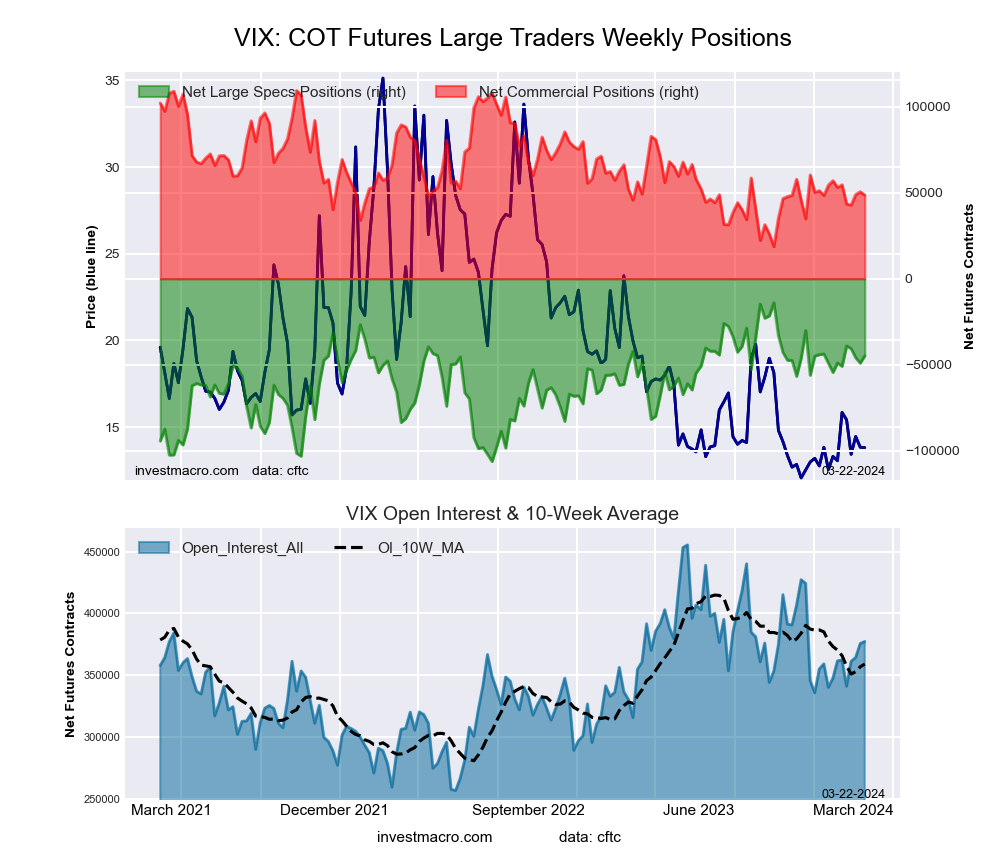 The VIX Volatility large speculator standing this week resulted in a net position of -44,790 contracts in the data reported through Tuesday. This was a weekly increase of 4,316 contracts from the previous week which had a total of -49,106 net contracts.
This week’s current strength score (the trader positioning range over the past three years, measured from 0 to 100) shows the speculators are currently Bullish with a score of 66.6 percent. The commercials are Bearish with a score of 33.0 percent and the small traders (not shown in chart) are Bullish with a score of 76.8 percent.
Price Trend-Following Model: Weak Uptrend
Our weekly trend-following model classifies the current market price position as: Weak Uptrend. The current action for the model is considered to be: New Buy – Long Position.
| VIX Volatility Futures Statistics | SPECULATORS | COMMERCIALS | SMALL TRADERS |
| – Percent of Open Interest Longs: | 17.9 | 47.7 | 7.3 |
| – Percent of Open Interest Shorts: | 29.8 | 34.8 | 8.3 |
| – Net Position: | -44,790 | 48,644 | -3,854 |
| – Gross Longs: | 67,646 | 179,887 | 27,545 |
| – Gross Shorts: | 112,436 | 131,243 | 31,399 |
| – Long to Short Ratio: | 0.6 to 1 | 1.4 to 1 | 0.9 to 1 |
| NET POSITION TREND: | |||
| – Strength Index Score (3 Year Range Pct): | 66.6 | 33.0 | 76.8 |
| – Strength Index Reading (3 Year Range): | Bullish | Bearish | Bullish |
| NET POSITION MOVEMENT INDEX: | |||
| – 6-Week Change in Strength Index: | 4.5 | -4.9 | 1.5 |
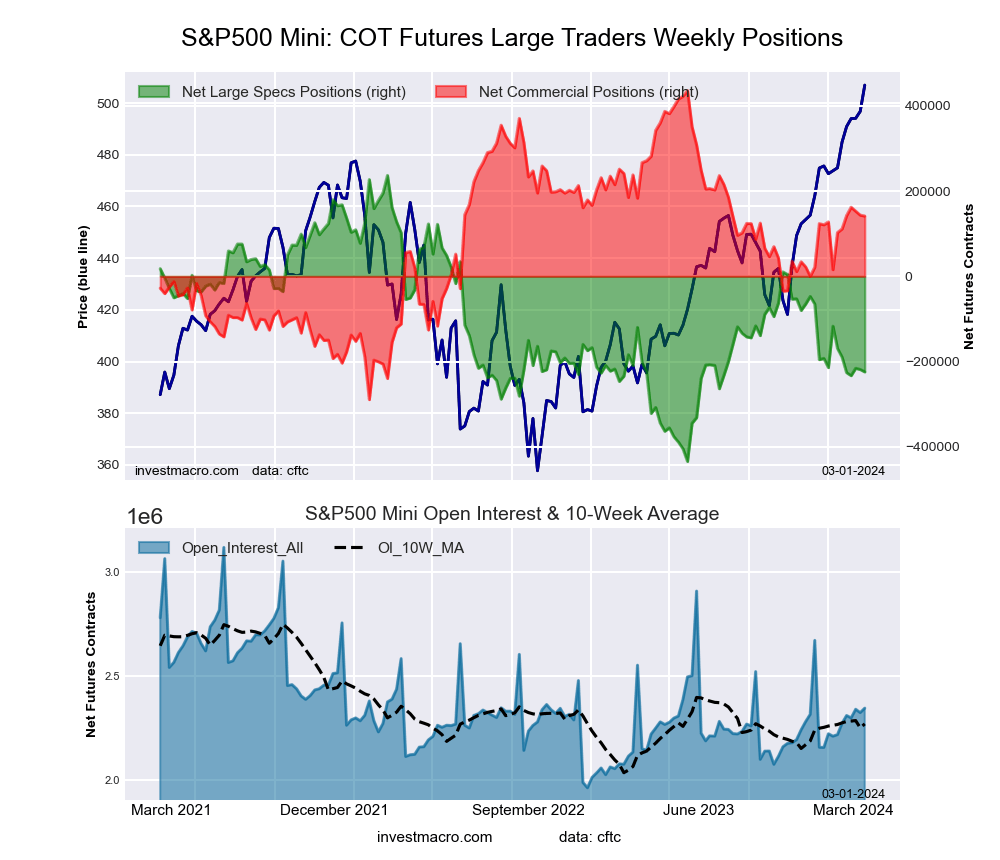
S&P500 Mini Futures:
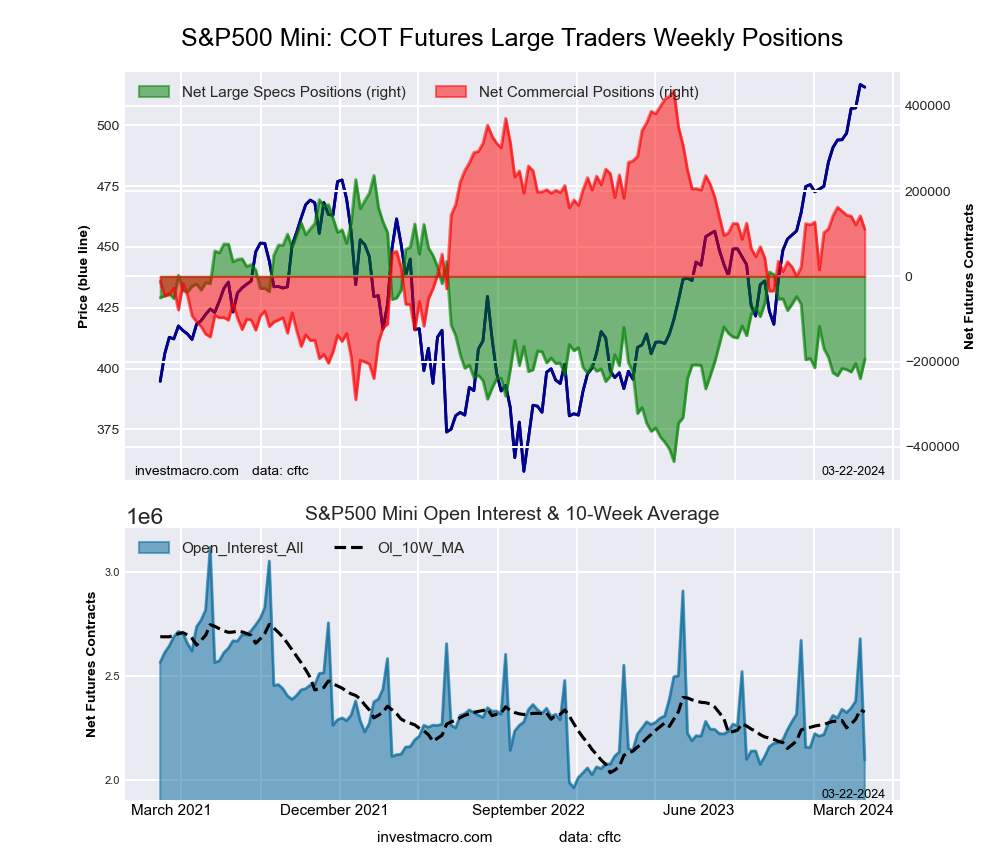 The S&P500 Mini large speculator standing this week resulted in a net position of -194,169 contracts in the data reported through Tuesday. This was a weekly rise of 45,658 contracts from the previous week which had a total of -239,827 net contracts.
This week’s current strength score (the trader positioning range over the past three years, measured from 0 to 100) shows the speculators are currently Bearish with a score of 35.8 percent. The commercials are Bullish with a score of 55.1 percent and the small traders (not shown in chart) are Bullish with a score of 70.5 percent.
Price Trend-Following Model: Strong Uptrend
Our weekly trend-following model classifies the current market price position as: Strong Uptrend. The current action for the model is considered to be: Hold – Maintain Long Position.
| S&P500 Mini Futures Statistics | SPECULATORS | COMMERCIALS | SMALL TRADERS |
| – Percent of Open Interest Longs: | 12.3 | 73.5 | 12.5 |
| – Percent of Open Interest Shorts: | 21.6 | 68.2 | 8.5 |
| – Net Position: | -194,169 | 110,101 | 84,068 |
| – Gross Longs: | 258,169 | 1,539,140 | 261,988 |
| – Gross Shorts: | 452,338 | 1,429,039 | 177,920 |
| – Long to Short Ratio: | 0.6 to 1 | 1.1 to 1 | 1.5 to 1 |
| NET POSITION TREND: | |||
| – Strength Index Score (3 Year Range Pct): | 35.8 | 55.1 | 70.5 |
| – Strength Index Reading (3 Year Range): | Bearish | Bullish | Bullish |
| NET POSITION MOVEMENT INDEX: | |||
| – 6-Week Change in Strength Index: | 5.8 | -7.1 | 5.1 |
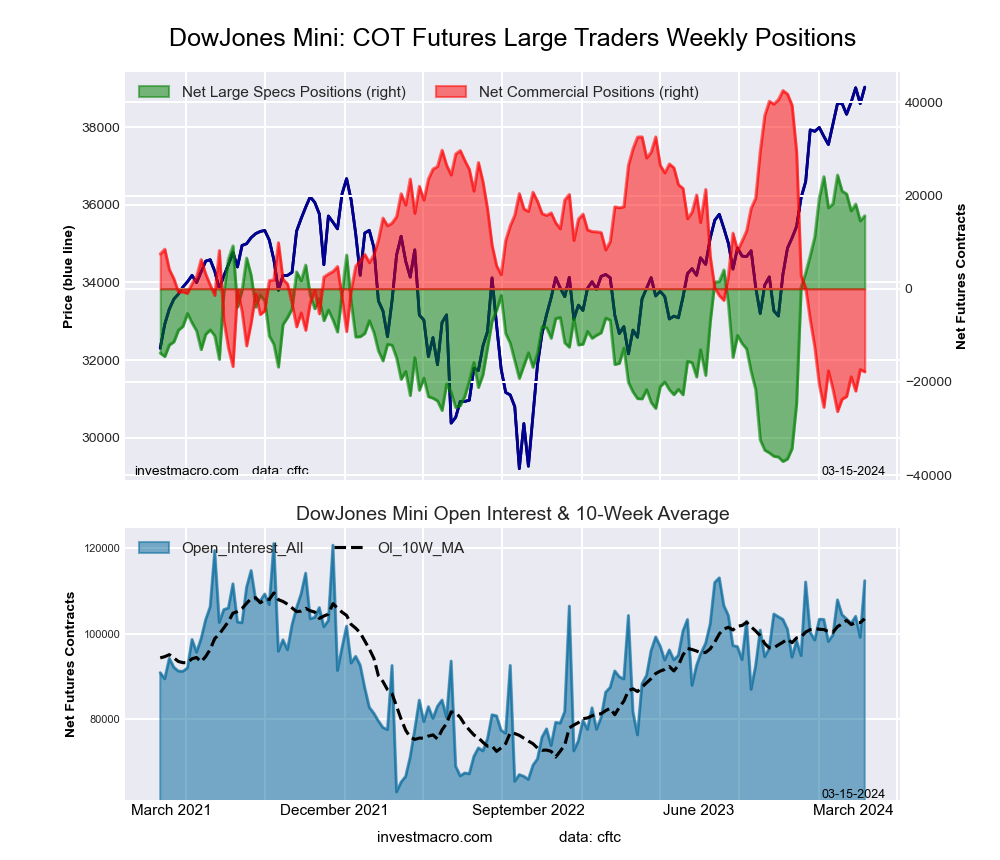
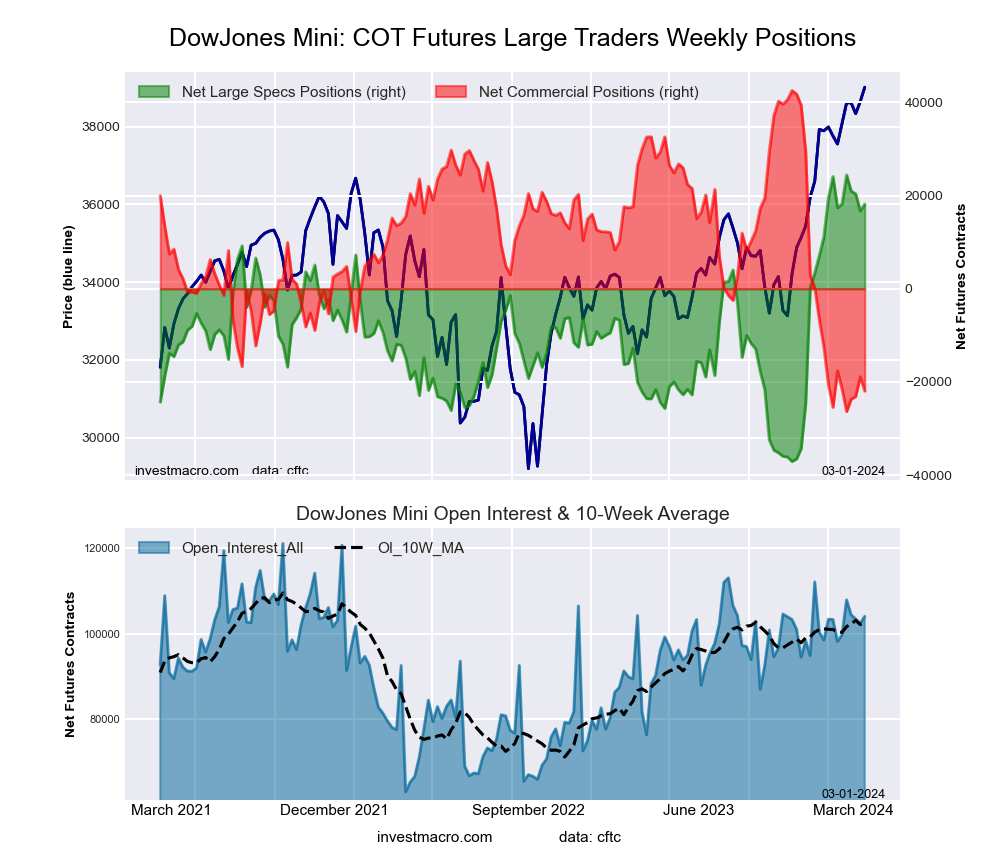
Dow Jones Mini Futures:
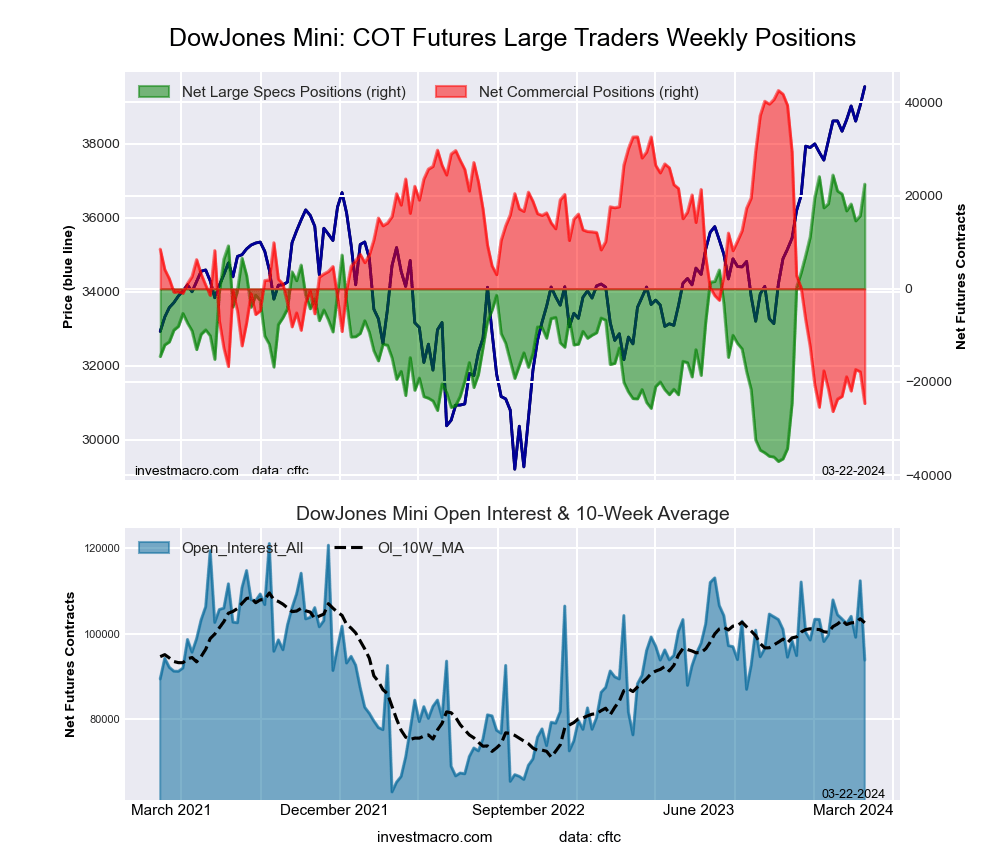 The Dow Jones Mini large speculator standing this week resulted in a net position of 22,445 contracts in the data reported through Tuesday. This was a weekly increase of 6,774 contracts from the previous week which had a total of 15,671 net contracts.
This week’s current strength score (the trader positioning range over the past three years, measured from 0 to 100) shows the speculators are currently Bullish-Extreme with a score of 96.8 percent. The commercials are Bearish-Extreme with a score of 2.5 percent and the small traders (not shown in chart) are Bullish with a score of 54.6 percent.
Price Trend-Following Model: Strong Uptrend
Our weekly trend-following model classifies the current market price position as: Strong Uptrend. The current action for the model is considered to be: Hold – Maintain Long Position.
| Dow Jones Mini Futures Statistics | SPECULATORS | COMMERCIALS | SMALL TRADERS |
| – Percent of Open Interest Longs: | 38.0 | 45.2 | 14.9 |
| – Percent of Open Interest Shorts: | 14.1 | 71.4 | 12.6 |
| – Net Position: | 22,445 | -24,632 | 2,187 |
| – Gross Longs: | 35,688 | 42,385 | 13,967 |
| – Gross Shorts: | 13,243 | 67,017 | 11,780 |
| – Long to Short Ratio: | 2.7 to 1 | 0.6 to 1 | 1.2 to 1 |
| NET POSITION TREND: | |||
| – Strength Index Score (3 Year Range Pct): | 96.8 | 2.5 | 54.6 |
| – Strength Index Reading (3 Year Range): | Bullish-Extreme | Bearish-Extreme | Bullish |
| NET POSITION MOVEMENT INDEX: | |||
| – 6-Week Change in Strength Index: | 2.4 | -1.3 | -2.6 |
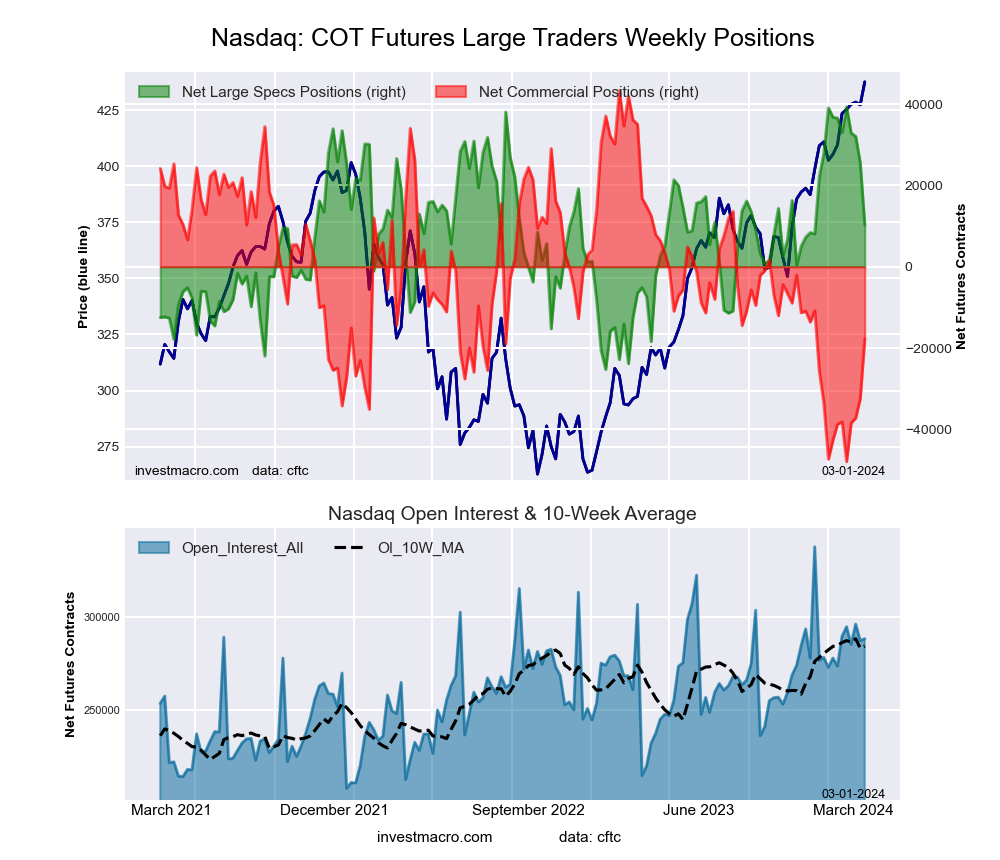
Nasdaq Mini Futures:
 The Nasdaq Mini large speculator standing this week resulted in a net position of 11,160 contracts in the data reported through Tuesday. This was a weekly advance of 9,765 contracts from the previous week which had a total of 1,395 net contracts.
This week’s current strength score (the trader positioning range over the past three years, measured from 0 to 100) shows the speculators are currently Bullish with a score of 56.5 percent. The commercials are Bearish with a score of 33.3 percent and the small traders (not shown in chart) are Bullish-Extreme with a score of 91.7 percent.
Price Trend-Following Model: Uptrend
Our weekly trend-following model classifies the current market price position as: Uptrend. The current action for the model is considered to be: Hold – Maintain Long Position.
| Nasdaq Mini Futures Statistics | SPECULATORS | COMMERCIALS | SMALL TRADERS |
| – Percent of Open Interest Longs: | 27.3 | 55.5 | 15.7 |
| – Percent of Open Interest Shorts: | 22.8 | 62.5 | 13.2 |
| – Net Position: | 11,160 | -17,526 | 6,366 |
| – Gross Longs: | 68,217 | 138,897 | 39,354 |
| – Gross Shorts: | 57,057 | 156,423 | 32,988 |
| – Long to Short Ratio: | 1.2 to 1 | 0.9 to 1 | 1.2 to 1 |
| NET POSITION TREND: | |||
| – Strength Index Score (3 Year Range Pct): | 56.5 | 33.3 | 91.7 |
| – Strength Index Reading (3 Year Range): | Bullish | Bearish | Bullish-Extreme |
| NET POSITION MOVEMENT INDEX: | |||
| – 6-Week Change in Strength Index: | -33.7 | 22.9 | 2.1 |
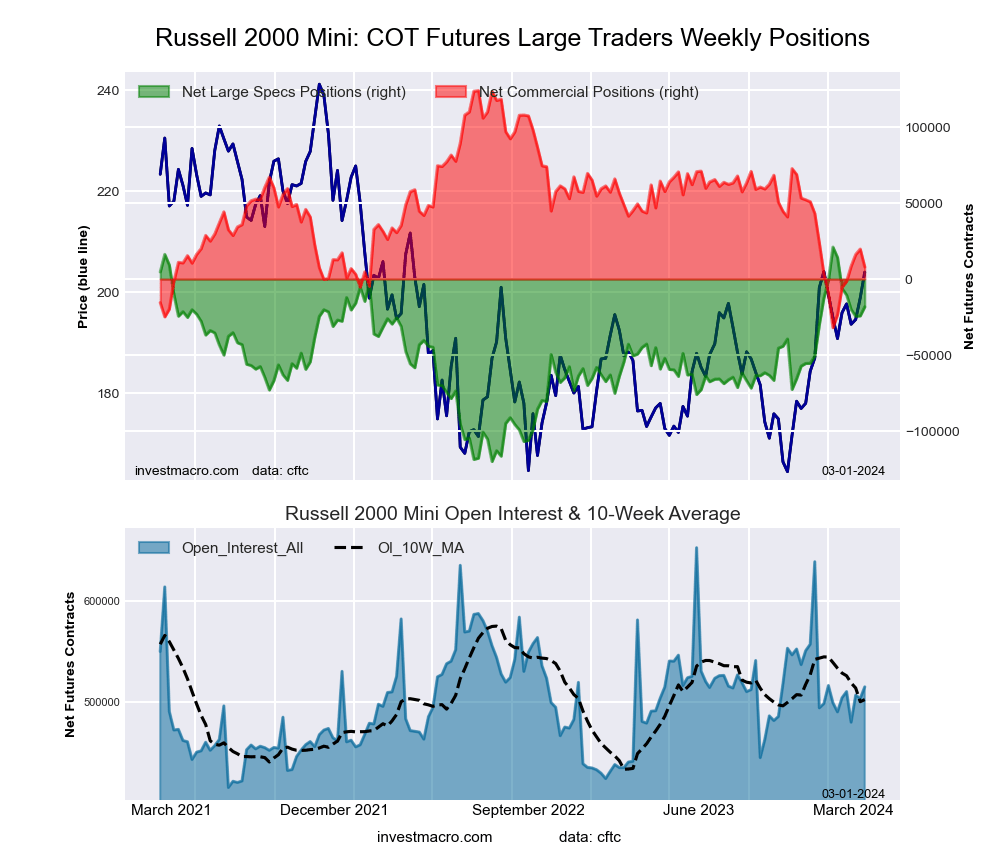
Russell 2000 Mini Futures:
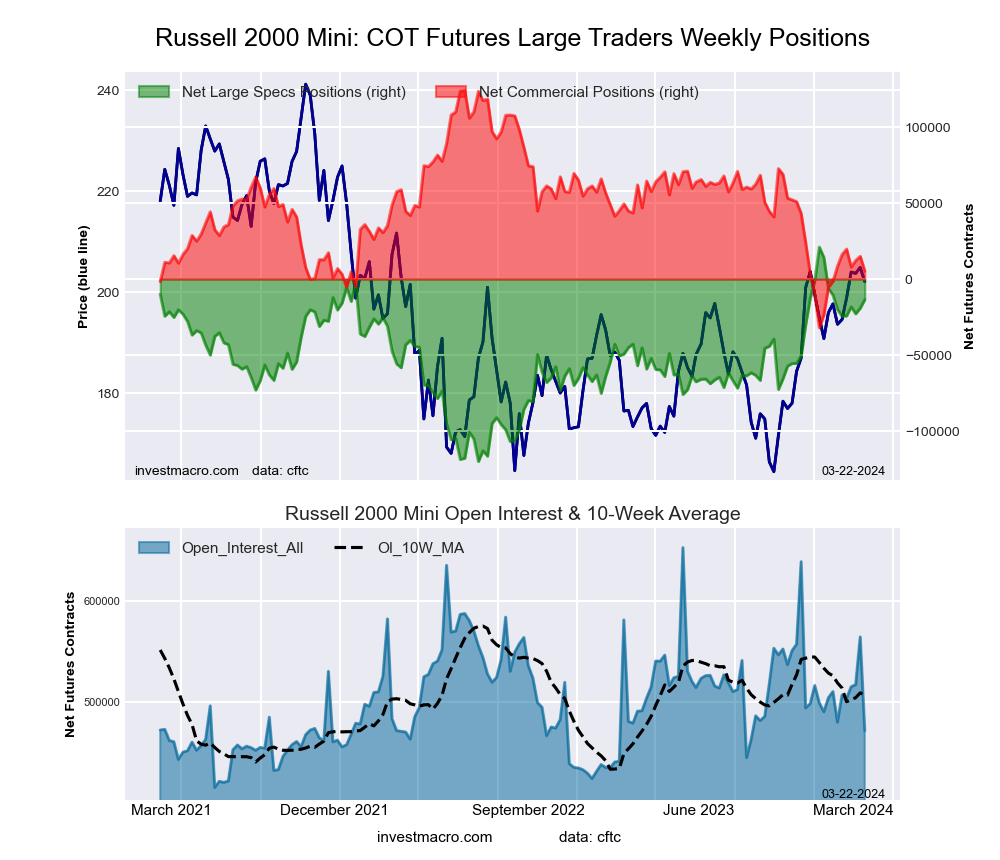 The Russell 2000 Mini large speculator standing this week resulted in a net position of -13,484 contracts in the data reported through Tuesday. This was a weekly rise of 5,610 contracts from the previous week which had a total of -19,094 net contracts.
This week’s current strength score (the trader positioning range over the past three years, measured from 0 to 100) shows the speculators are currently Bullish with a score of 75.5 percent. The commercials are Bearish with a score of 23.9 percent and the small traders (not shown in chart) are Bullish with a score of 56.6 percent.
Price Trend-Following Model: Uptrend
Our weekly trend-following model classifies the current market price position as: Uptrend. The current action for the model is considered to be: Hold – Maintain Long Position.
| Russell 2000 Mini Futures Statistics | SPECULATORS | COMMERCIALS | SMALL TRADERS |
| – Percent of Open Interest Longs: | 14.7 | 78.6 | 6.0 |
| – Percent of Open Interest Shorts: | 17.5 | 77.5 | 4.3 |
| – Net Position: | -13,484 | 5,273 | 8,211 |
| – Gross Longs: | 69,077 | 370,396 | 28,373 |
| – Gross Shorts: | 82,561 | 365,123 | 20,162 |
| – Long to Short Ratio: | 0.8 to 1 | 1.0 to 1 | 1.4 to 1 |
| NET POSITION TREND: | |||
| – Strength Index Score (3 Year Range Pct): | 75.5 | 23.9 | 56.6 |
| – Strength Index Reading (3 Year Range): | Bullish | Bearish | Bullish |
| NET POSITION MOVEMENT INDEX: | |||
| – 6-Week Change in Strength Index: | 4.6 | -2.1 | -11.0 |
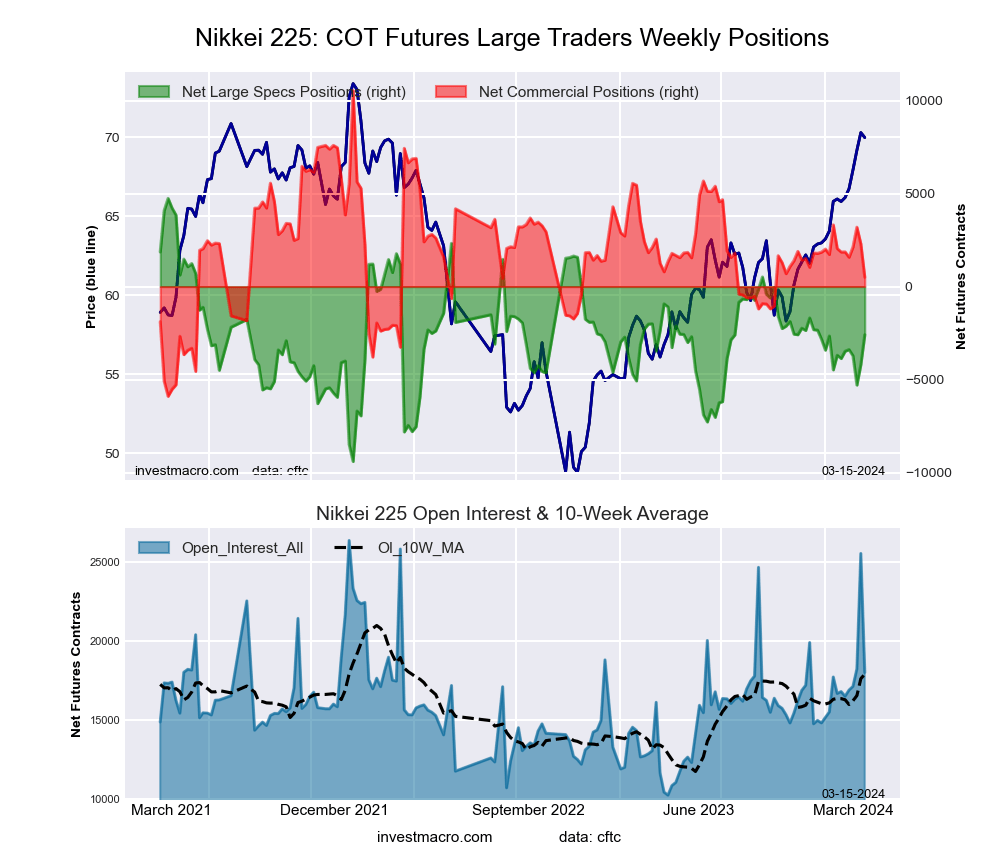
Nikkei Stock Average (USD) Futures:
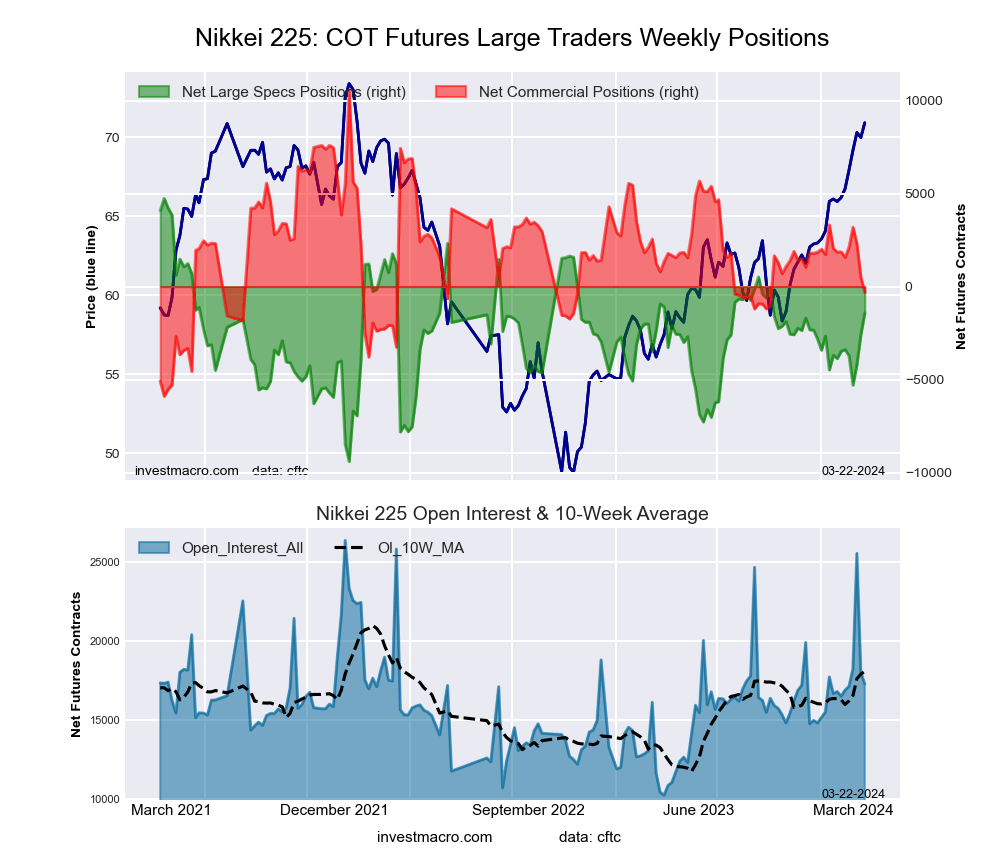 The Nikkei Stock Average (USD) large speculator standing this week resulted in a net position of -1,421 contracts in the data reported through Tuesday. This was a weekly rise of 1,171 contracts from the previous week which had a total of -2,592 net contracts.
This week’s current strength score (the trader positioning range over the past three years, measured from 0 to 100) shows the speculators are currently Bullish with a score of 56.4 percent. The commercials are Bearish with a score of 34.0 percent and the small traders (not shown in chart) are Bullish with a score of 65.3 percent.
Price Trend-Following Model: Strong Uptrend
Our weekly trend-following model classifies the current market price position as: Strong Uptrend. The current action for the model is considered to be: Hold – Maintain Long Position.
| Nikkei Stock Average Futures Statistics | SPECULATORS | COMMERCIALS | SMALL TRADERS |
| – Percent of Open Interest Longs: | 8.0 | 66.5 | 25.5 |
| – Percent of Open Interest Shorts: | 16.2 | 68.3 | 15.5 |
| – Net Position: | -1,421 | -313 | 1,734 |
| – Gross Longs: | 1,386 | 11,492 | 4,413 |
| – Gross Shorts: | 2,807 | 11,805 | 2,679 |
| – Long to Short Ratio: | 0.5 to 1 | 1.0 to 1 | 1.6 to 1 |
| NET POSITION TREND: | |||
| – Strength Index Score (3 Year Range Pct): | 56.4 | 34.0 | 65.3 |
| – Strength Index Reading (3 Year Range): | Bullish | Bearish | Bullish |
| NET POSITION MOVEMENT INDEX: | |||
| – 6-Week Change in Strength Index: | 14.6 | -13.2 | 1.9 |
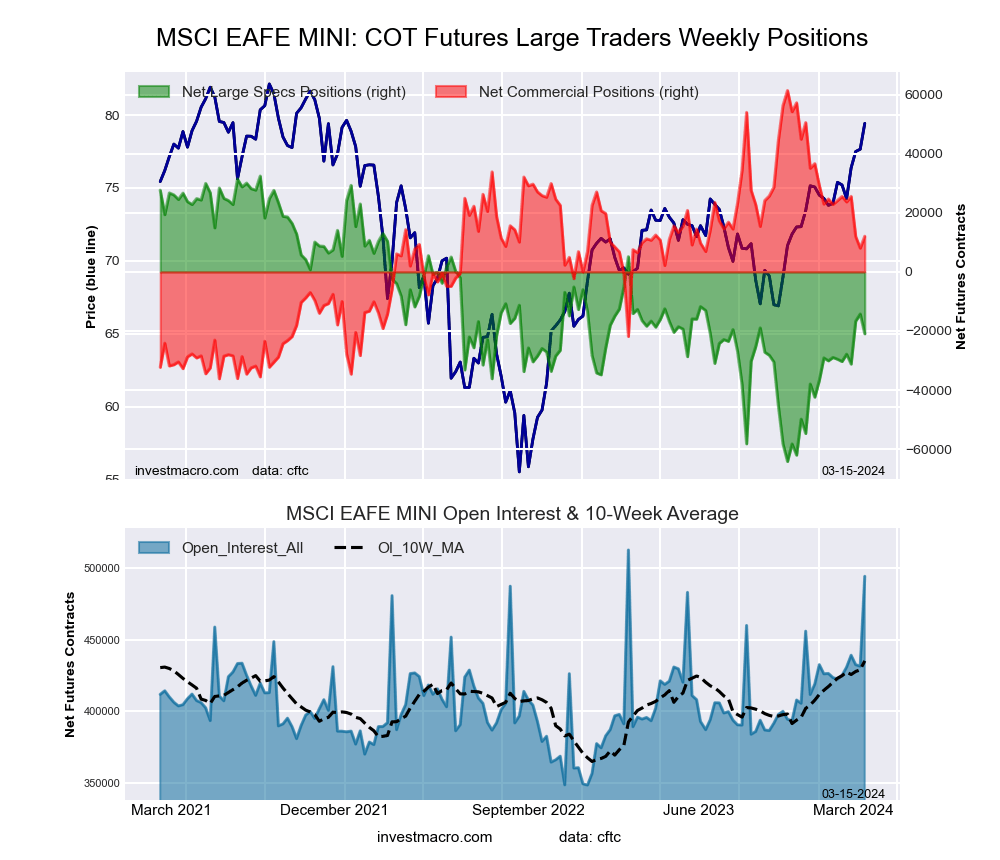
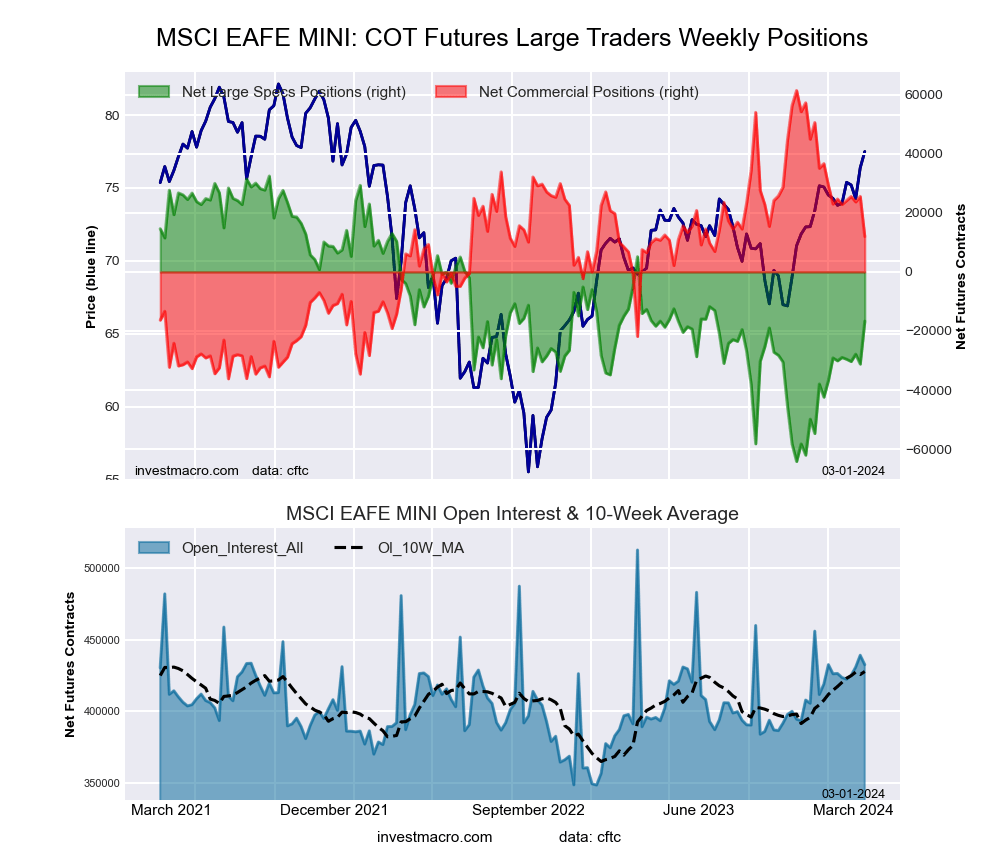
MSCI EAFE Mini Futures:
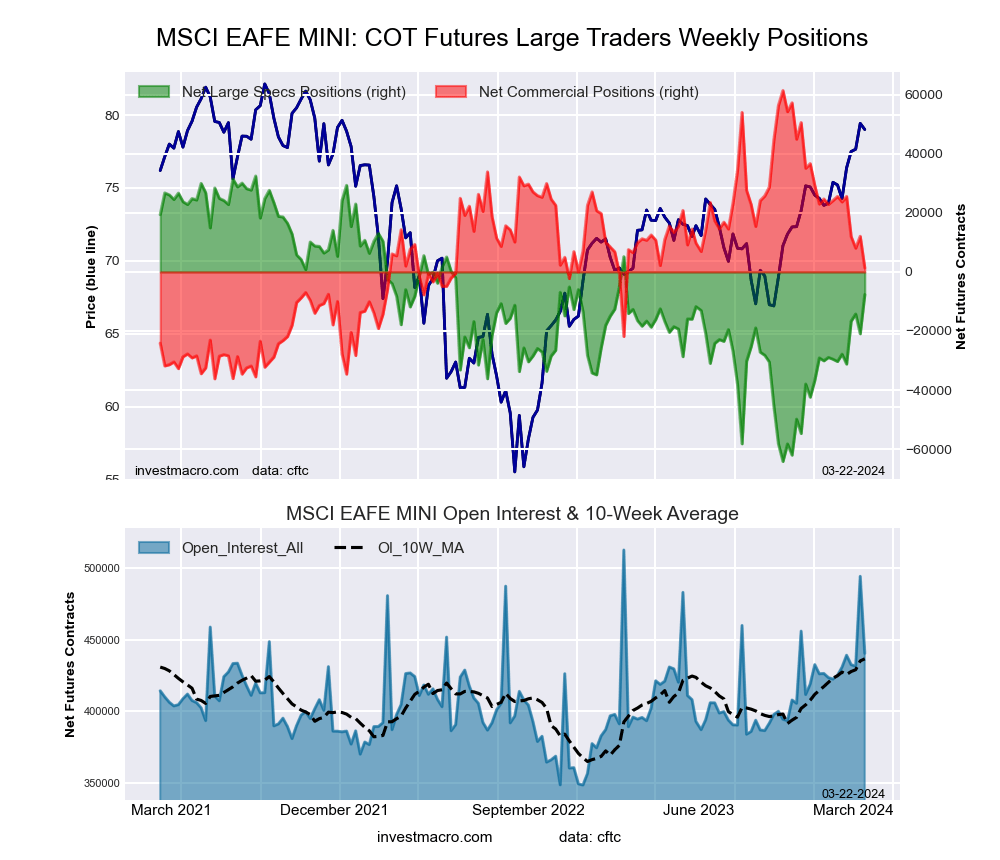 The MSCI EAFE Mini large speculator standing this week resulted in a net position of -7,682 contracts in the data reported through Tuesday. This was a weekly lift of 13,261 contracts from the previous week which had a total of -20,943 net contracts.
This week’s current strength score (the trader positioning range over the past three years, measured from 0 to 100) shows the speculators are currently Bullish with a score of 58.5 percent. The commercials are Bearish with a score of 38.5 percent and the small traders (not shown in chart) are Bearish with a score of 48.5 percent.
Price Trend-Following Model: Strong Uptrend
Our weekly trend-following model classifies the current market price position as: Strong Uptrend. The current action for the model is considered to be: Hold – Maintain Long Position.
| MSCI EAFE Mini Futures Statistics | SPECULATORS | COMMERCIALS | SMALL TRADERS |
| – Percent of Open Interest Longs: | 8.7 | 88.6 | 2.4 |
| – Percent of Open Interest Shorts: | 10.4 | 88.3 | 0.9 |
| – Net Position: | -7,682 | 1,369 | 6,313 |
| – Gross Longs: | 38,124 | 390,369 | 10,384 |
| – Gross Shorts: | 45,806 | 389,000 | 4,071 |
| – Long to Short Ratio: | 0.8 to 1 | 1.0 to 1 | 2.6 to 1 |
| NET POSITION TREND: | |||
| – Strength Index Score (3 Year Range Pct): | 58.5 | 38.5 | 48.5 |
| – Strength Index Reading (3 Year Range): | Bullish | Bearish | Bearish |
| NET POSITION MOVEMENT INDEX: | |||
| – 6-Week Change in Strength Index: | 23.4 | -24.8 | 7.6 |
Article By InvestMacro – Receive our weekly COT Newsletter
*COT Report: The COT data, released weekly to the public each Friday, is updated through the most recent Tuesday (data is 3 days old) and shows a quick view of how large speculators or non-commercials (for-profit traders) were positioned in the futures markets.
The CFTC categorizes trader positions according to commercial hedgers (traders who use futures contracts for hedging as part of the business), non-commercials (large traders who speculate to realize trading profits) and nonreportable traders (usually small traders/speculators) as well as their open interest (contracts open in the market at time of reporting). See CFTC criteria here.