Archive for Stock Market News – Page 10

COT Stock Market Charts: Speculator bets led by S&P500 & Russell 2000 Minis

By InvestMacro

Here are the latest charts and statistics for the Commitment of Traders (COT) data published by the Commodities Futures Trading Commission (CFTC).

The latest COT data is updated through Tuesday October 15th and shows a quick view of how large traders (for-profit speculators and commercial entities) were positioned in the futures markets.

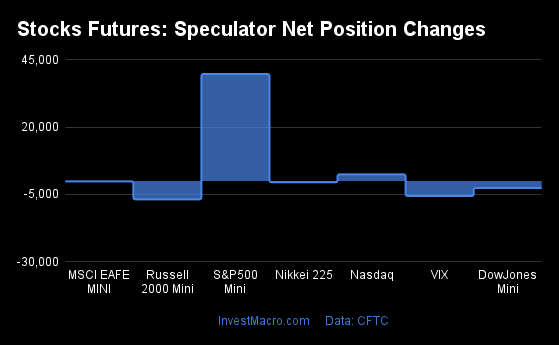
Weekly Speculator Changes led by S&P500-Mini & Russell 2000-Mini

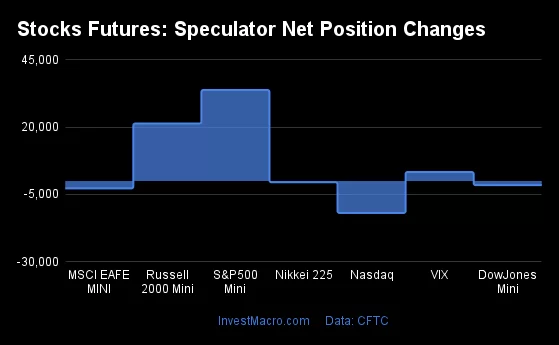
The COT stock markets speculator bets were lower this week as four out of the seven stock markets we cover had higher positioning while the other four markets had lower speculator contracts.

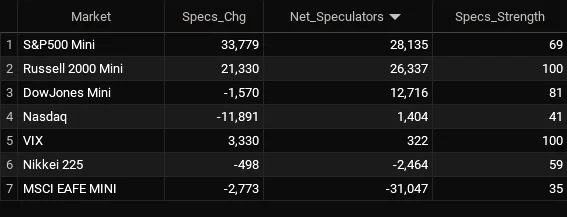
Leading the gains for the stock markets was the S&P500-Mini (33,779 contracts) with the Russell-Mini (21,330 contracts) and the VIX (3,330 contracts) also showing positive weeks.

The markets with the declines in speculator bets this week were the Nasdaq-Mini (-11,891 contracts), MSCI EAFE-Mini (-2,773 contracts), the DowJones-Mini (-1,570 contracts) and the Nikkei 225 (-498 contracts) also registering lower bets on the week.


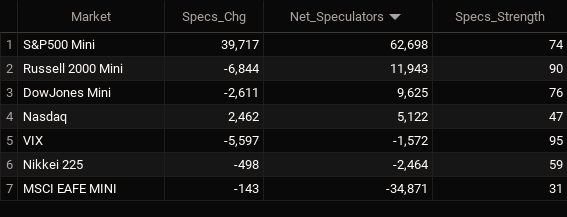
Stock Market Net Speculators Leaderboard

Legend: Weekly Speculators Change | Speculators Current Net Position | Speculators Strength Score compared to last 3-Years (0-100 range)


Strength Scores led by VIX & Russell-Mini

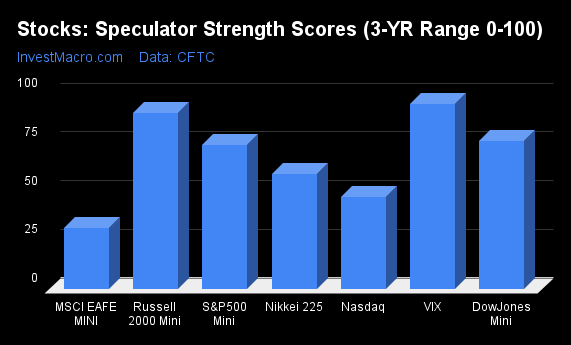
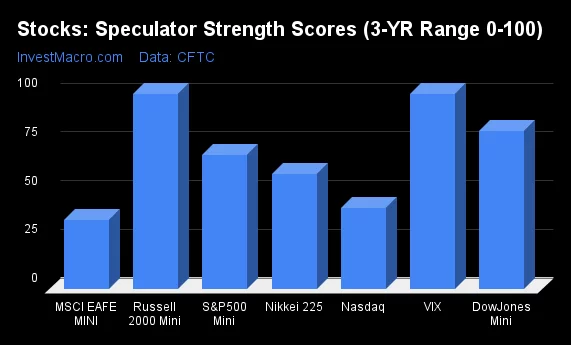
COT Strength Scores (a normalized measure of Speculator positions over a 3-Year range, from 0 to 100 where above 80 is Extreme-Bullish and below 20 is Extreme-Bearish) showed that the VIX (100 percent) and the Russell-Mini (100 percent) lead the stock markets this week. The DowJones-Mini (81 percent) and S&P500-Mini (69 percent) come in as the next highest in the weekly strength scores.

On the downside, the MSCI EAFE-Mini (35 percent) comes in at the lowest strength level currently while the next lowest strength score is the Nasdaq-Mini (41 percent).

Strength Statistics:
VIX (100.0 percent) vs VIX previous week (96.9 percent)
S&P500-Mini (68.9 percent) vs S&P500-Mini previous week (63.9 percent)
DowJones-Mini (81.0 percent) vs DowJones-Mini previous week (83.5 percent)
Nasdaq-Mini (41.3 percent) vs Nasdaq-Mini previous week (59.8 percent)
Russell2000-Mini (100.0 percent) vs Russell2000-Mini previous week (85.4 percent)
Nikkei USD (59.2 percent) vs Nikkei USD previous week (63.4 percent)
EAFE-Mini (35.4 percent) vs EAFE-Mini previous week (38.4 percent)


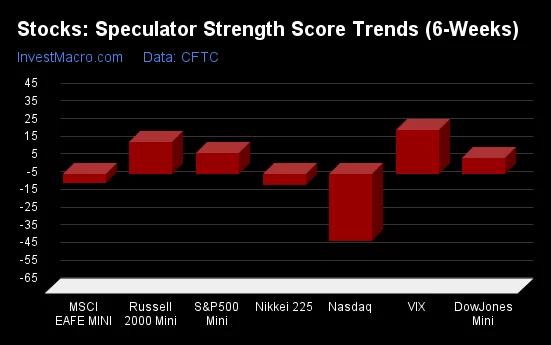
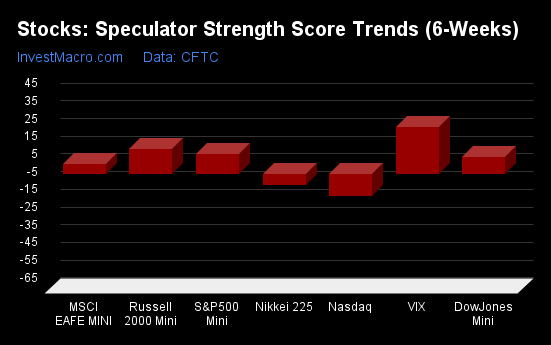
VIX & Russell-Mini top the 6-Week Strength Trends

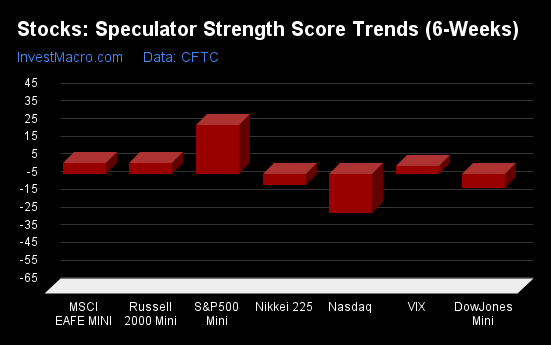
COT Strength Score Trends (or move index, calculates the 6-week changes in strength scores) showed that the VIX (25 percent) leads the past six weeks trends for the stock markets. The Russell-Mini (18 percent), the S&P500-Mini (11 percent) and the DowJones-Mini (9 percent) are the next highest positive movers in the latest trends data.

The Nasdaq-Mini (-38 percent) leads the downside trend scores currently with the Nikkei USD (-6 percent) coming in as the next market with lower trend scores.

Strength Trend Statistics:
VIX (24.6 percent) vs VIX previous week (25.7 percent)
S&P500-Mini (11.5 percent) vs S&P500-Mini previous week (11.4 percent)
DowJones-Mini (9.1 percent) vs DowJones-Mini previous week (9.6 percent)
Nasdaq-Mini (-38.1 percent) vs Nasdaq-Mini previous week (-12.6 percent)
Russell2000-Mini (17.8 percent) vs Russell2000-Mini previous week (13.9 percent)
Nikkei USD (-6.3 percent) vs Nikkei USD previous week (16.2 percent)
EAFE-Mini (-5.4 percent) vs EAFE-Mini previous week (5.8 percent)


Individual Stock Market Charts:

VIX Volatility Futures:

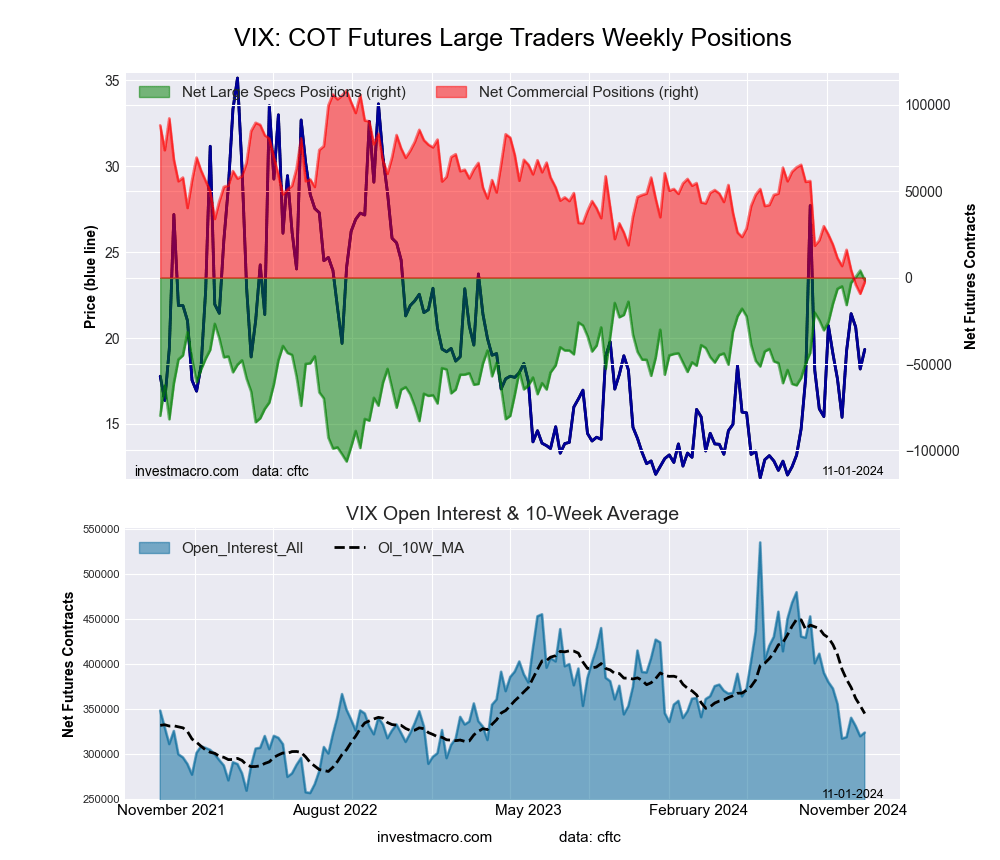
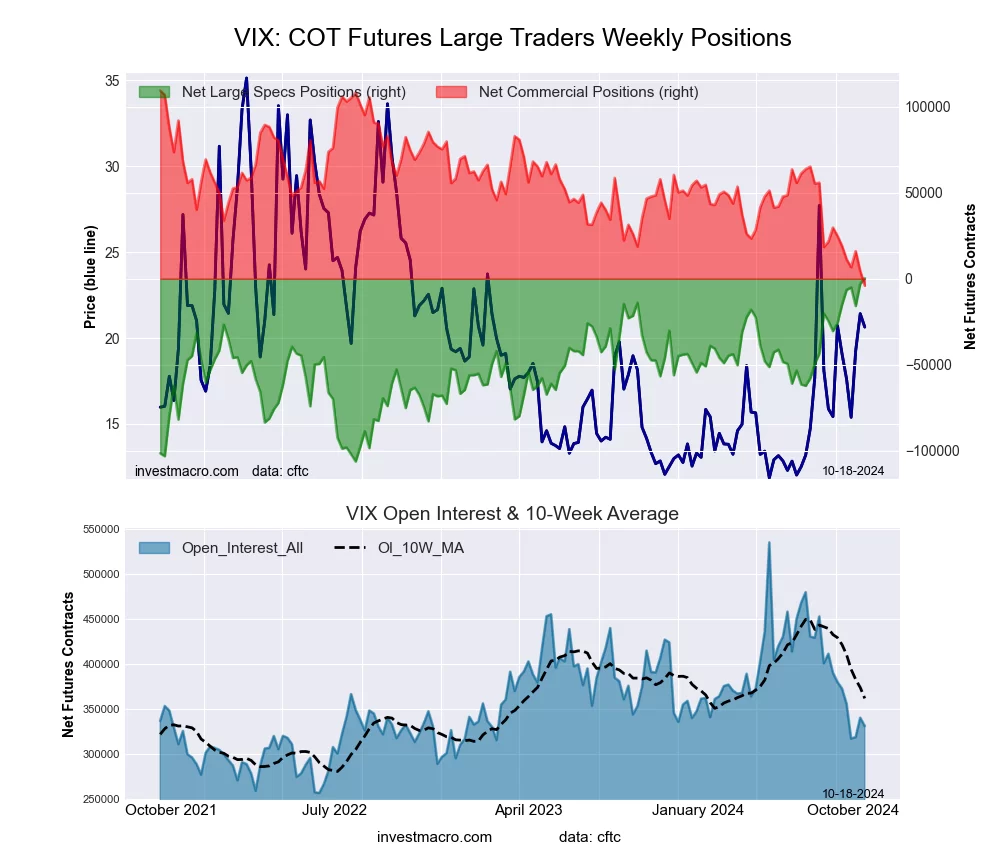
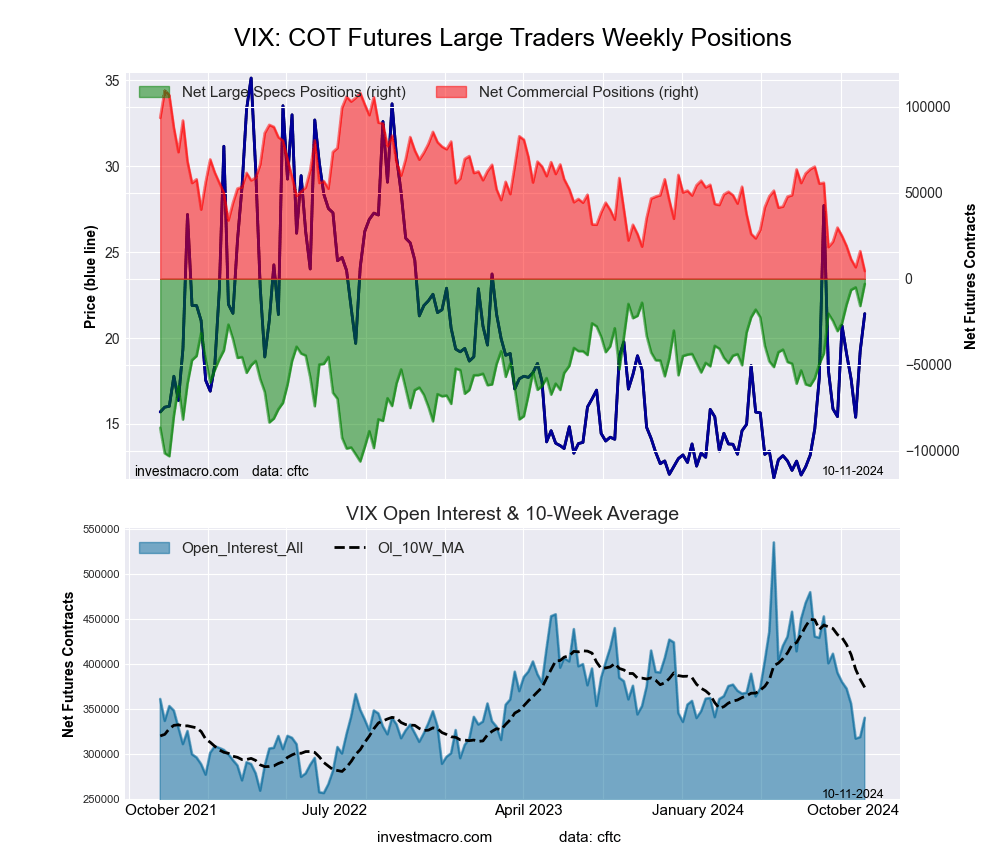
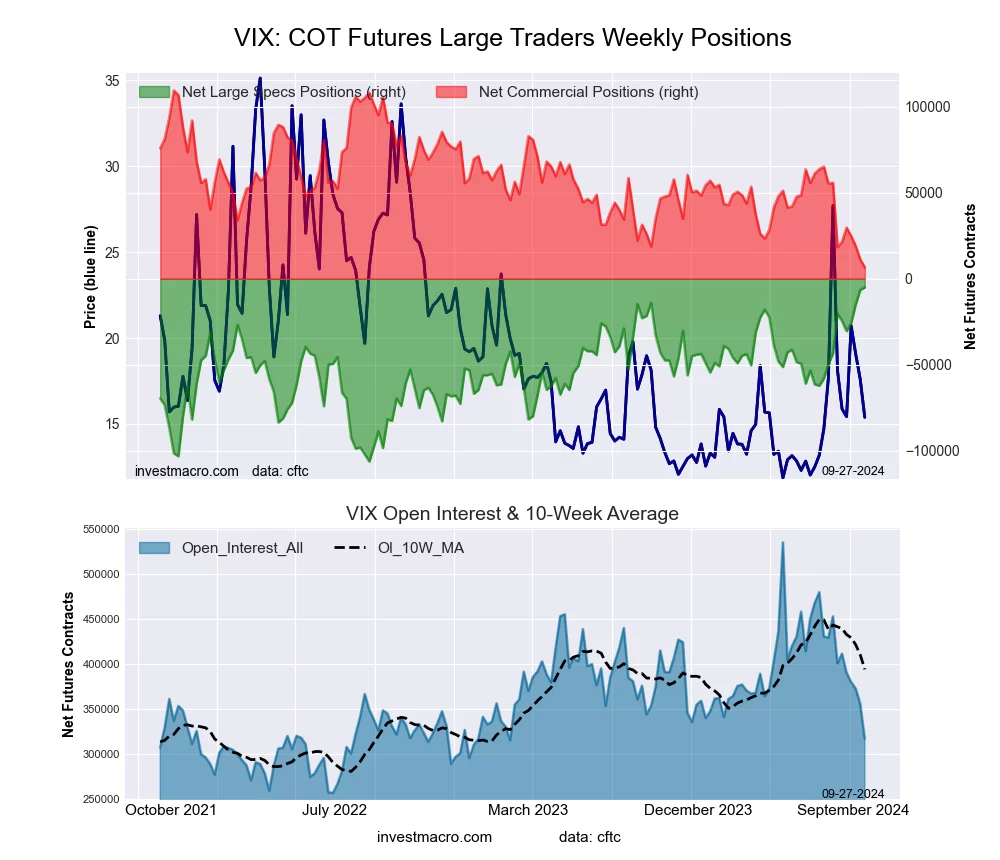
VIX Volatility Futures COT ChartThe VIX Volatility large speculator standing this week was a net position of 322 contracts in the data reported through Tuesday. This was a weekly boost of 3,330 contracts from the previous week which had a total of -3,008 net contracts.

This week’s current strength score (the trader positioning range over the past three years, measured from 0 to 100) shows the speculators are currently Bullish-Extreme with a score of 100.0 percent. The commercials are Bearish-Extreme with a score of 0.0 percent and the small traders (not shown in chart) are Bullish-Extreme with a score of 100.0 percent.

Price Trend-Following Model: Uptrend

Our weekly trend-following model classifies the current market price position as: Uptrend.

VIX Volatility Futures StatisticsSPECULATORSCOMMERCIALSSMALL TRADERS
– Percent of Open Interest Longs:28.339.78.3
– Percent of Open Interest Shorts:28.240.97.2
– Net Position:322-4,0113,689
– Gross Longs:93,877131,46627,394
– Gross Shorts:93,555135,47723,705
– Long to Short Ratio:1.0 to 11.0 to 11.2 to 1
NET POSITION TREND:
– Strength Index Score (3 Year Range Pct):100.00.0100.0
– Strength Index Reading (3 Year Range):Bullish-ExtremeBearish-ExtremeBullish-Extreme
NET POSITION MOVEMENT INDEX:
– 6-Week Change in Strength Index:24.6-25.511.9


S&P500 Mini Futures:

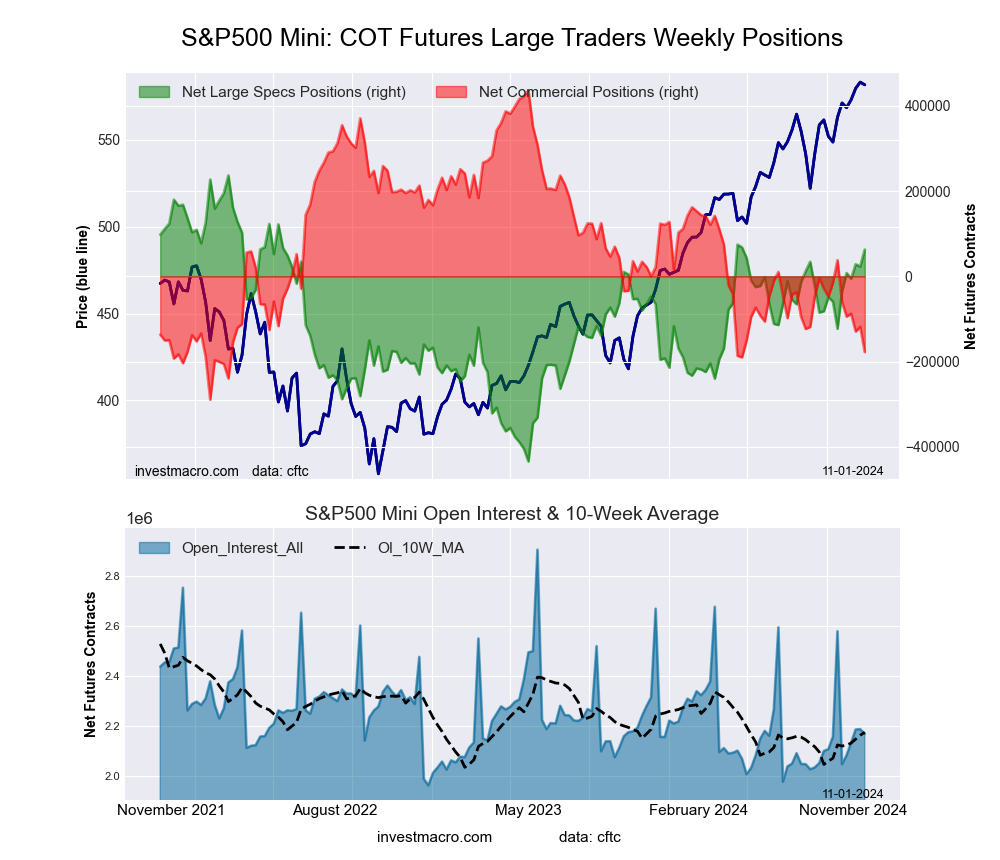
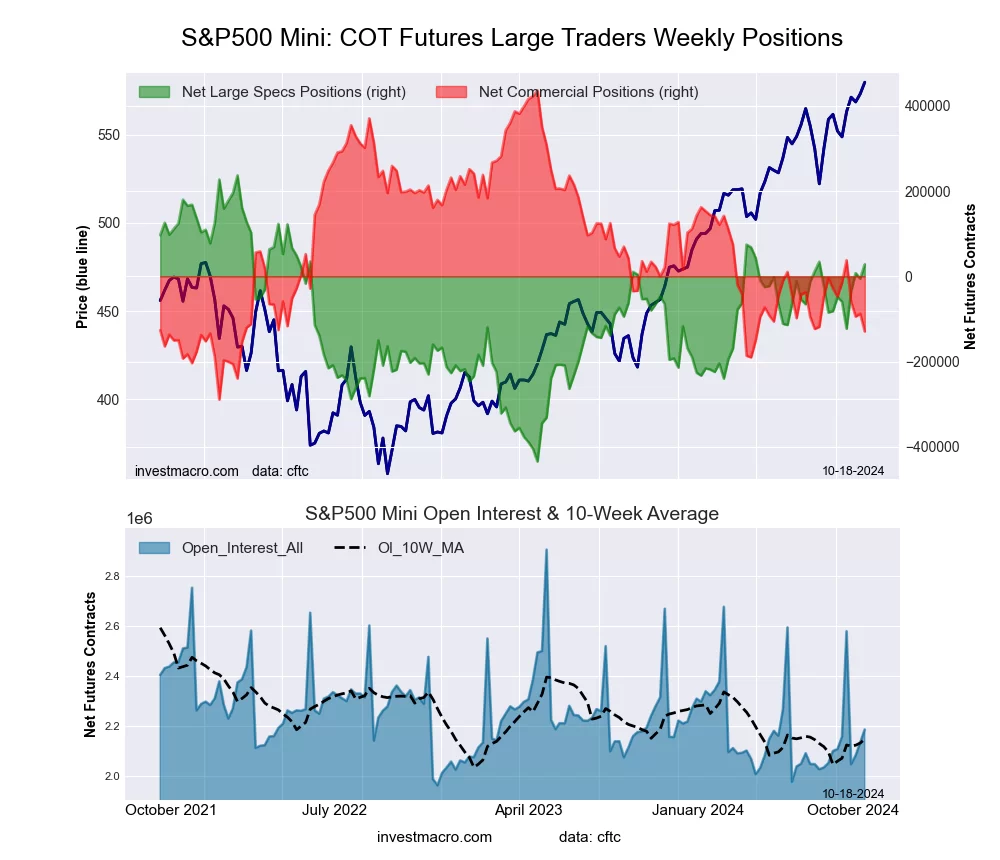
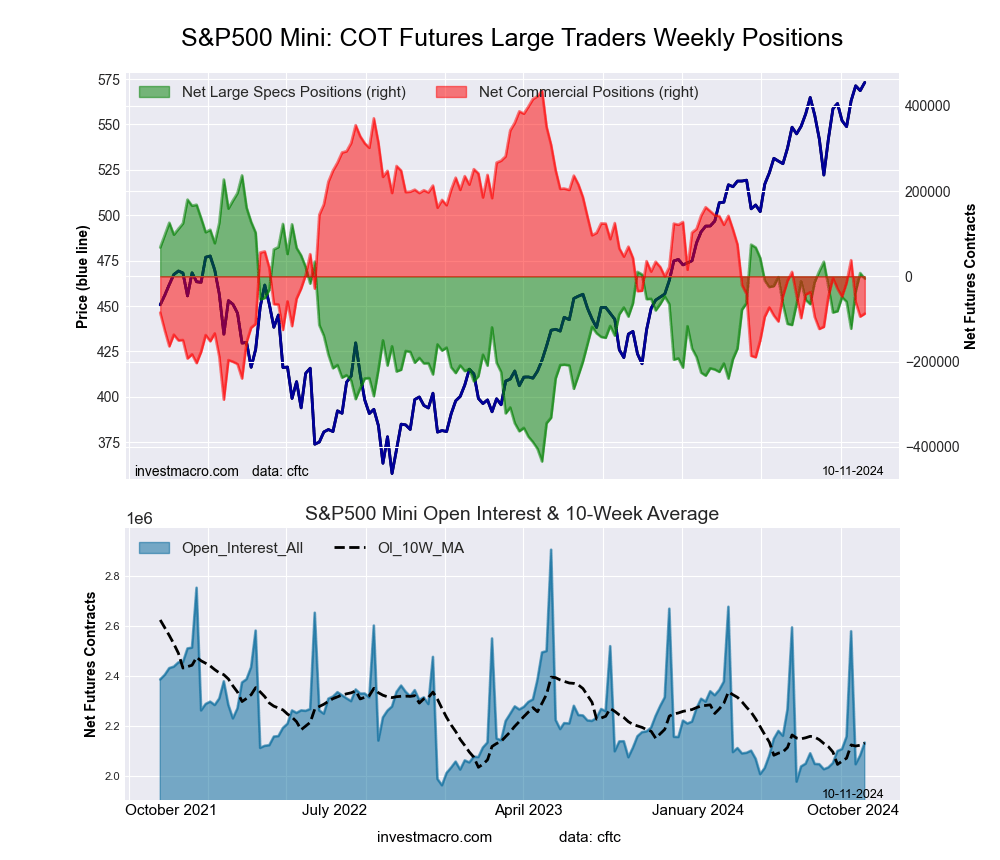
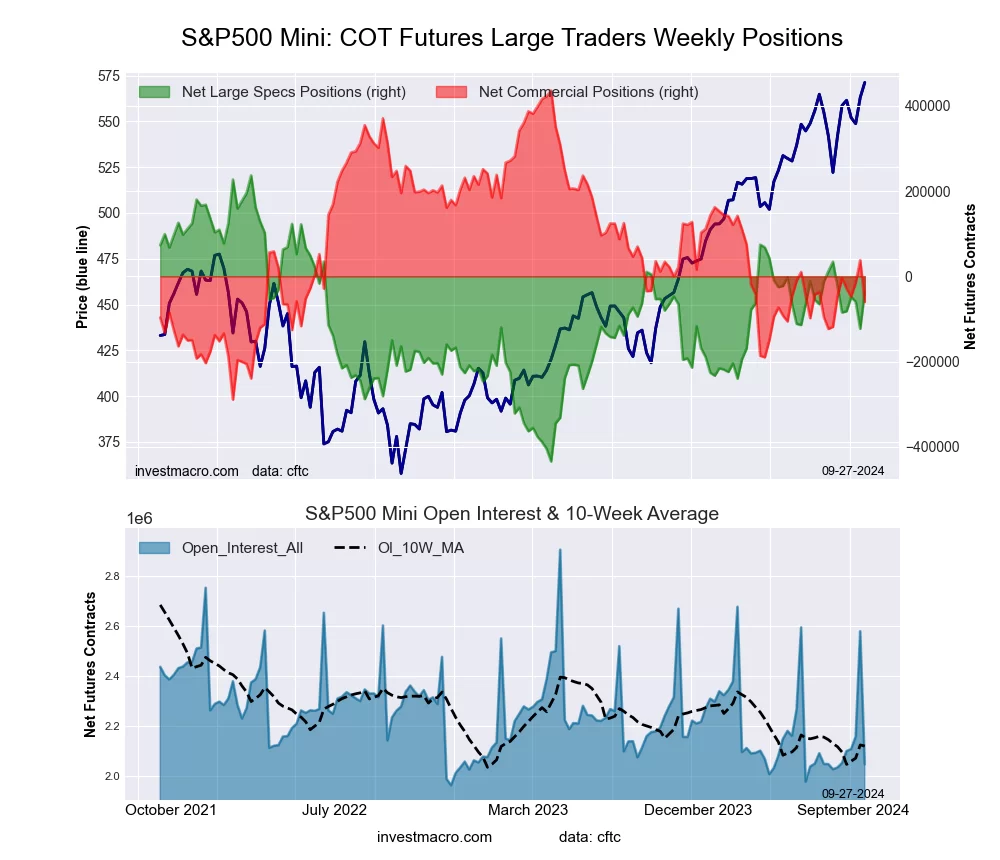
SP500 Mini Futures COT ChartThe S&P500 Mini large speculator standing this week was a net position of 28,135 contracts in the data reported through Tuesday. This was a weekly lift of 33,779 contracts from the previous week which had a total of -5,644 net contracts.

This week’s current strength score (the trader positioning range over the past three years, measured from 0 to 100) shows the speculators are currently Bullish with a score of 68.9 percent. The commercials are Bearish with a score of 22.0 percent and the small traders (not shown in chart) are Bullish-Extreme with a score of 90.2 percent.

Price Trend-Following Model: Strong Uptrend

Our weekly trend-following model classifies the current market price position as: Strong Uptrend.

S&P500 Mini Futures StatisticsSPECULATORSCOMMERCIALSSMALL TRADERS
– Percent of Open Interest Longs:16.069.712.4
– Percent of Open Interest Shorts:14.775.67.8
– Net Position:28,135-129,397101,262
– Gross Longs:350,2271,522,232271,343
– Gross Shorts:322,0921,651,629170,081
– Long to Short Ratio:1.1 to 10.9 to 11.6 to 1
NET POSITION TREND:
– Strength Index Score (3 Year Range Pct):68.922.090.2
– Strength Index Reading (3 Year Range):BullishBearishBullish-Extreme
NET POSITION MOVEMENT INDEX:
– 6-Week Change in Strength Index:11.5-11.32.2


Dow Jones Mini Futures:

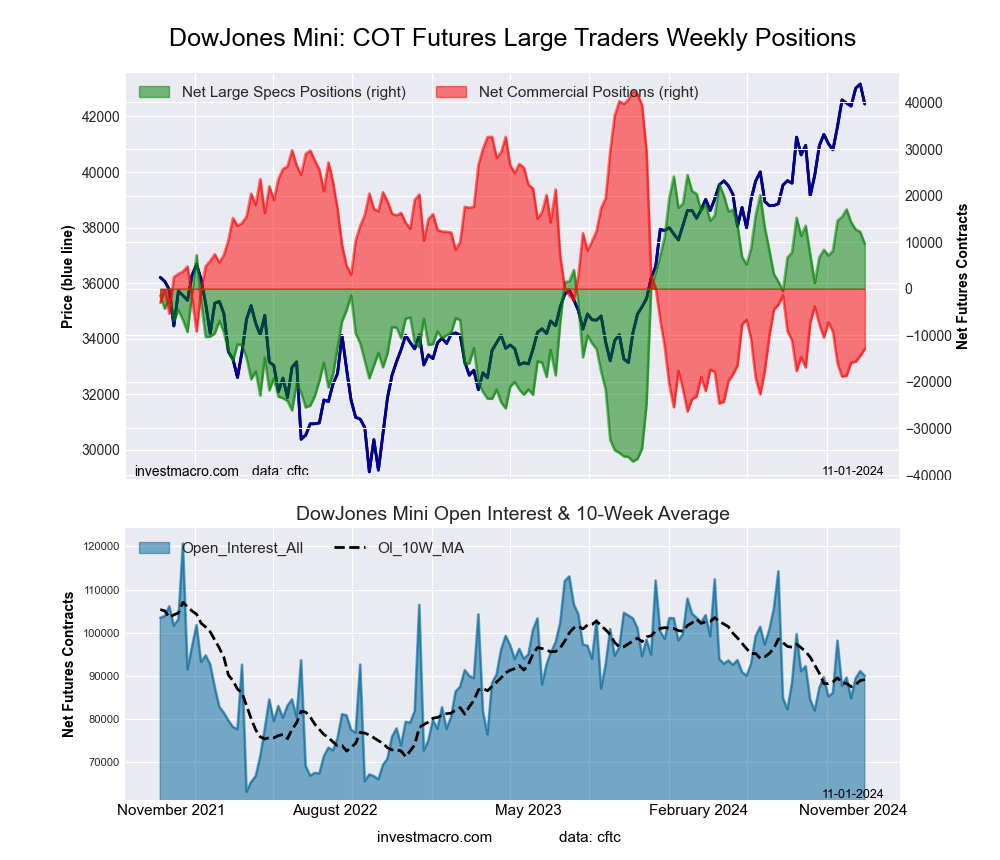
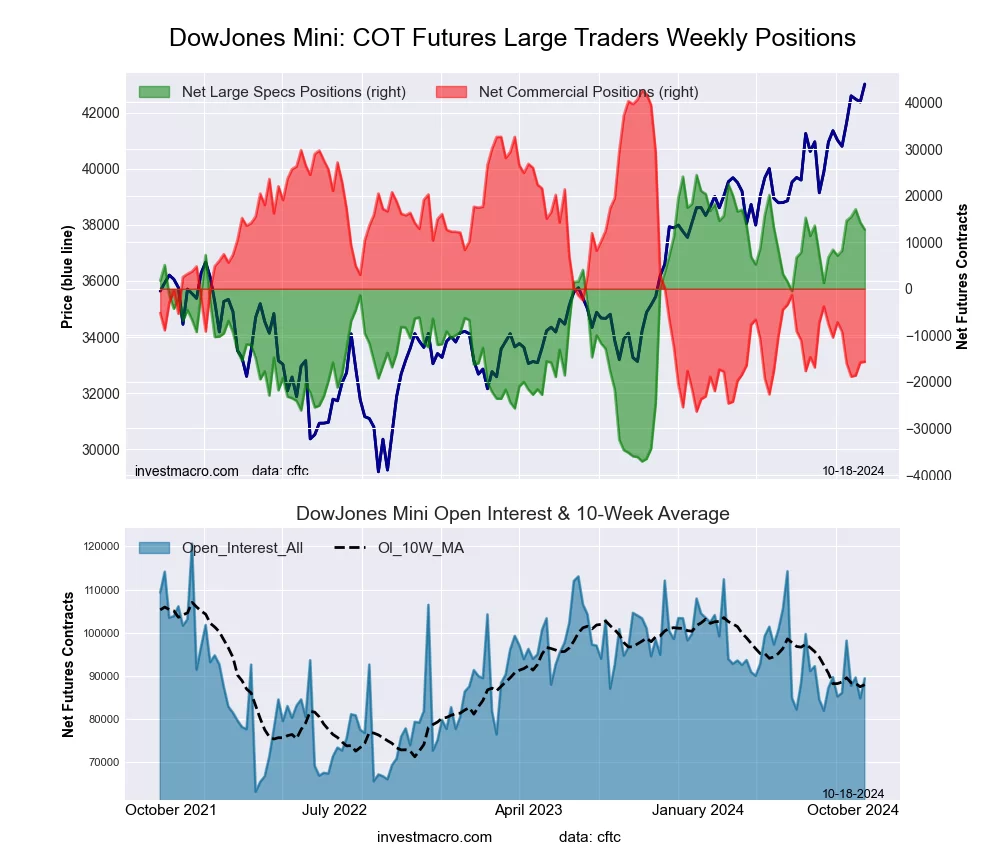
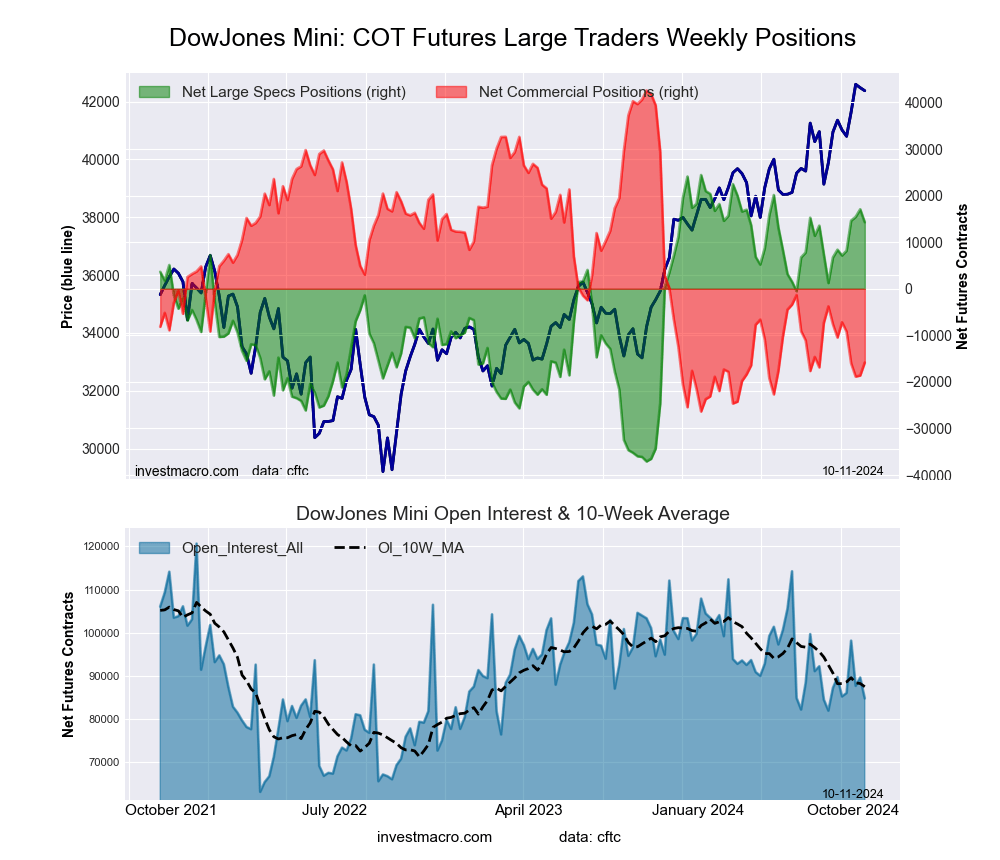
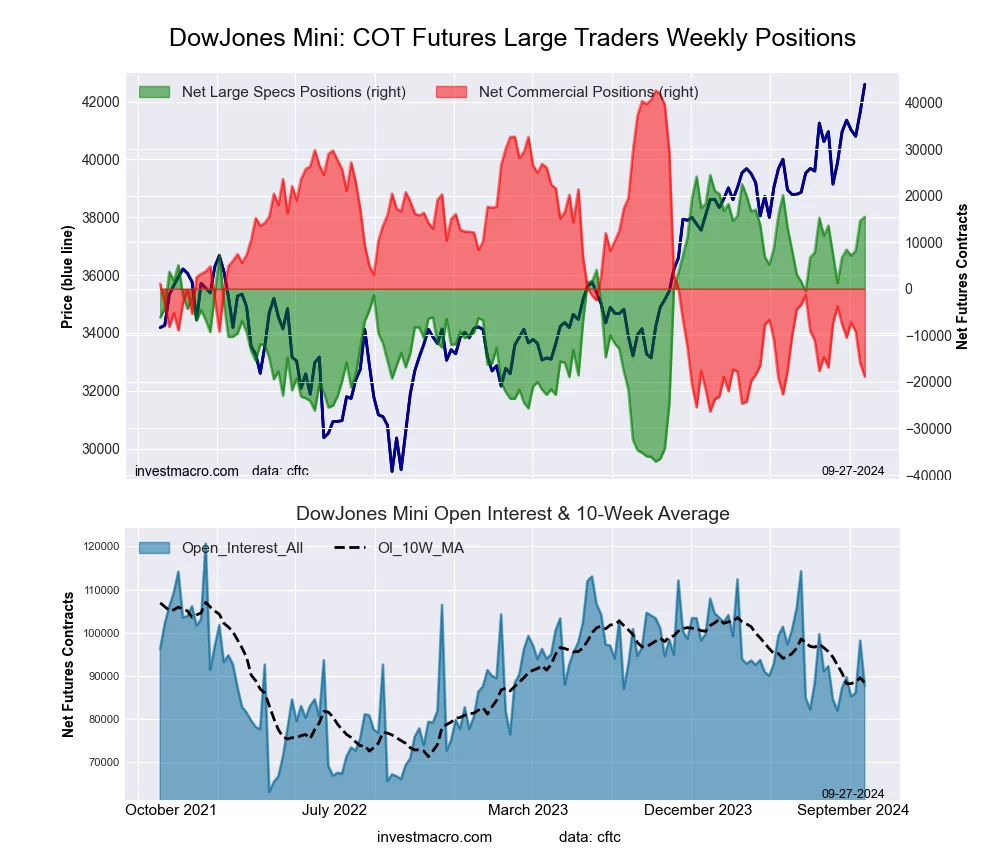
Dow Jones Mini Futures COT ChartThe Dow Jones Mini large speculator standing this week was a net position of 12,716 contracts in the data reported through Tuesday. This was a weekly lowering of -1,570 contracts from the previous week which had a total of 14,286 net contracts.

This week’s current strength score (the trader positioning range over the past three years, measured from 0 to 100) shows the speculators are currently Bullish-Extreme with a score of 81.0 percent. The commercials are Bearish-Extreme with a score of 15.5 percent and the small traders (not shown in chart) are Bullish with a score of 72.4 percent.

Price Trend-Following Model: Strong Uptrend

Our weekly trend-following model classifies the current market price position as: Strong Uptrend.

Dow Jones Mini Futures StatisticsSPECULATORSCOMMERCIALSSMALL TRADERS
– Percent of Open Interest Longs:26.255.816.5
– Percent of Open Interest Shorts:12.073.313.2
– Net Position:12,716-15,6652,949
– Gross Longs:23,41449,85814,714
– Gross Shorts:10,69865,52311,765
– Long to Short Ratio:2.2 to 10.8 to 11.3 to 1
NET POSITION TREND:
– Strength Index Score (3 Year Range Pct):81.015.572.4
– Strength Index Reading (3 Year Range):Bullish-ExtremeBearish-ExtremeBullish
NET POSITION MOVEMENT INDEX:
– 6-Week Change in Strength Index:9.1-12.317.5


Nasdaq Mini Futures:

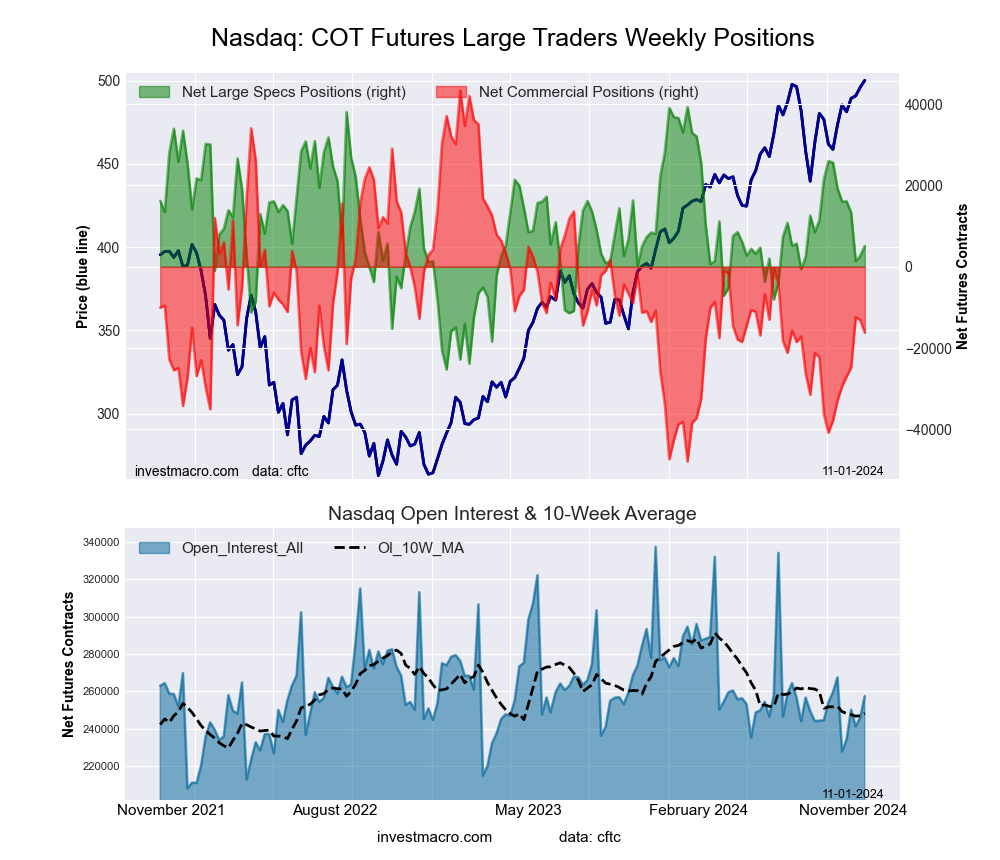
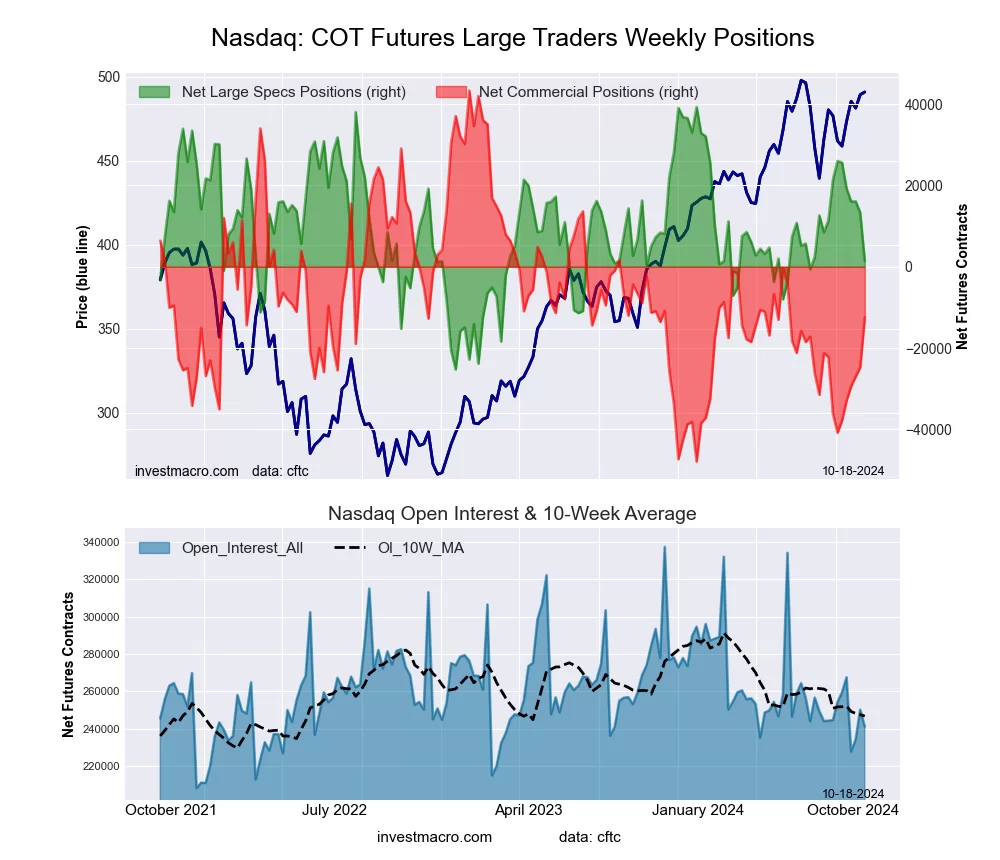
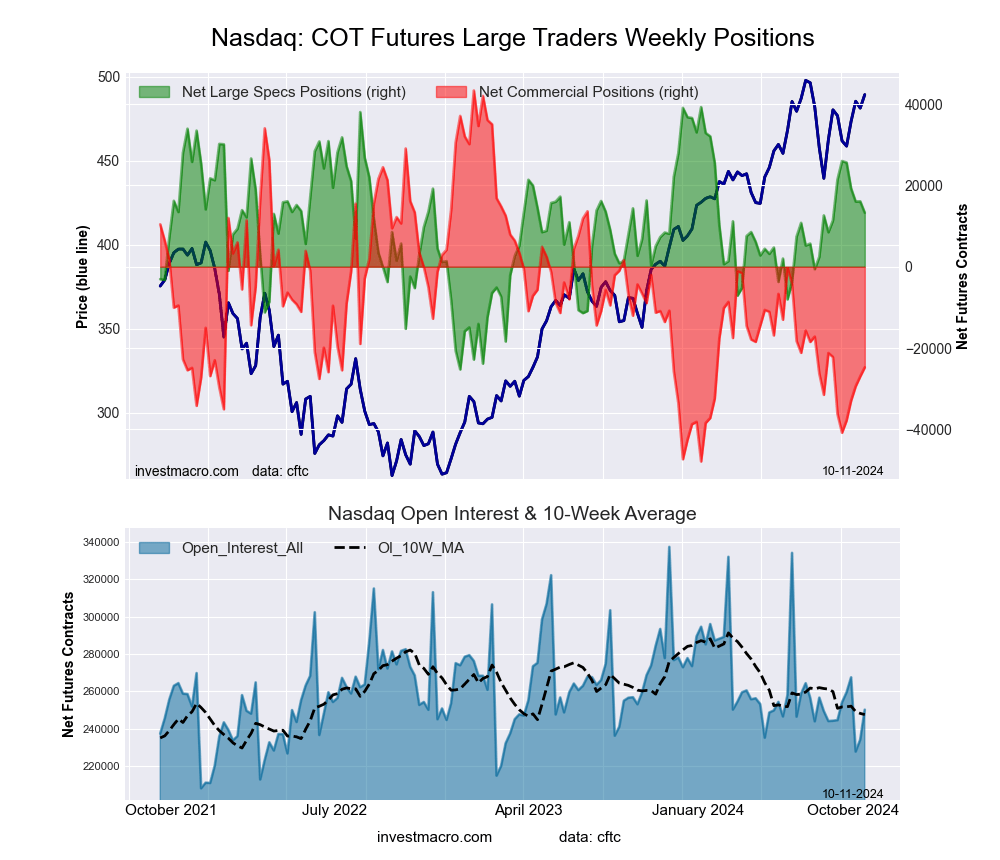
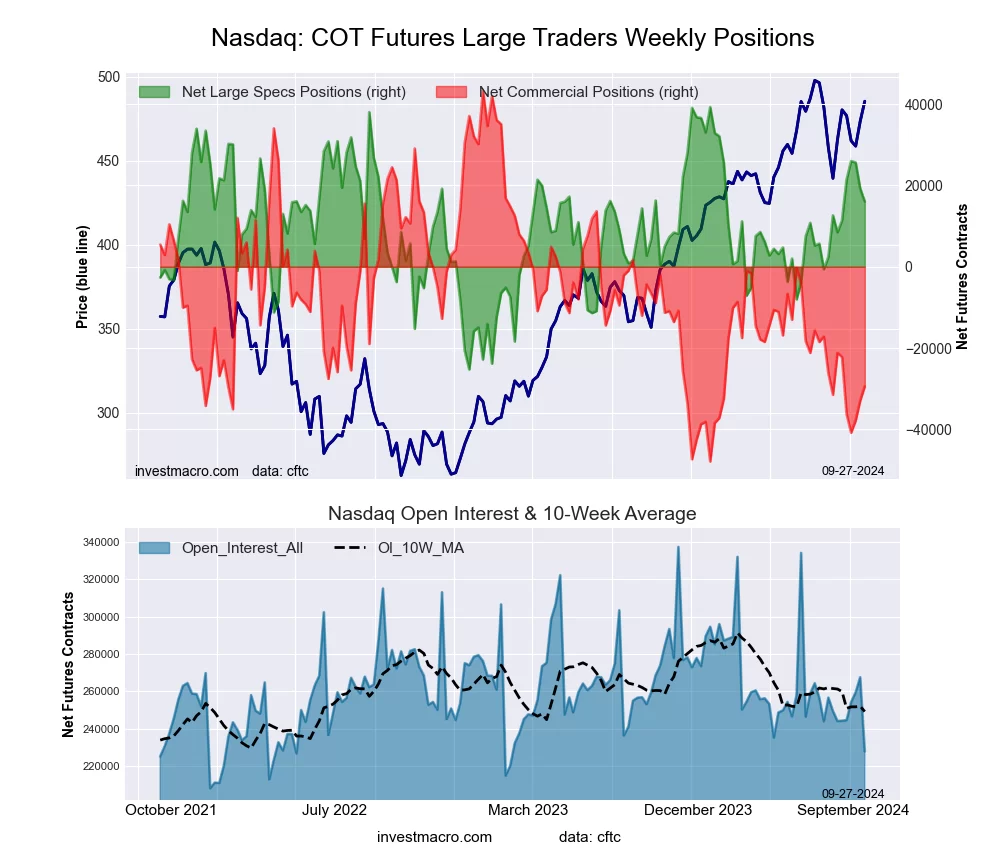
Nasdaq Mini Futures COT ChartThe Nasdaq Mini large speculator standing this week was a net position of 1,404 contracts in the data reported through Tuesday. This was a weekly decline of -11,891 contracts from the previous week which had a total of 13,295 net contracts.

This week’s current strength score (the trader positioning range over the past three years, measured from 0 to 100) shows the speculators are currently Bearish with a score of 41.3 percent. The commercials are Bearish with a score of 38.9 percent and the small traders (not shown in chart) are Bullish with a score of 75.5 percent.

Price Trend-Following Model: Strong Uptrend

Our weekly trend-following model classifies the current market price position as: Strong Uptrend.

Nasdaq Mini Futures StatisticsSPECULATORSCOMMERCIALSSMALL TRADERS
– Percent of Open Interest Longs:20.361.516.4
– Percent of Open Interest Shorts:19.766.611.8
– Net Position:1,404-12,40911,005
– Gross Longs:48,843148,31539,446
– Gross Shorts:47,439160,72428,441
– Long to Short Ratio:1.0 to 10.9 to 11.4 to 1
NET POSITION TREND:
– Strength Index Score (3 Year Range Pct):41.338.975.5
– Strength Index Reading (3 Year Range):BearishBearishBullish
NET POSITION MOVEMENT INDEX:
– 6-Week Change in Strength Index:-38.131.1-7.3


Russell 2000 Mini Futures:

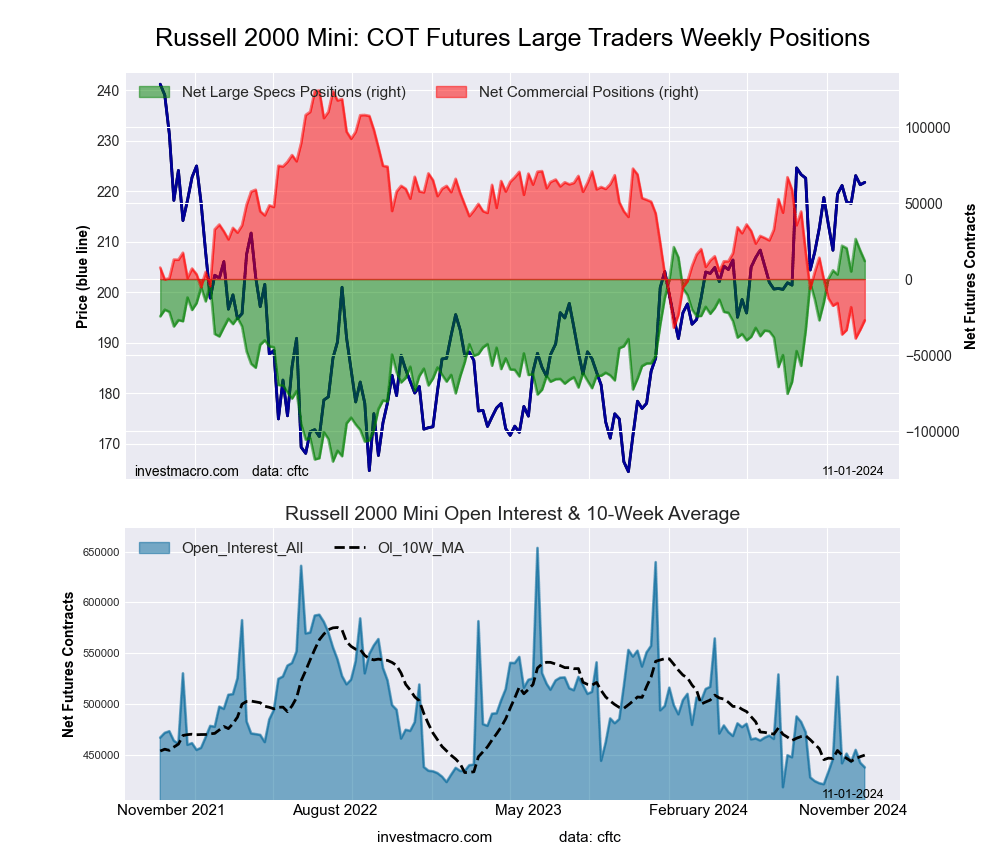
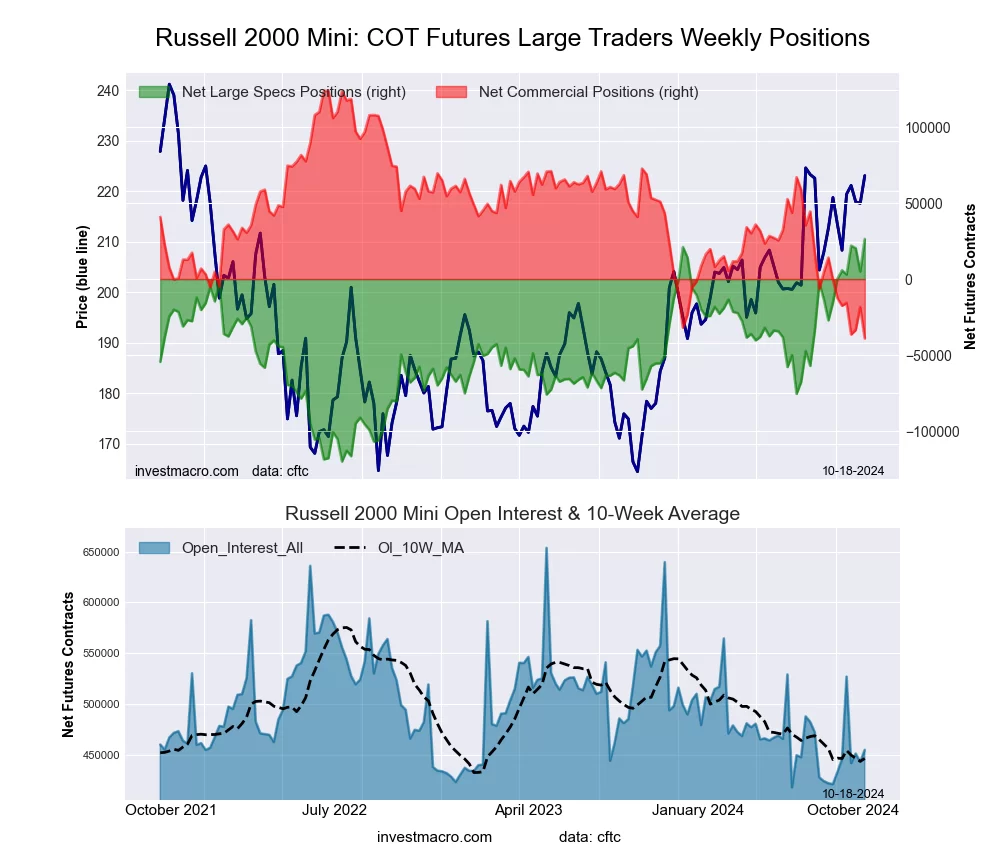
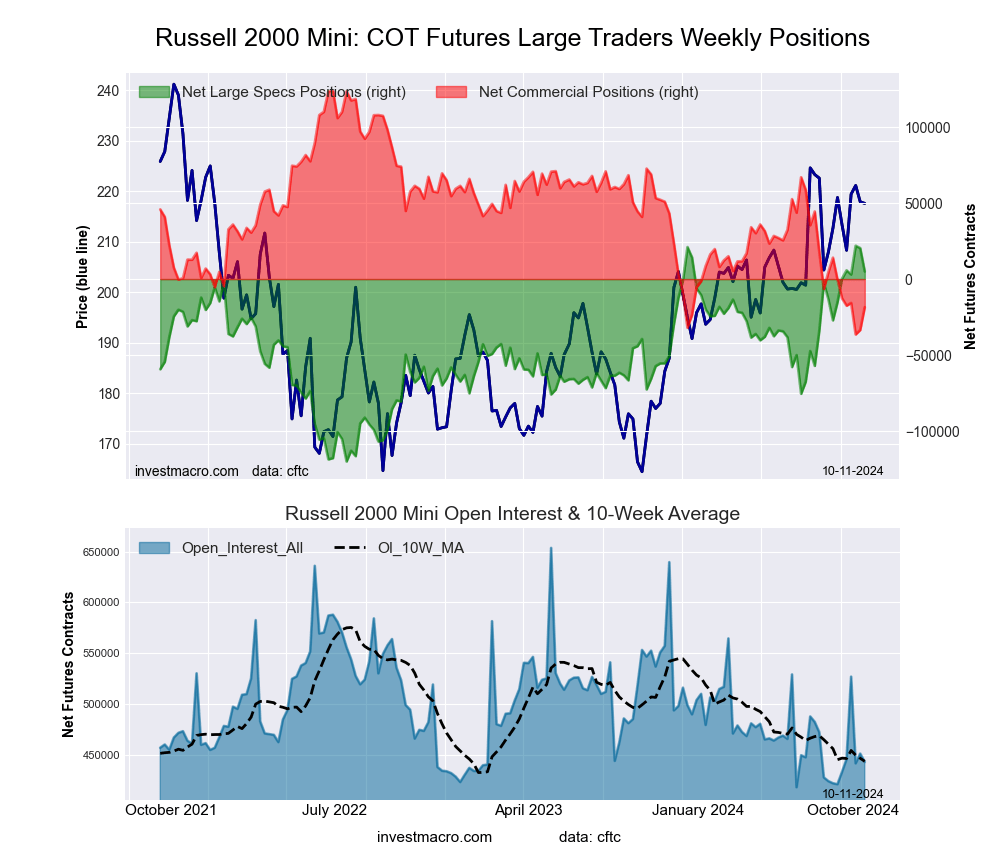
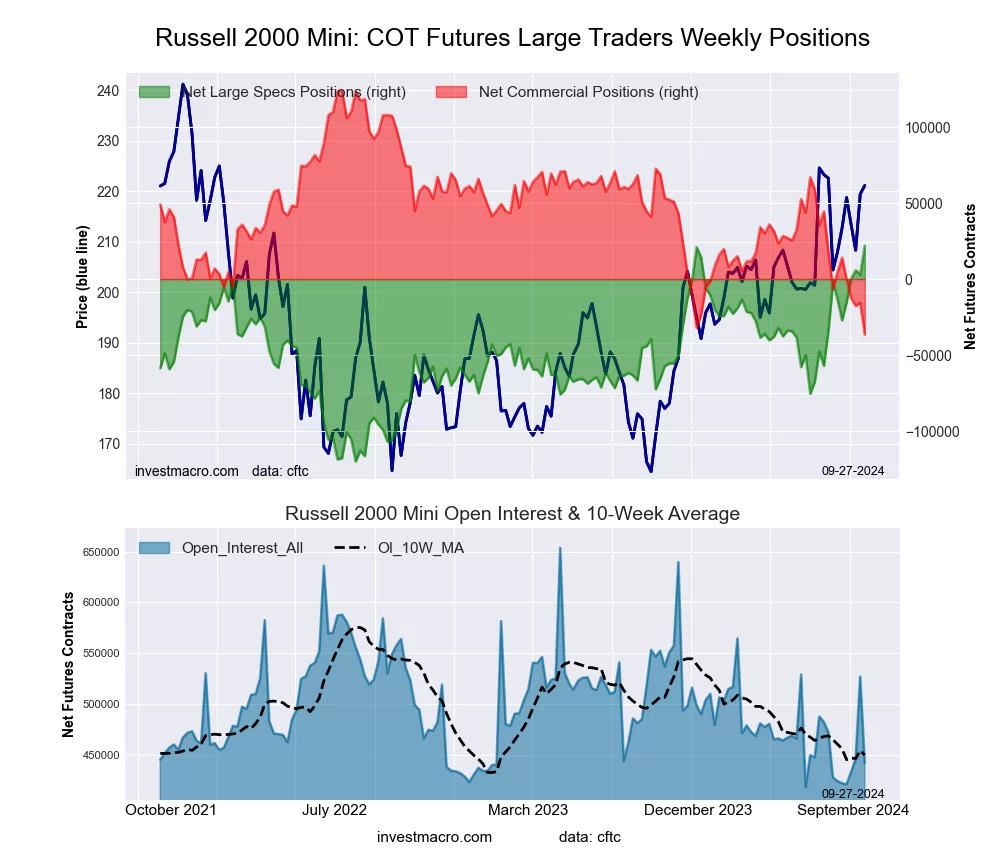
Russell 2000 Mini Futures COT ChartThe Russell 2000 Mini large speculator standing this week was a net position of 26,337 contracts in the data reported through Tuesday. This was a weekly advance of 21,330 contracts from the previous week which had a total of 5,007 net contracts.

This week’s current strength score (the trader positioning range over the past three years, measured from 0 to 100) shows the speculators are currently Bullish-Extreme with a score of 100.0 percent. The commercials are Bearish-Extreme with a score of 0.0 percent and the small traders (not shown in chart) are Bullish with a score of 71.7 percent.

Price Trend-Following Model: Strong Uptrend

Our weekly trend-following model classifies the current market price position as: Strong Uptrend.

Russell 2000 Mini Futures StatisticsSPECULATORSCOMMERCIALSSMALL TRADERS
– Percent of Open Interest Longs:20.869.76.9
– Percent of Open Interest Shorts:15.078.34.1
– Net Position:26,337-39,01512,678
– Gross Longs:94,562317,47631,364
– Gross Shorts:68,225356,49118,686
– Long to Short Ratio:1.4 to 10.9 to 11.7 to 1
NET POSITION TREND:
– Strength Index Score (3 Year Range Pct):100.00.071.7
– Strength Index Reading (3 Year Range):Bullish-ExtremeBearish-ExtremeBullish
NET POSITION MOVEMENT INDEX:
– 6-Week Change in Strength Index:17.8-16.21.1


Nikkei Stock Average (USD) Futures:

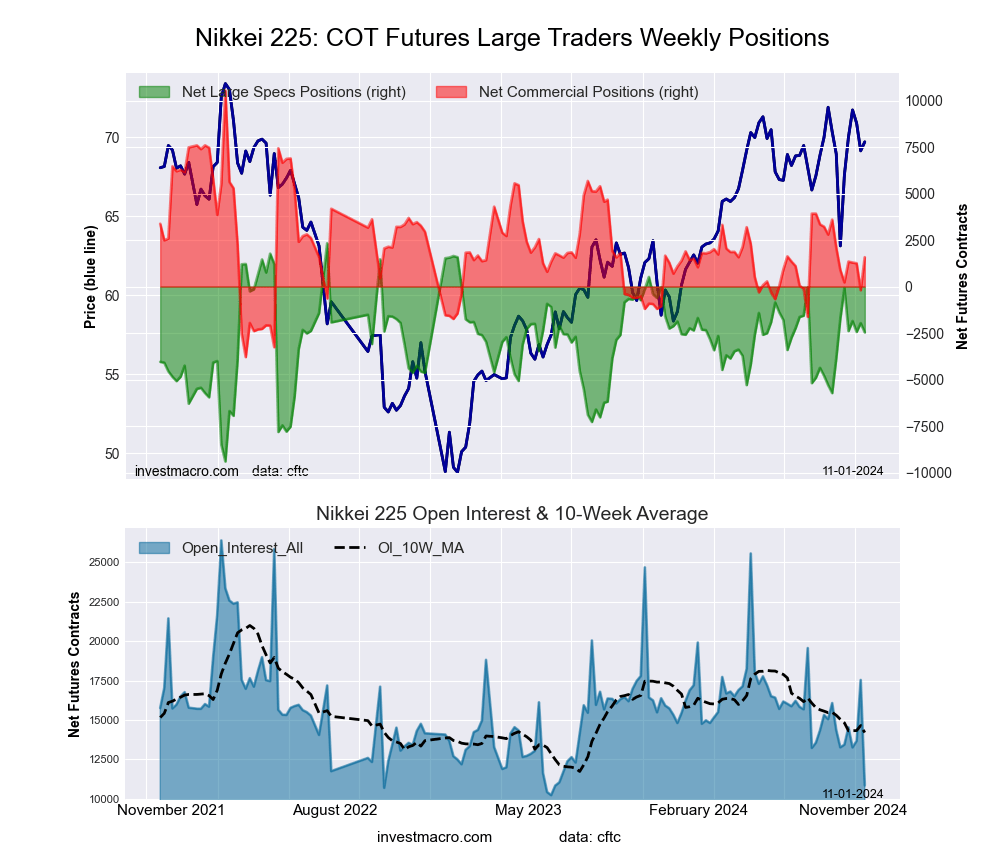
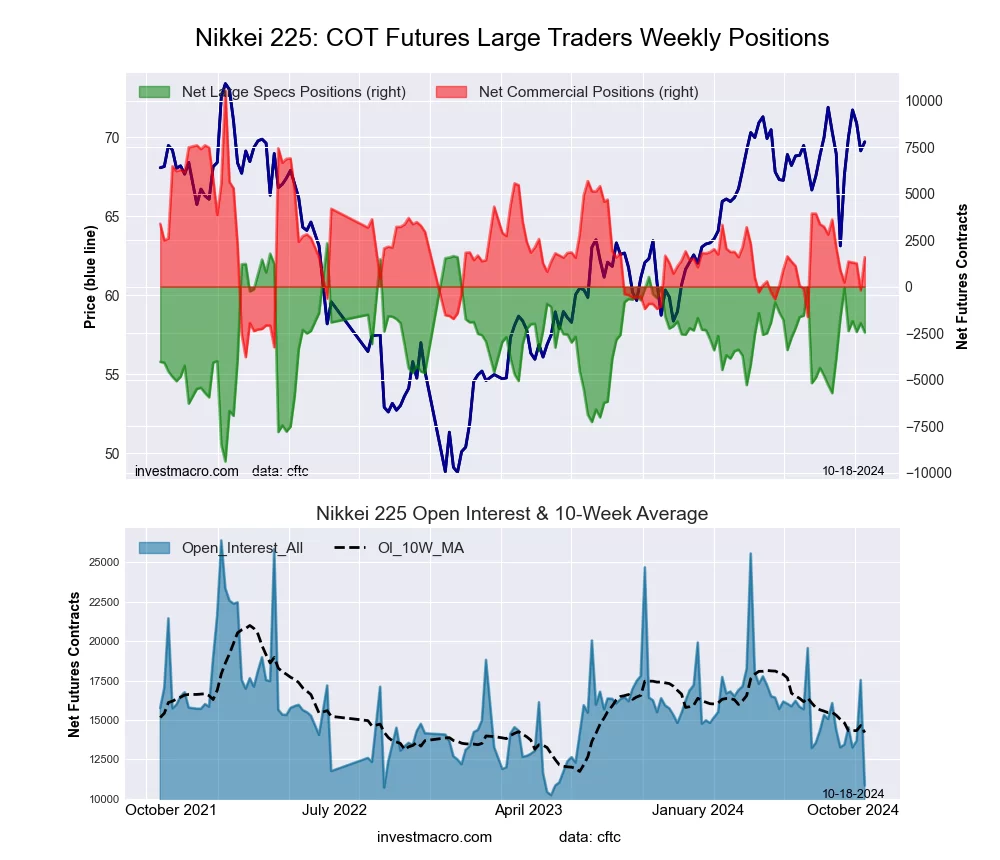
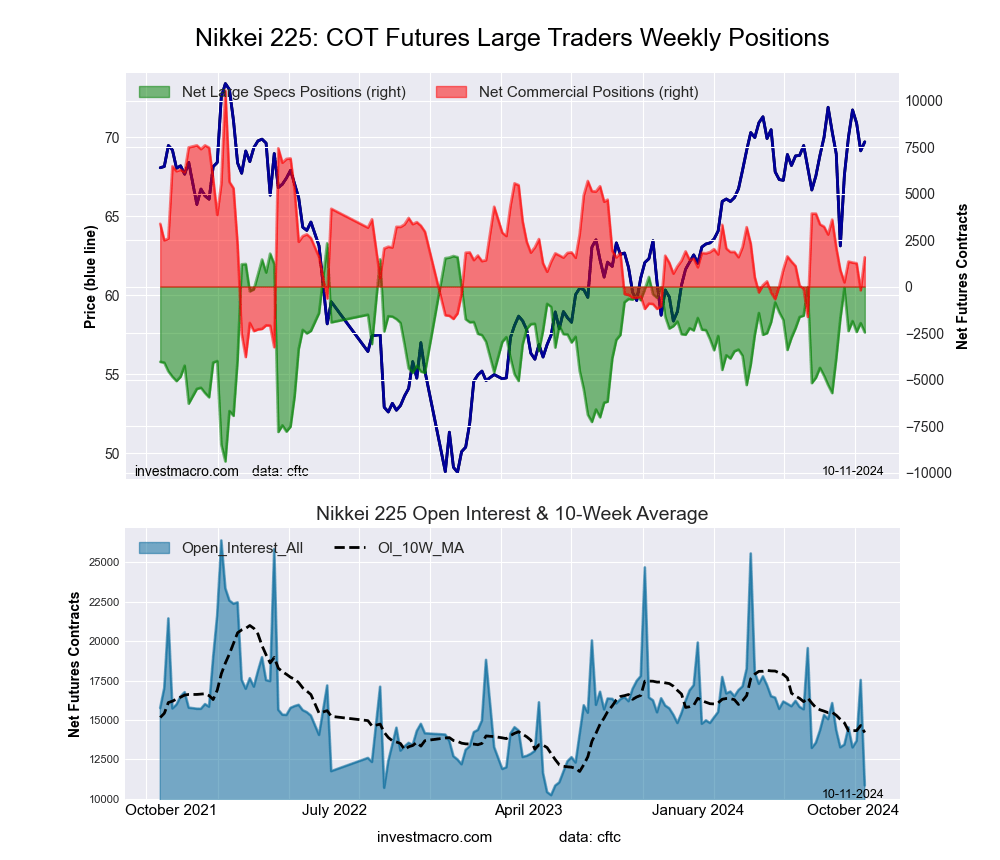
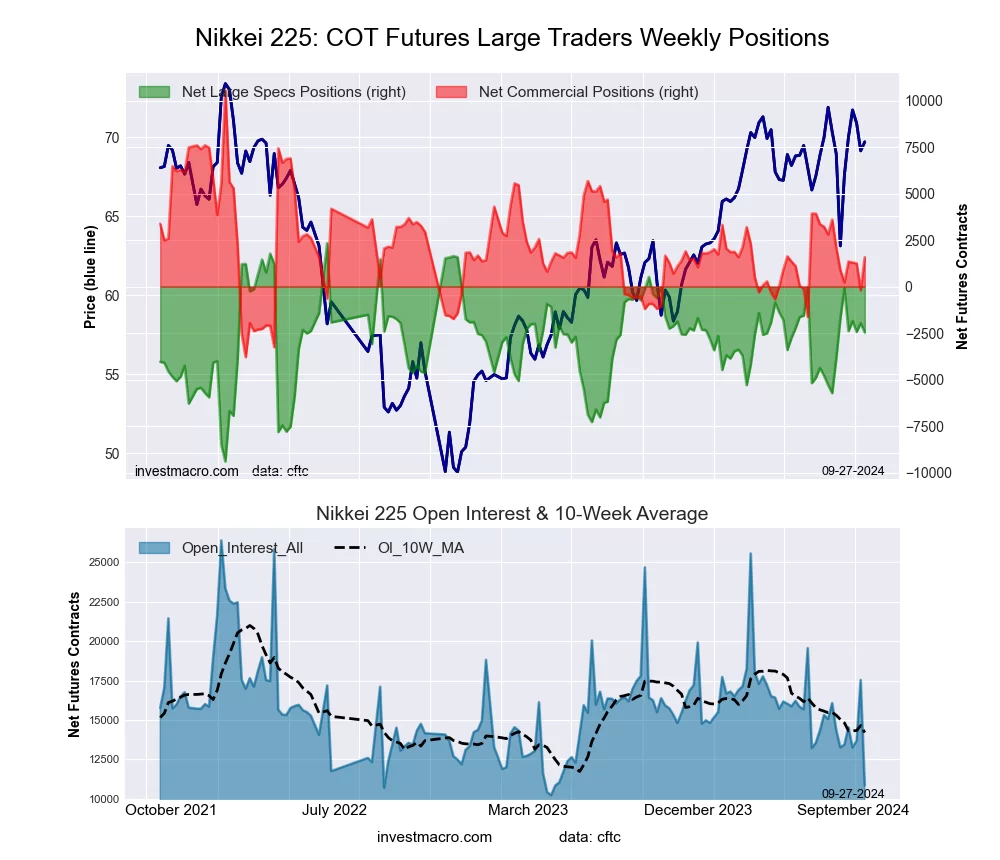
Nikkei Stock Average (USD) Futures COT ChartThe Nikkei Stock Average (USD) large speculator standing this week was a net position of -2,464 contracts in the data reported through Tuesday. This was a weekly reduction of -498 contracts from the previous week which had a total of -1,966 net contracts.

This week’s current strength score (the trader positioning range over the past three years, measured from 0 to 100) shows the speculators are currently Bullish with a score of 59.2 percent. The commercials are Bearish with a score of 37.5 percent and the small traders (not shown in chart) are Bullish with a score of 60.1 percent.

Price Trend-Following Model: Uptrend

Our weekly trend-following model classifies the current market price position as: Uptrend.

Nikkei Stock Average Futures StatisticsSPECULATORSCOMMERCIALSSMALL TRADERS
– Percent of Open Interest Longs:2.070.227.7
– Percent of Open Interest Shorts:24.755.719.5
– Net Position:-2,4641,576888
– Gross Longs:2217,6203,008
– Gross Shorts:2,6856,0442,120
– Long to Short Ratio:0.1 to 11.3 to 11.4 to 1
NET POSITION TREND:
– Strength Index Score (3 Year Range Pct):59.237.560.1
– Strength Index Reading (3 Year Range):BullishBearishBullish
NET POSITION MOVEMENT INDEX:
– 6-Week Change in Strength Index:-6.34.81.0


MSCI EAFE Mini Futures:

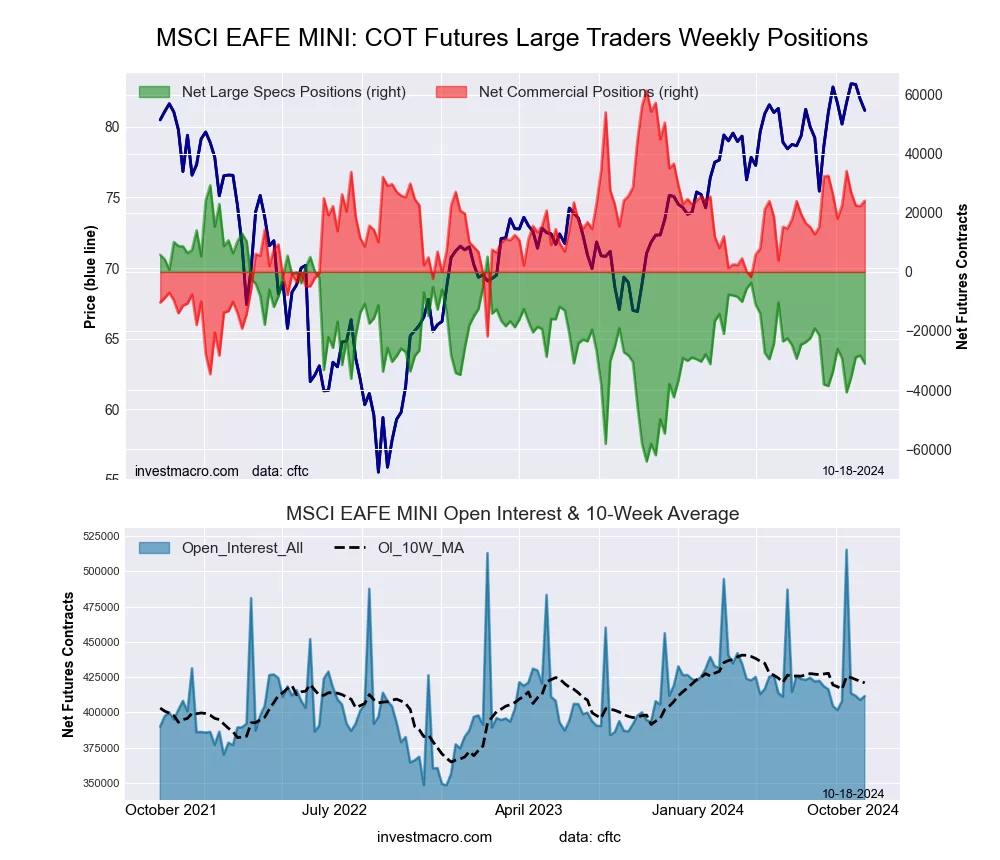
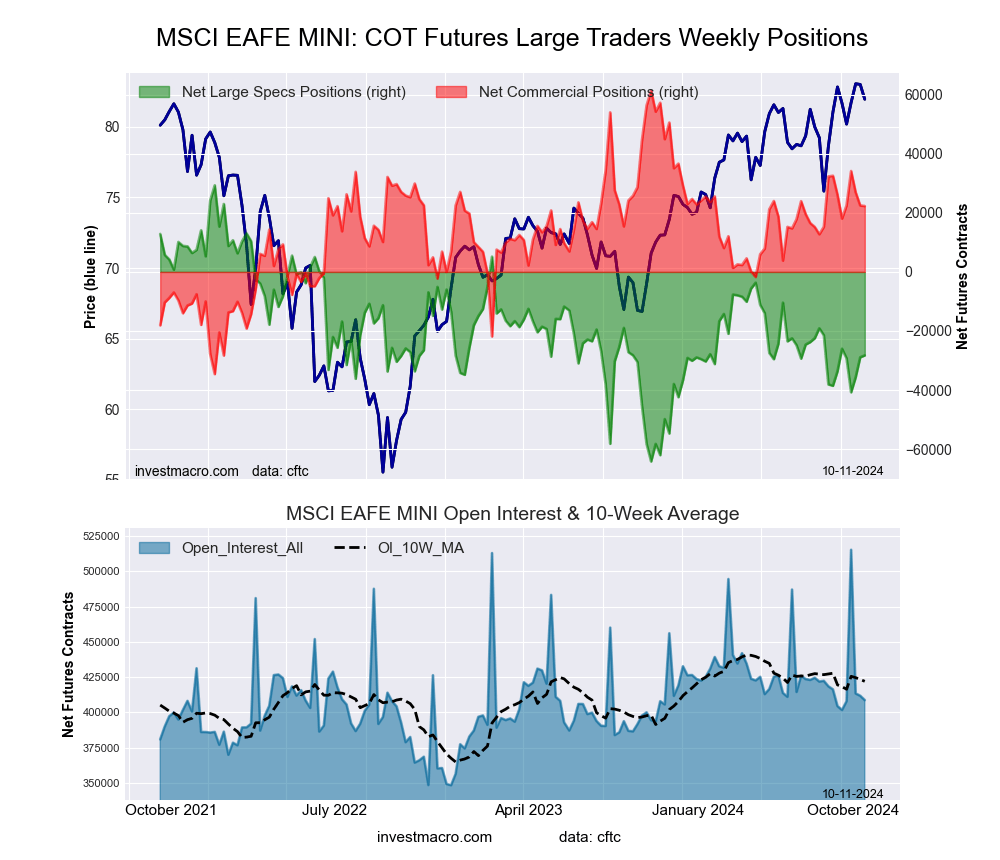
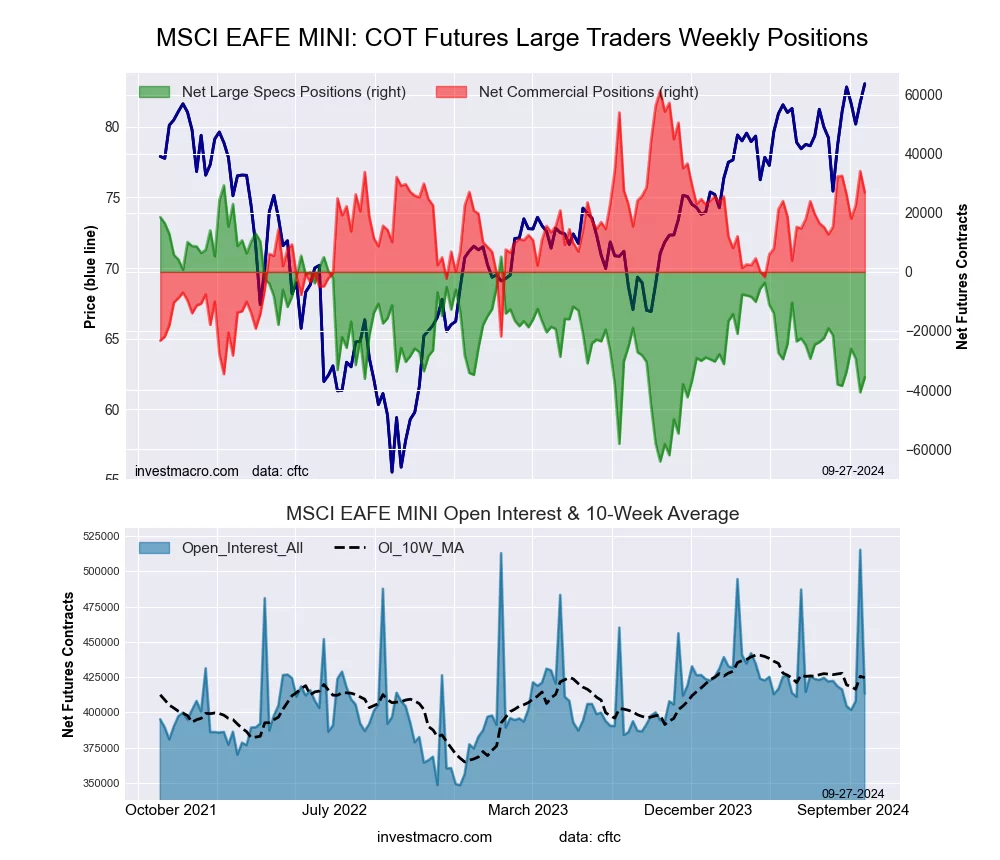
MSCI EAFE Mini Futures COT ChartThe MSCI EAFE Mini large speculator standing this week was a net position of -31,047 contracts in the data reported through Tuesday. This was a weekly lowering of -2,773 contracts from the previous week which had a total of -28,274 net contracts.

This week’s current strength score (the trader positioning range over the past three years, measured from 0 to 100) shows the speculators are currently Bearish with a score of 35.4 percent. The commercials are Bullish with a score of 61.1 percent and the small traders (not shown in chart) are Bullish with a score of 51.6 percent.

Price Trend-Following Model: Uptrend

Our weekly trend-following model classifies the current market price position as: Uptrend.

MSCI EAFE Mini Futures StatisticsSPECULATORSCOMMERCIALSSMALL TRADERS
– Percent of Open Interest Longs:7.988.73.2
– Percent of Open Interest Shorts:15.482.81.5
– Net Position:-31,04724,1126,935
– Gross Longs:32,341365,04713,105
– Gross Shorts:63,388340,9356,170
– Long to Short Ratio:0.5 to 11.1 to 12.1 to 1
NET POSITION TREND:
– Strength Index Score (3 Year Range Pct):35.461.151.6
– Strength Index Reading (3 Year Range):BearishBullishBullish
NET POSITION MOVEMENT INDEX:
– 6-Week Change in Strength Index:-5.46.3-5.1


Article By InvestMacroReceive our weekly COT Newsletter

*COT Report: The COT data, released weekly to the public each Friday, is updated through the most recent Tuesday (data is 3 days old) and shows a quick view of how large speculators or non-commercials (for-profit traders) were positioned in the futures markets.

The CFTC categorizes trader positions according to commercial hedgers (traders who use futures contracts for hedging as part of the business), non-commercials (large traders who speculate to realize trading profits) and nonreportable traders (usually small traders/speculators) as well as their open interest (contracts open in the market at time of reporting). See CFTC criteria here.

Week Ahead: Tesla kicks off Big Tech earnings

By ForexTime

  • Tesla ↑ almost 60% from 2024 low
  • Earnings released on 23rd October after US market close
  • Impact of price cuts & Q4 outlook in focus
  • Shares could move 6.2% ↑ or ↓ post earnings
  • Technical levels – 50 & 100-day SMA, $213.00

The week ahead is stacked with top-tier data releases, speeches by policymakers, and more quarterly earnings from the largest companies in the world:

Monday, 21st October

  • CN50: China loan prime rates
  • TWN: Taiwan export orders
  • USDInd: US Conference Board leading index, Fed speeches

Tuesday, 22nd October

  • NZD: New Zealand trade
  • EU50: ECB President Christine Lagarde interview
  • UK100: BOE Governor Andrew Bailey speech

Wednesday, 23rd October

  • CAD: BoC rate decision
  • EU50: Eurozone consumer confidence, ECB President Lagarde speech
  • SG20: Singapore CPI
  • ZAR: South Africa CPI
  • TWN: Taiwan industrial production
  • US30: US existing home sales, Fed Beige book, Boeing earnings
  • NAS100: Tesla earnings

Thursday, 24th October

  • EU50: Eurozone/Germany PMIs
  • TWN: Taiwan jobless rate
  • UK100: UK S&P Global Manufacturing and Services PMI, Barclays earnings
  • RUS2000:  US jobless claims, S&P Global PMIs

Friday, 25th October  

  • CAD: Canada retail sales
  • EU50: Germany IFO business climate
  • JP225: Japan Tokyo CPI
  • SG20: Singapore industrial production, home prices
  • US400: US durable goods, University of Michigan consumer sentiment

Earnings season is in full swing with solid results from the biggest US banks supporting Wall Street. US equity markets could be injected with fresh volatility when big tech companies report their earnings.

One of the world’s largest EV manufacturers with a market cap of over $700 billion will be in focus.

Tesla shares have had a rough year, rebounding from a mid-April rout but still down over 10% in 2024. The company’s stock tumbled in the week ending 11th October after Elon Musk’s Robotaxi unveiling disappointed investors who had hoped for more concrete details.

Still, Tesla shares are up almost 60% from their 2024 low and could push higher or lower depending on how markets react to the latest earnings.

  • When will earnings be published?

Tesla reports its third-quarter earnings on Wednesday 23rd October after US markets close.  

  • Market expectations

The EV manufacturing is forecast to post earnings of $0.60 per share compared to $0.66 a year ago.

Quarterly revenues are seen rising to $25.4 billion from $23.4 billion in the prior year – equating to an 8.5% increase.

  • What to watch out for

Tesla has already published its delivery figures for Q3, revealing that 462,890 vehicles were delivered – a 6.4% increase from last year. While this was below market estimates, it still marked the company’s first quarter of growth in 2024.

Back in April, Tesla announced a fresh round of price cuts in several major markets. It will be interesting to see how this impacted profitability in Q3.

A boost from any recovery in China after reports earlier this month revealed sales of Tesla’s China-made electric vehicles rose 19.2% in September year-on-year.

Earlier this month, there were reports of top executive departures from the company. Investors may comb through the earnings to see how what this could mean for operations.

Any updates on Tesla’s full self-driving software and outlook for the final quarter of 2024 could help investors gauge its business outlook.

  • How will Tesla react to earnings?

Markets are forecasting a 6.2% move, either Up or Down, for Tesla stocks post earnings.

  • Technical picture

Tesla shares are under pressure on the daily timeframe as there have been consistently lower lows and lower highs. Prices are trading below the 50-day SMA but support may be offered by the 100 and 200-day SMA. In addition, the Relative Strength Index (RSI) is venturing toward 30 – signalling that prices may be oversold.

  • A decline below the 100-day SMA may open a path toward $213.0 and the 200-day SMA at $201.50.
  • Should $213.00 prove to be reliable support, this could send prices toward the 50-day SMA, $232.50 and $250.

Tesla


Forex-Time-LogoArticle by ForexTime

ForexTime Ltd (FXTM) is an award winning international online forex broker regulated by CySEC 185/12 www.forextime.com

Netflix earnings preview: Set for fresh all-time highs?

By ForexTime 

  • Netflix ↑ 45% year-to-date
  • Shares could move 7.6% % ↑ or ↓ post-earnings
  • Subscription numbers & live sports offering in focus
  • Technical levels – $735 & $700

Netflix is probably one of the first providers you think about regarding TV streaming services.

And it remains the biggest player in this space, boasting almost 280 million subscribers worldwide!

The company shares have been edging higher, hitting a fresh all-time high at $734.92 last Friday.

Despite the recent selloff, Netflix stocks are still up 45% year-to-date.

Prices could push higher or lower depending on how investors react to the latest earnings report.

  • When will earnings be published?

Netflix will report its earnings for the third quarter after US markets close on Thursday 17th October.

  • Market expectations:

The company is expected to post earnings per share of $5.12 compared to $3.73 a year ago.

Quarterly revenues are seen rising $9.8 billion from $8.5 billion in the prior year – equating to a 15.3% increase.

  • Why is this important?

As the biggest streaming service in the world, Netflix’s results could provide key insights into consumer spending habits and the health of the streaming industry.

  • Key metrics…

When publishing its earnings for Q2 back in July, Netflix reported just under 278 million subscribers.

So, it will be interesting to see what impacts the crackdown on password sharing have on this number.

According to analyst expectations, the streaming giant is expected to report around 286 million active subscribers for Q3 – further solidifying its grip on the throne.

Investors will be looking for more information on live sports offerings, especially when considering how the NFL will see its first games on Netflix on Christmas Day.

  • Potential challenges

In such a competitive industry filled with the likes of Amazon Prime, Disney+, Hulu and Apple TV among others, investors will be keen to see how Netflix fared.

Consumers are spoilt for choice for quality streaming services, and this has the potential to impact the company’s overall results.

  • How will Netflix react to earnings?

Markets are forecasting a 7.6% move, either Up or Down, for Netflix stocks on Thursday post earnings.

  • What does this mean for prices?

A 7.6% move up from $704.56 (current price) will take Netflix shares to a fresh all-time high at $758.

While a 7.6% move down will send prices back toward $651.

  • Technical picture

Although prices have been trending higher on the daily charts, a range can be identified with support at $700 and resistance at $734.92. The incoming earnings report could push the scales of power in favour of bulls or bears.

  • A solid set of earnings could push prices back above the all-time high at $734.92 with $750 acting as a point of interest.
  • If the earnings disappoint, prices could slip below $700 – opening a path back toward the 100-day SMA at $670 and $650.

netflix


Forex-Time-LogoArticle by ForexTime

ForexTime Ltd (FXTM) is an award winning international online forex broker regulated by CySEC 185/12 www.forextime.com

COT Stock Market Charts: Speculator Bets led by MSCI EAFE-Mini & VIX

By InvestMacro

Here are the latest charts and statistics for the Commitment of Traders (COT) data published by the Commodities Futures Trading Commission (CFTC).

The latest COT data is updated through Tuesday October 8th and shows a quick view of how large traders (for-profit speculators and commercial entities) were positioned in the futures markets.

Weekly Speculator Changes led by MSCI EAFE-Mini & VIX

The COT stock markets speculator bets were overall lower this week as two out of the seven stock markets we cover had higher positioning while the other five markets had lower speculator contracts.

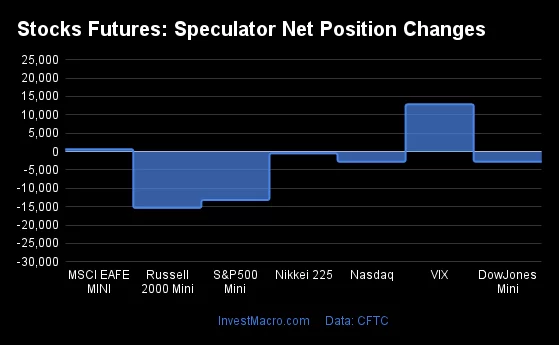
Leading the gains for the stock markets was the VIX (12,869 contracts) and with the MSCI EAFE-Mini (638 contracts) also showing a positive week.

The markets with the declines in speculator bets this week were the Russell-Mini (-15,342 contracts), the S&P500-Mini (-13,189 contracts), the Nasdaq-Mini (-2,784 contracts), the DowJones-Mini (-2,764 contracts) and with the Nikkei 225 (-498 contracts) also registering lower bets on the week.


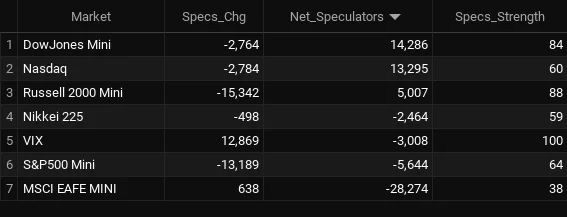
Stock Market Net Speculators Leaderboard

Legend: Weekly Speculators Change | Speculators Current Net Position | Speculators Strength Score compared to last 3-Years (0-100 range)


Strength Scores led by VIX & Russell-Mini

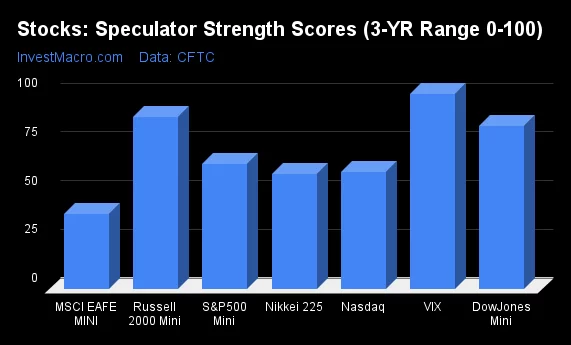
COT Strength Scores (a normalized measure of Speculator positions over a 3-Year range, from 0 to 100 where above 80 is Extreme-Bullish and below 20 is Extreme-Bearish) showed that the VIX (100 percent) and the Russell-Mini (88 percent) lead the stock markets this week. The DowJones-Mini (84 percent) and the S&P500-Mini (64 percent) come in as the next highest in the weekly strength scores.

On the downside, the MSCI EAFE-Mini (38 percent) comes in at the lowest strength level currently.

Strength Statistics:
VIX (100.0 percent) vs VIX previous week (87.5 percent)
S&P500-Mini (63.9 percent) vs S&P500-Mini previous week (65.9 percent)
DowJones-Mini (83.5 percent) vs DowJones-Mini previous week (88.0 percent)
Nasdaq-Mini (59.8 percent) vs Nasdaq-Mini previous week (64.1 percent)
Russell2000-Mini (88.1 percent) vs Russell2000-Mini previous week (98.9 percent)
Nikkei USD (59.2 percent) vs Nikkei USD previous week (63.4 percent)
EAFE-Mini (38.4 percent) vs EAFE-Mini previous week (37.7 percent)


VIX & Russell-Mini top the 6-Week Strength Trends


COT Strength Score Trends (or move index, calculates the 6-week changes in strength scores) showed that the VIX (27 percent) leads the past six weeks trends for the stock markets. The Russell-Mini (14 percent), the S&P500-Mini (11 percent) and the DowJones-Mini (10 percent) are the next highest positive movers in the latest trends data.

The Nasdaq-Mini (-13 percent) leads the downside trend scores currently with the Nikkei USD (-6 percent) coming in as the next market with lower trend scores.

Strength Trend Statistics:
VIX (26.6 percent) vs VIX previous week (8.4 percent)
S&P500-Mini (11.4 percent) vs S&P500-Mini previous week (13.8 percent)
DowJones-Mini (9.6 percent) vs DowJones-Mini previous week (16.8 percent)
Nasdaq-Mini (-12.6 percent) vs Nasdaq-Mini previous week (7.3 percent)
Russell2000-Mini (14.3 percent) vs Russell2000-Mini previous week (33.5 percent)
Nikkei USD (-6.3 percent) vs Nikkei USD previous week (16.2 percent)
EAFE-Mini (5.8 percent) vs EAFE-Mini previous week (10.3 percent)


Individual Stock Market Charts:

VIX Volatility Futures:

VIX Volatility Futures COT ChartThe VIX Volatility large speculator standing this week recorded a net position of -3,008 contracts in the data reported through Tuesday. This was a weekly lift of 12,869 contracts from the previous week which had a total of -15,877 net contracts.

This week’s current strength score (the trader positioning range over the past three years, measured from 0 to 100) shows the speculators are currently Bullish-Extreme with a score of 100.0 percent. The commercials are Bearish-Extreme with a score of 0.0 percent and the small traders (not shown in chart) are Bullish with a score of 79.4 percent.

Price Trend-Following Model: Strong Uptrend

Our weekly trend-following model classifies the current market price position as: Strong Uptrend.

VIX Volatility Futures StatisticsSPECULATORSCOMMERCIALSSMALL TRADERS
– Percent of Open Interest Longs:28.440.17.7
– Percent of Open Interest Shorts:29.338.88.2
– Net Position:-3,0084,478-1,470
– Gross Longs:96,893136,56226,327
– Gross Shorts:99,901132,08427,797
– Long to Short Ratio:1.0 to 11.0 to 10.9 to 1
NET POSITION TREND:
– Strength Index Score (3 Year Range Pct):100.00.079.4
– Strength Index Reading (3 Year Range):Bullish-ExtremeBearish-ExtremeBullish
NET POSITION MOVEMENT INDEX:
– 6-Week Change in Strength Index:26.6-24.0-10.0


S&P500 Mini Futures:

SP500 Mini Futures COT ChartThe S&P500 Mini large speculator standing this week recorded a net position of -5,644 contracts in the data reported through Tuesday. This was a weekly decline of -13,189 contracts from the previous week which had a total of 7,545 net contracts.

This week’s current strength score (the trader positioning range over the past three years, measured from 0 to 100) shows the speculators are currently Bullish with a score of 63.9 percent. The commercials are Bearish with a score of 27.8 percent and the small traders (not shown in chart) are Bullish-Extreme with a score of 86.5 percent.

Price Trend-Following Model: Strong Uptrend

Our weekly trend-following model classifies the current market price position as: Strong Uptrend.

S&P500 Mini Futures StatisticsSPECULATORSCOMMERCIALSSMALL TRADERS
– Percent of Open Interest Longs:15.171.012.3
– Percent of Open Interest Shorts:15.475.18.0
– Net Position:-5,644-87,66793,311
– Gross Longs:322,6861,514,535263,087
– Gross Shorts:328,3301,602,202169,776
– Long to Short Ratio:1.0 to 10.9 to 11.5 to 1
NET POSITION TREND:
– Strength Index Score (3 Year Range Pct):63.927.886.5
– Strength Index Reading (3 Year Range):BullishBearishBullish-Extreme
NET POSITION MOVEMENT INDEX:
– 6-Week Change in Strength Index:11.4-8.1-8.2


Dow Jones Mini Futures:

Dow Jones Mini Futures COT ChartThe Dow Jones Mini large speculator standing this week recorded a net position of 14,286 contracts in the data reported through Tuesday. This was a weekly fall of -2,764 contracts from the previous week which had a total of 17,050 net contracts.

This week’s current strength score (the trader positioning range over the past three years, measured from 0 to 100) shows the speculators are currently Bullish-Extreme with a score of 83.5 percent. The commercials are Bearish-Extreme with a score of 15.2 percent and the small traders (not shown in chart) are Bullish with a score of 63.9 percent.

Price Trend-Following Model: Strong Uptrend

Our weekly trend-following model classifies the current market price position as: Strong Uptrend.

Dow Jones Mini Futures StatisticsSPECULATORSCOMMERCIALSSMALL TRADERS
– Percent of Open Interest Longs:24.357.516.2
– Percent of Open Interest Shorts:7.476.214.4
– Net Position:14,286-15,8431,557
– Gross Longs:20,58548,71313,762
– Gross Shorts:6,29964,55612,205
– Long to Short Ratio:3.3 to 10.8 to 11.1 to 1
NET POSITION TREND:
– Strength Index Score (3 Year Range Pct):83.515.263.9
– Strength Index Reading (3 Year Range):Bullish-ExtremeBearish-ExtremeBullish
NET POSITION MOVEMENT INDEX:
– 6-Week Change in Strength Index:9.6-7.8-3.2


Nasdaq Mini Futures:

Nasdaq Mini Futures COT ChartThe Nasdaq Mini large speculator standing this week recorded a net position of 13,295 contracts in the data reported through Tuesday. This was a weekly lowering of -2,784 contracts from the previous week which had a total of 16,079 net contracts.

This week’s current strength score (the trader positioning range over the past three years, measured from 0 to 100) shows the speculators are currently Bullish with a score of 59.8 percent. The commercials are Bearish with a score of 25.4 percent and the small traders (not shown in chart) are Bullish with a score of 76.4 percent.

Price Trend-Following Model: Strong Uptrend

Our weekly trend-following model classifies the current market price position as: Strong Uptrend.

Nasdaq Mini Futures StatisticsSPECULATORSCOMMERCIALSSMALL TRADERS
– Percent of Open Interest Longs:22.856.815.7
– Percent of Open Interest Shorts:17.566.711.1
– Net Position:13,295-24,75411,459
– Gross Longs:57,058141,99439,326
– Gross Shorts:43,763166,74827,867
– Long to Short Ratio:1.3 to 10.9 to 11.4 to 1
NET POSITION TREND:
– Strength Index Score (3 Year Range Pct):59.825.476.4
– Strength Index Reading (3 Year Range):BullishBearishBullish
NET POSITION MOVEMENT INDEX:
– 6-Week Change in Strength Index:-12.612.5-6.3


Russell 2000 Mini Futures:

Russell 2000 Mini Futures COT ChartThe Russell 2000 Mini large speculator standing this week recorded a net position of 5,007 contracts in the data reported through Tuesday. This was a weekly decrease of -15,342 contracts from the previous week which had a total of 20,349 net contracts.

This week’s current strength score (the trader positioning range over the past three years, measured from 0 to 100) shows the speculators are currently Bullish-Extreme with a score of 88.1 percent. The commercials are Bearish-Extreme with a score of 11.2 percent and the small traders (not shown in chart) are Bullish with a score of 74.4 percent.

Price Trend-Following Model: Uptrend

Our weekly trend-following model classifies the current market price position as: Uptrend.

Russell 2000 Mini Futures StatisticsSPECULATORSCOMMERCIALSSMALL TRADERS
– Percent of Open Interest Longs:17.872.77.2
– Percent of Open Interest Shorts:16.676.94.1
– Net Position:5,007-18,47913,472
– Gross Longs:78,784322,42031,844
– Gross Shorts:73,777340,89918,372
– Long to Short Ratio:1.1 to 10.9 to 11.7 to 1
NET POSITION TREND:
– Strength Index Score (3 Year Range Pct):88.111.274.4
– Strength Index Reading (3 Year Range):Bullish-ExtremeBearish-ExtremeBullish
NET POSITION MOVEMENT INDEX:
– 6-Week Change in Strength Index:14.3-11.3-7.2


Nikkei Stock Average (USD) Futures:

Nikkei Stock Average (USD) Futures COT ChartThe Nikkei Stock Average (USD) large speculator standing this week recorded a net position of -2,464 contracts in the data reported through Tuesday. This was a weekly decrease of -498 contracts from the previous week which had a total of -1,966 net contracts.

This week’s current strength score (the trader positioning range over the past three years, measured from 0 to 100) shows the speculators are currently Bullish with a score of 59.2 percent. The commercials are Bearish with a score of 37.5 percent and the small traders (not shown in chart) are Bullish with a score of 60.1 percent.

Price Trend-Following Model: Strong Uptrend

Our weekly trend-following model classifies the current market price position as: Strong Uptrend.

Nikkei Stock Average Futures StatisticsSPECULATORSCOMMERCIALSSMALL TRADERS
– Percent of Open Interest Longs:2.070.227.7
– Percent of Open Interest Shorts:24.755.719.5
– Net Position:-2,4641,576888
– Gross Longs:2217,6203,008
– Gross Shorts:2,6856,0442,120
– Long to Short Ratio:0.1 to 11.3 to 11.4 to 1
NET POSITION TREND:
– Strength Index Score (3 Year Range Pct):59.237.560.1
– Strength Index Reading (3 Year Range):BullishBearishBullish
NET POSITION MOVEMENT INDEX:
– 6-Week Change in Strength Index:-6.34.81.0


MSCI EAFE Mini Futures:

MSCI EAFE Mini Futures COT ChartThe MSCI EAFE Mini large speculator standing this week recorded a net position of -28,274 contracts in the data reported through Tuesday. This was a weekly advance of 638 contracts from the previous week which had a total of -28,912 net contracts.

This week’s current strength score (the trader positioning range over the past three years, measured from 0 to 100) shows the speculators are currently Bearish with a score of 38.4 percent. The commercials are Bullish with a score of 59.3 percent and the small traders (not shown in chart) are Bearish with a score of 46.8 percent.

Price Trend-Following Model: Strong Uptrend

Our weekly trend-following model classifies the current market price position as: Strong Uptrend.

MSCI EAFE Mini Futures StatisticsSPECULATORSCOMMERCIALSSMALL TRADERS
– Percent of Open Interest Longs:7.889.03.0
– Percent of Open Interest Shorts:14.783.61.5
– Net Position:-28,27422,2925,982
– Gross Longs:31,695363,80312,173
– Gross Shorts:59,969341,5116,191
– Long to Short Ratio:0.5 to 11.1 to 12.0 to 1
NET POSITION TREND:
– Strength Index Score (3 Year Range Pct):38.459.346.8
– Strength Index Reading (3 Year Range):BearishBullishBearish
NET POSITION MOVEMENT INDEX:
– 6-Week Change in Strength Index:5.8-4.0-7.6


Article By InvestMacroReceive our weekly COT Newsletter

*COT Report: The COT data, released weekly to the public each Friday, is updated through the most recent Tuesday (data is 3 days old) and shows a quick view of how large speculators or non-commercials (for-profit traders) were positioned in the futures markets.

The CFTC categorizes trader positions according to commercial hedgers (traders who use futures contracts for hedging as part of the business), non-commercials (large traders who speculate to realize trading profits) and nonreportable traders (usually small traders/speculators) as well as their open interest (contracts open in the market at time of reporting). See CFTC criteria here.

Week Ahead: Will TSMC rejoin the trillion-dollar club?

By ForexTime 

  • US listed TSMC shares ↑ almost 80% YTD
  • Less than 4% away from all-time high created in July
  • Forward guidance for Q4 in focus
  • FXTM’s TWN index could see fresh volatility
  • Technical levels for TSMC – $192.65, $183.00 and $177.00

Another slew of key data releases and corporate earnings could rock markets in the week ahead:

Saturday, 12th October

  • CN50: China’s Ministry of Finance holds briefing

Sunday, 13th October

  • CN50: China PPI, CPI

Monday, 14th October

  • CN50: China trade
  • US500: Fed Governor Christopher Waller speech

Tuesday, 15th October

  • CAD: Canada CPI, existing home sales
  • EU50: Eurozone industrial production, Germany ZEW survey
  • JP225: Japan industrial production
  • UK100: UK jobless claims, unemployment
  • US500: Goldman Sachs, Bank of America, Citigroup earnings

Wednesday, 16th October

  • NZD: New Zealand CPI
  • ZAR: South Africa retail sales
  • UK100: UK CPI
  • NETH25: ASML earnings
  • US500: Morgan Stanley earnings

Thursday, 17th October

  • AU200: Australia unemployment
  • EU50: Eurozone CPI, ECB rate decision
  • JP225: Japan tertiary index, trade
  • SG20: Singapore trade
  • NAS100: US retail sales, jobless claims, industrial production, Netflix earnings
  • TWN: Taiwan Semiconductor Manufacturing Company (TSMC) earnings

Friday, 18th October  

  • CN50: China GDP, retail sales, industrial production, home prices
  • JP225: Japan CPI
  • UK100: UK retail sales

The spotlight shines on the world’s largest contract chipmaker with a market cap of almost $1 trillion.

US-listed shares of Taiwan Semiconductor Manufacturing Company (TSMC) are up almost 80% year-to-date, logging only one negative month in 2024.

Note: TSMC shares can be traded on the Taiwan Stock Exchange (TWSE) and New York Stock Exchange (NYSE).

Back in July, TSMC shares hit an all-time high at $192.65 after strong Q2 revenues – giving the company a trillion-dollar valuation momentarily before stocks later tumbled.

Still, prices have rebounded since August with a recent report revealing that TSMC’s September sales jumped 39.6% year-on-year.

bloomberg TSMC

This welcome development along with a positive earnings release could push the company’s stock higher.

  • When will earnings be published?

TSMC reports its third-quarter earnings on Thursday 17th October before US markets open.

  • Market expectations

The chipmaker is expected to post earnings of $1.78 per share with Q3 revenues seen rising to $23.28 billion from $17.28 in the prior year.

  • What to watch out for

Back in July, TSMC forecasted third quarter revenue in a range of between $22.4 billion to $23.2 billion.

But the chipmaker has already beaten these forecasts with consolidated sales in Q3 (July – September) hitting $23.6 billion, thanks to AI demand from major clients like Nvidia and Apple.

So much focus will be on the company’s earnings and forward guidance for Q4 which could serve as a key gauge for AI demand.

  • What does this mean for FXTM’s TWN index.

FXTM’s TWN index tracks the underlying FTSE Taiwan RIC Capped Index.

And TSMC makes up just under 20% of the index weighting, meaning that the upcoming earnings could result in heightened volatility.

The index is up almost 3% this month, bringing year-to-date gains to roughly 22%. Prices have been trending higher in recent weeks with the all-time high 7% away at 2046.8.

Key levels of interest can be found at 1930 and 1825.

TWN

  • Technical picture

TSMC shares are trending higher on the weekly charts with prices trading above the 21, 50 and 100-week SMA. However, the Relative Strength Index (RSI) is near 70 – signaling that prices may be overbought.

TSM

On the daily charts, the trend is bullish with prices are trading less than 4% away from its all-time high created in July at $192.65.

  • A decline below $183.00 may see prices test the 21-day SMA at $177.0 and $170.0.
  • Should $183.0 prove to be reliable support, this may open a path back to the all-time high at $192.65 and beyond.

TSMS1


Forex-Time-LogoArticle by ForexTime

ForexTime Ltd (FXTM) is an award winning international online forex broker regulated by CySEC 185/12 www.forextime.com

Can NVDA’s Share Buybacks and AI Innovation Drive the Next Rally?

By The Ino.com Team

NVIDIA Corporation (NVDA) has undoubtedly been one of the hottest large-cap stocks this year, surging over 150% year-to-date and more than 195% in the past 12 months. This stellar performance is driven by the massive demand for its graphics processing units (GPUs), which help run and train AI algorithms.

For the second quarter that ended July 28, 2024, Nvidia’s revenue increased 122% year-over-year to $30.04 billion and 15% from the first quarter. This robust growth exceeded analysts’ expectations, who had forecasted around $28.75 billion. NVDA’s Data Center Group (primarily connected to its AI operations) generated $26.30 billion in revenue, resulting in a 16% sequential gain and a triple-digit growth of 154% over the same period last year.

The company’s bottom line remained buoyant, with operating income surging 174% from the year-ago value to $18.64 billion. NVDA’s non-GAAP net income amounted to $16.95 billion or $0.68 per share, compared to $6.74 billion or $0.27 per share in the previous year’s quarter, respectively. The chipmaker is now gearing up for new AI hardware releases based on the Blackwell architecture, which could boost demand in the coming years.

Moreover, it forecasted a revenue of $32.50 billion, plus or minus 2%, for its fiscal third quarter, representing an 81.6% growth from the year-ago quarter. However, this slightly falls short of the analysts’ estimates of $32.91 billion.

Is NVDA’s Buyback a Boost for Earnings or a Sign of Investor Fatigue?

In addition to its strong financials, NVIDIA’s board has approved a massive $50 billion share buyback program. This adds to the $7.5 billion remaining from its previous buyback plan. Share repurchases typically boost earnings per share by reducing the number of outstanding shares, making the stock more attractive to investors.

The company has already returned $15.4 billion to shareholders through repurchases and dividends during the first half of fiscal 2025. However, despite the strong financial performance and the buyback announcement, NVDA’s stock dropped around 10% after its earnings report. It seems investors had such high expectations that even strong results weren’t enough to impress them.

“Investors want more, more and more when it comes to Nvidia,” said Dan Coatsworth, investment analyst at AJ Bell. “It looks like investors might not have taken the average of analyst forecasts to be the benchmark for Nvidia’s performance, instead, they’ve taken the highest end of the estimate range to be the hurdle to clear.”

On the brighter side, the company’s upcoming AI-focused chips, particularly the Blackwell architecture, are poised to meet rising demand and could reignite investor confidence. While its production has been slightly delayed, the company plans to ramp up shipments in the fourth quarter, with strong demand already building up.

Alongside Blackwell, Nvidia’s Hopper platform continues to see robust demand, and shipments of its upgraded H200 platform are targeting cloud service providers and large enterprises, with more demand expected in the second half of 2024. Thus, Nvidia still has plenty of fuel left to drive another rally.

Bottom Line

Thanks to the surging demand for its AI platforms, upcoming product launches, and a broadening market, we believe that Nvidia is well-positioned for continued expansion. The recent dip in its share price could simply be a brief pause before the next phase of growth unfolds.

Moreover, analysts remain bullish on the chipmaker’s long-term prospects. Out of 42 analysts that rated NVDA, 39 rated it Buy, while three rated it Hold. The 12-month median price target of $152.44 indicates a 22.9% upside potential from the last closing price. The price targets range from a low of $90 to a high of $200.

Therefore, investors looking for long-term opportunities could consider scooping up the shares of this tech giant before the stock regains momentum.

By Ino.com – See our Trader Blog, INO TV Free & Market Analysis Alerts

Source: Can NVDA’s Share Buybacks and AI Innovation Drive the Next Rally?

COT Stock Market Charts: Speculator bets led by S&P500-Mini & Russell-Mini

By InvestMacro

Here are the latest charts and statistics for the Commitment of Traders (COT) data published by the Commodities Futures Trading Commission (CFTC).

The latest COT data is updated through Tuesday September 24th and shows a quick view of how large traders (for-profit speculators and commercial entities) were positioned in the futures markets.

Weekly Speculator Changes led by S&P500-Mini & Russell-Mini

The COT stock markets speculator bets were higher this week as five out of the seven stock markets we cover had higher positioning while the other two markets had lower speculator contracts.

Leading the gains for the stock markets was the S&P500-Mini (87,195 contracts) with the Russell-Mini (18,921 contracts), the MSCI EAFE-Mini (5,043 contracts), the VIX (1,446 contracts) and the DowJones-Mini (822 contracts) also showing positive weeks.

The markets with declines in speculator bets were the Nasdaq-Mini (-3,194 contracts) and the Nikkei 225 (-498 contracts) for the week.


Stock Market Net Speculators Leaderboard

Legend: Weekly Speculators Change | Speculators Current Net Position | Speculators Strength Score compared to last 3-Years (0-100 range)


Strength Scores led by VIX & Russell-Mini

COT Strength Scores (a normalized measure of Speculator positions over a 3-Year range, from 0 to 100 where above 80 is Extreme-Bullish and below 20 is Extreme-Bearish) showed that the VIX (100 percent) and the Russell-Mini (100 percent) lead the stock markets this week. The DowJones-Mini (85 percent) and the Nasdaq-Mini (64 percent) come in as the next highest in the weekly strength scores.

On the downside, the MSCI EAFE-Mini (30 percent) comes in at the lowest strength level currently.

Strength Statistics:
VIX (100.0 percent) vs VIX previous week (98.6 percent)
S&P500-Mini (59.4 percent) vs S&P500-Mini previous week (46.4 percent)
DowJones-Mini (85.4 percent) vs DowJones-Mini previous week (84.1 percent)
Nasdaq-Mini (64.0 percent) vs Nasdaq-Mini previous week (69.0 percent)
Russell2000-Mini (100.0 percent) vs Russell2000-Mini previous week (86.7 percent)
Nikkei USD (59.2 percent) vs Nikkei USD previous week (63.4 percent)
EAFE-Mini (30.5 percent) vs EAFE-Mini previous week (25.1 percent)


Russell-Mini & DowJones-Mini top the 6-Week Strength Trends

COT Strength Score Trends (or move index, calculates the 6-week changes in strength scores) showed that the Russell-Mini (25 percent) leads the past six weeks trends for the stock markets. The DowJones-Mini (23 percent), the VIX (15 percent) and the Nasdaq-Mini (12 percent) are the next highest positive movers in the latest trends data.

The Nikkei 225 (-6 percent) leads the downside trend scores currently with the S&P500-Mini (-2 percent) coming in as the next market with lower trend scores.

Strength Trend Statistics:
VIX (15.0 percent) vs VIX previous week (36.6 percent)
S&P500-Mini (-1.8 percent) vs S&P500-Mini previous week (-23.4 percent)
DowJones-Mini (23.1 percent) vs DowJones-Mini previous week (11.8 percent)
Nasdaq-Mini (11.7 percent) vs Nasdaq-Mini previous week (10.3 percent)
Russell2000-Mini (24.8 percent) vs Russell2000-Mini previous week (3.9 percent)
Nikkei USD (-6.3 percent) vs Nikkei USD previous week (16.2 percent)
EAFE-Mini (2.6 percent) vs EAFE-Mini previous week (-20.6 percent)


Individual Stock Market Charts:

VIX Volatility Futures:

VIX Volatility Futures COT ChartThe VIX Volatility large speculator standing this week recorded a net position of -5,067 contracts in the data reported through Tuesday. This was a weekly boost of 1,446 contracts from the previous week which had a total of -6,513 net contracts.

This week’s current strength score (the trader positioning range over the past three years, measured from 0 to 100) shows the speculators are currently Bullish-Extreme with a score of 100.0 percent. The commercials are Bearish-Extreme with a score of 0.0 percent and the small traders (not shown in chart) are Bullish with a score of 78.8 percent.

Price Trend-Following Model: Uptrend

Our weekly trend-following model classifies the current market price position as: Uptrend.

VIX Volatility Futures StatisticsSPECULATORSCOMMERCIALSSMALL TRADERS
– Percent of Open Interest Longs:24.140.98.8
– Percent of Open Interest Shorts:25.738.89.3
– Net Position:-5,0676,667-1,600
– Gross Longs:76,551129,98827,965
– Gross Shorts:81,618123,32129,565
– Long to Short Ratio:0.9 to 11.1 to 10.9 to 1
NET POSITION TREND:
– Strength Index Score (3 Year Range Pct):100.00.078.8
– Strength Index Reading (3 Year Range):Bullish-ExtremeBearish-ExtremeBullish
NET POSITION MOVEMENT INDEX:
– 6-Week Change in Strength Index:15.0-11.4-15.7


S&P500 Mini Futures:

SP500 Mini Futures COT ChartThe S&P500 Mini large speculator standing this week recorded a net position of -35,753 contracts in the data reported through Tuesday. This was a weekly lift of 87,195 contracts from the previous week which had a total of -122,948 net contracts.

This week’s current strength score (the trader positioning range over the past three years, measured from 0 to 100) shows the speculators are currently Bullish with a score of 59.4 percent. The commercials are Bearish with a score of 31.6 percent and the small traders (not shown in chart) are Bullish-Extreme with a score of 87.6 percent.

Price Trend-Following Model: Strong Uptrend

Our weekly trend-following model classifies the current market price position as: Strong Uptrend.

S&P500 Mini Futures StatisticsSPECULATORSCOMMERCIALSSMALL TRADERS
– Percent of Open Interest Longs:14.271.612.5
– Percent of Open Interest Shorts:15.974.57.9
– Net Position:-35,753-59,91995,672
– Gross Longs:289,9381,464,276256,340
– Gross Shorts:325,6911,524,195160,668
– Long to Short Ratio:0.9 to 11.0 to 11.6 to 1
NET POSITION TREND:
– Strength Index Score (3 Year Range Pct):59.431.687.6
– Strength Index Reading (3 Year Range):BullishBearishBullish-Extreme
NET POSITION MOVEMENT INDEX:
– 6-Week Change in Strength Index:-1.8-1.711.4


Dow Jones Mini Futures:

Dow Jones Mini Futures COT ChartThe Dow Jones Mini large speculator standing this week recorded a net position of 15,436 contracts in the data reported through Tuesday. This was a weekly increase of 822 contracts from the previous week which had a total of 14,614 net contracts.

This week’s current strength score (the trader positioning range over the past three years, measured from 0 to 100) shows the speculators are currently Bullish-Extreme with a score of 85.4 percent. The commercials are Bearish-Extreme with a score of 10.9 percent and the small traders (not shown in chart) are Bullish with a score of 75.2 percent.

Price Trend-Following Model: Strong Uptrend

Our weekly trend-following model classifies the current market price position as: Strong Uptrend.

Dow Jones Mini Futures StatisticsSPECULATORSCOMMERCIALSSMALL TRADERS
– Percent of Open Interest Longs:26.555.017.0
– Percent of Open Interest Shorts:8.976.513.1
– Net Position:15,436-18,8533,417
– Gross Longs:23,22348,22314,893
– Gross Shorts:7,78767,07611,476
– Long to Short Ratio:3.0 to 10.7 to 11.3 to 1
NET POSITION TREND:
– Strength Index Score (3 Year Range Pct):85.410.975.2
– Strength Index Reading (3 Year Range):Bullish-ExtremeBearish-ExtremeBullish
NET POSITION MOVEMENT INDEX:
– 6-Week Change in Strength Index:23.1-21.95.3


Nasdaq Mini Futures:

Nasdaq Mini Futures COT ChartThe Nasdaq Mini large speculator standing this week recorded a net position of 16,039 contracts in the data reported through Tuesday. This was a weekly fall of -3,194 contracts from the previous week which had a total of 19,233 net contracts.

This week’s current strength score (the trader positioning range over the past three years, measured from 0 to 100) shows the speculators are currently Bullish with a score of 64.0 percent. The commercials are Bearish with a score of 20.2 percent and the small traders (not shown in chart) are Bullish-Extreme with a score of 80.1 percent.

Price Trend-Following Model: Strong Uptrend

Our weekly trend-following model classifies the current market price position as: Strong Uptrend.

Nasdaq Mini Futures StatisticsSPECULATORSCOMMERCIALSSMALL TRADERS
– Percent of Open Interest Longs:23.158.417.4
– Percent of Open Interest Shorts:16.171.411.5
– Net Position:16,039-29,42313,384
– Gross Longs:52,615133,11439,603
– Gross Shorts:36,576162,53726,219
– Long to Short Ratio:1.4 to 10.8 to 11.5 to 1
NET POSITION TREND:
– Strength Index Score (3 Year Range Pct):64.020.280.1
– Strength Index Reading (3 Year Range):BullishBearishBullish-Extreme
NET POSITION MOVEMENT INDEX:
– 6-Week Change in Strength Index:11.7-9.01.2


Russell 2000 Mini Futures:

Russell 2000 Mini Futures COT ChartThe Russell 2000 Mini large speculator standing this week recorded a net position of 21,907 contracts in the data reported through Tuesday. This was a weekly boost of 18,921 contracts from the previous week which had a total of 2,986 net contracts.

This week’s current strength score (the trader positioning range over the past three years, measured from 0 to 100) shows the speculators are currently Bullish-Extreme with a score of 100.0 percent. The commercials are Bearish-Extreme with a score of 0.0 percent and the small traders (not shown in chart) are Bullish with a score of 78.0 percent.

Price Trend-Following Model: Strong Uptrend

Our weekly trend-following model classifies the current market price position as: Strong Uptrend.

Russell 2000 Mini Futures StatisticsSPECULATORSCOMMERCIALSSMALL TRADERS
– Percent of Open Interest Longs:19.371.47.4
– Percent of Open Interest Shorts:14.479.74.1
– Net Position:21,907-36,44114,534
– Gross Longs:85,342315,75232,545
– Gross Shorts:63,435352,19318,011
– Long to Short Ratio:1.3 to 10.9 to 11.8 to 1
NET POSITION TREND:
– Strength Index Score (3 Year Range Pct):100.00.078.0
– Strength Index Reading (3 Year Range):Bullish-ExtremeBearish-ExtremeBullish
NET POSITION MOVEMENT INDEX:
– 6-Week Change in Strength Index:24.8-25.619.7


Nikkei Stock Average (USD) Futures:

Nikkei Stock Average (USD) Futures COT ChartThe Nikkei Stock Average (USD) large speculator standing this week recorded a net position of -2,464 contracts in the data reported through Tuesday. This was a weekly decrease of -498 contracts from the previous week which had a total of -1,966 net contracts.

This week’s current strength score (the trader positioning range over the past three years, measured from 0 to 100) shows the speculators are currently Bullish with a score of 59.2 percent. The commercials are Bearish with a score of 37.5 percent and the small traders (not shown in chart) are Bullish with a score of 60.1 percent.

Price Trend-Following Model: Strong Uptrend

Our weekly trend-following model classifies the current market price position as: Strong Uptrend.

Nikkei Stock Average Futures StatisticsSPECULATORSCOMMERCIALSSMALL TRADERS
– Percent of Open Interest Longs:2.070.227.7
– Percent of Open Interest Shorts:24.755.719.5
– Net Position:-2,4641,576888
– Gross Longs:2217,6203,008
– Gross Shorts:2,6856,0442,120
– Long to Short Ratio:0.1 to 11.3 to 11.4 to 1
NET POSITION TREND:
– Strength Index Score (3 Year Range Pct):59.237.560.1
– Strength Index Reading (3 Year Range):BullishBearishBullish
NET POSITION MOVEMENT INDEX:
– 6-Week Change in Strength Index:-6.34.81.0


MSCI EAFE Mini Futures:

MSCI EAFE Mini Futures COT ChartThe MSCI EAFE Mini large speculator standing this week recorded a net position of -35,707 contracts in the data reported through Tuesday. This was a weekly increase of 5,043 contracts from the previous week which had a total of -40,750 net contracts.

This week’s current strength score (the trader positioning range over the past three years, measured from 0 to 100) shows the speculators are currently Bearish with a score of 30.5 percent. The commercials are Bullish with a score of 64.1 percent and the small traders (not shown in chart) are Bullish with a score of 60.6 percent.

Price Trend-Following Model: Strong Uptrend

Our weekly trend-following model classifies the current market price position as: Strong Uptrend.

MSCI EAFE Mini Futures StatisticsSPECULATORSCOMMERCIALSSMALL TRADERS
– Percent of Open Interest Longs:6.789.83.3
– Percent of Open Interest Shorts:15.483.21.2
– Net Position:-35,70726,9478,760
– Gross Longs:27,798371,07513,807
– Gross Shorts:63,505344,1285,047
– Long to Short Ratio:0.4 to 11.1 to 12.7 to 1
NET POSITION TREND:
– Strength Index Score (3 Year Range Pct):30.564.160.6
– Strength Index Reading (3 Year Range):BearishBullishBullish
NET POSITION MOVEMENT INDEX:
– 6-Week Change in Strength Index:2.6-5.614.7


Article By InvestMacroReceive our weekly COT Newsletter

*COT Report: The COT data, released weekly to the public each Friday, is updated through the most recent Tuesday (data is 3 days old) and shows a quick view of how large speculators or non-commercials (for-profit traders) were positioned in the futures markets.

The CFTC categorizes trader positions according to commercial hedgers (traders who use futures contracts for hedging as part of the business), non-commercials (large traders who speculate to realize trading profits) and nonreportable traders (usually small traders/speculators) as well as their open interest (contracts open in the market at time of reporting). See CFTC criteria here.

COT Stock Market Charts: Speculator Bets led by VIX & DowJones-Mini

By InvestMacro

Here are the latest charts and statistics for the Commitment of Traders (COT) data published by the Commodities Futures Trading Commission (CFTC).

The latest COT data is updated through Tuesday September 17th and shows a quick view of how large traders (for-profit speculators and commercial entities) were positioned in the futures markets.

Weekly Speculator Bets led by VIX & DowJones-Mini

The COT stock markets speculator bets were lower this week as just two out of the seven stock markets we cover had higher positioning while the other five markets had lower speculator contracts.

Leading the gains for the stock markets was the VIX (8,598 contracts) with the DowJones-Mini (6,446 contracts) also showing a positive week.

The markets with the declines in speculator bets this week were the S&P500-Mini (-63,560 contracts), the MSCI EAFE-Mini (-11,500 contracts), the Nasdaq-Mini (-6,393 contracts), the Russell-Mini (-2,741 contracts) and with the Nikkei 225 (-498 contracts) also registering lower bets on the week.


Stock Market Net Speculators Leaderboard

Legend: Weekly Speculators Change | Speculators Current Net Position | Speculators Strength Score compared to last 3-Years (0-100 range)


Strength Scores led by VIX & Russell-Mini

COT Strength Scores (a normalized measure of Speculator positions over a 3-Year range, from 0 to 100 where above 80 is Extreme-Bullish and below 20 is Extreme-Bearish) showed that the VIX (100 percent) and the Russell-Mini (87 percent) lead the stock markets this week. The DowJones-Mini (84 percent) and Nasdaq-Mini (69 percent) come in as the next highest in the weekly strength scores.

On the downside, the MSCI EAFE-Mini (25 percent) comes in at the lowest strength level currently. The next lowest strength score is the S&P500-Mini (46 percent).

Strength Statistics:
VIX (100.0 percent) vs VIX previous week (91.4 percent)
S&P500-Mini (46.4 percent) vs S&P500-Mini previous week (55.9 percent)
DowJones-Mini (84.1 percent) vs DowJones-Mini previous week (73.6 percent)
Nasdaq-Mini (69.0 percent) vs Nasdaq-Mini previous week (78.9 percent)
Russell2000-Mini (87.2 percent) vs Russell2000-Mini previous week (89.2 percent)
Nikkei USD (59.2 percent) vs Nikkei USD previous week (63.4 percent)
EAFE-Mini (25.1 percent) vs EAFE-Mini previous week (37.4 percent)


VIX top the 6-Week Strength Trends

COT Strength Score Trends (or move index, calculates the 6-week changes in strength scores) showed that the VIX (37 percent) leads the past six weeks trends for the stock markets. The DowJones-Mini (12 percent), the Nasdaq-Mini (10 percent) and the Russell-Mini (4 percent) are the next highest positive movers in the latest trends data.

The S&P500-Mini (-23 percent) leads the downside trend scores currently with the MSCI EAFE-Mini (-21 percent) coming in as the next market with lower trend scores.

Strength Trend Statistics:
VIX (37.1 percent) vs VIX previous week (34.6 percent)
S&P500-Mini (-23.4 percent) vs S&P500-Mini previous week (-10.6 percent)
DowJones-Mini (11.8 percent) vs DowJones-Mini previous week (-8.7 percent)
Nasdaq-Mini (10.3 percent) vs Nasdaq-Mini previous week (36.0 percent)
Russell2000-Mini (4.0 percent) vs Russell2000-Mini previous week (28.2 percent)
Nikkei USD (-6.3 percent) vs Nikkei USD previous week (16.2 percent)
EAFE-Mini (-20.6 percent) vs EAFE-Mini previous week (-10.9 percent)


Individual Stock Market Charts:

VIX Volatility Futures:

VIX Volatility Futures COT ChartThe VIX Volatility large speculator standing this week totaled a net position of -6,513 contracts in the data reported through Tuesday. This was a weekly lift of 8,598 contracts from the previous week which had a total of -15,111 net contracts.

This week’s current strength score (the trader positioning range over the past three years, measured from 0 to 100) shows the speculators are currently Bullish-Extreme with a score of 100.0 percent. The commercials are Bearish-Extreme with a score of 0.0 percent and the small traders (not shown in chart) are Bullish with a score of 64.2 percent.

Price Trend-Following Model: Uptrend

Our weekly trend-following model classifies the current market price position as: Uptrend. The current action for the model is considered to be: Hold – Maintain Long Position.

VIX Volatility Futures StatisticsSPECULATORSCOMMERCIALSSMALL TRADERS
– Percent of Open Interest Longs:20.742.27.2
– Percent of Open Interest Shorts:22.539.08.5
– Net Position:-6,51311,303-4,790
– Gross Longs:73,617150,29125,574
– Gross Shorts:80,130138,98830,364
– Long to Short Ratio:0.9 to 11.1 to 10.8 to 1
NET POSITION TREND:
– Strength Index Score (3 Year Range Pct):100.00.064.2
– Strength Index Reading (3 Year Range):Bullish-ExtremeBearish-ExtremeBullish
NET POSITION MOVEMENT INDEX:
– 6-Week Change in Strength Index:37.1-45.334.2


S&P500 Mini Futures:

SP500 Mini Futures COT ChartThe S&P500 Mini large speculator standing this week totaled a net position of -122,948 contracts in the data reported through Tuesday. This was a weekly lowering of -63,560 contracts from the previous week which had a total of -59,388 net contracts.

This week’s current strength score (the trader positioning range over the past three years, measured from 0 to 100) shows the speculators are currently Bearish with a score of 46.4 percent. The commercials are Bearish with a score of 45.1 percent and the small traders (not shown in chart) are Bullish-Extreme with a score of 82.8 percent.

Price Trend-Following Model: Strong Uptrend

Our weekly trend-following model classifies the current market price position as: Strong Uptrend. The current action for the model is considered to be: Hold – Maintain Long Position.

S&P500 Mini Futures StatisticsSPECULATORSCOMMERCIALSSMALL TRADERS
– Percent of Open Interest Longs:11.672.110.7
– Percent of Open Interest Shorts:16.370.77.4
– Net Position:-122,94837,74585,203
– Gross Longs:298,5161,860,927277,262
– Gross Shorts:421,4641,823,182192,059
– Long to Short Ratio:0.7 to 11.0 to 11.4 to 1
NET POSITION TREND:
– Strength Index Score (3 Year Range Pct):46.445.182.8
– Strength Index Reading (3 Year Range):BearishBearishBullish-Extreme
NET POSITION MOVEMENT INDEX:
– 6-Week Change in Strength Index:-23.421.60.3


Dow Jones Mini Futures:

Dow Jones Mini Futures COT ChartThe Dow Jones Mini large speculator standing this week totaled a net position of 14,614 contracts in the data reported through Tuesday. This was a weekly gain of 6,446 contracts from the previous week which had a total of 8,168 net contracts.

This week’s current strength score (the trader positioning range over the past three years, measured from 0 to 100) shows the speculators are currently Bullish-Extreme with a score of 84.1 percent. The commercials are Bearish-Extreme with a score of 15.0 percent and the small traders (not shown in chart) are Bullish with a score of 62.8 percent.

Price Trend-Following Model: Strong Uptrend

Our weekly trend-following model classifies the current market price position as: Strong Uptrend. The current action for the model is considered to be: Hold – Maintain Long Position.

Dow Jones Mini Futures StatisticsSPECULATORSCOMMERCIALSSMALL TRADERS
– Percent of Open Interest Longs:23.056.816.5
– Percent of Open Interest Shorts:8.173.115.1
– Net Position:14,614-15,9811,367
– Gross Longs:22,58855,75616,195
– Gross Shorts:7,97471,73714,828
– Long to Short Ratio:2.8 to 10.8 to 11.1 to 1
NET POSITION TREND:
– Strength Index Score (3 Year Range Pct):84.115.062.8
– Strength Index Reading (3 Year Range):Bullish-ExtremeBearish-ExtremeBullish
NET POSITION MOVEMENT INDEX:
– 6-Week Change in Strength Index:11.8-12.68.6


Nasdaq Mini Futures:

Nasdaq Mini Futures COT ChartThe Nasdaq Mini large speculator standing this week totaled a net position of 19,233 contracts in the data reported through Tuesday. This was a weekly fall of -6,393 contracts from the previous week which had a total of 25,626 net contracts.

This week’s current strength score (the trader positioning range over the past three years, measured from 0 to 100) shows the speculators are currently Bullish with a score of 69.0 percent. The commercials are Bearish-Extreme with a score of 16.4 percent and the small traders (not shown in chart) are Bullish-Extreme with a score of 80.7 percent.

Price Trend-Following Model: Strong Uptrend

Our weekly trend-following model classifies the current market price position as: Strong Uptrend. The current action for the model is considered to be: Hold – Maintain Long Position.

Nasdaq Mini Futures StatisticsSPECULATORSCOMMERCIALSSMALL TRADERS
– Percent of Open Interest Longs:25.555.415.7
– Percent of Open Interest Shorts:18.367.710.6
– Net Position:19,233-32,92813,695
– Gross Longs:68,287148,04242,112
– Gross Shorts:49,054180,97028,417
– Long to Short Ratio:1.4 to 10.8 to 11.5 to 1
NET POSITION TREND:
– Strength Index Score (3 Year Range Pct):69.016.480.7
– Strength Index Reading (3 Year Range):BullishBearish-ExtremeBullish-Extreme
NET POSITION MOVEMENT INDEX:
– 6-Week Change in Strength Index:10.3-1.6-9.9


Russell 2000 Mini Futures:

Russell 2000 Mini Futures COT ChartThe Russell 2000 Mini large speculator standing this week totaled a net position of 2,986 contracts in the data reported through Tuesday. This was a weekly decrease of -2,741 contracts from the previous week which had a total of 5,727 net contracts.

This week’s current strength score (the trader positioning range over the past three years, measured from 0 to 100) shows the speculators are currently Bullish-Extreme with a score of 87.2 percent. The commercials are Bearish-Extreme with a score of 10.4 percent and the small traders (not shown in chart) are Bullish with a score of 71.8 percent.

Price Trend-Following Model: Strong Uptrend

Our weekly trend-following model classifies the current market price position as: Strong Uptrend. The current action for the model is considered to be: Hold – Maintain Long Position.

Russell 2000 Mini Futures StatisticsSPECULATORSCOMMERCIALSSMALL TRADERS
– Percent of Open Interest Longs:14.873.06.1
– Percent of Open Interest Shorts:14.376.03.7
– Net Position:2,986-15,70512,719
– Gross Longs:78,186384,67032,407
– Gross Shorts:75,200400,37519,688
– Long to Short Ratio:1.0 to 11.0 to 11.6 to 1
NET POSITION TREND:
– Strength Index Score (3 Year Range Pct):87.210.471.8
– Strength Index Reading (3 Year Range):Bullish-ExtremeBearish-ExtremeBullish
NET POSITION MOVEMENT INDEX:
– 6-Week Change in Strength Index:4.0-5.912.2


Nikkei Stock Average (USD) Futures:

Nikkei Stock Average (USD) Futures COT ChartThe Nikkei Stock Average (USD) large speculator standing this week totaled a net position of -2,464 contracts in the data reported through Tuesday. This was a weekly lowering of -498 contracts from the previous week which had a total of -1,966 net contracts.

This week’s current strength score (the trader positioning range over the past three years, measured from 0 to 100) shows the speculators are currently Bullish with a score of 59.2 percent. The commercials are Bearish with a score of 37.5 percent and the small traders (not shown in chart) are Bullish with a score of 60.1 percent.

Price Trend-Following Model: Strong Uptrend

Our weekly trend-following model classifies the current market price position as: Strong Uptrend. The current action for the model is considered to be: Hold – Maintain Long Position.

Nikkei Stock Average Futures StatisticsSPECULATORSCOMMERCIALSSMALL TRADERS
– Percent of Open Interest Longs:2.070.227.7
– Percent of Open Interest Shorts:24.755.719.5
– Net Position:-2,4641,576888
– Gross Longs:2217,6203,008
– Gross Shorts:2,6856,0442,120
– Long to Short Ratio:0.1 to 11.3 to 11.4 to 1
NET POSITION TREND:
– Strength Index Score (3 Year Range Pct):59.237.560.1
– Strength Index Reading (3 Year Range):BullishBearishBullish
NET POSITION MOVEMENT INDEX:
– 6-Week Change in Strength Index:-6.34.81.0


MSCI EAFE Mini Futures:

MSCI EAFE Mini Futures COT ChartThe MSCI EAFE Mini large speculator standing this week totaled a net position of -40,750 contracts in the data reported through Tuesday. This was a weekly fall of -11,500 contracts from the previous week which had a total of -29,250 net contracts.

This week’s current strength score (the trader positioning range over the past three years, measured from 0 to 100) shows the speculators are currently Bearish with a score of 25.1 percent. The commercials are Bullish with a score of 71.6 percent and the small traders (not shown in chart) are Bearish with a score of 49.9 percent.

Price Trend-Following Model: Strong Uptrend

Our weekly trend-following model classifies the current market price position as: Strong Uptrend. The current action for the model is considered to be: Hold – Maintain Long Position.

MSCI EAFE Mini Futures StatisticsSPECULATORSCOMMERCIALSSMALL TRADERS
– Percent of Open Interest Longs:5.590.03.8
– Percent of Open Interest Shorts:13.483.42.6
– Net Position:-40,75034,1446,606
– Gross Longs:28,094463,79219,771
– Gross Shorts:68,844429,64813,165
– Long to Short Ratio:0.4 to 11.1 to 11.5 to 1
NET POSITION TREND:
– Strength Index Score (3 Year Range Pct):25.171.649.9
– Strength Index Reading (3 Year Range):BearishBullishBearish
NET POSITION MOVEMENT INDEX:
– 6-Week Change in Strength Index:-20.619.62.1


Article By InvestMacroReceive our weekly COT Newsletter

*COT Report: The COT data, released weekly to the public each Friday, is updated through the most recent Tuesday (data is 3 days old) and shows a quick view of how large speculators or non-commercials (for-profit traders) were positioned in the futures markets.

The CFTC categorizes trader positions according to commercial hedgers (traders who use futures contracts for hedging as part of the business), non-commercials (large traders who speculate to realize trading profits) and nonreportable traders (usually small traders/speculators) as well as their open interest (contracts open in the market at time of reporting). See CFTC criteria here.

Week Ahead: Can RUS2000 reach highest since 2021?

By ForexTime 

  • RUS2000: FXTM’s best-performing US stock index so far this week/month
  • RUS2000 forecasted to have the most potential upside over the next 12 months
  • Fed speakers, US data next week could help RUS2000 move closer to 2021 all-time high
  • Markets predict 89% chance Fed will cut rates by further 75-basis points by end-2024
  • Return of US recession fears could send RUS2000 plummeting


The RUS2000 index has been outshining its US peers of late.

This US stock index tracks the smallest 2000 publicly listed companies operating in the world’s largest economy i.e. companies that are more reflective of true US economic conditions.

Of late, the RUS2000 has been rejoicing the most, relative to FXTM’s other US stock indexes, over the Fed’s jumbo-sized 50 basis point rate cut!

That rate cut on September 18th, 2024 was the first US rate cut in 4 years.

With the Fed coming to the US economy’s aid with its rate cuts, the RUS2000 has outperformed other US stock indexes, both on a week-to-date (wtd) and month-to-date (mtd) basis:

  • RUS2000: up 3.2% wtd / 1.6% mtd
  • US400: up 3% wtd / 1.1% mtd
  • NAS100: up 1.7% wtd / 1.35% mtd
  • US500: up 1.56% wtd / 1.16% mtd
  • US30: up 1.53% wtd / 1.1% mtd


But RUS2000 still missing out on record-high club, for now

To be clear, the RUS200 has yet to join the record-high party which already features the likes of US500, US30, US400, and even gold of late.

At the time of writing, the RUS2000 remains about 8.5% below its all-time high, using intraday prices, of 2458.85 registered on November 8th, 2021.

Wall Street experts predict it will eventually set a new record high, but perhaps only by this time next year.


Wall Street most bullish on RUS2000 12-month outlook

Here are the forecasted potential gains for these US stock indexes over the next 12 months:

  • RUS2000: 19.4%
  • NAS100: 11.7%
  • US400: 9.9%
  • US500: 9.1%
  • US30: 5.4%

However, such gains are predicated on the notion that the Fed can indeed fend off a US recession.

And much of that will depend on the incoming US economic data, and whether the Fed can overcome their differing views and lower interest rates fast enough to avoid such a scenario.

Otherwise, a US recession is bound to send the RUS2000 plummeting, given the economically-sensitive nature of the stocks within this index.


What to look out for in the coming week?

The incoming scheduled speeches by Fed officials, fresh out of their September FOMC meeting, could provide further cause for RUS2000 bulls (those hoping prices will go higher) to rejoice even more:


Monday, September 23

  • NZD: New Zealand August trade balance
  • SG20 index: Singapore August CPI
  • TWN index: Taiwan August unemployment
  • EU50 index: Eurozone September PMIs
  • GBP: UK September PMIs
  • USD index: US September PMIs
  • RUS2000 index: Speeches by Chicago Fed President Austan Goolsbee, Atlanta Fed President Raphael Bostic, Minneapolis Fed President Neel Kashkari


Tuesday, September 24

  • JP225 index: Japan September PMIs
  • AUD: RBA rate decision
  • TWN index: Taiwan August export orders
  • GER40 index: Germany September business climate
  • Brent/Crude: OPEC releases annual World Oil Outlook
  • US400 index: US September consumer confidence


Wednesday, September 25

  • CNH: China medium-term lending facility rate
  • AU200 index: Australia August CPI
  • SEK: Riksbank policy rate decision
  • TWN index: Taiwan August industrial production


Thursday, September 26

  • JPY: BoJ meeting minutes
  • SG20 index: Singapore August industrial production
  • CHF: SNB policy rate decision
  • US500 index: US weekly initial jobless claims; US 2Q GDP (final)
  • USD index: Speeches by Fed Chair Jerome Powell (pre-recorded), New York Fed President John Williams, Treasury Secretary Janet Yellen


Friday, September 27

  • JPY: Tokyo September CPI; LDP internal elections
  • CN50 index: China August industrial profits
  • EUR: Eurozone September economic confidence; Germany September unemployment
  • US400 index: US August PCE, personal income and spending
  • RUS2000 index: Speeches by Boston Fed President Susan Collins, Fed Governor Adriana Kugler


Sure, the coming week also features key US economic data such as the US purchasing managers index (PMIs), consumer confidence, weekly jobless claims, final estimate of 2Q GDP, personal income and spending, as well as the Fed’s preferred inflation gauge – the personal consumption expenditures (PCE).

All of these quantitative data certainly hold the potential to move US stock markets, including the RUS2000 index.

However, markets may instead be more attentive to the forward-looking statements out of Fed officials in the days ahead.


Why are the Fed speakers so important?

These scheduled speeches come just days after the Fed’s jumbo rate cut on September 18th.

Note that this latest US rates decision also featured its first dissenting vote from any FOMC member since 2022.

Fed Governor Michelle Bowman voted in favour of a run-of-the-mill 25 basis point cut at the just-concluded September meeting.

A closer look at the FOMC’s famous “dot plot” also suggests that policymakers at the world’s most powerful central bank are at odds regarding the size and timing of future rate cuts:

Fed dot plot

  • 10 of 19 officials prefer another 50-bps in rate cuts by end-2024
  • 7 of the 19 voted for only one sole 25-bps rate cut by year-end
  • 2 of the remaining officials voted for no more rate cuts this year.


FOMC “dot plot” at odds with market forecasts

Not only are there differing views amongst FOMC members themselves, those views are also at odds with the market’s current forecasts.

At the time of writing, markets are forecasting a 89% chance that the Fed will lower its benchmark rates by another 75-basis points by Christmas.

Hence, the incoming Fed speak** will be stacked up against the latest Fed dot plot, and also current market forecasts.

**in bold in our coming week’s list of highlighted events (see above).

Notable shifts to existing market forecasts over incoming Fed rate cuts, either by way of signals from the Fed speak or US economic data, are bound to move prices across various asset classes in the week ahead.

In short, if you think the Fed watch is over, think again.


POTENTIAL SCENARIOS:

  • If the incoming Fed speak and US economic data assures markets that the Fed can proceed with the forecasted 75 basis points in rate cuts by end-2024, that could help RUS2000 punch its way past 2300 and closer to its November 2021 record high.
  • If the incoming Fed speak and US economic data pushes back on market forecasts for 75 basis points in Fed rate cuts by end-2024, that could drag the RUS2000 stock index back to its 21-day and 50-day simple moving averages (SMA) around 2170 for support.

Russell2000 index yet to join recent record-high club


Forex-Time-LogoArticle by ForexTime

ForexTime Ltd (FXTM) is an award winning international online forex broker regulated by CySEC 185/12 www.forextime.com

Taiwan Semiconductor’s 10% Dip: Is It Time to Buy?

By The Ino.com Team

With a $897.58 billion market cap, Taiwan Semiconductor Manufacturing Company Limited (TSM) plays a crucial role in the global semiconductor ecosystem by leading in the production of advanced chips used across several industries, including consumer electronics, automotive, telecom, and artificial intelligence (AI).

As one of the world’s largest independent semiconductor foundries, TSM’s expertise in advanced process technologies, such as 3nm and 5nm nodes, has made it a critical supplier for major tech companies, such as NVIDIA Corporation (NVDA), Advanced Micro Devices, Inc. (AMD), and Apple Inc. (AAPL).

Recently, the stock has dipped by around 10% from its all-time highs, making many investors wonder whether this pullback offers a prime buying opportunity. Let’s assess whether long-term investors should capitalize on TSMC’s discounted price.

TSMC’s Technological Leadership

Taiwan-based TSMC’s role in advancing manufacturing chip technology has solidified its position as a critical player in the high-tech ecosystem, particularly in industries such as AI, 5G, automotive, and data centers. One of the company’s greatest strengths is its leadership in advanced node technology.

As a global chip leader, TSM provides the most advanced and comprehensive portfolio of dedicated foundry process technologies, including A16, 2nm, 3nm, 5nm, 7nm, and more. The company’s 3nm process is the industry’s leading semiconductor technology, providing the best power, performance, and area (PPA) and represents a full node advance from the 5nm generation.

TSMC continuously expands its 3nm technology portfolio to cater to diverse customer needs. Last year, the chip giant added new members to its industry-leading 3nm technology family, including the N3X process, designed specifically for high-performance computing (HPC) applications, and N3AE, facilitating an early start for automotive applications on the most advanced silicon technology.

Moreover, TSMC’s 2nm technology employing nanosheet transistors continues to make significant progress in terms of yield and device performance and is expected to commence production in 2025.

Earlier this year, at its 2024 North America Technology Symposium, TSMC introduced its latest semiconductor process, advanced packaging, and 3D IC technologies, showcasing its silicon leadership in driving the next generation of AI innovations.

With TSMC’s cutting-edge N3E technology now in production and N2 slated for production in the second half of 2025, the company unveiled A16, the next technology in its roadmap. A16, set for production in 2026, integrates TSMC’s Super Power Rail architecture with nanosheet transistors. It enhances logic density and performance by allocating front-side routing resources to signals, making it well-suited for HPC products.
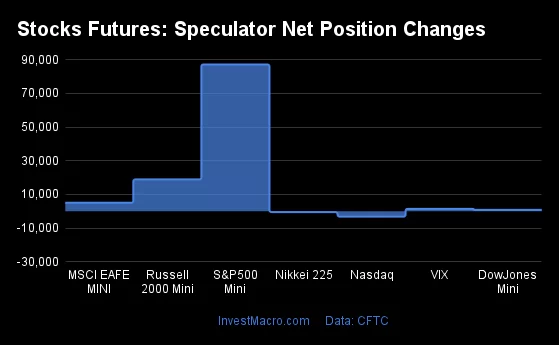
Also, the chip company introduced its System-on-Wafer (TSMC-SoW™) technology, a groundbreaking solution designed to deliver exceptional performance to the wafer level in addressing the future AI needs of hyperscaler data centers.

TSMC Surpasses Second-Quarter Earnings Expectations Amid AI Chip Boom

TSMC’s revenue and earnings beat analyst expectations in the second quarter of 2024 as demand for advanced chips used in AI applications continues to surge. In the quarter that ended June 30, 2024, the company’s net revenue rose 40.1% year-over-year to $20.82 billion. That surpassed analysts’ revenue estimate of $20.09 billion.

CEO C.C. Wei, in an earnings call, said business during the quarter was supported by robust demand for its industry-leading 3nm and 5nm technologies. TSMC’s shipments of 3-nanometer accounted for 15% of total wafer revenue, 5-nanometer constituted 35%, and 7-nanometer made up 17%. Advanced technologies, defined as 7-nanometer and more advanced technologies, accounted for 67% of total wafer revenue.
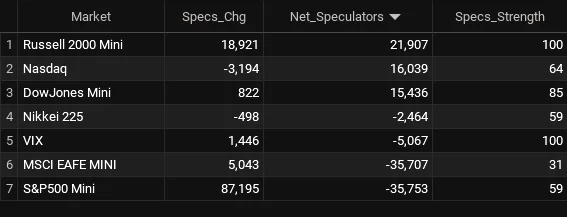
TSMC’s non-GAAP income from operations rose 41.9% year-over-year to $8.86 billion. Its net income and earnings per ADR were $7.66 billion and $1.48, increases of 36.3% year-over-year, respectively. Its earnings per ADR compared to the consensus estimate of $1.42.

“Moving into third quarter 2024, we expect our business to be supported by strong smartphone and AI-related demand for our leading-edge process technologies,” said Wendell Huang, Chief Financial Officer of TSMC.
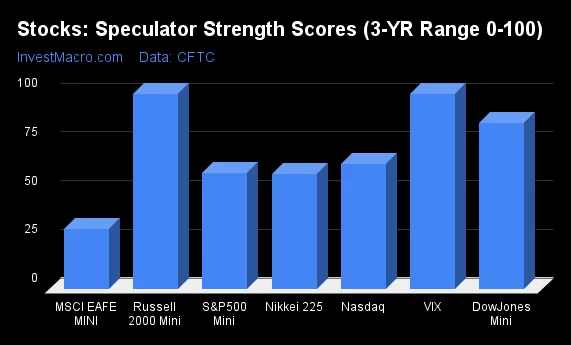
Based on the company’s current business outlook, TSMC’s management expects revenue between $22.40 billion and $23.20 billion for the third quarter of 2024. The company’s gross profit margin is projected to be between 53.5% and 55.5%, and its operating profit margin is anticipated to be between 42.5% and 44.5%.

Why TSMC’s Stock Dip May Be a Buying Opportunity
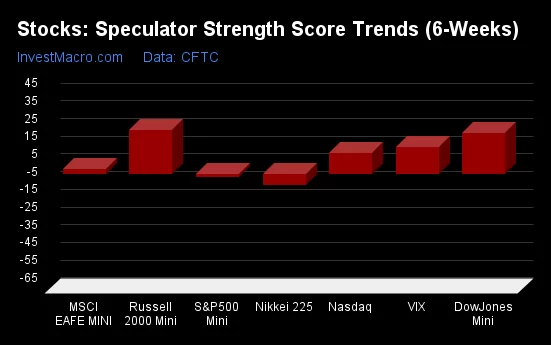
TSMC’s leadership in advanced chip manufacturing, coupled with the growing demand for advanced chips across AI, 5G, and high-performance computing sectors, positions the company for long-term growth. Management has projected third-quarter revenue to be $22.40-$23.20 billion, compared to $17.30 billion reported in the previous year’s quarter.

Meanwhile, analysts appear highly bullish about the company’s earnings growth. Street expects TSMC’s revenue and EPS for the current quarter (ending September 2024) to grow 38.8% and 37.9% year-over-year to $23.44 billion and $1.78, respectively.

For long-term investors, TSMC’s recent 10% decline may present an opportunity to buy into a company at the forefront of technological innovation. While short-term market fluctuations and geopolitical concerns may persist, the company’s technological leadership and strong growth outlook make it a compelling choice for those looking to benefit from the continued evolution of AI and semiconductor technology.

Bottom Line

TSMC’s recent stock dip presents a potential buying opportunity for long-term investors seeking exposure to a global leader in semiconductor innovation. With its industry-leading 3nm and 5nm process technologies, TSMC is well-positioned to capitalize on the growing demand for advanced chips, particularly in AI, 5G, and high-performance computing (HPC) industries.

While geopolitical risks and market volatility may pose challenges in the near term, TSMC’s strong earnings outlook and continuous innovation in semiconductor manufacturing suggest that this dip could be a strategic entry point.

By Ino.com – See our Trader Blog, INO TV Free & Market Analysis Alerts

Source: Taiwan Semiconductor’s 10% Dip: Is It Time to Buy?
https://www.ino.com/blog/2024/09/taiwan-semiconductors-10-dip-is-it-time-to-buy//?a_aid=CD3344&a_bid=e69e6702