
By ForexTime
- Nvidia shares only ↑1% year-to-date, 10% away from ATH
- Hyperscale spending and fiscal Q1 2027 guidance in focus
- Shares could move 5.7% ↑ or ↓ post earnings
- Analysts remain bullish with 12M target price at $258
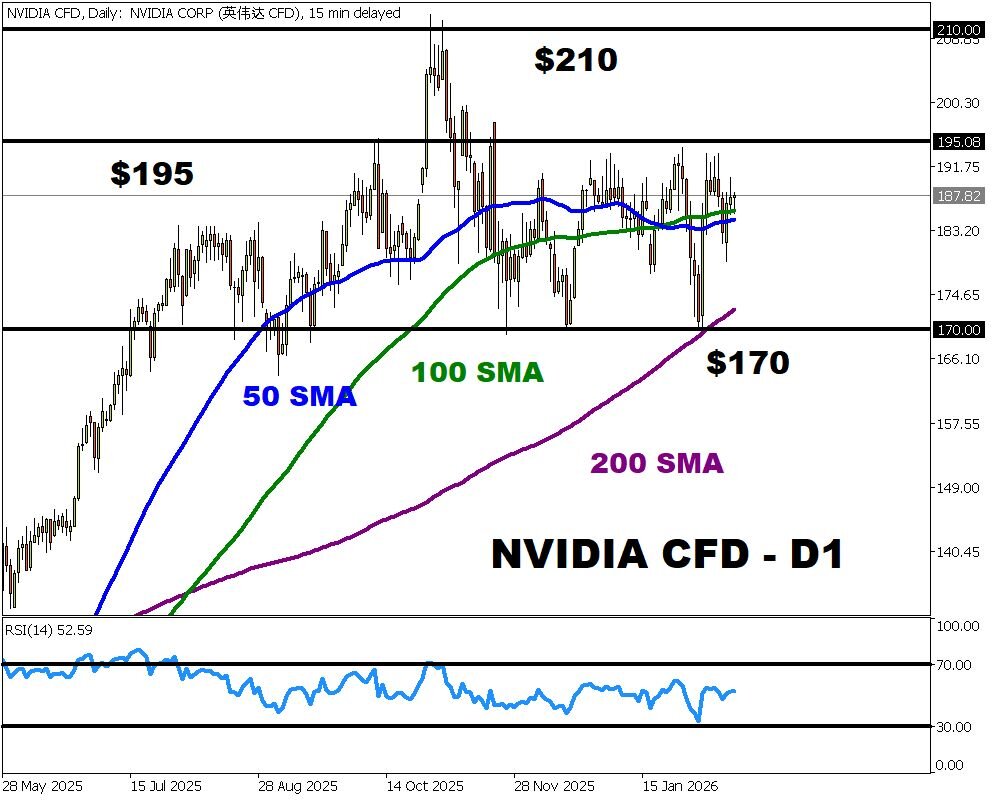
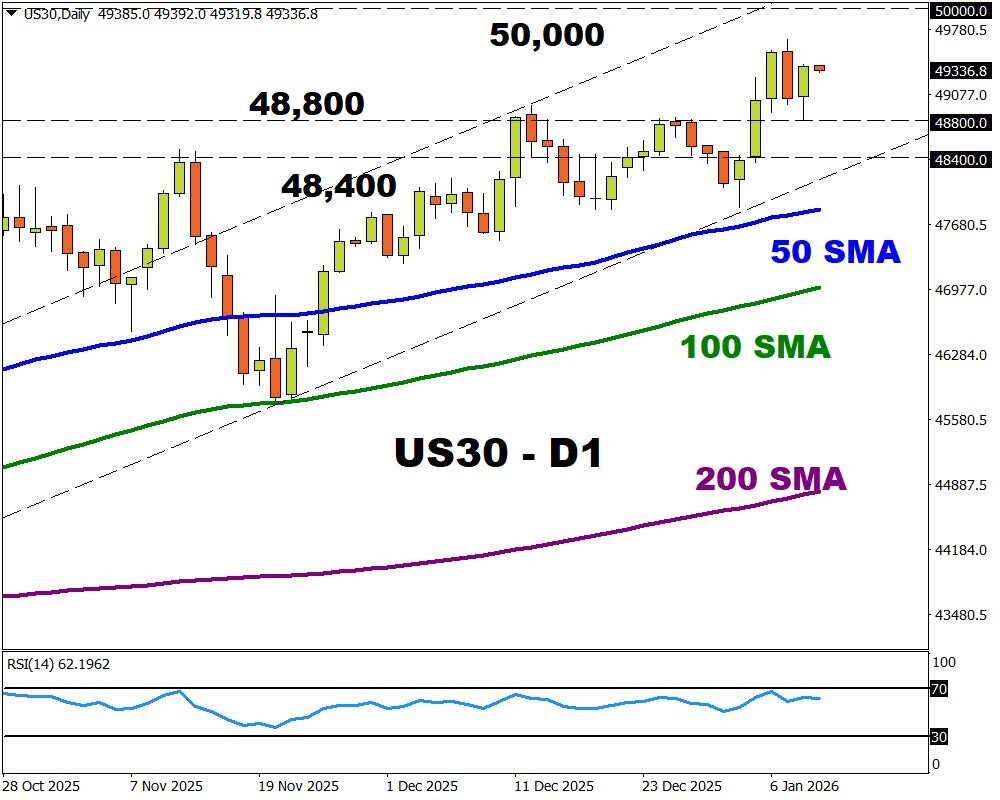
- Technical levels – $210, $195, 200-day SMA
As the most valuable company in the world, Nvidia’s earnings carry widespread implications.
But the focus for Q4 is unlikely to be about whether results smash forecasts.
It may revolve around management’s ability to convince investors that the AI spending spree is paying off amid growing fears over AI disrupting established business models.
Earnings from this tech titan along with global data may set the tone for March:
Monday, 23rd February
- EUR: Germany Ifo Business Climate (Feb); ECB President Christine Lagarde speech
- USD: Chicago Fed National Activity Index (Jan, Dec); US Factory Orders (Dec); Dallas Fed Manufacturing Index (Feb); Fed Governor Christopher Waller speech
Tuesday, 24th February
- EUR: Eurozone New Car Registrations (Jan); France Business Confidence (Feb)
- GBP: UK CBI Distributive Trades (Feb)
- USD: US ADP Employment Change Weekly; Fed Golsbee Speech; President Donald Trump delivers the State of the Union Address
- Crude (WTI, Brent): US API Crude Oil Stock Change (w/e Feb 20)
- CNY: China loan prime rates
Wednesday, 25th February
- AUD: Australia Inflation Rate (Jan)
- EUR: Germany GfK Consumer Confidence (Mar); France Consumer Confidence (Feb)
- Crude (WTI, Brent): US EIA Crude Oil Stocks Change (w/e Feb 20)
- Major Earnings: Nvidia (after markets close)
Thursday, 26th February
- JPY: BoJ Takada Speech; Japan Industrial Production (Jan); Retail Sales (Jan)
- EUR: Eurozone Economic Sentiment (Feb); Spain Business Confidence (Feb)
- USD: Initial Jobless Claims (w/e Feb 21)
Friday, 27th February
- GBP: UK Gfk Consumer Confidence (Feb)
- CHF: Swiss Retail Sales (Jan); GDP Growth Rate (Q4); KOF Leading Indicators (Feb)
- EUR: Germany Inflation Rate (Feb); France Inflation Rate (Feb); Germany Unemployment Data (Feb); Spain Inflation Rate (Feb)
- CAD: Canada GDP Growth Rate (Q4)
- USD: US PPI (Jan)
Nvidia remains among the biggest drivers of the AI rally, with its earnings acting as a litmus test for the health of the entire AI industry.
Interestingly, the Magnificent 7 index is down 6% YTD despite tech titans posting positive earnings. This could be due to concerns about AI capex spending, stretched valuations and lofty expectations.
Even if Nvidia delivers exceptional results, investors need to be convinced that all the AI spending will pay off down the road.
When will earnings be published
Nvidia releases its Q4 Fiscal Year 2026 earnings after US markets close on Wednesday 25th February.
Market expectations
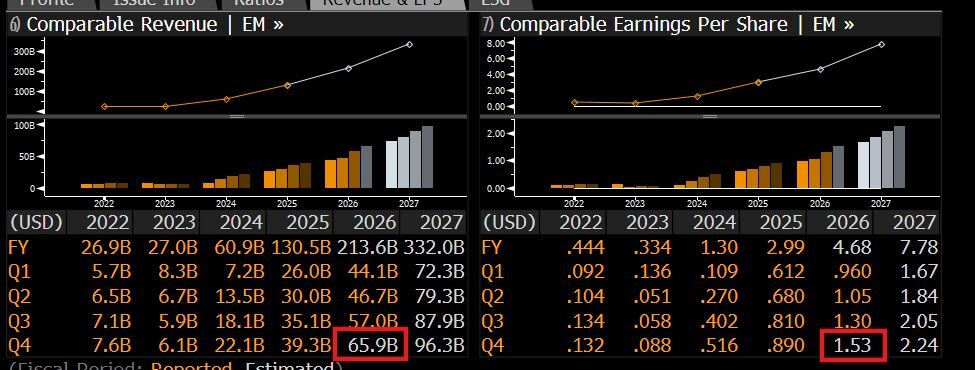
The tech giant is forecast to post earnings per share of $1.53 compared to $0.89 a year ago – representing a 72% jump.
Quarterly revenues are expected to rise $65.9 billion from $39.3 billion in the prior year – representing a 67% increase.
As highlighted earlier, there is little room for error with exceptional results needed to justify its whopping $4.6 trillion valuation.
What to watch
- Blackwell Ramp: Updates on the new architecture and supply constraints
- Guidance: Q1 2027 outlook is critical. Street expects $71.6B in revenue
- Margins: Rising memory costs could pressure profitability
How will Nvidia shares react to earnings
Markets are forecasting a 5.7% move, either Up or Down, for Nvidia stocks on Thursday post earnings.
This is equivalent to a move of roughly $260 billion, bigger than the entire market cap of many large companies in the S&P500 and Nasdaq 100.
How will wider markets be influenced?
Over the past 12 months, the Nasdaq 100 has shown an 83% positive correlation with Nvidia shares.
But more interestingly, over a rolling 5-day period over the past 2 years:
- US500: +60%
- UK100: +56%
- Meta Platforms: +87%
- Apple: +80%
- Amazon: +84%
- Broadcom: +82%
- ASML holdings: +60%
Analyst forecasts
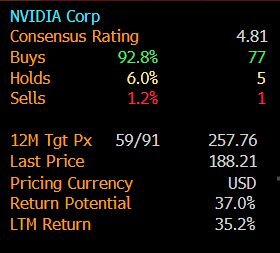
According to Bloomberg consensus, over 90% of analysts are bullish on Nvidia with the 12 month price target at $257.76 – roughly 25% away from current prices.
Technical forces
Prices may continue to consolidate within a range until the earnings are published.
- A solid breakout above $195 may open a path toward $210 and potentially higher.
- Weakness below the 100-day SMA could trigger a decline back toward the 200-day SMA and $170.
![]() Article by ForexTime
Article by ForexTime
ForexTime Ltd (FXTM) is an award winning international online forex broker regulated by CySEC 185/12 www.forextime.com


