By InvestMacro
Here are the latest charts and statistics for the Commitment of Traders (COT) data published by the Commodities Futures Trading Commission (CFTC).
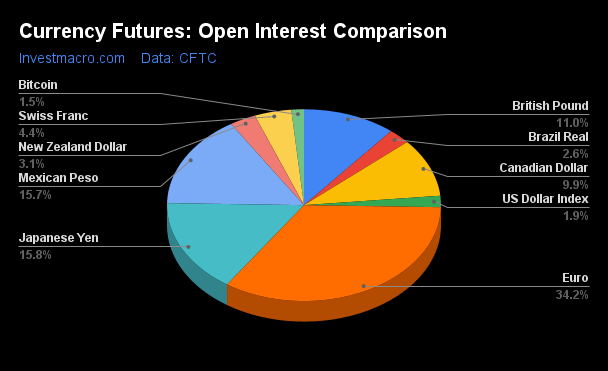
The latest COT data is updated through Tuesday April 2nd and shows a quick view of how large market participants (for-profit speculators and commercial traders) were positioned in the futures markets. All currency positions are in direct relation to the US dollar where, for example, a bet for the euro is a bet that the euro will rise versus the dollar while a bet against the euro will be a bet that the euro will decline versus the dollar.
Weekly Speculator Bets led by British Pound & Australian Dollar
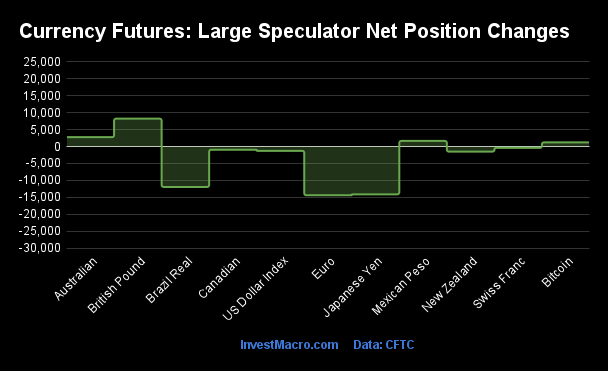
The COT currency market speculator bets were lower this week as four out of the eleven currency markets we cover had higher positioning while the other seven markets had lower speculator contracts.
Leading the gains for the currency markets was the British Pound Sterling (8,244 contracts) with the Australian Dollar (2,767 contracts), the Mexican Peso (1,662 contracts) and Bitcoin (1,235 contracts) also seeing positive a week.
The currencies seeing declines in speculator bets on the week were the EuroFX (-14,400 contracts), the Japanese Yen (-14,124 contracts), the Brazilian Real (-11,948 contracts), the New Zealand Dollar (-1,504 contracts), the US Dollar Index (-1,267 contracts), the Canadian Dollar (-933 contracts) and with the Swiss Franc (-402 contracts) also having lower bets on the week.
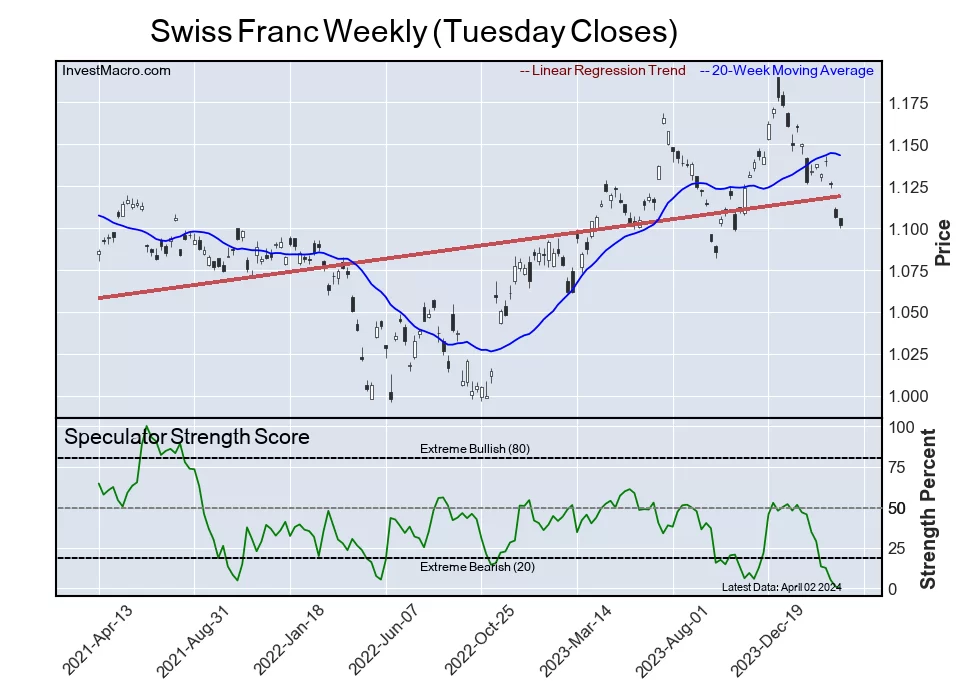
Speculators drop Swiss Franc bets for 9th week to most bearish since 2019
Highlighting the COT currency’s data this week is the decline in the speculator’s positioning for the Swiss franc. Large speculative Swiss franc (CHF) currency positions fell this week by a modest -402 net contracts but have now dropped for a ninth consecutive week. The speculator bets have also fallen for the tenth time out of the past eleven weeks as well – for a total 11-week decrease of -18,632 contracts.
This rapid decline in sentiment has taken the CHF speculative position to the most bearish level in the past two hundred and fifty-one weeks, dating all the way back to June 11th of 2019 when the net position totaled -24,788 contracts.
Helping to dent the Swiss franc’s appeal was a recent surprise interest rate cut by the the Swiss National Bank (SNB) in late March. This rate reduction took the interest rate down by 25 basis points to 1.5 percent and marked the SNB as the first major central bank to start a rate cutting cycle after global inflation pushed most central banks to raise rates in the past two years. As a major export country, the interest rate decrease and a falling franc is desirable for Switzerland businesses which will help exports become more competitive.
The CHF exchange rate versus the US Dollar has been on the decline after a strong uptrend from the 4th quarter of 2022 to late-2023 that saw the franc reach the highest exchange rate since 2015 at 1.2099 (CHF futures or CHFUSD). Since that high-point in December, the franc has been on the downtrend and closed out this week at the 1.1172 exchange rate to the Dollar and about 8 percent off that December high.
Currencies Net Speculators Leaderboard
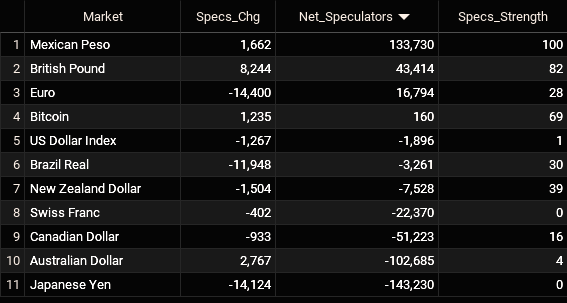
Legend: Weekly Speculators Change | Speculators Current Net Position | Speculators Strength Score compared to last 3-Years (0-100 range)
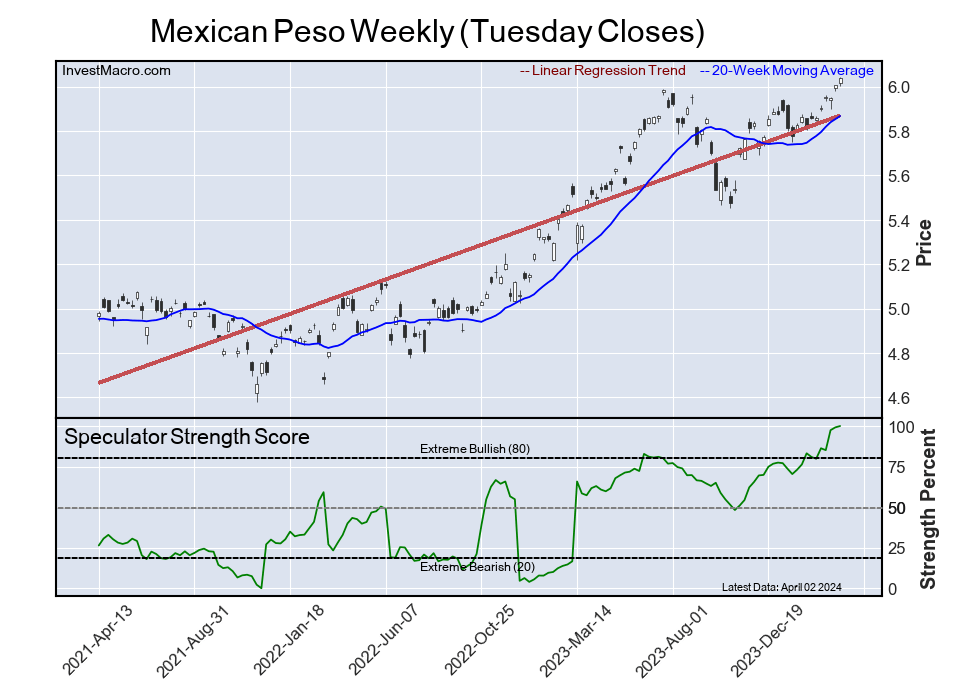
Strength Scores led by Mexican Peso & British Pound
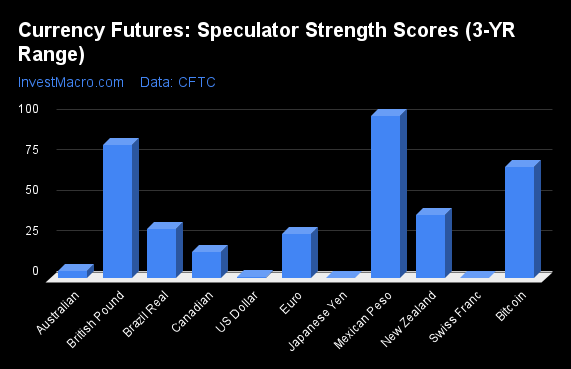
COT Strength Scores (a normalized measure of Speculator positions over a 3-Year range, from 0 to 100 where above 80 is Extreme-Bullish and below 20 is Extreme-Bearish) showed that the Mexican Peso (100 percent) and the British Pound (82 percent) lead the currency markets this week. Bitcoin (69 percent) comes in as the next highest in the weekly strength scores.
On the downside, the Swiss Franc (0 percent), the Japanese Yen (0 percent), the US Dollar Index (1 percent), the Australian Dollar (4 percent) and the Canadian Dollar (16 percent) come in at the lowest strength levels currently and are all in Extreme-Bearish territory (below 20 percent).
Strength Statistics:
US Dollar Index (0.9 percent) vs US Dollar Index previous week (3.5 percent)
EuroFX (27.5 percent) vs EuroFX previous week (33.6 percent)
British Pound Sterling (82.1 percent) vs British Pound Sterling previous week (76.6 percent)
Japanese Yen (0.0 percent) vs Japanese Yen previous week (11.5 percent)
Swiss Franc (0.0 percent) vs Swiss Franc previous week (1.1 percent)
Canadian Dollar (16.1 percent) vs Canadian Dollar previous week (16.9 percent)
Australian Dollar (4.4 percent) vs Australian Dollar previous week (1.9 percent)
New Zealand Dollar (39.0 percent) vs New Zealand Dollar previous week (43.3 percent)
Mexican Peso (100.0 percent) vs Mexican Peso previous week (99.2 percent)
Brazilian Real (30.3 percent) vs Brazilian Real previous week (45.8 percent)
Bitcoin (68.8 percent) vs Bitcoin previous week (50.2 percent)
Bitcoin & Mexican Peso top the 6-Week Strength Trends
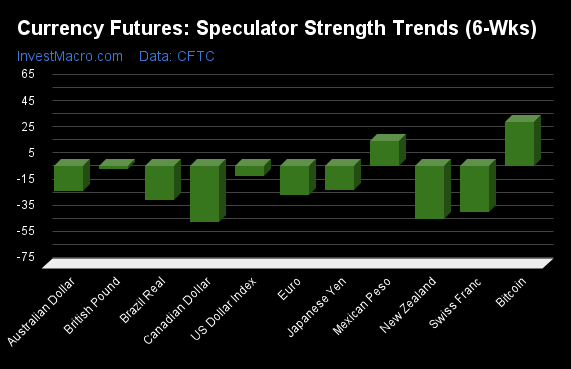
COT Strength Score Trends (or move index, calculates the 6-week changes in strength scores) showed that the Bitcoin (34 percent) and the Mexican Peso (19 percent) lead the past six weeks trends and are the only positive movers for the currencies.
The Canadian Dollar (-42 percent) leads the downside trend scores currently with the New Zealand Dollar (-40 percent), Swiss Franc (-35 percent) and the Brazilian Real (-26 percent) following next with lower trend scores.
Strength Trend Statistics:
US Dollar Index (-7.3 percent) vs US Dollar Index previous week (-5.6 percent)
EuroFX (-21.8 percent) vs EuroFX previous week (-9.2 percent)
British Pound Sterling (-1.9 percent) vs British Pound Sterling previous week (-10.1 percent)
Japanese Yen (-18.2 percent) vs Japanese Yen previous week (-14.3 percent)
Swiss Franc (-34.7 percent) vs Swiss Franc previous week (-44.4 percent)
Canadian Dollar (-42.3 percent) vs Canadian Dollar previous week (-37.6 percent)
Australian Dollar (-18.7 percent) vs Australian Dollar previous week (-23.8 percent)
New Zealand Dollar (-40.2 percent) vs New Zealand Dollar previous week (-26.8 percent)
Mexican Peso (19.1 percent) vs Mexican Peso previous week (16.0 percent)
Brazilian Real (-25.7 percent) vs Brazilian Real previous week (-13.8 percent)
Bitcoin (34.0 percent) vs Bitcoin previous week (12.7 percent)
Individual COT Forex Markets:
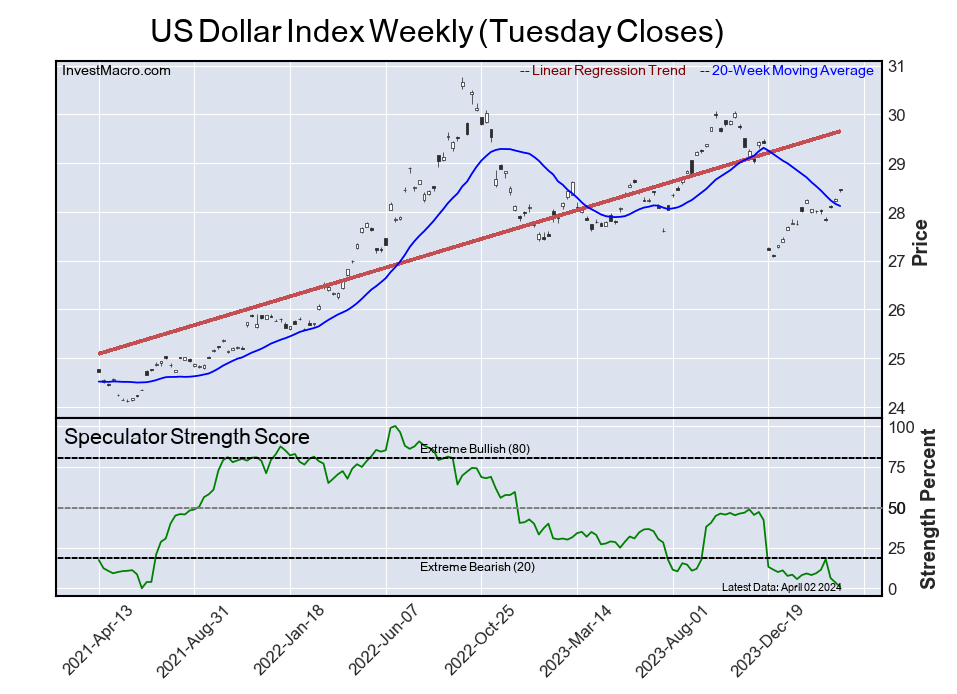
US Dollar Index Futures:
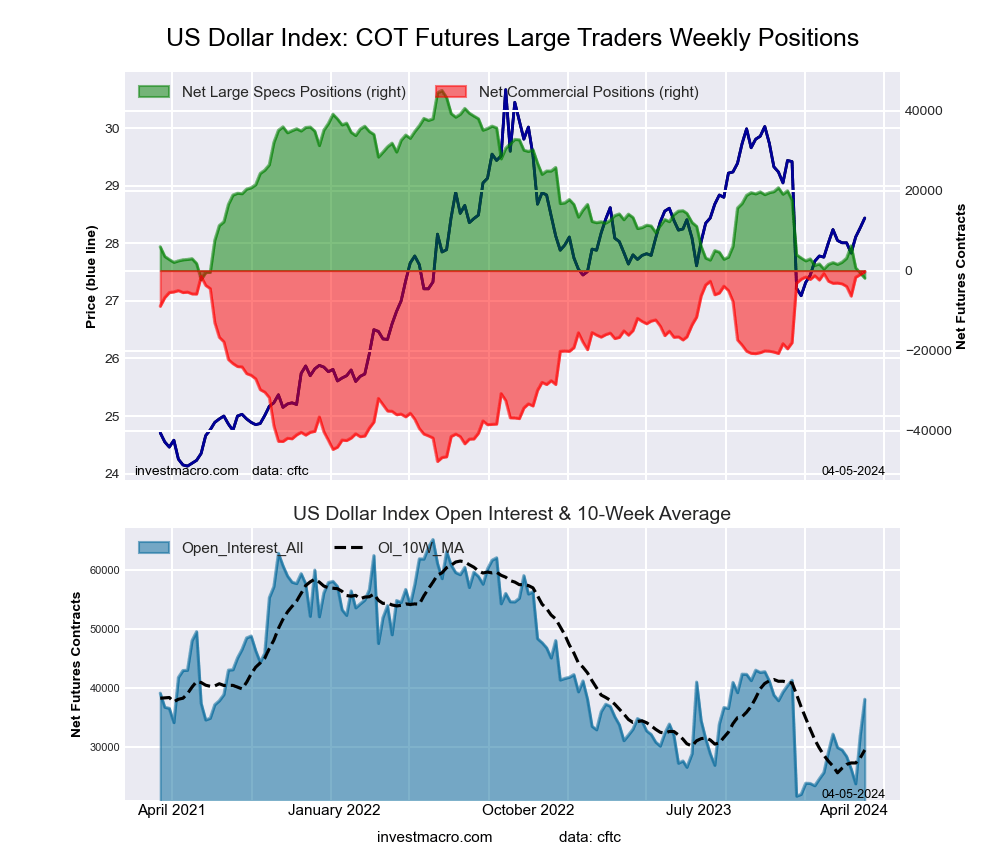 The US Dollar Index large speculator standing this week resulted in a net position of -1,896 contracts in the data reported through Tuesday. This was a weekly lowering of -1,267 contracts from the previous week which had a total of -629 net contracts.
This week’s current strength score (the trader positioning range over the past three years, measured from 0 to 100) shows the speculators are currently Bearish-Extreme with a score of 0.9 percent. The commercials are Bullish-Extreme with a score of 100.0 percent and the small traders (not shown in chart) are Bearish with a score of 36.8 percent.
Price Trend-Following Model: Weak Downtrend
Our weekly trend-following model classifies the current market price position as: Weak Downtrend. The current action for the model is considered to be: Hold – Maintain Short Position.
| US DOLLAR INDEX Statistics | SPECULATORS | COMMERCIALS | SMALL TRADERS |
| – Percent of Open Interest Longs: | 62.1 | 22.2 | 12.4 |
| – Percent of Open Interest Shorts: | 67.1 | 23.0 | 6.7 |
| – Net Position: | -1,896 | -305 | 2,201 |
| – Gross Longs: | 23,681 | 8,446 | 4,744 |
| – Gross Shorts: | 25,577 | 8,751 | 2,543 |
| – Long to Short Ratio: | 0.9 to 1 | 1.0 to 1 | 1.9 to 1 |
| NET POSITION TREND: | | | |
| – Strength Index Score (3 Year Range Pct): | 0.9 | 100.0 | 36.8 |
| – Strength Index Reading (3 Year Range): | Bearish-Extreme | Bullish-Extreme | Bearish |
| NET POSITION MOVEMENT INDEX: | | | |
| – 6-Week Change in Strength Index: | -7.3 | 5.9 | 7.2 |
Euro Currency Futures:
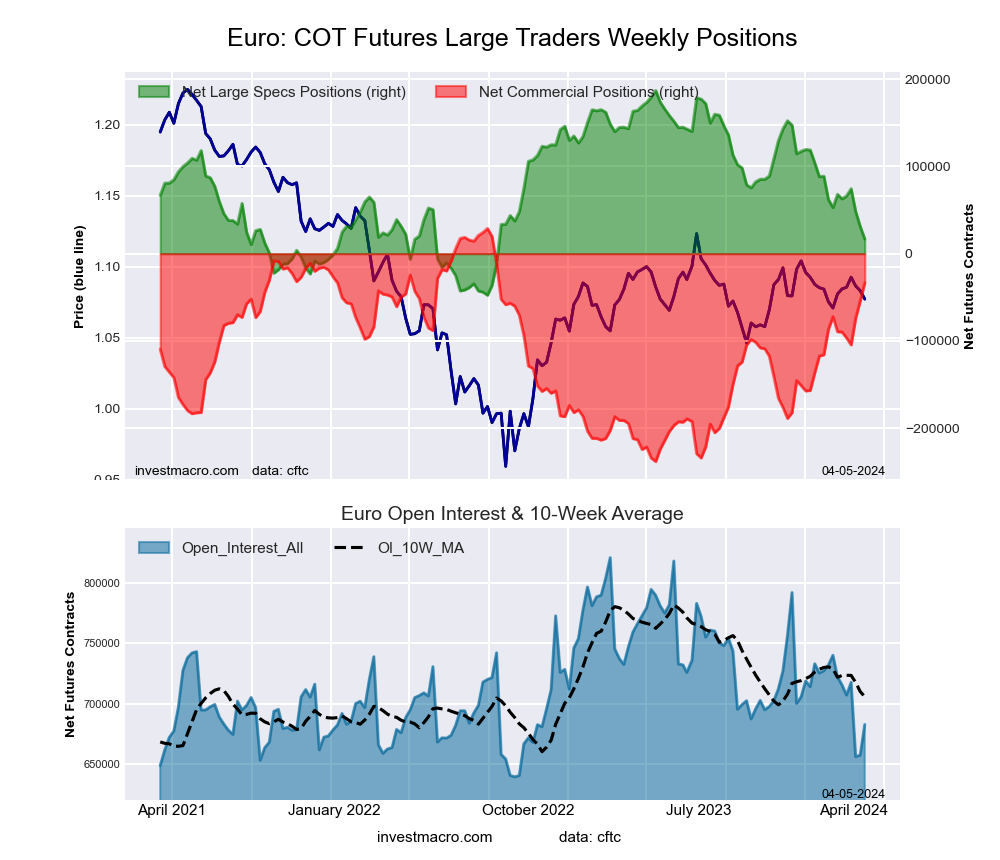 The Euro Currency large speculator standing this week resulted in a net position of 16,794 contracts in the data reported through Tuesday. This was a weekly reduction of -14,400 contracts from the previous week which had a total of 31,194 net contracts.
This week’s current strength score (the trader positioning range over the past three years, measured from 0 to 100) shows the speculators are currently Bearish with a score of 27.5 percent. The commercials are Bullish with a score of 76.7 percent and the small traders (not shown in chart) are Bearish-Extreme with a score of 5.5 percent.
Price Trend-Following Model: Downtrend
Our weekly trend-following model classifies the current market price position as: Downtrend. The current action for the model is considered to be: Hold – Maintain Short Position.
| EURO Currency Statistics | SPECULATORS | COMMERCIALS | SMALL TRADERS |
| – Percent of Open Interest Longs: | 27.6 | 60.4 | 10.8 |
| – Percent of Open Interest Shorts: | 25.1 | 65.3 | 8.3 |
| – Net Position: | 16,794 | -33,432 | 16,638 |
| – Gross Longs: | 188,258 | 412,480 | 73,567 |
| – Gross Shorts: | 171,464 | 445,912 | 56,929 |
| – Long to Short Ratio: | 1.1 to 1 | 0.9 to 1 | 1.3 to 1 |
| NET POSITION TREND: | | | |
| – Strength Index Score (3 Year Range Pct): | 27.5 | 76.7 | 5.5 |
| – Strength Index Reading (3 Year Range): | Bearish | Bullish | Bearish-Extreme |
| NET POSITION MOVEMENT INDEX: | | | |
| – 6-Week Change in Strength Index: | -21.8 | 21.0 | -7.7 |
British Pound Sterling Futures:
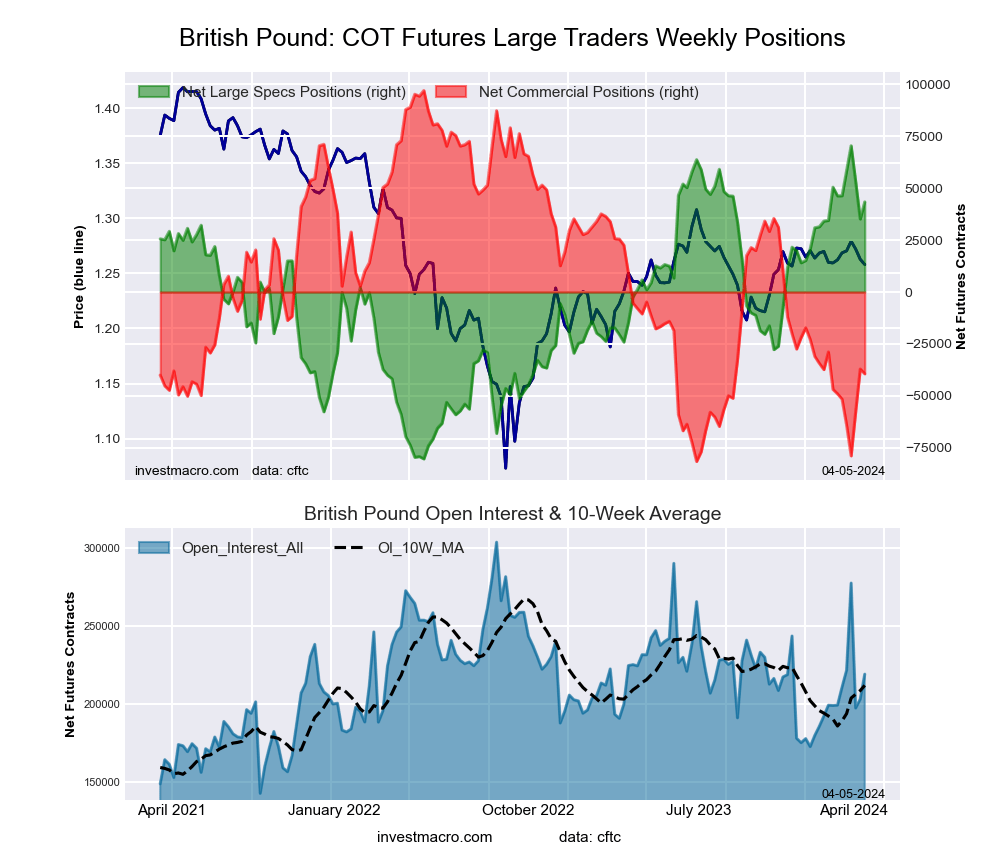 The British Pound Sterling large speculator standing this week resulted in a net position of 43,414 contracts in the data reported through Tuesday. This was a weekly rise of 8,244 contracts from the previous week which had a total of 35,170 net contracts.
This week’s current strength score (the trader positioning range over the past three years, measured from 0 to 100) shows the speculators are currently Bullish-Extreme with a score of 82.1 percent. The commercials are Bearish with a score of 23.6 percent and the small traders (not shown in chart) are Bullish with a score of 50.1 percent.
Price Trend-Following Model: Weak Uptrend
Our weekly trend-following model classifies the current market price position as: Weak Uptrend. The current action for the model is considered to be: Hold – Maintain Long Position.
| BRITISH POUND Statistics | SPECULATORS | COMMERCIALS | SMALL TRADERS |
| – Percent of Open Interest Longs: | 44.9 | 41.1 | 11.5 |
| – Percent of Open Interest Shorts: | 25.1 | 59.1 | 13.3 |
| – Net Position: | 43,414 | -39,400 | -4,014 |
| – Gross Longs: | 98,352 | 90,146 | 25,106 |
| – Gross Shorts: | 54,938 | 129,546 | 29,120 |
| – Long to Short Ratio: | 1.8 to 1 | 0.7 to 1 | 0.9 to 1 |
| NET POSITION TREND: | | | |
| – Strength Index Score (3 Year Range Pct): | 82.1 | 23.6 | 50.1 |
| – Strength Index Reading (3 Year Range): | Bullish-Extreme | Bearish | Bullish |
| NET POSITION MOVEMENT INDEX: | | | |
| – 6-Week Change in Strength Index: | -1.9 | 5.4 | -13.2 |
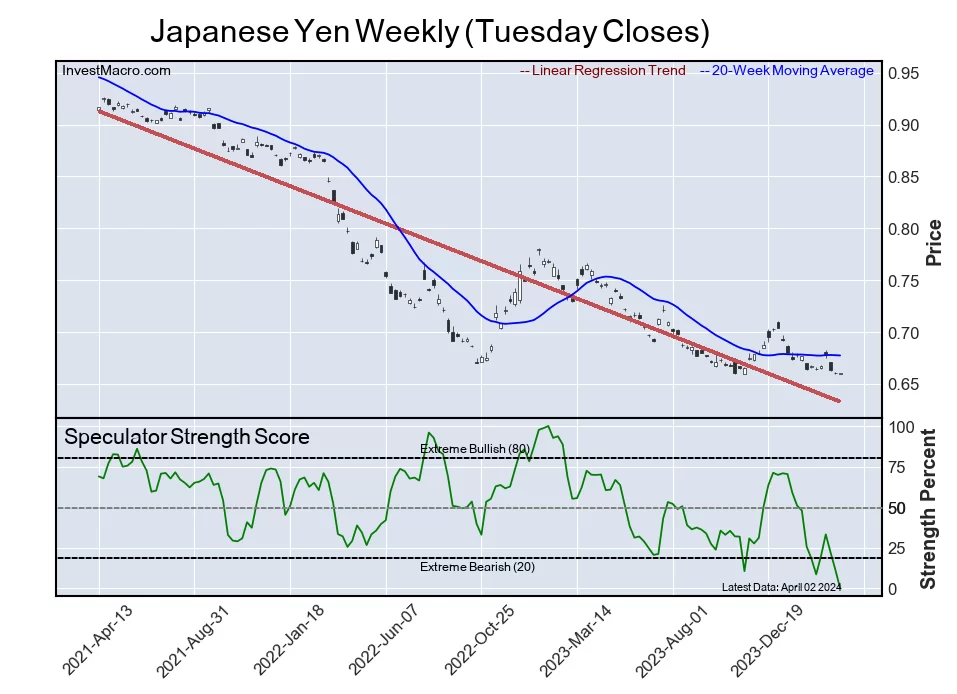
Japanese Yen Futures:
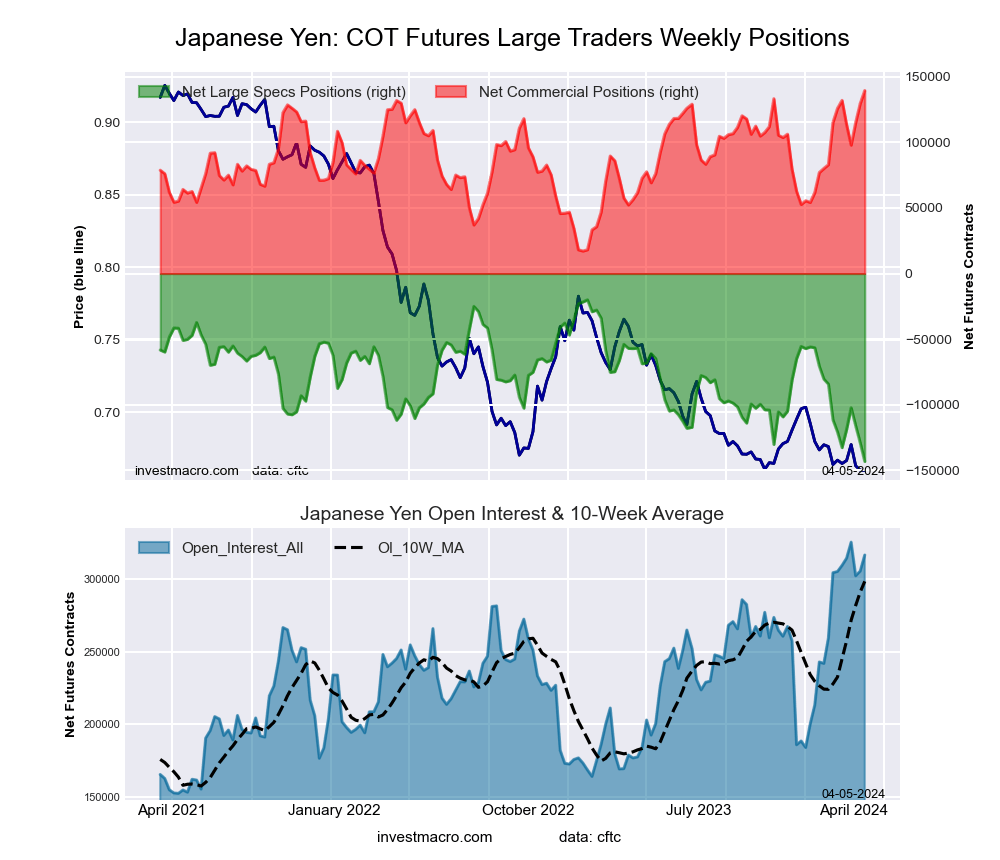 The Japanese Yen large speculator standing this week resulted in a net position of -143,230 contracts in the data reported through Tuesday. This was a weekly decrease of -14,124 contracts from the previous week which had a total of -129,106 net contracts.
This week’s current strength score (the trader positioning range over the past three years, measured from 0 to 100) shows the speculators are currently Bearish-Extreme with a score of 0.0 percent. The commercials are Bullish-Extreme with a score of 100.0 percent and the small traders (not shown in chart) are Bullish-Extreme with a score of 94.3 percent.
Price Trend-Following Model: Strong Downtrend
Our weekly trend-following model classifies the current market price position as: Strong Downtrend. The current action for the model is considered to be: Hold – Maintain Short Position.
| JAPANESE YEN Statistics | SPECULATORS | COMMERCIALS | SMALL TRADERS |
| – Percent of Open Interest Longs: | 17.4 | 64.8 | 15.9 |
| – Percent of Open Interest Shorts: | 62.6 | 20.7 | 14.8 |
| – Net Position: | -143,230 | 139,494 | 3,736 |
| – Gross Longs: | 55,190 | 205,195 | 50,476 |
| – Gross Shorts: | 198,420 | 65,701 | 46,740 |
| – Long to Short Ratio: | 0.3 to 1 | 3.1 to 1 | 1.1 to 1 |
| NET POSITION TREND: | | | |
| – Strength Index Score (3 Year Range Pct): | 0.0 | 100.0 | 94.3 |
| – Strength Index Reading (3 Year Range): | Bearish-Extreme | Bullish-Extreme | Bullish-Extreme |
| NET POSITION MOVEMENT INDEX: | | | |
| – 6-Week Change in Strength Index: | -18.2 | 11.1 | 27.7 |
Swiss Franc Futures:
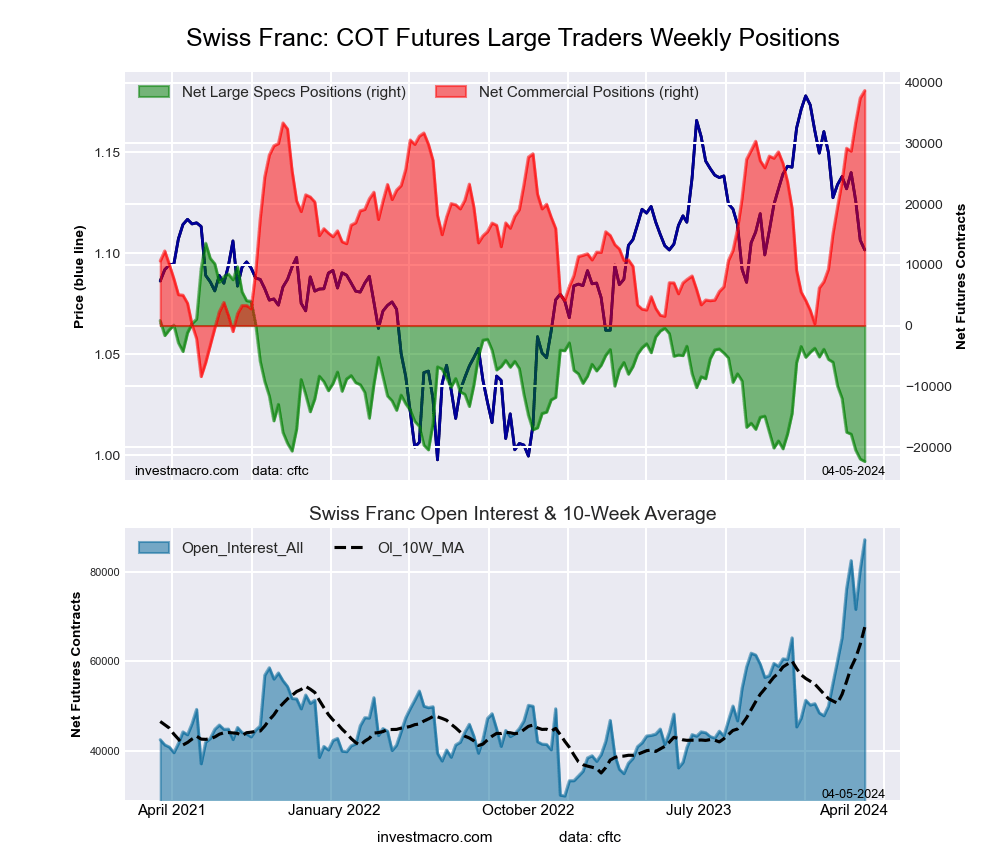 The Swiss Franc large speculator standing this week resulted in a net position of -22,370 contracts in the data reported through Tuesday. This was a weekly decline of -402 contracts from the previous week which had a total of -21,968 net contracts.
This week’s current strength score (the trader positioning range over the past three years, measured from 0 to 100) shows the speculators are currently Bearish-Extreme with a score of 0.0 percent. The commercials are Bullish-Extreme with a score of 100.0 percent and the small traders (not shown in chart) are Bearish-Extreme with a score of 3.1 percent.
Price Trend-Following Model: Strong Downtrend
Our weekly trend-following model classifies the current market price position as: Strong Downtrend. The current action for the model is considered to be: Hold – Maintain Short Position.
| SWISS FRANC Statistics | SPECULATORS | COMMERCIALS | SMALL TRADERS |
| – Percent of Open Interest Longs: | 24.4 | 64.5 | 11.1 |
| – Percent of Open Interest Shorts: | 50.0 | 20.0 | 29.8 |
| – Net Position: | -22,370 | 38,683 | -16,313 |
| – Gross Longs: | 21,220 | 56,144 | 9,682 |
| – Gross Shorts: | 43,590 | 17,461 | 25,995 |
| – Long to Short Ratio: | 0.5 to 1 | 3.2 to 1 | 0.4 to 1 |
| NET POSITION TREND: | | | |
| – Strength Index Score (3 Year Range Pct): | 0.0 | 100.0 | 3.1 |
| – Strength Index Reading (3 Year Range): | Bearish-Extreme | Bullish-Extreme | Bearish-Extreme |
| NET POSITION MOVEMENT INDEX: | | | |
| – 6-Week Change in Strength Index: | -34.7 | 40.8 | -30.7 |
Canadian Dollar Futures:
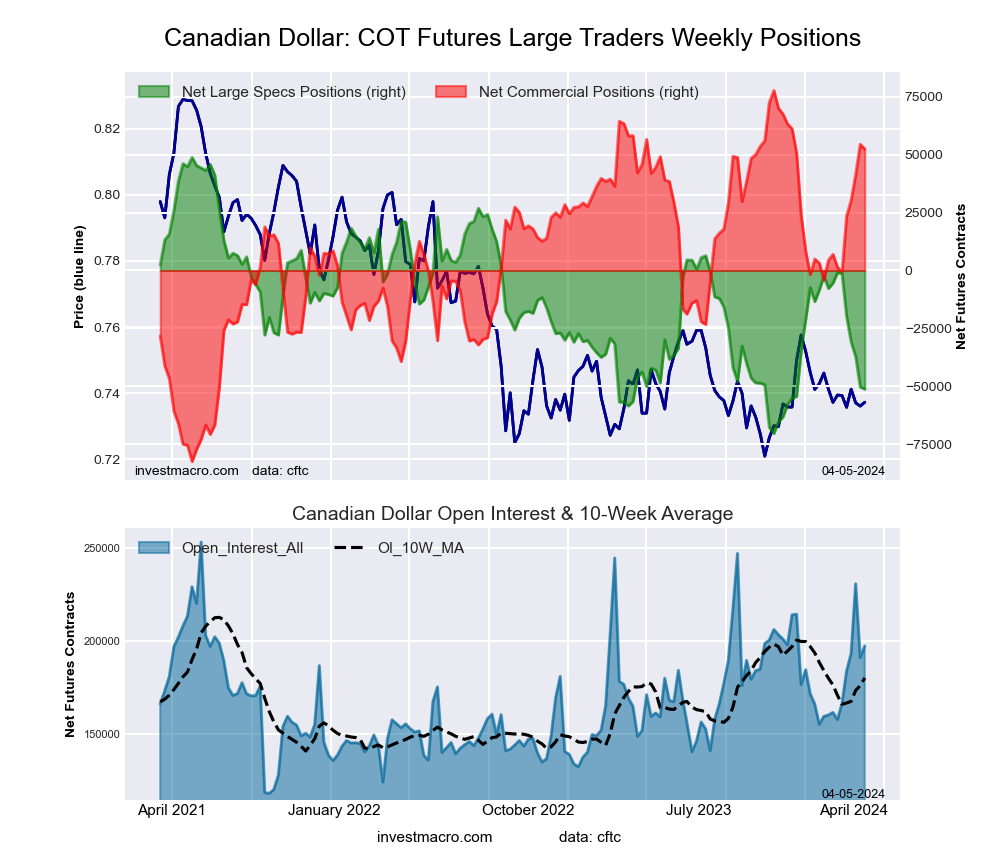 The Canadian Dollar large speculator standing this week resulted in a net position of -51,223 contracts in the data reported through Tuesday. This was a weekly decrease of -933 contracts from the previous week which had a total of -50,290 net contracts.
This week’s current strength score (the trader positioning range over the past three years, measured from 0 to 100) shows the speculators are currently Bearish-Extreme with a score of 16.1 percent. The commercials are Bullish-Extreme with a score of 84.3 percent and the small traders (not shown in chart) are Bearish with a score of 20.0 percent.
Price Trend-Following Model: Strong Downtrend
Our weekly trend-following model classifies the current market price position as: Strong Downtrend. The current action for the model is considered to be: New Sell – Short Position.
| CANADIAN DOLLAR Statistics | SPECULATORS | COMMERCIALS | SMALL TRADERS |
| – Percent of Open Interest Longs: | 22.4 | 61.0 | 14.1 |
| – Percent of Open Interest Shorts: | 48.4 | 34.4 | 14.7 |
| – Net Position: | -51,223 | 52,481 | -1,258 |
| – Gross Longs: | 44,220 | 120,307 | 27,748 |
| – Gross Shorts: | 95,443 | 67,826 | 29,006 |
| – Long to Short Ratio: | 0.5 to 1 | 1.8 to 1 | 1.0 to 1 |
| NET POSITION TREND: | | | |
| – Strength Index Score (3 Year Range Pct): | 16.1 | 84.3 | 20.0 |
| – Strength Index Reading (3 Year Range): | Bearish-Extreme | Bullish-Extreme | Bearish |
| NET POSITION MOVEMENT INDEX: | | | |
| – 6-Week Change in Strength Index: | -42.3 | 31.9 | -1.7 |
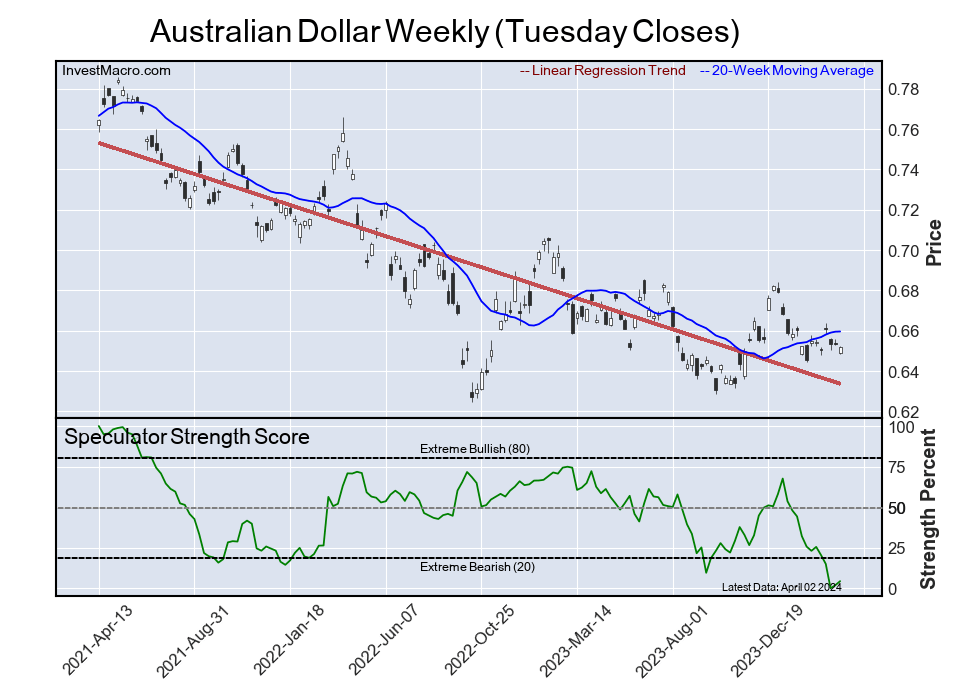
Australian Dollar Futures:
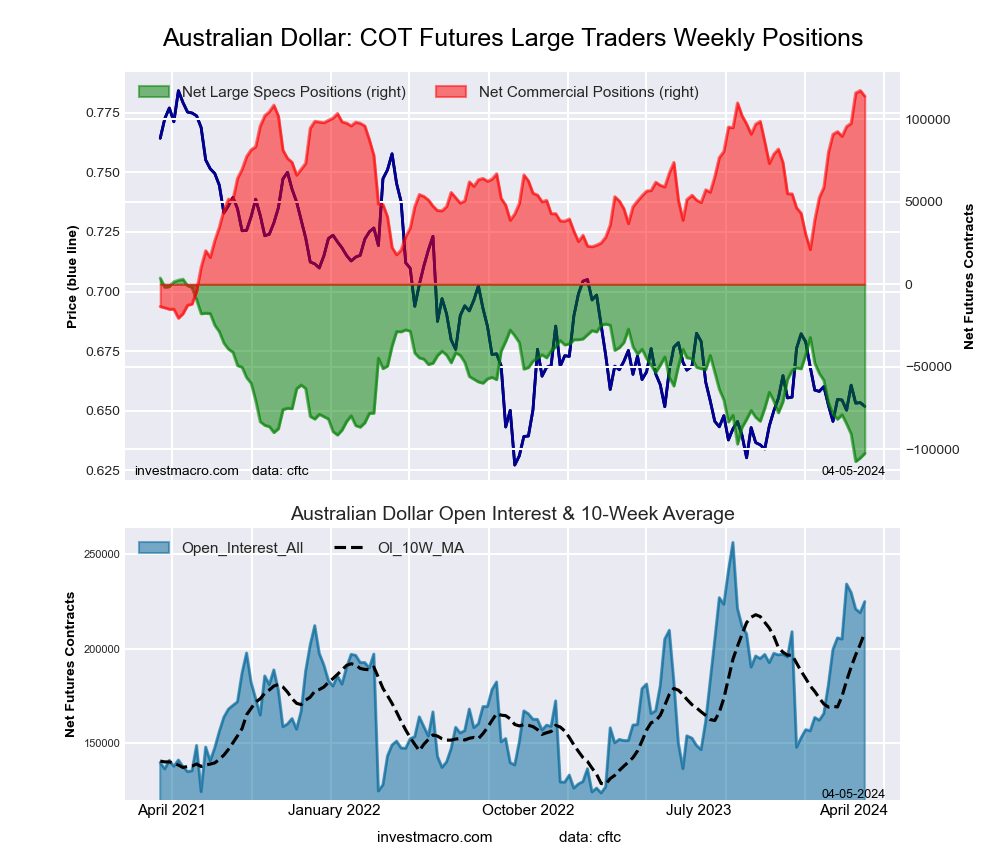 The Australian Dollar large speculator standing this week resulted in a net position of -102,685 contracts in the data reported through Tuesday. This was a weekly increase of 2,767 contracts from the previous week which had a total of -105,452 net contracts.
This week’s current strength score (the trader positioning range over the past three years, measured from 0 to 100) shows the speculators are currently Bearish-Extreme with a score of 4.4 percent. The commercials are Bullish-Extreme with a score of 97.5 percent and the small traders (not shown in chart) are Bearish with a score of 25.5 percent.
Price Trend-Following Model: Downtrend
Our weekly trend-following model classifies the current market price position as: Downtrend. The current action for the model is considered to be: Hold – Maintain Short Position.
| AUSTRALIAN DOLLAR Statistics | SPECULATORS | COMMERCIALS | SMALL TRADERS |
| – Percent of Open Interest Longs: | 15.4 | 73.3 | 9.1 |
| – Percent of Open Interest Shorts: | 61.0 | 22.5 | 14.1 |
| – Net Position: | -102,685 | 114,086 | -11,401 |
| – Gross Longs: | 34,557 | 164,790 | 20,421 |
| – Gross Shorts: | 137,242 | 50,704 | 31,822 |
| – Long to Short Ratio: | 0.3 to 1 | 3.3 to 1 | 0.6 to 1 |
| NET POSITION TREND: | | | |
| – Strength Index Score (3 Year Range Pct): | 4.4 | 97.5 | 25.5 |
| – Strength Index Reading (3 Year Range): | Bearish-Extreme | Bullish-Extreme | Bearish |
| NET POSITION MOVEMENT INDEX: | | | |
| – 6-Week Change in Strength Index: | -18.7 | 15.5 | -1.7 |
New Zealand Dollar Futures:
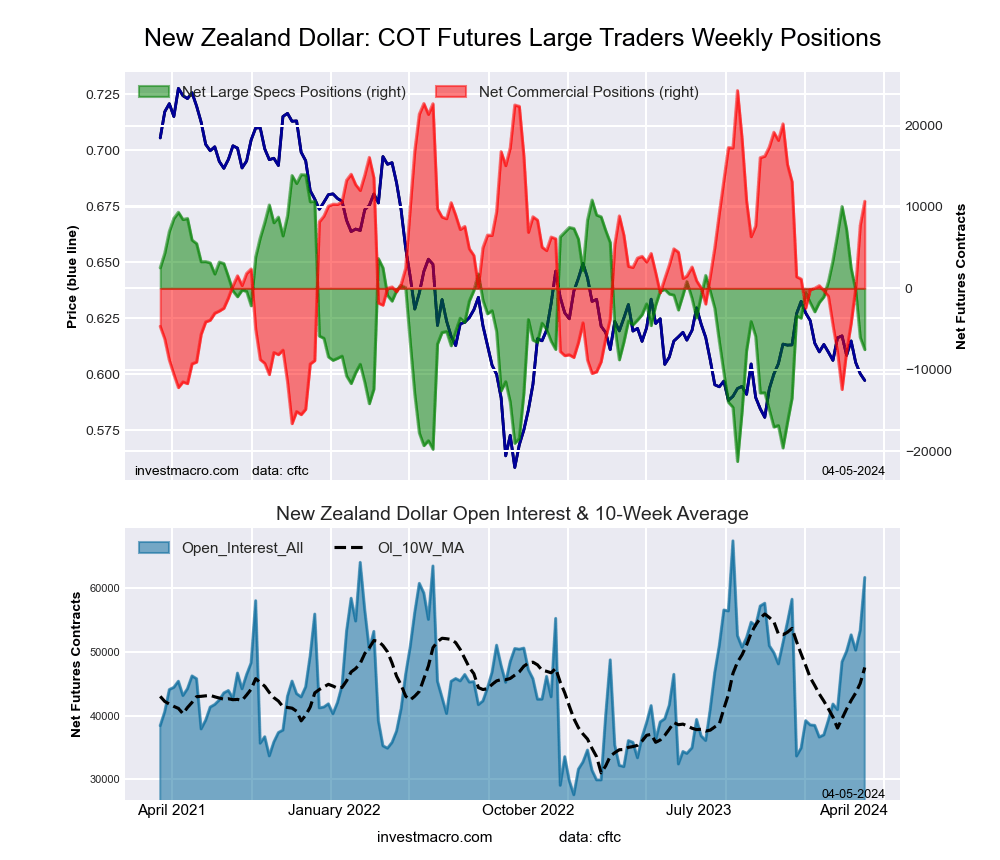 The New Zealand Dollar large speculator standing this week resulted in a net position of -7,528 contracts in the data reported through Tuesday. This was a weekly reduction of -1,504 contracts from the previous week which had a total of -6,024 net contracts.
This week’s current strength score (the trader positioning range over the past three years, measured from 0 to 100) shows the speculators are currently Bearish with a score of 39.0 percent. The commercials are Bullish with a score of 66.8 percent and the small traders (not shown in chart) are Bearish-Extreme with a score of 13.3 percent.
Price Trend-Following Model: Strong Downtrend
Our weekly trend-following model classifies the current market price position as: Strong Downtrend. The current action for the model is considered to be: Hold – Maintain Short Position.
| NEW ZEALAND DOLLAR Statistics | SPECULATORS | COMMERCIALS | SMALL TRADERS |
| – Percent of Open Interest Longs: | 32.0 | 62.2 | 5.5 |
| – Percent of Open Interest Shorts: | 44.1 | 44.9 | 10.6 |
| – Net Position: | -7,528 | 10,695 | -3,167 |
| – Gross Longs: | 19,725 | 38,421 | 3,383 |
| – Gross Shorts: | 27,253 | 27,726 | 6,550 |
| – Long to Short Ratio: | 0.7 to 1 | 1.4 to 1 | 0.5 to 1 |
| NET POSITION TREND: | | | |
| – Strength Index Score (3 Year Range Pct): | 39.0 | 66.8 | 13.3 |
| – Strength Index Reading (3 Year Range): | Bearish | Bullish | Bearish-Extreme |
| NET POSITION MOVEMENT INDEX: | | | |
| – 6-Week Change in Strength Index: | -40.2 | 45.2 | -56.0 |
Mexican Peso Futures:
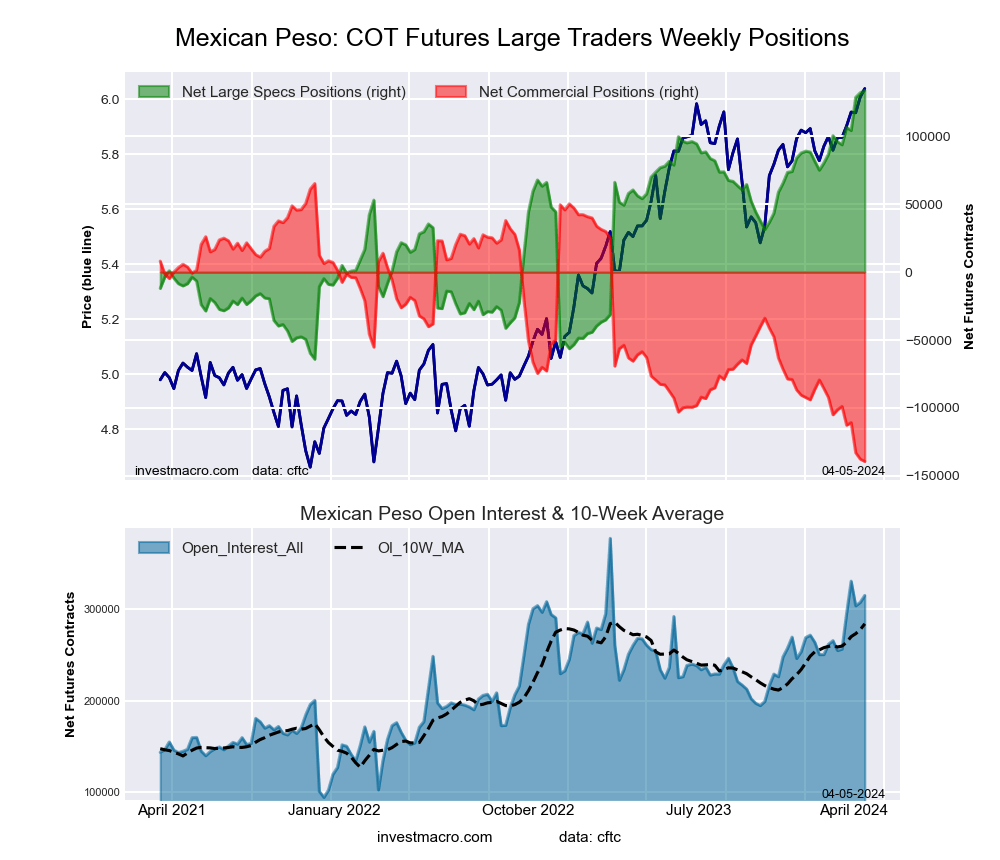 The Mexican Peso large speculator standing this week resulted in a net position of 133,730 contracts in the data reported through Tuesday. This was a weekly rise of 1,662 contracts from the previous week which had a total of 132,068 net contracts.
This week’s current strength score (the trader positioning range over the past three years, measured from 0 to 100) shows the speculators are currently Bullish-Extreme with a score of 100.0 percent. The commercials are Bearish-Extreme with a score of 0.0 percent and the small traders (not shown in chart) are Bearish with a score of 47.6 percent.
Price Trend-Following Model: Strong Uptrend
Our weekly trend-following model classifies the current market price position as: Strong Uptrend. The current action for the model is considered to be: Hold – Maintain Long Position.
| MEXICAN PESO Statistics | SPECULATORS | COMMERCIALS | SMALL TRADERS |
| – Percent of Open Interest Longs: | 60.9 | 36.1 | 2.7 |
| – Percent of Open Interest Shorts: | 18.4 | 80.4 | 0.9 |
| – Net Position: | 133,730 | -139,435 | 5,705 |
| – Gross Longs: | 191,685 | 113,502 | 8,643 |
| – Gross Shorts: | 57,955 | 252,937 | 2,938 |
| – Long to Short Ratio: | 3.3 to 1 | 0.4 to 1 | 2.9 to 1 |
| NET POSITION TREND: | | | |
| – Strength Index Score (3 Year Range Pct): | 100.0 | 0.0 | 47.6 |
| – Strength Index Reading (3 Year Range): | Bullish-Extreme | Bearish-Extreme | Bearish |
| NET POSITION MOVEMENT INDEX: | | | |
| – 6-Week Change in Strength Index: | 19.1 | -18.6 | 2.4 |
Brazilian Real Futures:
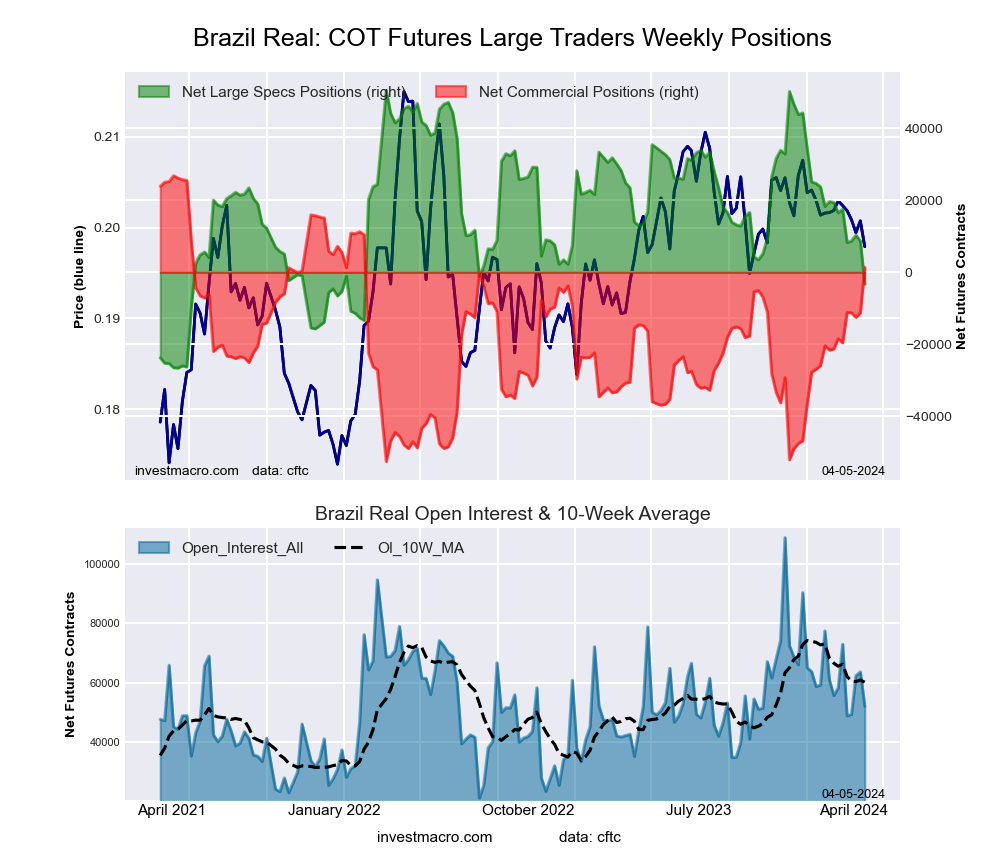 The Brazilian Real large speculator standing this week resulted in a net position of -3,261 contracts in the data reported through Tuesday. This was a weekly lowering of -11,948 contracts from the previous week which had a total of 8,687 net contracts.
This week’s current strength score (the trader positioning range over the past three years, measured from 0 to 100) shows the speculators are currently Bearish with a score of 30.3 percent. The commercials are Bullish with a score of 68.5 percent and the small traders (not shown in chart) are Bullish with a score of 52.2 percent.
Price Trend-Following Model: Strong Downtrend
Our weekly trend-following model classifies the current market price position as: Strong Downtrend. The current action for the model is considered to be: Hold – Maintain Short Position.
| BRAZIL REAL Statistics | SPECULATORS | COMMERCIALS | SMALL TRADERS |
| – Percent of Open Interest Longs: | 58.2 | 34.8 | 6.6 |
| – Percent of Open Interest Shorts: | 64.5 | 32.2 | 2.9 |
| – Net Position: | -3,261 | 1,359 | 1,902 |
| – Gross Longs: | 30,318 | 18,139 | 3,413 |
| – Gross Shorts: | 33,579 | 16,780 | 1,511 |
| – Long to Short Ratio: | 0.9 to 1 | 1.1 to 1 | 2.3 to 1 |
| NET POSITION TREND: | | | |
| – Strength Index Score (3 Year Range Pct): | 30.3 | 68.5 | 52.2 |
| – Strength Index Reading (3 Year Range): | Bearish | Bullish | Bullish |
| NET POSITION MOVEMENT INDEX: | | | |
| – 6-Week Change in Strength Index: | -25.7 | 25.2 | -0.3 |
Bitcoin Futures:
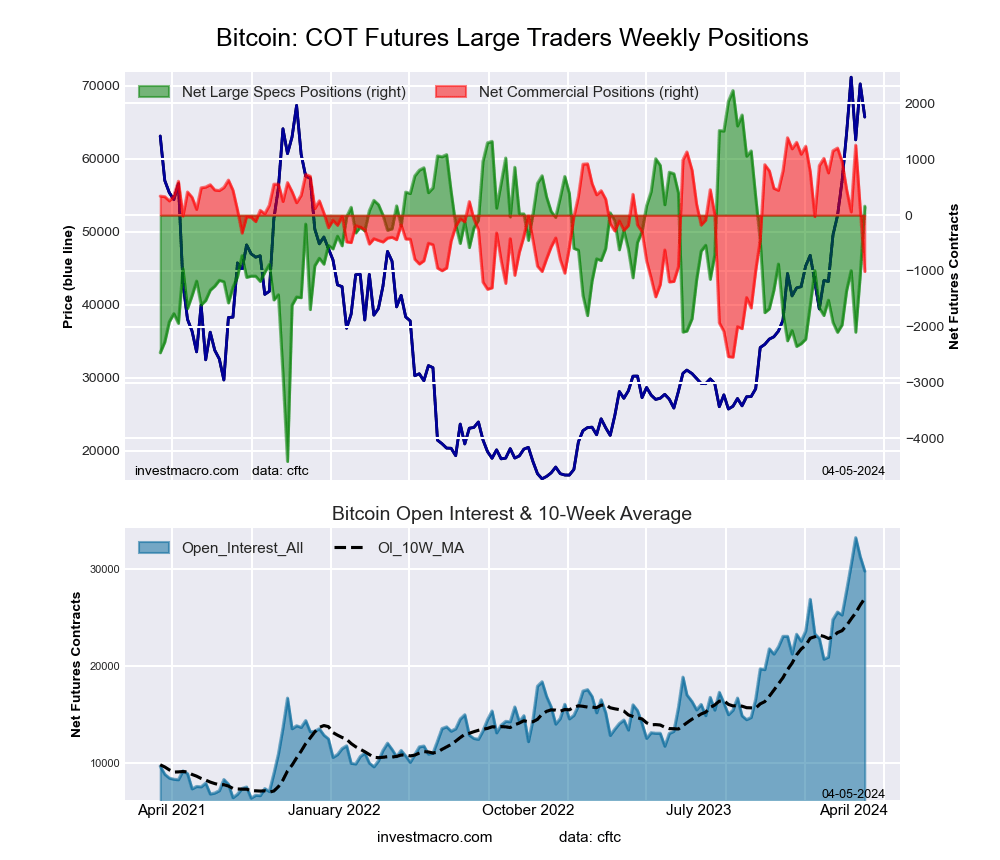 The Bitcoin large speculator standing this week resulted in a net position of 160 contracts in the data reported through Tuesday. This was a weekly advance of 1,235 contracts from the previous week which had a total of -1,075 net contracts.
This week’s current strength score (the trader positioning range over the past three years, measured from 0 to 100) shows the speculators are currently Bullish with a score of 68.8 percent. The commercials are Bearish with a score of 39.1 percent and the small traders (not shown in chart) are Bearish with a score of 32.2 percent.
Price Trend-Following Model: Strong Uptrend
Our weekly trend-following model classifies the current market price position as: Strong Uptrend. The current action for the model is considered to be: Hold – Maintain Long Position.
| BITCOIN Statistics | SPECULATORS | COMMERCIALS | SMALL TRADERS |
| – Percent of Open Interest Longs: | 81.7 | 5.1 | 5.4 |
| – Percent of Open Interest Shorts: | 81.2 | 8.5 | 2.6 |
| – Net Position: | 160 | -1,008 | 848 |
| – Gross Longs: | 24,311 | 1,513 | 1,619 |
| – Gross Shorts: | 24,151 | 2,521 | 771 |
| – Long to Short Ratio: | 1.0 to 1 | 0.6 to 1 | 2.1 to 1 |
| NET POSITION TREND: | | | |
| – Strength Index Score (3 Year Range Pct): | 68.8 | 39.1 | 32.2 |
| – Strength Index Reading (3 Year Range): | Bullish | Bearish | Bearish |
| NET POSITION MOVEMENT INDEX: | | | |
| – 6-Week Change in Strength Index: | 34.0 | -56.2 | -1.1 |
Article By InvestMacro – Receive our weekly COT Newsletter
*COT Report: The COT data, released weekly to the public each Friday, is updated through the most recent Tuesday (data is 3 days old) and shows a quick view of how large speculators or non-commercials (for-profit traders) were positioned in the futures markets.
The CFTC categorizes trader positions according to commercial hedgers (traders who use futures contracts for hedging as part of the business), non-commercials (large traders who speculate to realize trading profits) and nonreportable traders (usually small traders/speculators) as well as their open interest (contracts open in the market at time of reporting). See CFTC criteria here.


