With stocks charging to record highs this week, and with the personal consumption expenditures showing a big drop-off in spending (-0.4% vs. +0.3% est.), the need for hedging one’s bets with a new allocation of gold or gold miners has disappeared. At the least, that was what the CNBC spin doctors were using as the “new narrative” for gold.
The gold miners, as represented by the HUI, are now off 8.1% from the high registered on June 5, but judging from some of the comments from the Twitterverse and YouTube podcasts, one might presume that gold had crashed.
The reality for old goats like me is that gold has been tracing out a top since the moment U.S. President Donald Trump did that “TACO” move (“Trump Aways Chickens Out”) and decided to pause the tariffs that threatened to derail the U.S. dollar’s reserve currency status while imploding the global bond markets. Fearing an inflationary surge brought on by tariffs, investors the world over spent March and most of April piling into gold in order to protect portfolios from a fate worse than an evening with Mark Carney.
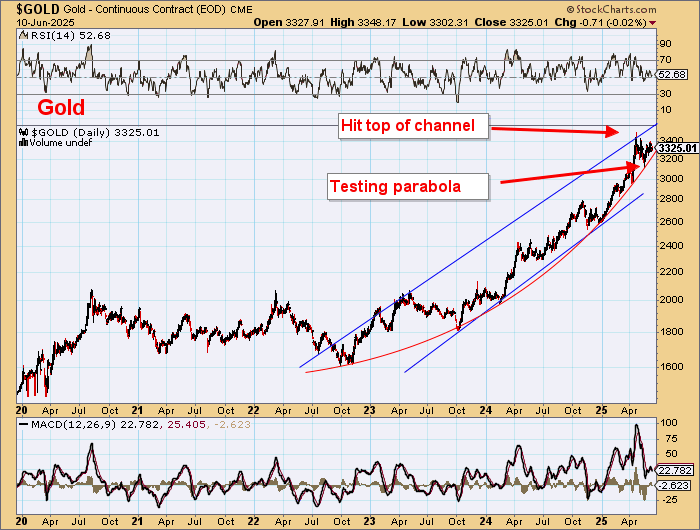
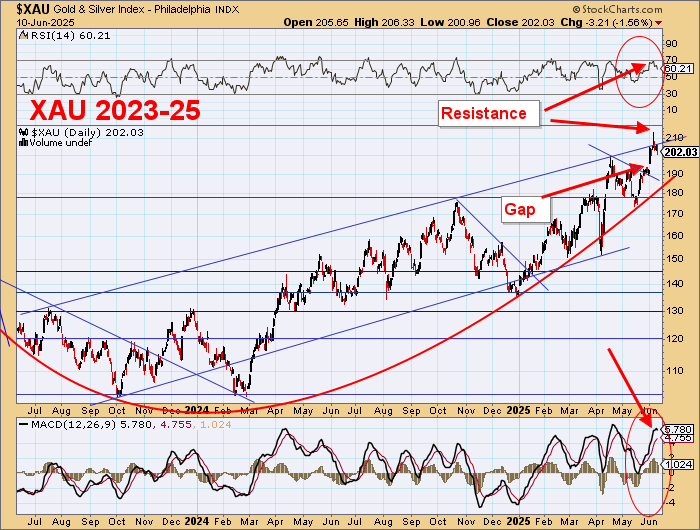
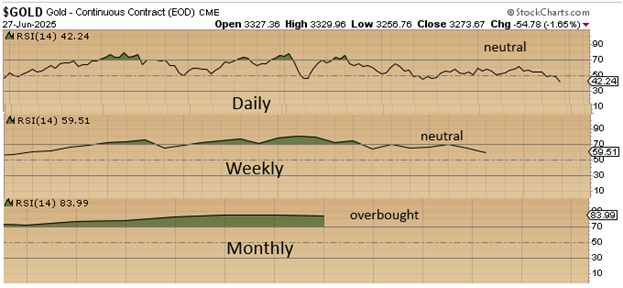
During that period, the relative strength indices for gold from three different time lines — daily, weekly, and monthly — all moved into overbought territory simultaneously, creating one of the most stretched ticker tapes in the past decade.
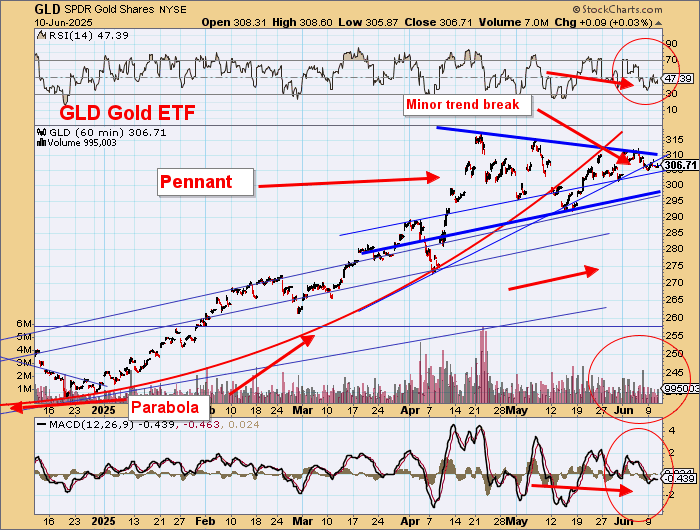
As one can see from the graphic pinned below, the RSI for daily and weekly readings is now back to neutral for the weekly, while the daily RSI is actually approaching oversold status. Unfortunately, the monthly RSI is still well-ensconced in the overbought domain, which caps the upside potential but does not necessarily imply that we have entered a prolonged bear market. What it does imply is that the gold market is markedly less prone to a sudden downside shock, which a move below $3,000 would certainly create.
Make no mistake; I was lulled into a false sense of security a few weeks ago when the Israelis decided to take out the Irani nuclear sites coercing me to take a shot at some GLD:US calls which promptly reversed forcing me to the sidelines with a 25% haircut and an ample mouthful of crow-filled embarrassment.
However, I came to my senses and reverted back to my bearish stance, which I had been carrying until the Israelis sent me into panic mode. As I said to subscribers this week, “If the recent skirmish between Israel and Iran and then the American bombing of Iranian nuclear facilities failed to light a fuse under gold and silver, then I have to expect that the next move is DOWN. . .”
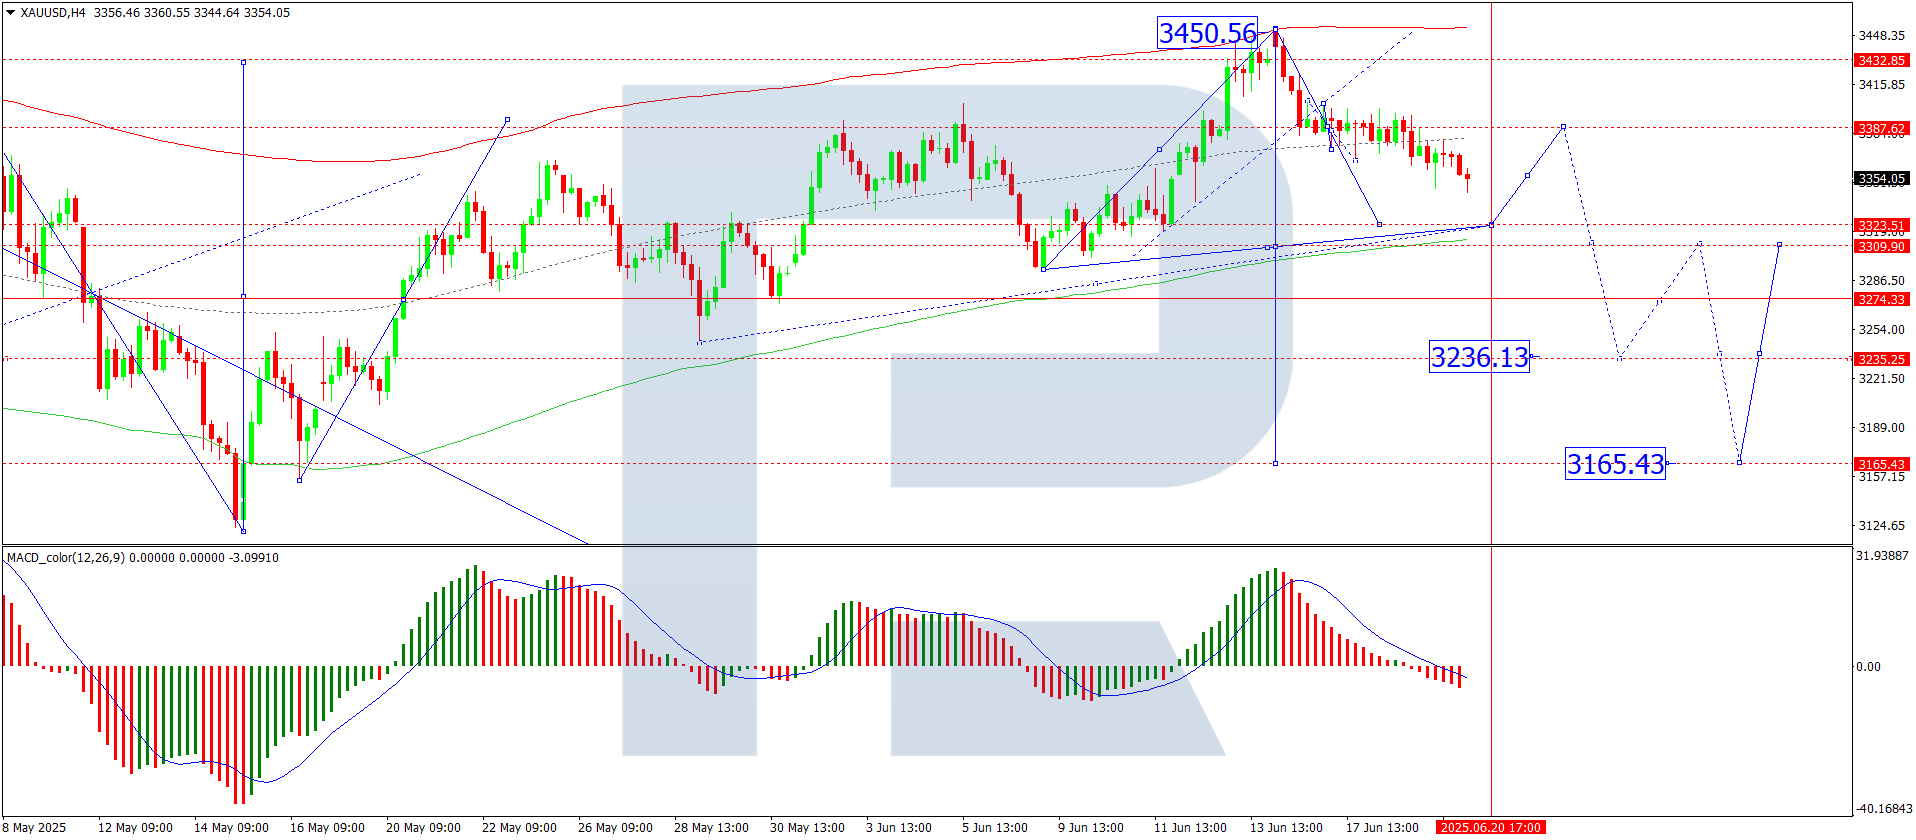
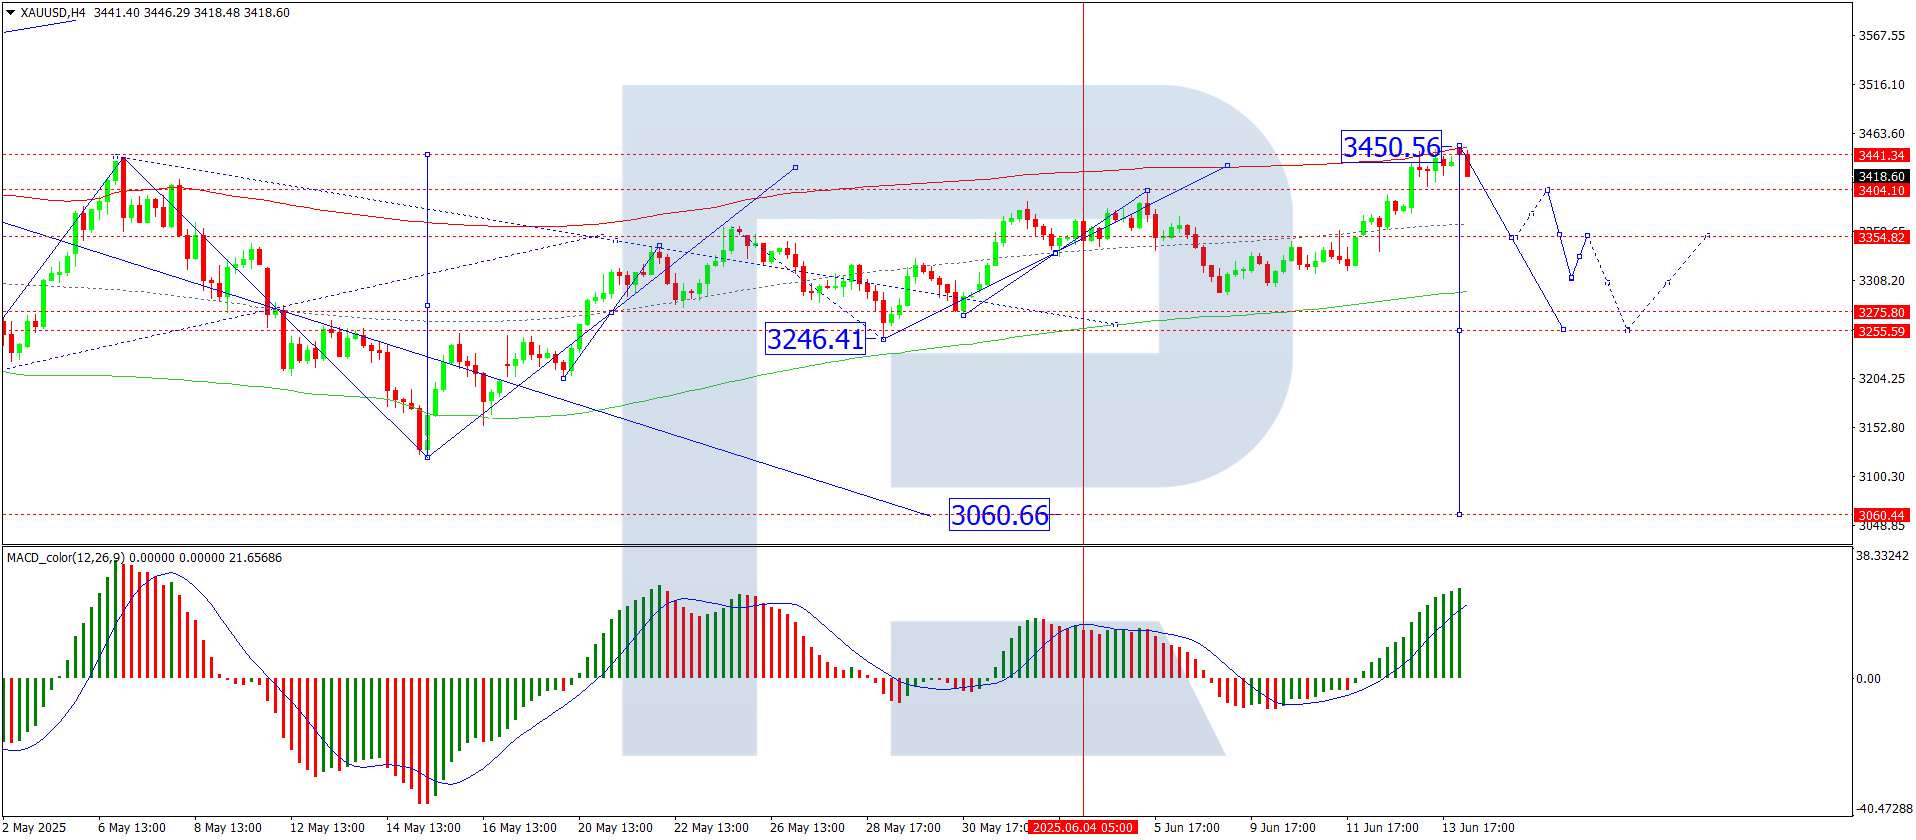
The high of two weeks ago on the Sunday night session after the Americans sent a number of “bunker busters” into the Iranian mountains was a fleeting moment, as the market is down $180/ounce since then. From an macroeconomic viewpoint, the U.S. appears to be slowing and with that the Q1 narrative of resurging inflation and escalating debt problems being replaced with the Q2 narrative of labor market stability and corporate earnings resiliency followed by the expected Q3 narrative of accelerating growth fueled by lower interest rates and relaxed regulatory environment under the Trump administration.
I strongly resist the expected Q3 narrative because it reeks of the “this time is different” theme that is consistent with every other top since 1980. It is never “different this time” as greed is always followed by fear brought on by the market’s corrective behavior. The momentum-chasing behavior of those that were selling the U.S. to buy Europe and Japan was mirrored by the “sell treasuries and buy gold and silver” strategy that was a reaction to the Trump tariffs but once Trump observed how his actions led by his tweets and verbal impetuousness began to crater the U.S. bond market and the currency, the ensuing about-face marked the top in gold and the bottom in stocks. That event is “transitory” (to coin a phrase), and I believe that fiscal and foreign policy will find itself headlocked by the funding needs of the U.S. Treasury.
Trump will need to go “hat-in-hand” to the international community in order to facilitate the rollover of some $9 trillion in treasury bills that will be coming due in 2025 alone. Just as the bond market forced him to abandon his “America First” agenda, his softened approach has the stock junkies all clamoring behind his pro-growth shift and fleeing the safety of the gold and silver markets which is going to come to an abrupt end very shortly.
Near term, I expect a knee-jerk “flush” of the precious metals in the next two weeks that might take gold back under $3k and silver back under $30 just to scare the living feces out of all the late-comers that piled onto the gold trade in March-April. That, as always, will set up the perfect storm for a lasting bottom in gold that will hopefully be led by silver and the intermediate and junior developers.
After making a little money on the gold hedges in May and losing a little on the long side in early June, I am flat all leveraged gold trades, looking to establish a sizable long position in January calls between now and the middle of July. Stay tuned. The biggest phase of the golden bull is ahead of us, and with the good graces of Lady Luck and U.S. dollar weakness, silver will lead, and the junior explorers and developers will soar.
COT Report
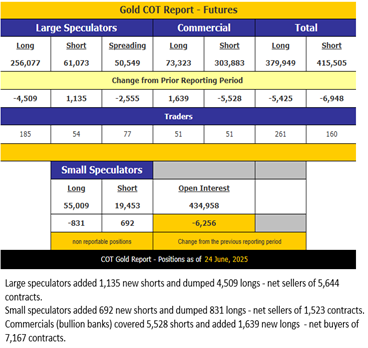
The bullion banks took advantage of the downside action for the week ended Tuesday, June 24, by covering a few of their moderately large net short position.
At 230,560 net shorts, they have reduced exposure markedly from the 325,000 level last seen in May. It is not so much the actual number but more the trend of their activity that I watch. In fact, they are almost always short the gold futures market, and the only time I ever saw them post a net long position was in early December of 2015 at the absolute bottom of the 2011-2015 bear market, around $1,045 per ounce.
I see a Commercial net short position under 200,000 contracts by mid-July, which is bullish.
Stocks
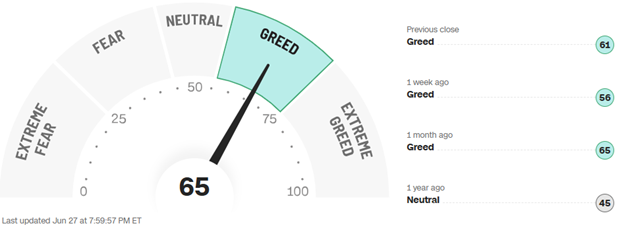
The CNN Fear-Greed Index is sitting at a moderately bearish 65, which places it in the position of <GREED> but nowhere near the extremes of last February when it was solidly in the 85-90 level and in the position of <EXTREME GREED>. Sentiment is not yet in the “LaLaLand” phase as measured by this indicator, but based upon the volume of call buying, which took out records this week, the retail investor is maniacally consumed by the current market action.
The grey-haired professional money gang are waving their fingers and muttering “Tsk-Tsk,” pointing to Warren Buffett’s $300 billion cash position as justification for being “underinvested” in this rally, which is the strongest and most violent equity market rebound in the history of global stock exchanges. In other words, the kiddies that are normally the “suckers at the poker table” are now raking in their obscene profits leaving the older more conservative crowd in their dust.
I am modestly hedged via volatility positions and one “bleeding-from-the-eye-sockets” short via the inverse QQQ ETF (SQQ:US), which I have stubbornly refused to jettison, but only because I had a similar problem last July when I was seriously submerged on a position in the UVIX:US before the early-August “Japan carry-trade” crash rescued me, taking a 30% loss to a 405 win in under two weeks. That is what I expect to transpire in the latter part of July and lasting right through to mid-October, so the $90 million question is “When do I add?” to both volatility and to the SQQQ:US in order to capture the next correction.
Stay tuned.
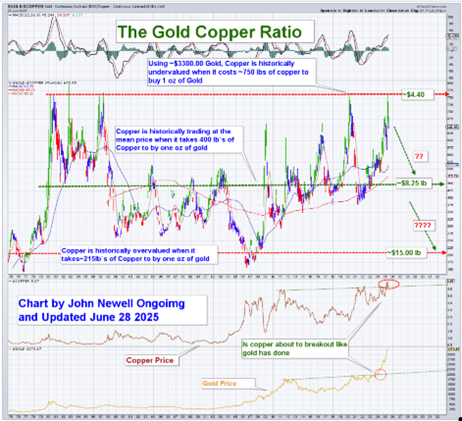
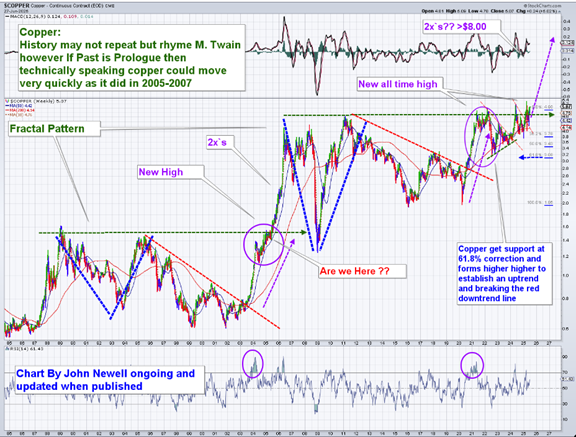
Copper
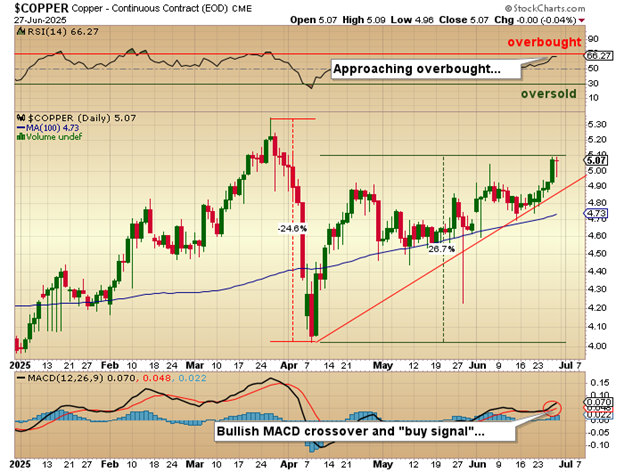
After the absurdity of the one-week crash that ended on April 7, with the “Liberation Day” lows in stocks, gold, copper, and nearly everything else that lives and breathes off the Trump tweets, copper has been on a tear to the upside, closing above $5.00/lb, for the first time since late March.
This week, the red metal reclaimed that level on the heels of a report out of the LME that has copper inventories at their lowest level in decades, with a similar condition affecting the Shanghai futures exchange. Also suffering is the mighty COMEX, where everything copper-related is being hoarded as the looming shortages appear not only on the horizon but just ahead of the grill of one’s car.
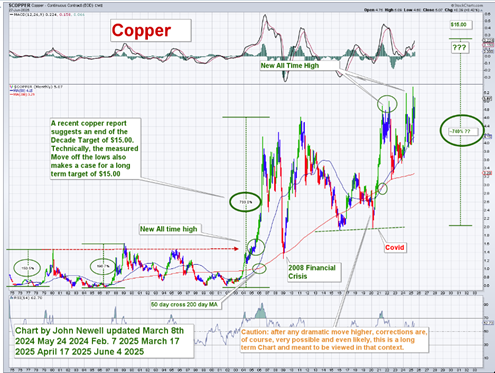
The world will soon realize that leftist and “woke” policies prohibiting the exploitation of the planet’s mineral wealth ultimately rise up to “bite you in the butt” making the construction of new copper mines prohibitively expensive with prices under US$15,000 m/t (US$6.80/lb.). Those near-sighted policies of the past decade or so have resulted in no new mine supply coming on stream so when combined with the depletion from exhausted, mined-out sources in Chile and Peru and Canada, there is a looming and very real shortage about to materialize that is going to send prices spiraling northward for the balance of the decade.
The folks over at Crux Investor have published a superb article on copper entitled: “How Copper Supply Deficits Are Reshaping the Critical Minerals Landscape,” and I urge all readers to take some time to study it at this link.
I see new highs on the immediate horizon for copper and a robust second half of 2025 for the copper developers, with particular attention to those with new discoveries. Of note this week was the $12 million LIFE financing announced by one of my absolute favorites, Fitzroy Minerals Inc. (FTZ:TSX.V; FTZFF:OTCQB) that has won the affections of a number of the institutional investors including a US$1.8 billion Asian mining fund whose lead order of $5 million was a huge testimonial to the quality of both management and their two exciting projects in Chile, Caballos and Buen Retiro. The deal is expected to close next week, oversubscribed and trading at a premium to the issue price on excellent volume.