­

Archive for Metals – Page 18

COT Metals Charts: Weekly Speculator Changes led by Gold & Silver

By InvestMacro

Here are the latest charts and statistics for the Commitment of Traders (COT) data published by the Commodities Futures Trading Commission (CFTC).

The latest COT data is updated through Tuesday July 11th and shows a quick view of how large traders (for-profit speculators and commercial entities) were positioned in the futures markets.

Weekly Speculator Changes led by Gold & Silver

The COT metals markets speculator bets were lower this week as two out of the six metals markets we cover had higher positioning while the other four markets had lower speculator contracts.

Leading the gains for the metals was Gold (2,657 contracts) with Silver (2,302 contracts) also showing a positive week.

The markets with declines in speculator bets for the week were Palladium (-382 contracts), Platinum (-280 contracts), Copper (-2,395 contracts) and Steel (-71 contracts) also registering lower bets on the week.


Data Snapshot of Commodity Market Traders | Columns Legend
Jul-11-2023
OI
OI-Index
Spec-Net
Spec-Index
Com-Net
COM-Index
Smalls-Net
Smalls-Index
Gold483,17028165,75450-187,7495121,99535
Copper197,78541-11,157217,915783,24239
Silver120,282620,29247-31,6495611,35729
Platinum71,007727,78734-13,912656,12550
Palladium15,772100-8,27208,765100-49312


Strength Scores led by Steel & Gold

COT Strength Scores (a normalized measure of Speculator positions over a 3-Year range, from 0 to 100 where above 80 is Extreme-Bullish and below 20 is Extreme-Bearish) showed that Steel (73 percent) and Gold (50 percent) lead the metals markets this week. Palladium (0 percent) comes in as the next highest in the weekly strength scores.

On the downside, Copper (21 percent) comes in at the lowest strength level currently and is in Extreme-Bearish territory (below 20 percent). The next lowest strength score was Platinum (34 percent).

Strength Statistics:
Gold (50.0 percent) vs Gold previous week (48.9 percent)
Silver (47.2 percent) vs Silver previous week (43.9 percent)
Copper (21.2 percent) vs Copper previous week (23.3 percent)
Platinum (33.6 percent) vs Platinum previous week (34.2 percent)
Palladium (0.0 percent) vs Palladium previous week (3.2 percent)
Steel (72.6 percent) vs Palladium previous week (72.8 percent)

Copper & Steel top the 6-Week Strength Trends

COT Strength Score Trends (or move index, calculates the 6-week changes in strength scores) showed that Copper (21 percent) and Steel (15 percent) lead the past six weeks trends for metals. Palladium (-18 percent) is the next highest positive mover in the latest trends data.

Gold (-2 percent) leads the downside trend scores currently with Platinum (-36 percent) as the next market with lower trend scores.

Move Statistics:
Gold (-1.6 percent) vs Gold previous week (1.0 percent)
Silver (-1.2 percent) vs Silver previous week (-5.7 percent)
Copper (21.2 percent) vs Copper previous week (18.2 percent)
Platinum (-36.0 percent) vs Platinum previous week (-44.8 percent)
Palladium (-18.5 percent) vs Palladium previous week (-21.7 percent)
Steel (14.8 percent) vs Steel previous week (15.0 percent)


Individual Markets:

Gold Comex Futures:

Gold Futures COT ChartThe Gold Comex Futures large speculator standing this week was a net position of 165,754 contracts in the data reported through Tuesday. This was a weekly lift of 2,657 contracts from the previous week which had a total of 163,097 net contracts.

This week’s current strength score (the trader positioning range over the past three years, measured from 0 to 100) shows the speculators are currently Bullish with a score of 50.0 percent. The commercials are Bullish with a score of 51.5 percent and the small traders (not shown in chart) are Bearish with a score of 35.1 percent.

Price Trend-Following Model: Uptrend

Our weekly trend-following model classifies the current market price position as: Uptrend. The current action for the model is considered to be: Hold – Maintain Long Position.

Gold Futures StatisticsSPECULATORSCOMMERCIALSSMALL TRADERS
– Percent of Open Interest Longs:49.823.89.6
– Percent of Open Interest Shorts:15.562.65.1
– Net Position:165,754-187,74921,995
– Gross Longs:240,546114,79046,618
– Gross Shorts:74,792302,53924,623
– Long to Short Ratio:3.2 to 10.4 to 11.9 to 1
NET POSITION TREND:
– Strength Index Score (3 Year Range Pct):50.051.535.1
– Strength Index Reading (3 Year Range):BullishBullishBearish
NET POSITION MOVEMENT INDEX:
– 6-Week Change in Strength Index:-1.60.93.3


Silver Comex Futures:

Silver Futures COT ChartThe Silver Comex Futures large speculator standing this week was a net position of 20,292 contracts in the data reported through Tuesday. This was a weekly lift of 2,302 contracts from the previous week which had a total of 17,990 net contracts.

This week’s current strength score (the trader positioning range over the past three years, measured from 0 to 100) shows the speculators are currently Bearish with a score of 47.2 percent. The commercials are Bullish with a score of 55.5 percent and the small traders (not shown in chart) are Bearish with a score of 29.4 percent.

Price Trend-Following Model: Strong Uptrend

Our weekly trend-following model classifies the current market price position as: Strong Uptrend. The current action for the model is considered to be: Hold – Maintain Long Position.

Silver Futures StatisticsSPECULATORSCOMMERCIALSSMALL TRADERS
– Percent of Open Interest Longs:42.731.819.4
– Percent of Open Interest Shorts:25.858.19.9
– Net Position:20,292-31,64911,357
– Gross Longs:51,30538,23823,304
– Gross Shorts:31,01369,88711,947
– Long to Short Ratio:1.7 to 10.5 to 12.0 to 1
NET POSITION TREND:
– Strength Index Score (3 Year Range Pct):47.255.529.4
– Strength Index Reading (3 Year Range):BearishBullishBearish
NET POSITION MOVEMENT INDEX:
– 6-Week Change in Strength Index:-1.23.5-11.5


Copper Grade #1 Futures:

Copper Futures COT ChartThe Copper Grade #1 Futures large speculator standing this week was a net position of -11,157 contracts in the data reported through Tuesday. This was a weekly decrease of -2,395 contracts from the previous week which had a total of -8,762 net contracts.

This week’s current strength score (the trader positioning range over the past three years, measured from 0 to 100) shows the speculators are currently Bearish with a score of 21.2 percent. The commercials are Bullish with a score of 78.2 percent and the small traders (not shown in chart) are Bearish with a score of 38.9 percent.

Price Trend-Following Model: Downtrend

Our weekly trend-following model classifies the current market price position as: Downtrend. The current action for the model is considered to be: Hold – Maintain Short Position.

Copper Futures StatisticsSPECULATORSCOMMERCIALSSMALL TRADERS
– Percent of Open Interest Longs:30.043.78.8
– Percent of Open Interest Shorts:35.739.77.1
– Net Position:-11,1577,9153,242
– Gross Longs:59,38986,46617,338
– Gross Shorts:70,54678,55114,096
– Long to Short Ratio:0.8 to 11.1 to 11.2 to 1
NET POSITION TREND:
– Strength Index Score (3 Year Range Pct):21.278.238.9
– Strength Index Reading (3 Year Range):BearishBullishBearish
NET POSITION MOVEMENT INDEX:
– 6-Week Change in Strength Index:21.2-21.811.4


Platinum Futures:

Platinum Futures COT ChartThe Platinum Futures large speculator standing this week was a net position of 7,787 contracts in the data reported through Tuesday. This was a weekly decrease of -280 contracts from the previous week which had a total of 8,067 net contracts.

This week’s current strength score (the trader positioning range over the past three years, measured from 0 to 100) shows the speculators are currently Bearish with a score of 33.6 percent. The commercials are Bullish with a score of 64.7 percent and the small traders (not shown in chart) are Bullish with a score of 50.0 percent.

Price Trend-Following Model: Strong Downtrend

Our weekly trend-following model classifies the current market price position as: Strong Downtrend. The current action for the model is considered to be: Hold – Maintain Short Position.

Platinum Futures StatisticsSPECULATORSCOMMERCIALSSMALL TRADERS
– Percent of Open Interest Longs:54.327.213.2
– Percent of Open Interest Shorts:43.446.84.6
– Net Position:7,787-13,9126,125
– Gross Longs:38,59019,2949,369
– Gross Shorts:30,80333,2063,244
– Long to Short Ratio:1.3 to 10.6 to 12.9 to 1
NET POSITION TREND:
– Strength Index Score (3 Year Range Pct):33.664.750.0
– Strength Index Reading (3 Year Range):BearishBullishBullish
NET POSITION MOVEMENT INDEX:
– 6-Week Change in Strength Index:-36.029.120.7


Palladium Futures:

Palladium Futures COT ChartThe Palladium Futures large speculator standing this week was a net position of -8,272 contracts in the data reported through Tuesday. This was a weekly decrease of -382 contracts from the previous week which had a total of -7,890 net contracts.

This week’s current strength score (the trader positioning range over the past three years, measured from 0 to 100) shows the speculators are currently Bearish-Extreme with a score of 0.0 percent. The commercials are Bullish-Extreme with a score of 100.0 percent and the small traders (not shown in chart) are Bearish-Extreme with a score of 12.1 percent.

Price Trend-Following Model: Strong Downtrend

Our weekly trend-following model classifies the current market price position as: Strong Downtrend. The current action for the model is considered to be: Hold – Maintain Short Position.

Palladium Futures StatisticsSPECULATORSCOMMERCIALSSMALL TRADERS
– Percent of Open Interest Longs:22.762.39.6
– Percent of Open Interest Shorts:75.16.812.8
– Net Position:-8,2728,765-493
– Gross Longs:3,5759,8311,519
– Gross Shorts:11,8471,0662,012
– Long to Short Ratio:0.3 to 19.2 to 10.8 to 1
NET POSITION TREND:
– Strength Index Score (3 Year Range Pct):0.0100.012.1
– Strength Index Reading (3 Year Range):Bearish-ExtremeBullish-ExtremeBearish-Extreme
NET POSITION MOVEMENT INDEX:
– 6-Week Change in Strength Index:-18.517.4-4.3


Steel Futures Futures:

Steel Futures COT ChartThe Steel Futures large speculator standing this week was a net position of -201 contracts in the data reported through Tuesday. This was a weekly decline of -71 contracts from the previous week which had a total of -130 net contracts.

This week’s current strength score (the trader positioning range over the past three years, measured from 0 to 100) shows the speculators are currently Bullish with a score of 72.6 percent. The commercials are Bearish with a score of 27.1 percent and the small traders (not shown in chart) are Bearish with a score of 40.2 percent.

Price Trend-Following Model: Strong Downtrend

Our weekly trend-following model classifies the current market price position as: Strong Downtrend. The current action for the model is considered to be: Hold – Maintain Short Position.

Steel Futures StatisticsSPECULATORSCOMMERCIALSSMALL TRADERS
– Percent of Open Interest Longs:17.375.31.5
– Percent of Open Interest Shorts:18.275.10.8
– Net Position:-20146155
– Gross Longs:4,12417,946347
– Gross Shorts:4,32517,900192
– Long to Short Ratio:1.0 to 11.0 to 11.8 to 1
NET POSITION TREND:
– Strength Index Score (3 Year Range Pct):72.627.140.2
– Strength Index Reading (3 Year Range):BullishBearishBearish
NET POSITION MOVEMENT INDEX:
– 6-Week Change in Strength Index:14.8-15.634.8


Article By InvestMacroReceive our weekly COT Newsletter

*COT Report: The COT data, released weekly to the public each Friday, is updated through the most recent Tuesday (data is 3 days old) and shows a quick view of how large speculators or non-commercials (for-profit traders) were positioned in the futures markets.

The CFTC categorizes trader positions according to commercial hedgers (traders who use futures contracts for hedging as part of the business), non-commercials (large traders who speculate to realize trading profits) and nonreportable traders (usually small traders/speculators) as well as their open interest (contracts open in the market at time of reporting). See CFTC criteria here.

Goodbye Dollar, Hello Gold

Source: Clive Maund  (7/13/23) 

Technical Analyst Clive Maund takes a look at the jump in the price of gold and the decline of the dollar.

Gold silver and precious metal (PM) stocks staged a major breakout yesterday as the dollar cratered to signal the onset of a major devaluation as its loss of reserve currency status becomes a physical reality. The BRICS are set to introduce an alternative CBDC related gold backed currency of their own that should drive the last nail into the dollar’s coffin. This has been “in the works” for quite a while and this being so it only is surprising that it has taken the dollar this long to break down. We saw all this coming a couple of weeks ago in the article PM SECTOR update – REVERSING TO UPSIDE and the two larger gold stocks featured in the article, Royal Gold and Victoria Gold have soared.

Anyway, the point is that the PM sector – and commodities generally – are embarking on a long and powerful upleg that is still in its earliest stages and this being so you can basically put on a blindfold and throw darts at a list of PM stocks and pick winners although of course we will strive to do somewhat better than that.

Now we will proceed to look at a range of charts showing the dollar breakdown and the PM sector breakouts yesterday that I am confident will “make your day” if you are long the PM sector…

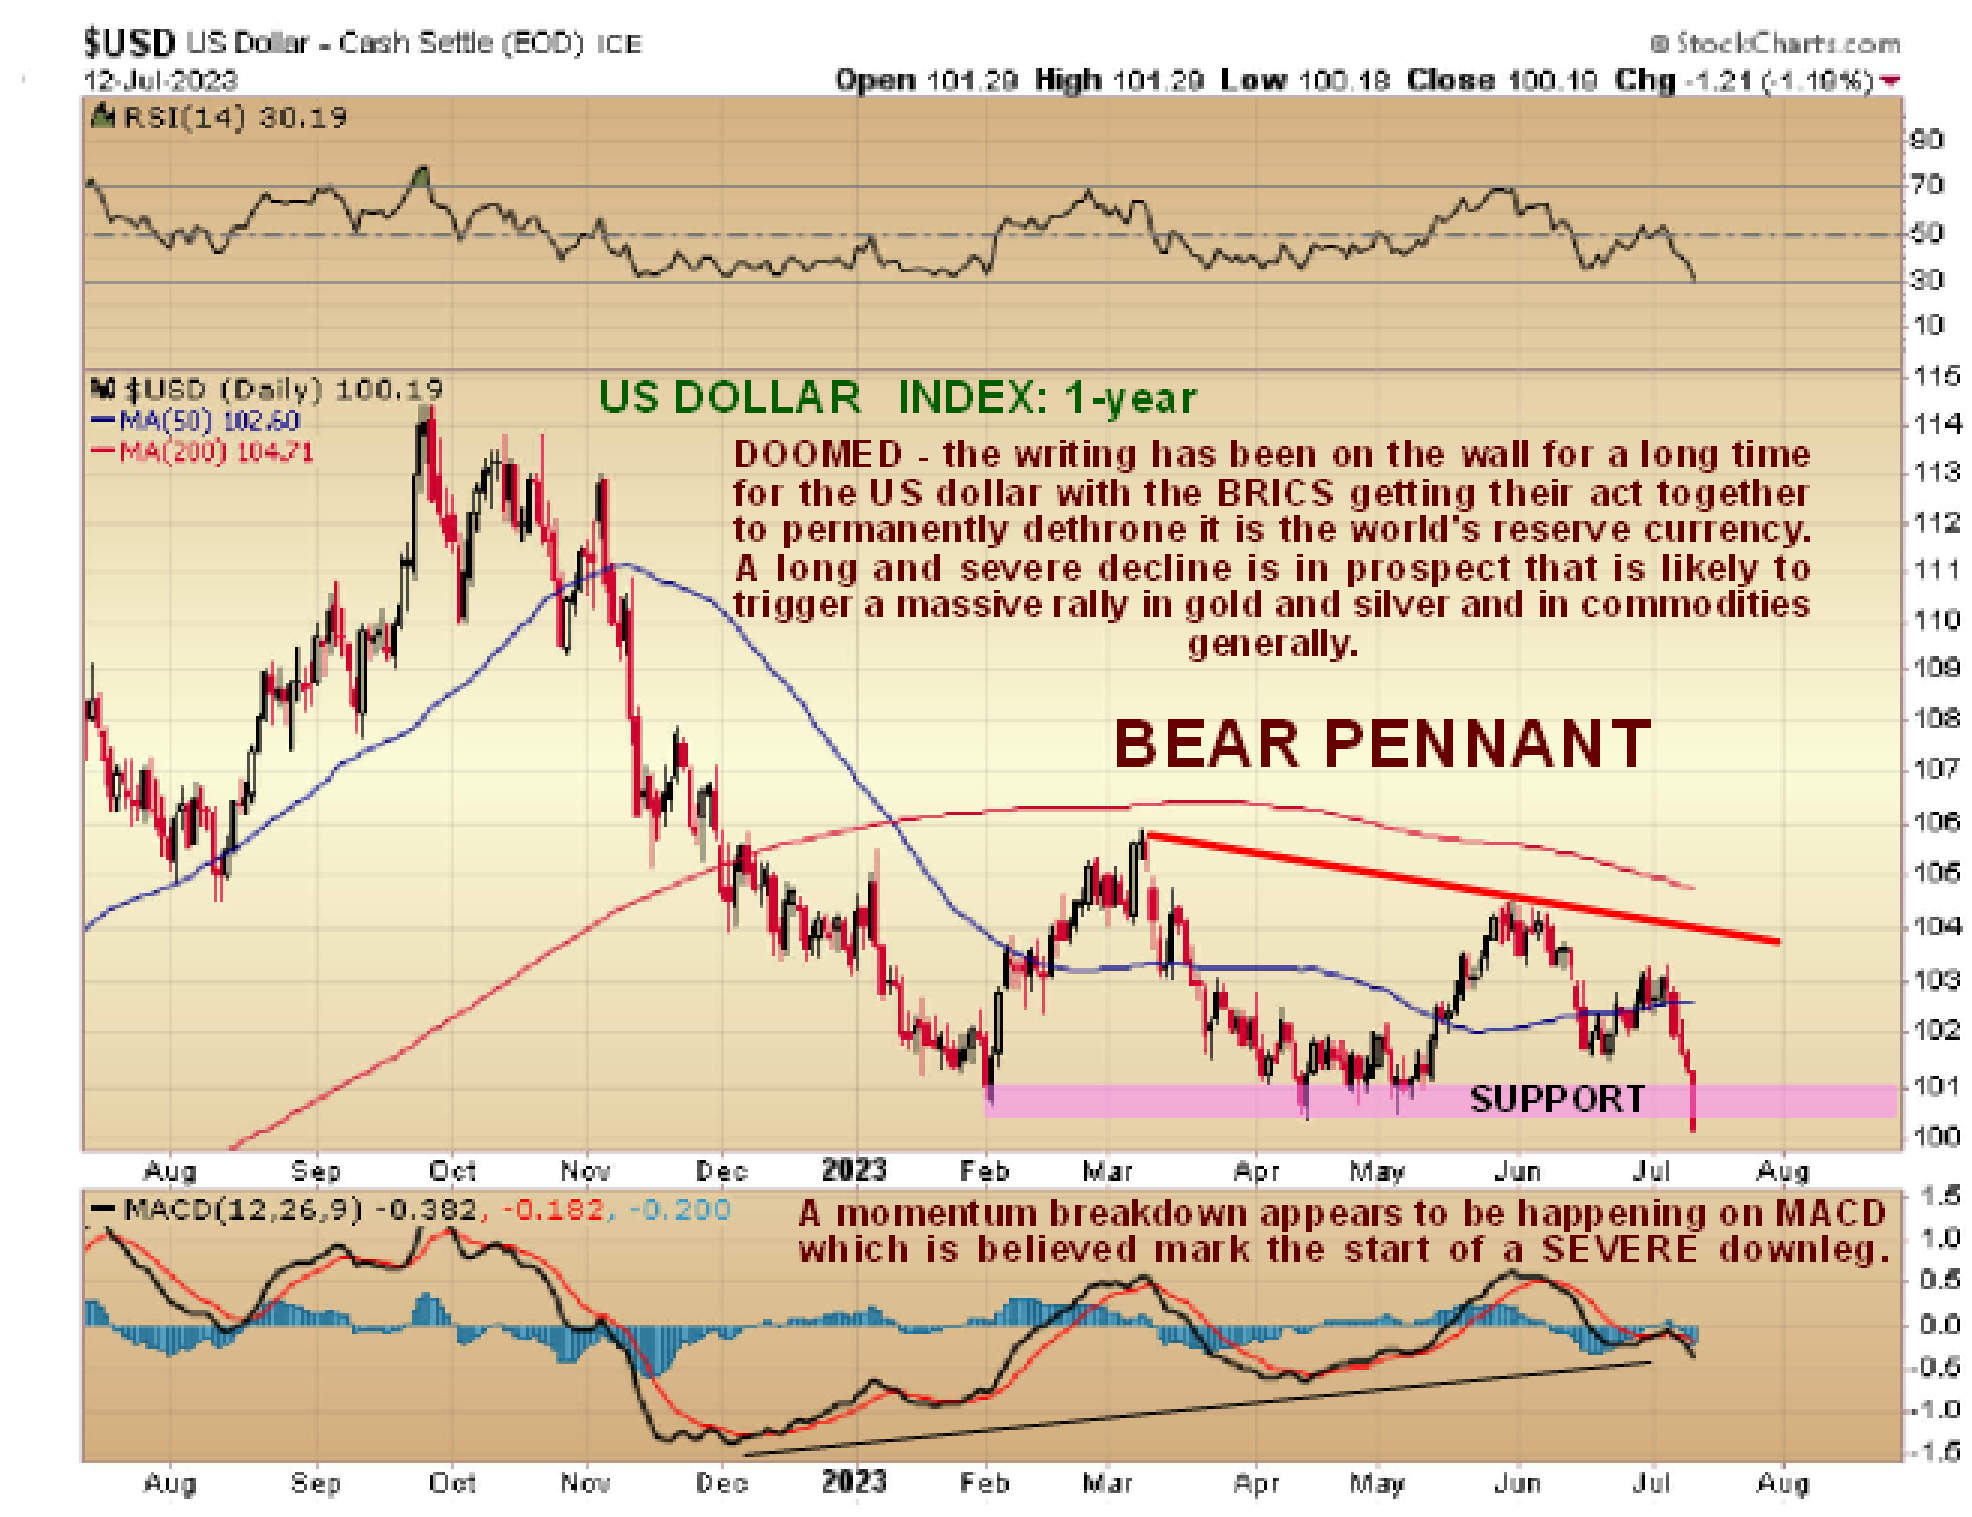
We’ll start with the dollar which is of course the cause of the PM sector breakouts yesterday. The dollar cratered yesterday with a breathtaking 1.2% drop in the dollar index which broke it down from the bear Pennant it has been stuck in since late January.…


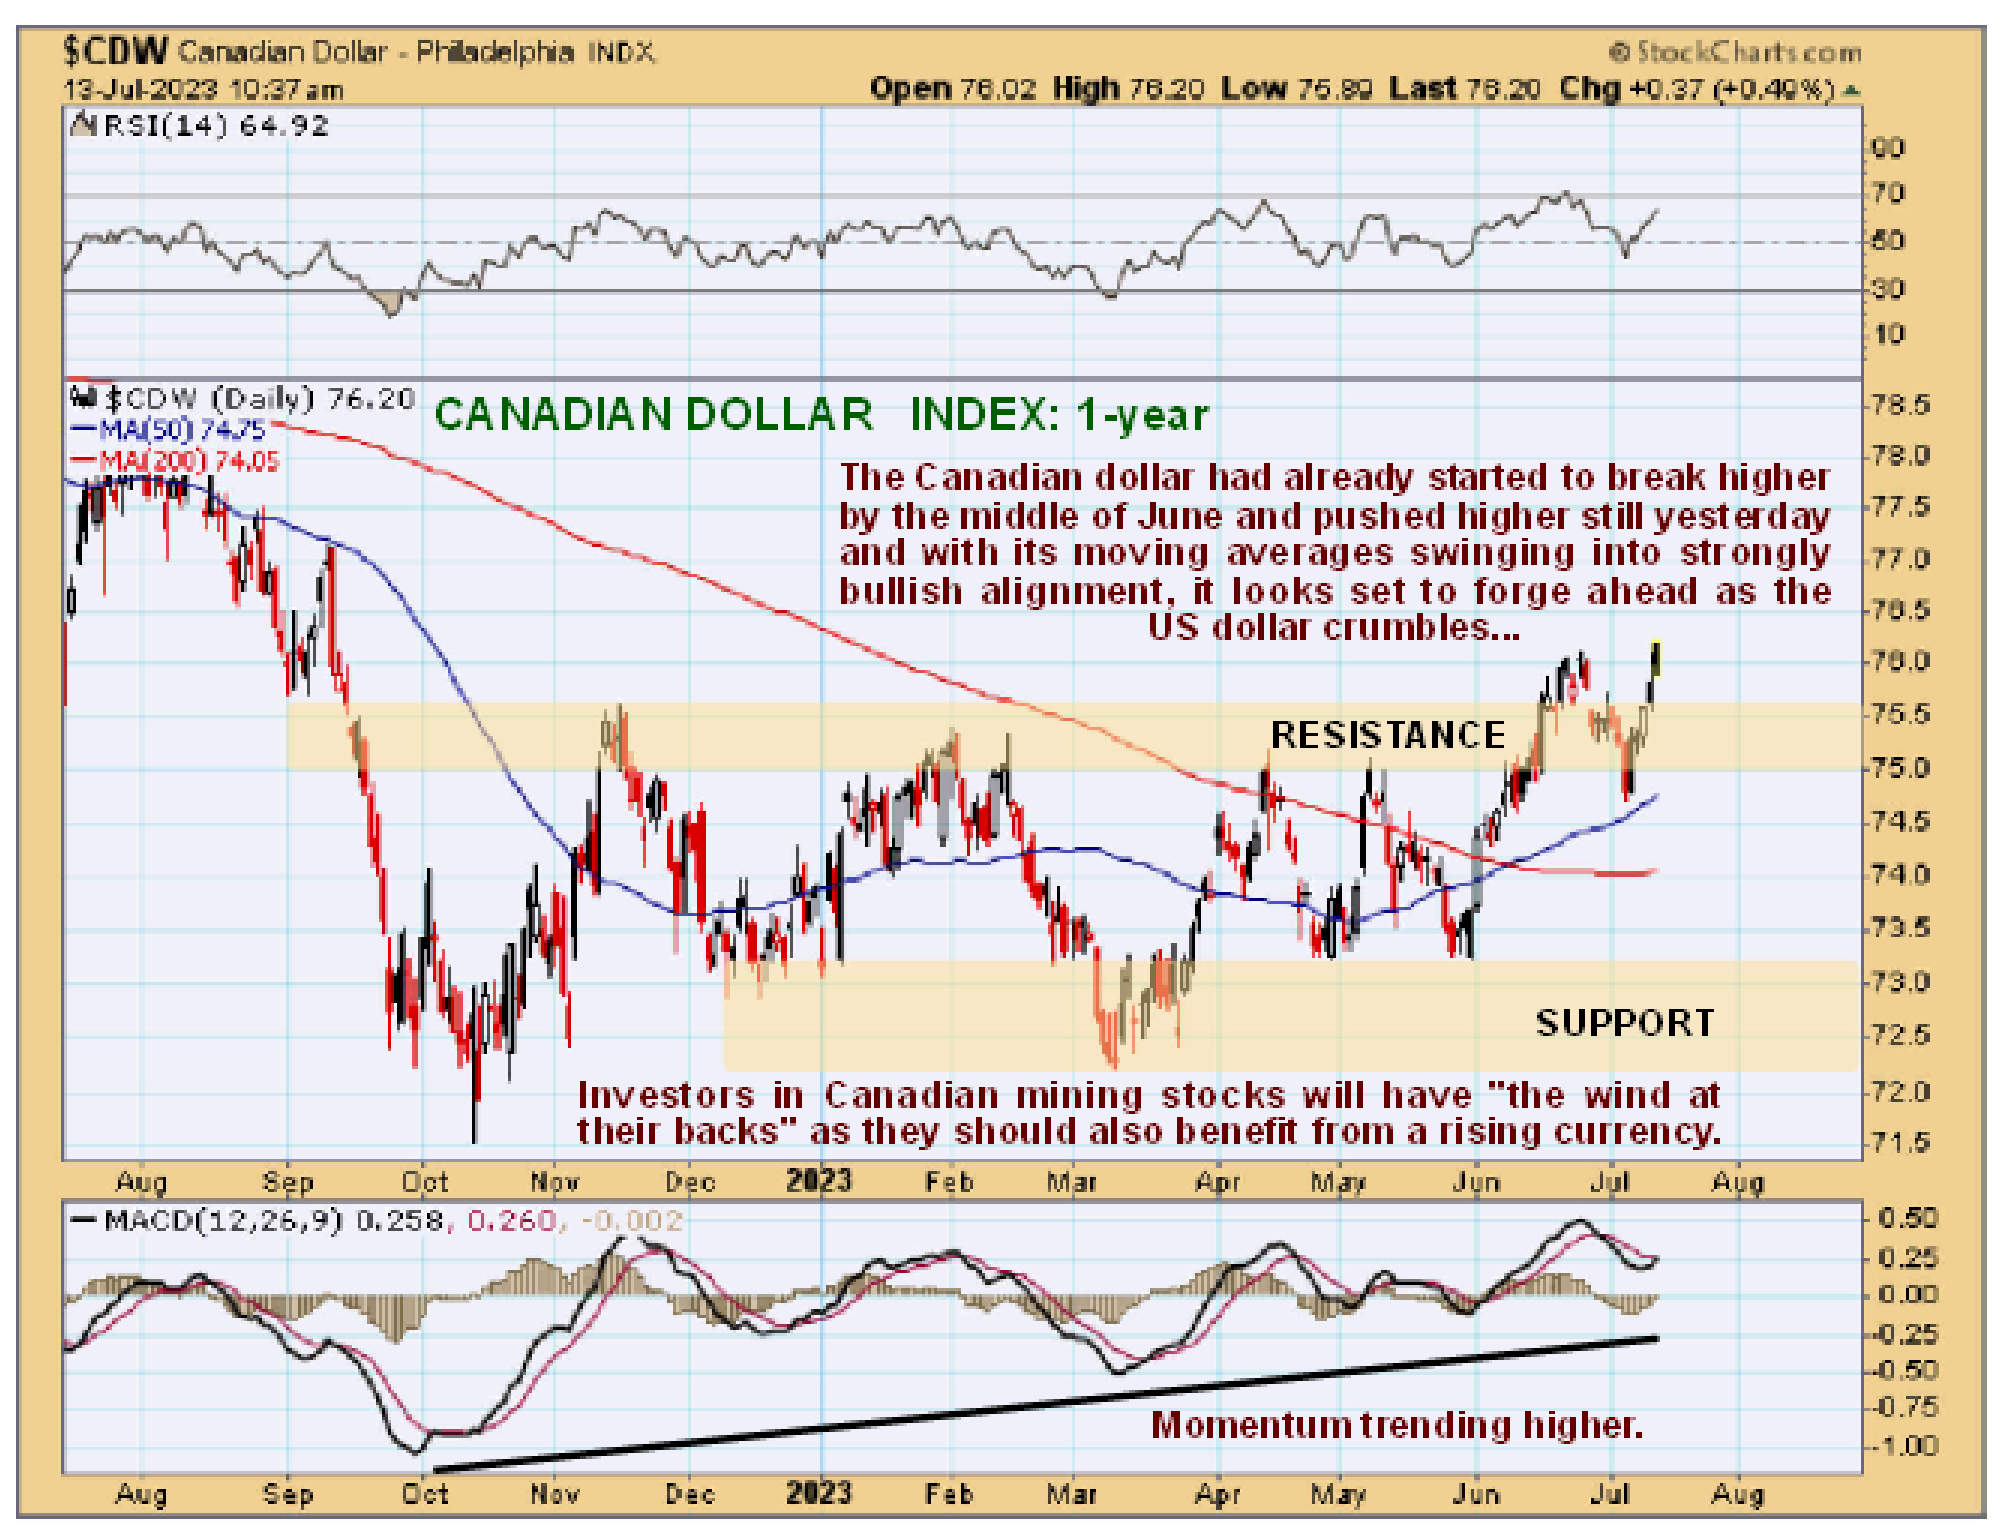
Meanwhile, the Canadian dollar, in common with many other currencies, broke higher against the US dollar yesterday, although as we can see, it had already started to break higher against the US dollar by the middle of last month. The Canadian economy is much more resource-based than the US and advancing metals prices should have a beneficial effect. Investors in Canadian mining stocks can therefore expect an additional benefit from relative currency appreciation, relative because all currencies are depreciating in real terms, if not against each other…


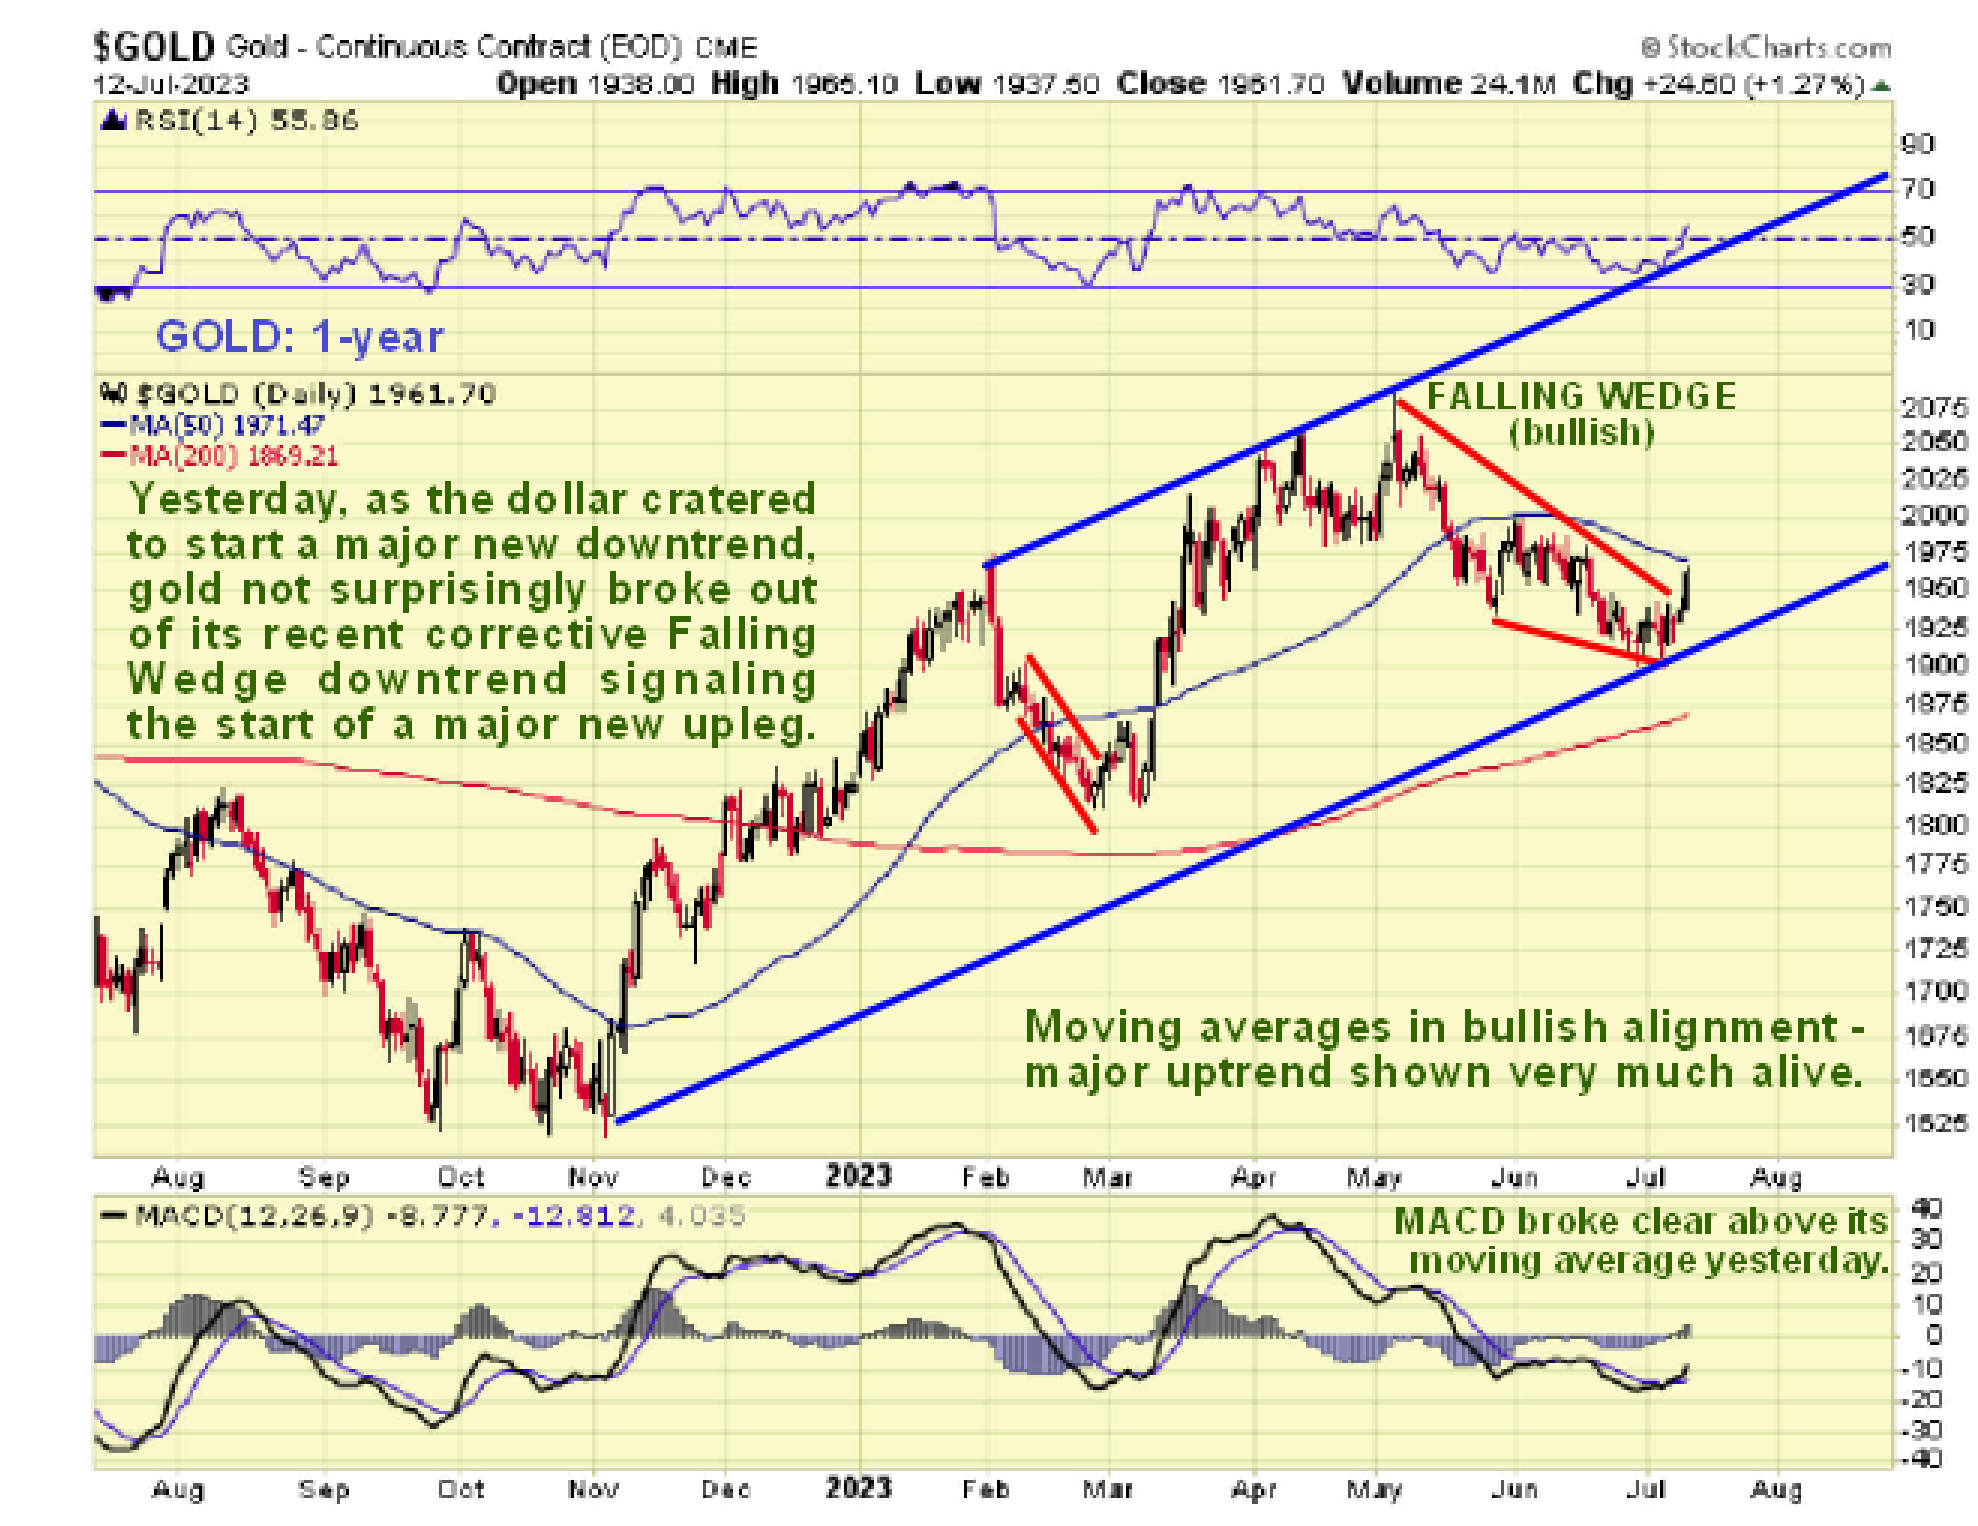
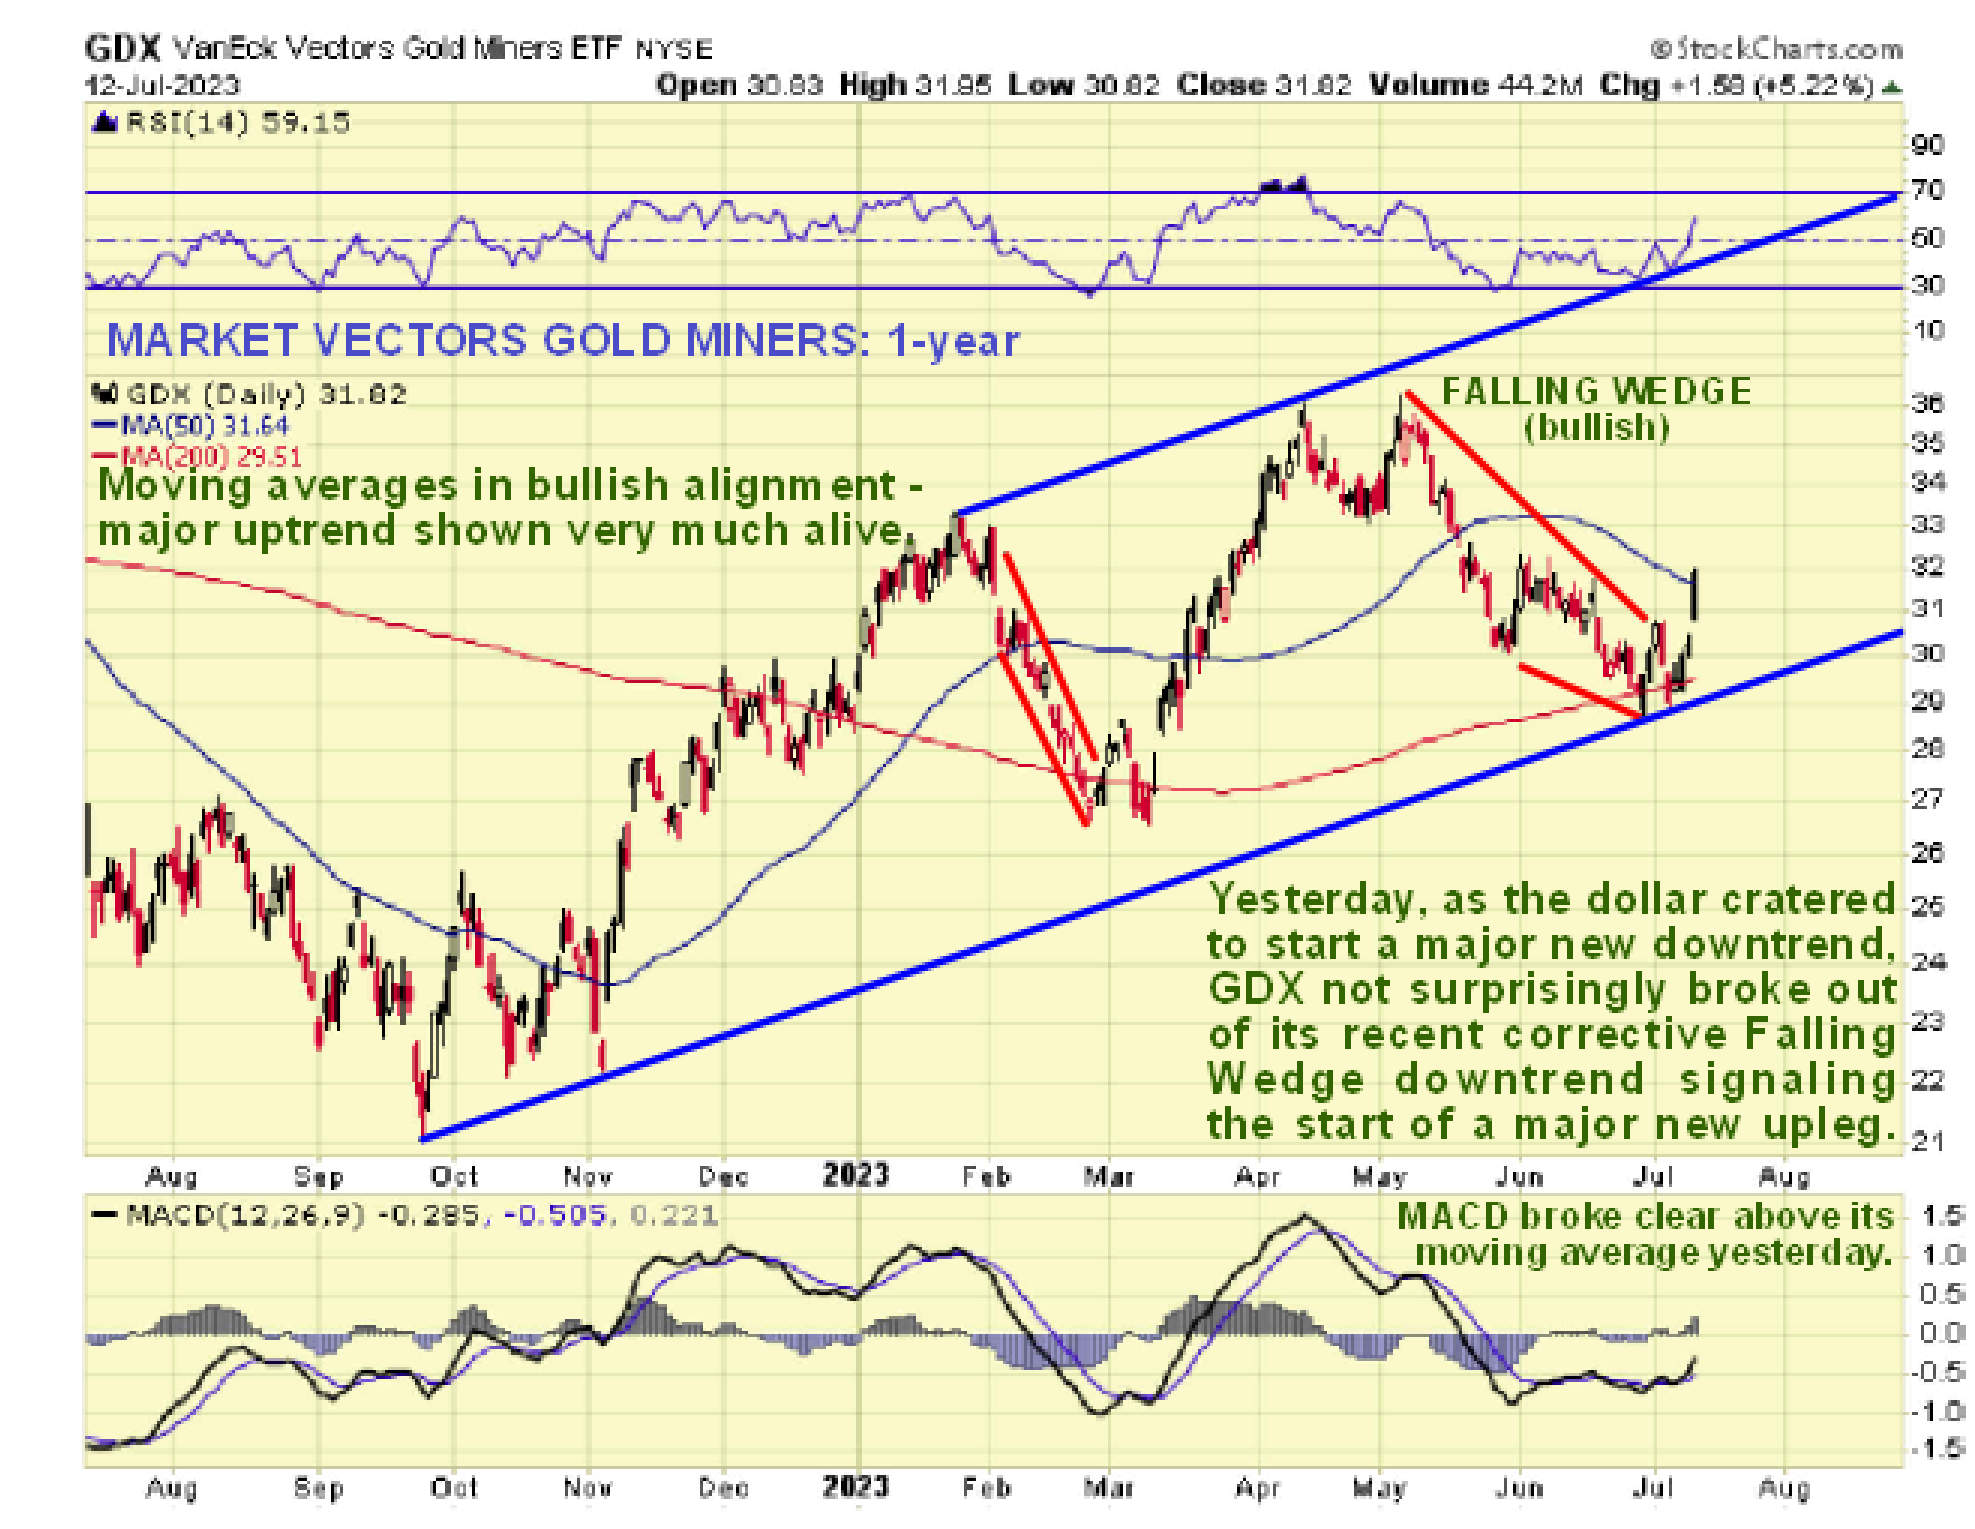
On gold’s 1-year chart we can see a quite lovely breakout yesterday from the corrective bullish Falling Wedge that brought it back to an important buy spot at the lower boundary of its larger uptrend channel and as we can clearly see, there is ample upside back up to the top of this channel – and there is nothing to say that, given the enormity of what is going on in the world, that it won’t in due course proceed to accelerate out of the top of this channel…


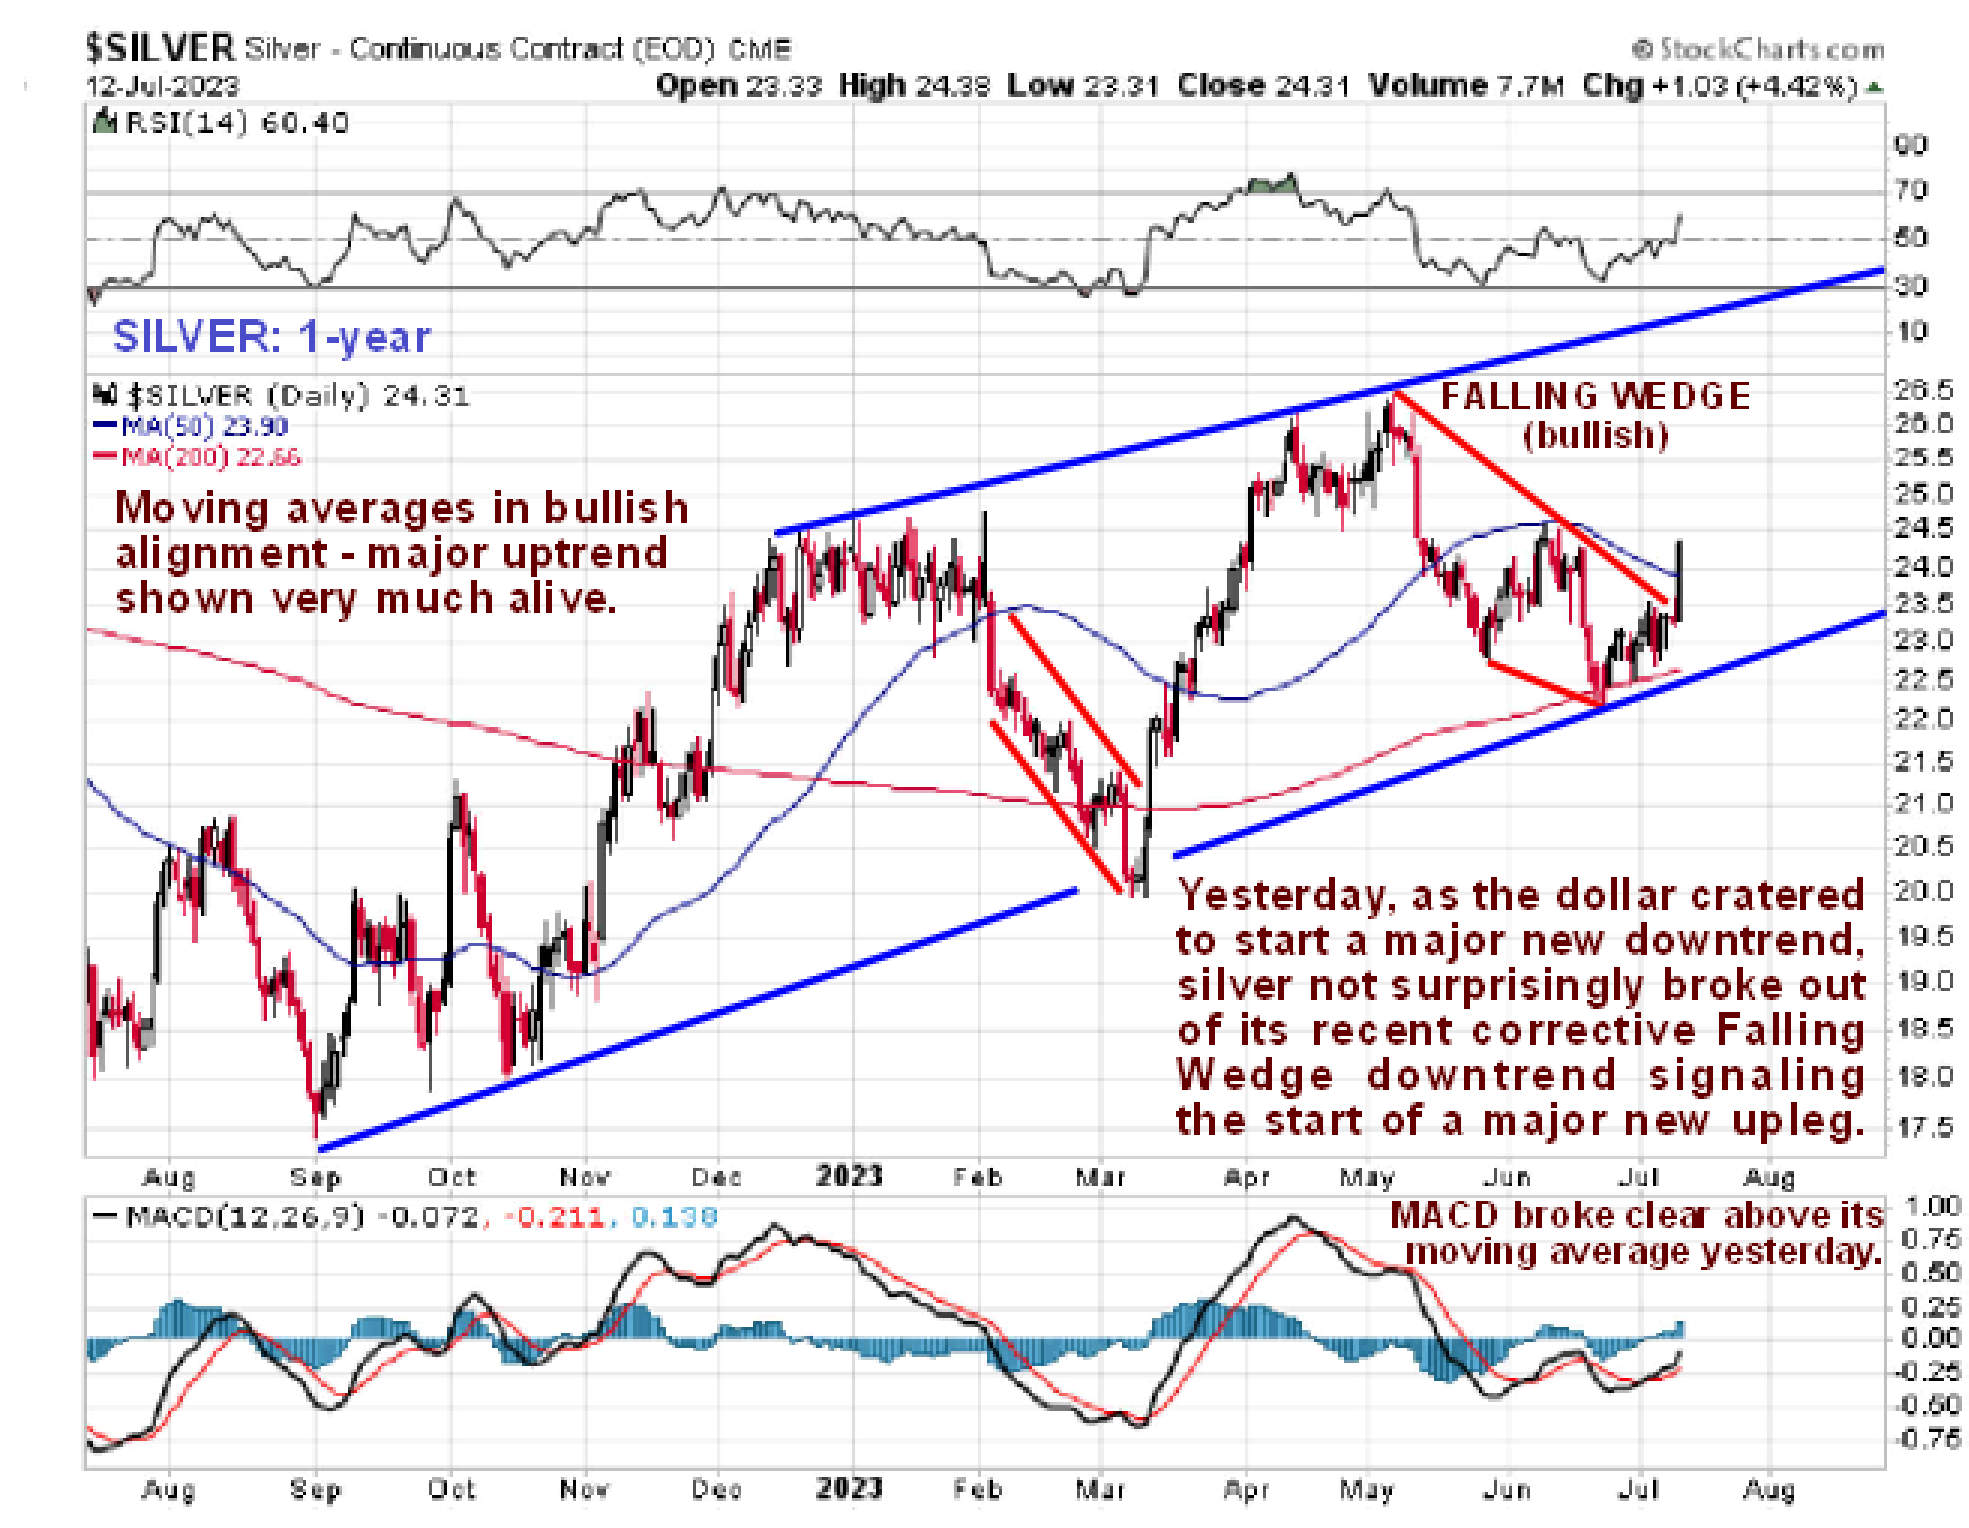
Silver had a big breakout yesterday too and although its uptrend is not yet as strong as gold’s as its larger uptrend channel is converging, it will probably proceed to rectify this in time by busting out of the top of this channel…


The chart for GDX (PM stocks) not surpringly looks very similar to gold and we can expect a robust by the sector as gold advances. Don’t worry about it having risen a lot yesterday – this chart shows that it has much further to go.


The chart for the Canadian dollar looks strong too, like it is breaking out upside from a long period of consolidation. Its chart will be added to this article later today, so look out for that.

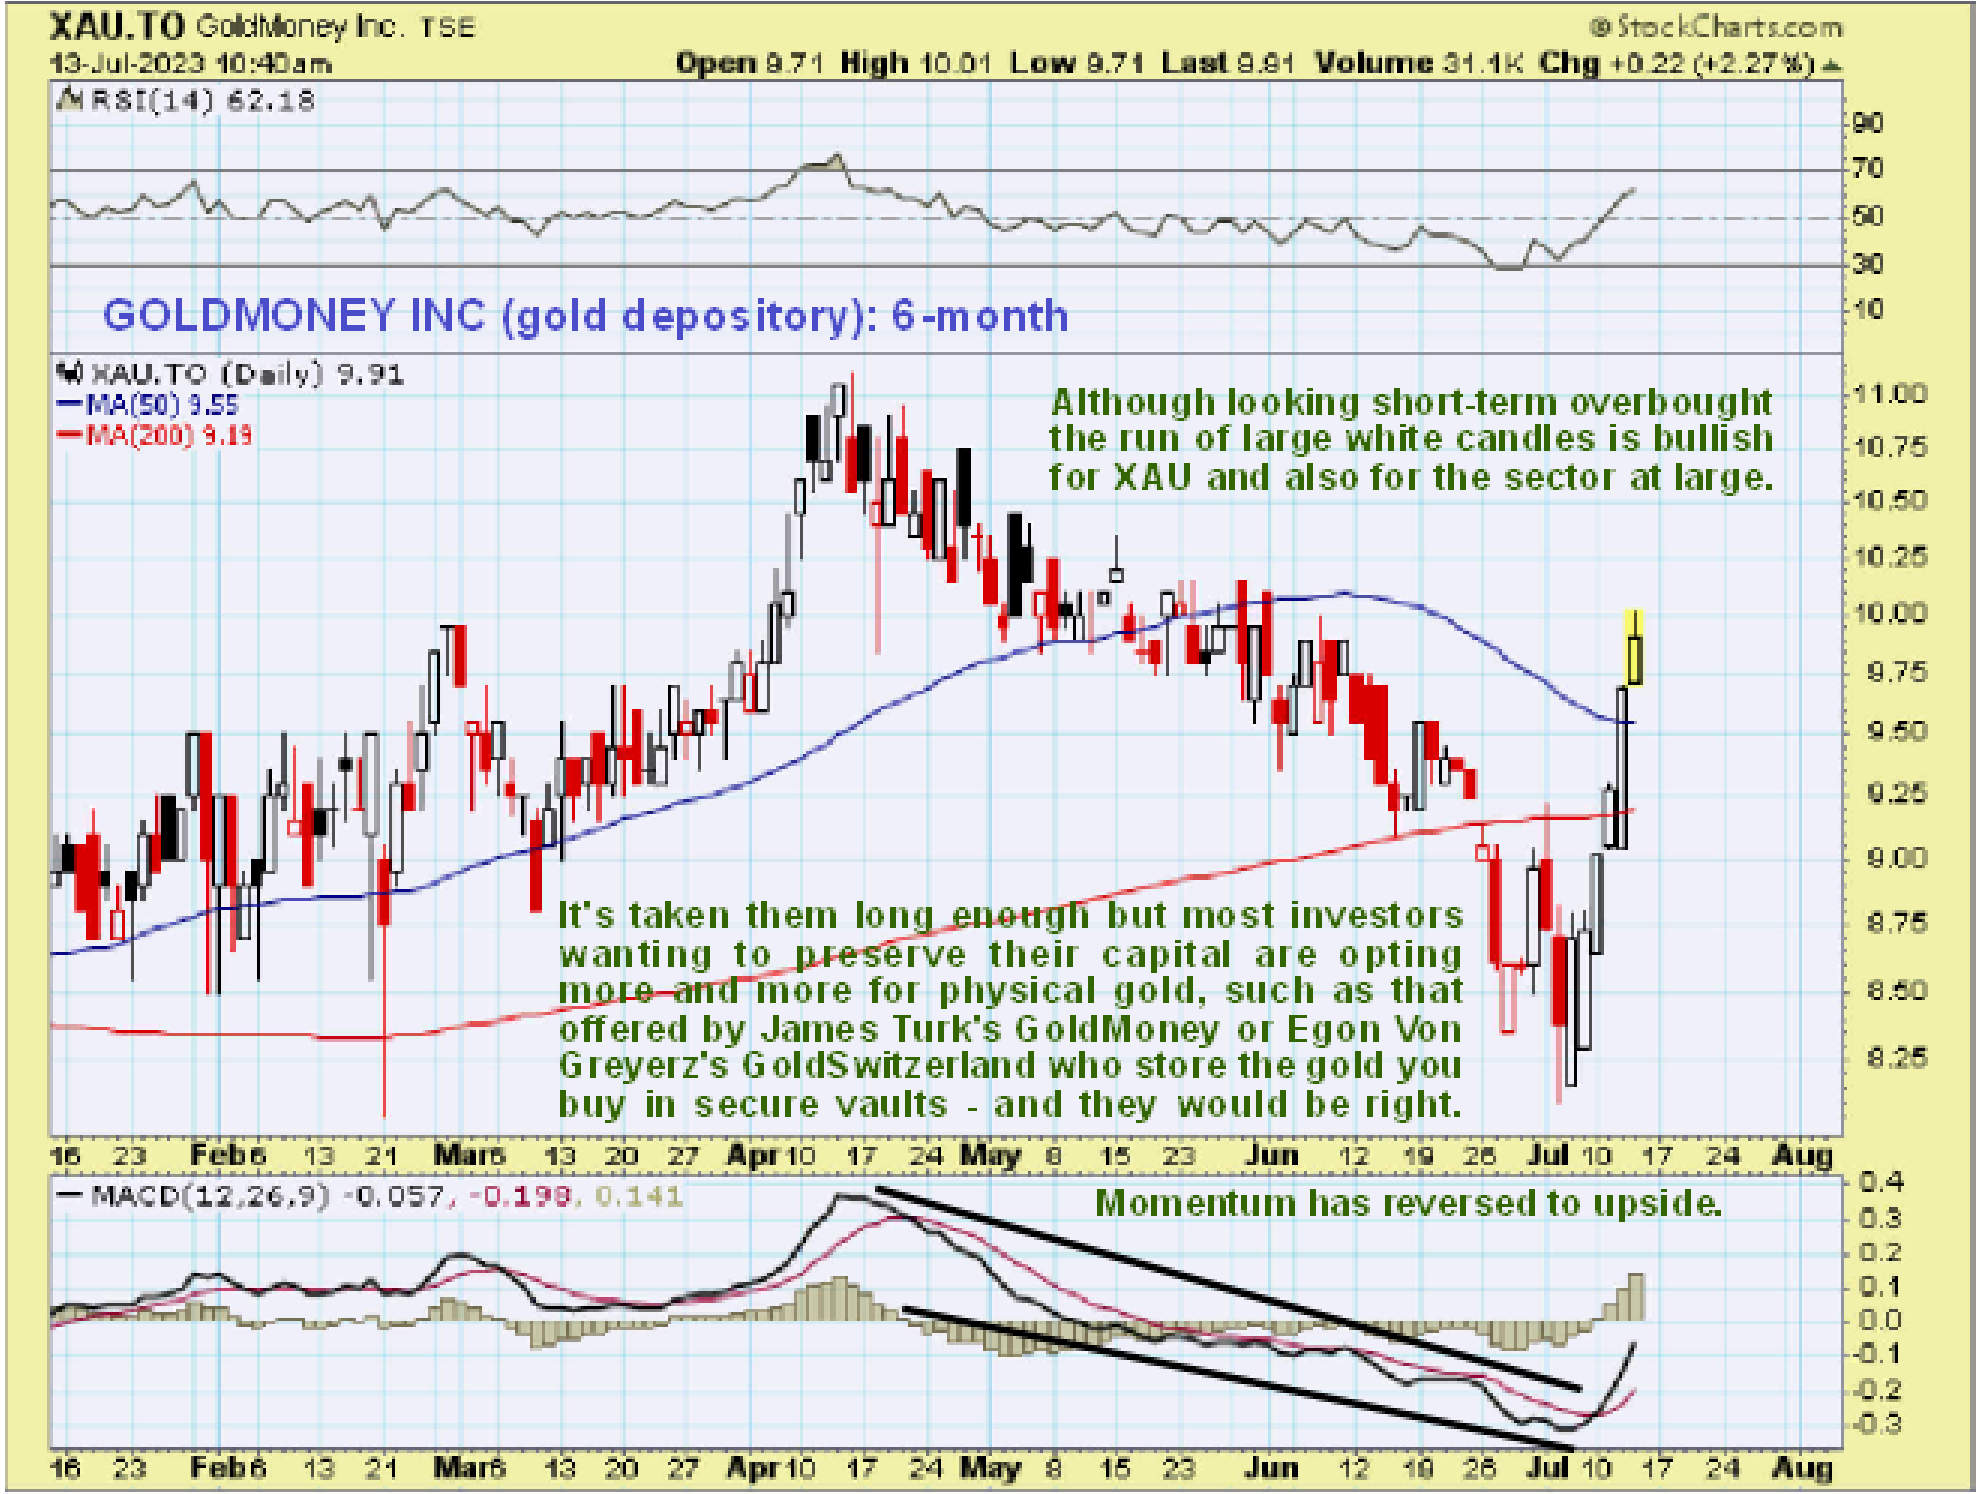
Incidentally there are a string of big white candles in James Turk’s GoldMoney’s chart (XAU.TSX) over the past week, suggesting that investors of piling into physical gold.


Amongst stocks looking good this morning that we will be looking at ASAP are Sierra Madre Gold and Silver Ltd. (SM:TSX.V) that has positive news out this morning and Spey Resources Corp. (SPEY:CSE; SPEYF:OTC; 2JS:FRA) is at a very good entry point too. Away from the PM sector Muscle Maker Inc. (GRIL:NASDAQ) put in a reversal candle at strong support yesterday and looks set to advance.

Posted at 9.30 am EDT on 13th July 23 on CliveMaund.com.

Important Disclosures:

  1. Sierra Madre is a billboard sponsor of Streetwise Reports and pays SWR a monthly sponsorship fee between US$4,000 and US$5,000.
  2.  Spey Resources and Muscle Maker have a consulting relationship with an affiliate of Streetwise Reports, and pays a monthly consulting fee between US$8,000 and US$20,000.
  3. As of the date of this article, officers and/or employees of Streetwise Reports LLC (including members of their household) own securities of Spey Resources and Muscle Maker.
  4. Clive Maund: I, or members of my immediate household or family, own securities of: none. I personally am, or members of my immediate household or family are, paid by none. My company has a financial relationship with none. I determined which companies would be included in this article based on my research and understanding of the sector.
  5. Statements and opinions expressed are the opinions of the author and not of Streetwise Reports or its officers. The author is wholly responsible for the validity of the statements. The author was not paid by Streetwise Reports for this article. Streetwise Reports was not paid by the author to publish or syndicate this article. Streetwise Reports requires contributing authors to disclose any shareholdings in, or economic relationships with, companies that they write about. Streetwise Reports relies upon the authors to accurately provide this information and Streetwise Reports has no means of verifying its accuracy.
  6.  This article does not constitute investment advice. Each reader is encouraged to consult with his or her individual financial professional. By opening this page, each reader accepts and agrees to Streetwise Reports’ terms of use and full legal disclaimer. This article is not a solicitation for investment. Streetwise Reports does not render general or specific investment advice and the information on Streetwise Reports should not be considered a recommendation to buy or sell any security. Streetwise Reports does not endorse or recommend the business, products, services or securities of any company.

For additional disclosures, please click here.

CliveMaund.com Disclosures

The above represents the opinion and analysis of Mr. Maund, based on data available to him, at the time of writing. Mr. Maund’s opinions are his own, and are not a recommendation or an offer to buy or sell securities. Mr. Maund is an independent analyst who receives no compensation of any kind from any groups, individuals or corporations mentioned in his reports. As trading and investing in any financial markets may involve serious risk of loss, Mr. Maund recommends that you consult with a qualified investment advisor, one licensed by appropriate regulatory agencies in your legal jurisdiction and do your own due diligence and research when making any kind of a transaction with financial ramifications. Although a qualified and experienced stock market analyst, Clive Maund is not a Registered Securities Advisor. Therefore Mr. Maund’s opinions on the market and stocks can only be construed as a solicitation to buy and sell securities when they are subject to the prior approval and endorsement of a Registered Securities Advisor operating in accordance with the appropriate regulations in your area of jurisdiction.

Platinum’s May-June Selloff: When the “Fundamental” Chips Fall

In May, a “record supply deficit” should’ve sent platinum prices soaring. So much for the best laid “fundamental” plans.

By Elliott Wave International

If I had a nickel for every time someone asked me what value “fundamentals” serve in navigating financial markets, well… let’s just say I could’ve retired to the Poconos years ago.

And the short answer I give to this question hasn’t changed in 18 years; namely, none.

This can be hard to accept, considering how fundamental “fundamental” market analysis is for mainstream finance. Pick the equivalent “Wall Street” of the country you live in, ask any pundit on that particular “street,” and they’ll insist the main driver of market trends is the news circulating outside those markets. That includes anything from weather patterns, political unrest, earnings reports, and so on.

But the reason I and we as Elliott wave analysts take such a radical stance against the value of “fundamentals” is simple: These news events don’t occur in a vacuum. They’re filtered through the lens of human beings, and very rarely do those humans see eye-to-eye on what a certain event means for a market’s future.

Or whenever there is a consensus on how a certain event will affect prices, the market goes ahead and does the exact opposite of that consensus.

When you start paying attention to this pattern of markets ignoring the news that’s supposed to move them, you can’t un-see it.

What we as Elliott wave analysts do see, however, is that market trends are driven by investor psychology, which unfolds as measurable wave patterns directly on price charts.

A recent example of this comes from platinum. In May, the industrial metal used in everything from catalytic converters to AI medical technology made the front page of major news outlets from The New York Times to Fortune Magazine.

The word “platinum” was practically clickbait, after the Biden administration floated a long-held and longshot Hail Mary idea for the U.S. Treasury to mint a $1 trillion platinum coin to avert the crashing of the debt ceiling.

At the same time on the investment front, platinum bulls were handed the big blue whale of supportive “fundamentals” — not just low supply numbers amidst rising demand, but the lowest supply data on record care of rolling power outages in South Africa, the world’s largest supplier of mined platinum.

The white metal seemed to be prime for a red-hot rally. Wrote Reuters on May 2: “Platinum prices surge as speculators bet supply will run short… We think this is the first year of serial deficits in the platinum market.”

On May 16, Bullion Vault added: “Platinum Investment to Support $1000 Price on ‘Record Deficit.'”

“Fundamental” signs pointed in a straight line going up. Elliott wave signs, however, aimed to help investors and traders manage the risk of participating in the metal’s action.

On May 11, our Metals Pro Service showed this Elliott wave labeled price chart of platinum. There, our primary count was bullish, and called for “a new high.” But that wasn’t the end of our analysis. We then explained the exact steps price must take to confirm an uptrend. From Metals Pro Service:

“You would think it would’ve given us a new high, and yet price has fallen back to the low it achieved just hours ago. I’m going to stay bullish above the .382 retracement level. I’m not eager to call a top, but if it goes under the .382 retracement level of 1150, then the risk begins to become that a top is in place. I am inclined to call it a truncated fifth wave of wave 1 up.

The next day on May 12, platinum accelerated down, confirming that a truncated fifth wave top was in place. Metals Pro Service showed its newly updated chart and said:

“The outlook is bearish while price holds under its 0.382 retracement level. The farther price falls, the more likely it is that wave (a) of ii (circled) is underway.

And from there, platinum continued falling to a 4-month low on June 23.

Metals trading, as all markets, carries risk. And not all Elliott wave interpretations turn out to be accurate. But like this example shows, Elliott analysis does identify critical price levels to help manage the inherent risk.

“Fundamental” analysis can’t say the same.


The Elliott Wave Hotlist: See 5 top market picks — FREE

70+

That’s how many markets Elliott Wave International’s Pro Services cover for subscribers.

But, you might ask, why the “+”? Why not write the exact number?

Well, because month in and month out, Pro Services also look for special opportunities. Sometimes in markets they cover regularly, sometimes something totally wild and unexpected.

In other words, they go where the opportunity is.

And that’s exactly what you’re about to see.

FREE through July 14, the “Elliott Wave Hotlist” shows you 5 top opportunities straight from the desks of EWI’s Pro Services analysts.

See ALL the setups now at elliottwave.com >>

This article was syndicated by Elliott Wave International and was originally published under the headline Platinum’s May-June Selloff: When the “Fundamental” Chips Fall. EWI is the world’s largest market forecasting firm. Its staff of full-time analysts led by Chartered Market Technician Robert Prechter provides 24-hour-a-day market analysis to institutional and private investors around the world.

COT Metals Charts: Weekly Speculator Changes led by Gold

By InvestMacro

Here are the latest charts and statistics for the Commitment of Traders (COT) data published by the Commodities Futures Trading Commission (CFTC).

The latest COT data is updated through Monday July 3rd and shows a quick view of how large traders (for-profit speculators and commercial entities) were positioned in the futures markets.

Weekly Speculator Changes led by Gold

The COT metals markets speculator bets were lower this week as two out of the six metals markets we cover had higher positioning while the other four markets had lower speculator contracts.

Leading the gains for the metals was Gold (11,187 contracts) with Steel (1,150 contracts) also showing a positive week.

The markets with declines in speculator bets for the week were Copper (-11,702 contracts), Palladium (-566 contracts), Platinum (-4,093 contracts) and Silver (-1,062 contracts) also registering lower bets on the week.


Data Snapshot of Commodity Market Traders | Columns Legend
Jul-03-2023
OI
OI-Index
Spec-Net
Spec-Index
Com-Net
COM-Index
Smalls-Net
Smalls-Index
Gold448,06312163,09749-184,7175321,62034
Copper204,399461,88832-4,003682,11532
Silver114,421017,99044-29,5695811,57931
Platinum69,383708,06734-13,570655,50342
Palladium14,781100-7,89008,358100-46814


Strength Scores led by Steel & Gold

COT Strength Scores (a normalized measure of Speculator positions over a 3-Year range, from 0 to 100 where above 80 is Extreme-Bullish and below 20 is Extreme-Bearish) showed that Steel (73 percent) and Gold (49 percent) lead the metals markets this week.

On the downside, Palladium (0 percent)comes in at the lowest strength level currently and is in Extreme-Bearish territory (below 20 percent).

Strength Statistics:
Gold (48.9 percent) vs Gold previous week (43.9 percent)
Silver (43.9 percent) vs Silver previous week (45.4 percent)
Copper (23.3 percent) vs Copper previous week (33.4 percent)
Platinum (34.2 percent) vs Platinum previous week (43.6 percent)
Palladium (0.0 percent) vs Palladium previous week (4.9 percent)
Steel (72.8 percent) vs Palladium previous week (69.5 percent)


Copper & Steel top the 6-Week Strength Trends

COT Strength Score Trends (or move index, calculates the 6-week changes in strength scores) showed that Copper (23 percent) and Steel (15 percent) lead the past six weeks trends for metals.

Platinum (-45 percent) leads the downside trend scores currently.

Move Statistics:
Gold (1.0 percent) vs Gold previous week (-12.3 percent)
Silver (-5.7 percent) vs Silver previous week (-6.8 percent)
Copper (18.2 percent) vs Copper previous week (30.7 percent)
Platinum (-44.8 percent) vs Platinum previous week (-31.5 percent)
Palladium (-22.4 percent) vs Palladium previous week (-20.7 percent)
Steel (15.0 percent) vs Steel previous week (9.1 percent)


Individual Markets:

Gold Comex Futures:

Gold Futures COT ChartThe Gold Comex Futures large speculator standing this week recorded a net position of 163,097 contracts in the data reported through Tuesday. This was a weekly boost of 11,187 contracts from the previous week which had a total of 151,910 net contracts.

This week’s current strength score (the trader positioning range over the past three years, measured from 0 to 100) shows the speculators are currently Bearish with a score of 48.9 percent. The commercials are Bullish with a score of 52.6 percent and the small traders (not shown in chart) are Bearish with a score of 34.1 percent.

Price Trend-Following Model: Weak Uptrend

Our weekly trend-following model classifies the current market price position as: Weak Uptrend. The current action for the model is considered to be: Hold – Maintain Long Position.

Gold Futures StatisticsSPECULATORSCOMMERCIALSSMALL TRADERS
– Percent of Open Interest Longs:52.525.610.2
– Percent of Open Interest Shorts:16.166.95.3
– Net Position:163,097-184,71721,620
– Gross Longs:235,081114,90545,490
– Gross Shorts:71,984299,62223,870
– Long to Short Ratio:3.3 to 10.4 to 11.9 to 1
NET POSITION TREND:
– Strength Index Score (3 Year Range Pct):48.952.634.1
– Strength Index Reading (3 Year Range):BearishBullishBearish
NET POSITION MOVEMENT INDEX:
– 6-Week Change in Strength Index:1.00.9-11.7


Silver Comex Futures:

Silver Futures COT ChartThe Silver Comex Futures large speculator standing this week recorded a net position of 17,990 contracts in the data reported through Tuesday. This was a weekly lowering of -1,062 contracts from the previous week which had a total of 19,052 net contracts.

This week’s current strength score (the trader positioning range over the past three years, measured from 0 to 100) shows the speculators are currently Bearish with a score of 43.9 percent. The commercials are Bullish with a score of 58.1 percent and the small traders (not shown in chart) are Bearish with a score of 30.7 percent.

Price Trend-Following Model: Weak Uptrend

Our weekly trend-following model classifies the current market price position as: Weak Uptrend. The current action for the model is considered to be: Hold – Maintain Long Position.

Silver Futures StatisticsSPECULATORSCOMMERCIALSSMALL TRADERS
– Percent of Open Interest Longs:40.633.020.1
– Percent of Open Interest Shorts:24.958.910.0
– Net Position:17,990-29,56911,579
– Gross Longs:46,43337,78423,020
– Gross Shorts:28,44367,35311,441
– Long to Short Ratio:1.6 to 10.6 to 12.0 to 1
NET POSITION TREND:
– Strength Index Score (3 Year Range Pct):43.958.130.7
– Strength Index Reading (3 Year Range):BearishBullishBearish
NET POSITION MOVEMENT INDEX:
– 6-Week Change in Strength Index:-5.76.5-8.0


Copper Grade #1 Futures:

The Copper Grade #1 Futures large speculator standing this week recorded a net position of -8,762 contracts in the data reported through Tuesday. This was a weekly fall of -11,702 contracts from the previous week which had a total of 2,940 net contracts.

This week’s current strength score (the trader positioning range over the past three years, measured from 0 to 100) shows the speculators are currently Bearish with a score of 23.3 percent. The commercials are Bullish with a score of 77.1 percent and the small traders (not shown in chart) are Bearish with a score of 32.0 percent.

Price Trend-Following Model: Downtrend

Our weekly trend-following model classifies the current market price position as: Downtrend. The current action for the model is considered to be: Hold – Maintain Short Position.

Copper Futures StatisticsSPECULATORSCOMMERCIALSSMALL TRADERS
– Percent of Open Interest Longs:31.742.48.2
– Percent of Open Interest Shorts:30.744.47.2
– Net Position:1,888-4,0032,115
– Gross Longs:64,74086,76116,759
– Gross Shorts:62,85290,76414,644
– Long to Short Ratio:1.0 to 11.0 to 11.1 to 1
NET POSITION TREND:
– Strength Index Score (3 Year Range Pct):32.568.331.8
– Strength Index Reading (3 Year Range):BearishBullishBearish
NET POSITION MOVEMENT INDEX:
– 6-Week Change in Strength Index:23.1-19.7-19.0


Platinum Futures:

Platinum Futures COT ChartThe Platinum Futures large speculator standing this week recorded a net position of 8,067 contracts in the data reported through Tuesday. This was a weekly lowering of -4,093 contracts from the previous week which had a total of 12,160 net contracts.

This week’s current strength score (the trader positioning range over the past three years, measured from 0 to 100) shows the speculators are currently Bearish with a score of 34.2 percent. The commercials are Bullish with a score of 65.4 percent and the small traders (not shown in chart) are Bearish with a score of 41.8 percent.

Price Trend-Following Model: Strong Downtrend

Our weekly trend-following model classifies the current market price position as: Strong Downtrend. The current action for the model is considered to be: New Sell – Short Position.

Platinum Futures StatisticsSPECULATORSCOMMERCIALSSMALL TRADERS
– Percent of Open Interest Longs:52.528.613.0
– Percent of Open Interest Shorts:40.948.25.1
– Net Position:8,067-13,5705,503
– Gross Longs:36,44319,8569,026
– Gross Shorts:28,37633,4263,523
– Long to Short Ratio:1.3 to 10.6 to 12.6 to 1
NET POSITION TREND:
– Strength Index Score (3 Year Range Pct):34.265.441.8
– Strength Index Reading (3 Year Range):BearishBullishBearish
NET POSITION MOVEMENT INDEX:
– 6-Week Change in Strength Index:-44.838.411.0


Palladium Futures:

Palladium Futures COT ChartThe Palladium Futures large speculator standing this week recorded a net position of -7,890 contracts in the data reported through Tuesday. This was a weekly decline of -566 contracts from the previous week which had a total of -7,324 net contracts.

This week’s current strength score (the trader positioning range over the past three years, measured from 0 to 100) shows the speculators are currently Bearish-Extreme with a score of 0.0 percent. The commercials are Bullish-Extreme with a score of 100.0 percent and the small traders (not shown in chart) are Bearish-Extreme with a score of 13.6 percent.

Price Trend-Following Model: Strong Downtrend

Our weekly trend-following model classifies the current market price position as: Strong Downtrend. The current action for the model is considered to be: Hold – Maintain Short Position.

Palladium Futures StatisticsSPECULATORSCOMMERCIALSSMALL TRADERS
– Percent of Open Interest Longs:22.663.19.9
– Percent of Open Interest Shorts:76.06.613.1
– Net Position:-7,8908,358-468
– Gross Longs:3,3429,3301,463
– Gross Shorts:11,2329721,931
– Long to Short Ratio:0.3 to 19.6 to 10.8 to 1
NET POSITION TREND:
– Strength Index Score (3 Year Range Pct):0.0100.013.6
– Strength Index Reading (3 Year Range):Bearish-ExtremeBullish-ExtremeBearish-Extreme
NET POSITION MOVEMENT INDEX:
– 6-Week Change in Strength Index:-22.421.0-5.3


Steel Futures Futures:

Steel Futures COT ChartThe Steel Futures large speculator standing this week recorded a net position of -130 contracts in the data reported through Tuesday. This was a weekly boost of 1,150 contracts from the previous week which had a total of -1,280 net contracts.

This week’s current strength score (the trader positioning range over the past three years, measured from 0 to 100) shows the speculators are currently Bullish with a score of 72.8 percent. The commercials are Bearish with a score of 26.9 percent and the small traders (not shown in chart) are Bearish with a score of 40.6 percent.

Price Trend-Following Model: Strong Downtrend

Our weekly trend-following model classifies the current market price position as: Strong Downtrend. The current action for the model is considered to be: Hold – Maintain Short Position.

Steel Futures StatisticsSPECULATORSCOMMERCIALSSMALL TRADERS
– Percent of Open Interest Longs:17.574.91.3
– Percent of Open Interest Shorts:18.175.10.7
– Net Position:-130-28158
– Gross Longs:4,12917,669312
– Gross Shorts:4,25917,697154
– Long to Short Ratio:1.0 to 11.0 to 12.0 to 1
NET POSITION TREND:
– Strength Index Score (3 Year Range Pct):72.826.940.6
– Strength Index Reading (3 Year Range):BullishBearishBearish
NET POSITION MOVEMENT INDEX:
– 6-Week Change in Strength Index:15.0-16.040.6


Article By InvestMacroReceive our weekly COT Newsletter

*COT Report: The COT data, released weekly to the public each Friday, is updated through the most recent Tuesday (data is 3 days old) and shows a quick view of how large speculators or non-commercials (for-profit traders) were positioned in the futures markets.

The CFTC categorizes trader positions according to commercial hedgers (traders who use futures contracts for hedging as part of the business), non-commercials (large traders who speculate to realize trading profits) and nonreportable traders (usually small traders/speculators) as well as their open interest (contracts open in the market at time of reporting). See CFTC criteria here.

Gold Struggles to Gain Momentum: Challenges Persist in Precious Metals Sector

By RoboForex Analytical Department

The precious metals sector continues to face challenges, as gold has experienced a meager 5.1% increase from January to June 2023. This growth pales in comparison to the indicators seen in the US stock markets. Currently, the price of one troy ounce of gold stands at $1917 as we enter the second half of the year.

One of the key factors weighing on XAUUSD is the upward trend in interest rates, particularly in the US. This trend leads to higher yields in US government bonds and a stronger USD exchange rate. Historically, gold prices have exhibited an inverse correlation with these indicators.

Technical Analysis of XAU/USD:

On the H4 XAU/USD chart, the price has once again rebounded from the moving averages, indicating the development of a bearish trend since May 22, 2023. This price behavior reinforces the strength of the current trend and the ongoing pressure from sellers. The closest support area lies at the level of 1895, and a breakout below this level would pave the way for a decline towards 1860. Technically, this scenario is supported by the MACD, as its signal line has moved out of the histogram area, signaling a decline and the continuation of the bearish trend. It is worth noting the formation of a bullish divergence signal on the MACD indicator on June 30, 2023, when the quotes reached 1935, and the signal was successfully executed.

On the H1 XAU/USD chart, the quotes have broken out of the boundaries of the bullish correction channel. The price is currently below the 200-day moving average, indicating increasing pressure from sellers and a lack of upward movement in the market. There is still potential for a minor bullish correction, with a possible test of the 1915 level before a decline towards 1895 is expected. Technically, this scenario is confirmed by the MACD, as histogram bars have dropped below the July 5, 2023 minimum, nullifying the attempt to form a bullish divergence. A favorable scenario for sellers would be a breakout of the resistance area with the price consolidating above the 1920 level.

Disclaimer

Any forecasts contained herein are based on the author’s particular opinion. This analysis may not be treated as trading advice. RoboForex bears no responsibility for trading results based on trading recommendations and reviews contained herein.

Chasing Down a Winner

Source: Michael Ballanger  (7/3/23) 

With investors scrambling at buzzwords, Michael Ballanger of GGM Advisory Inc. looks at one company he believes is a winner beyond the exciting jargon of the day.

There are moments in my long career that stand out as “watershed” moments where a simple telephone call or a chance meeting at a mining conference created an impression upon me that had a discernible impact on my life at the time. The memories of those conversations are vivid, and they rarely leave me, especially when I am confronted with that eerie feeling that occurs at the precise moment of revelation that something important just happened.

A few years back, I wrote a piece entitled “Serendipity,” where I spoke of events that occurred while boating or playing sports or searching out investment ideas that came literally “out of the blue,” as in totally unexpected occurrences but because the outcomes were always favorable, they stand out over the years as “life lessons” and deserve to be passed along.

I was once in a meeting where one of my partners, a rough-and-tumble prison guard from LaRonge, Saskatchewan, got out of his seat and proceeded to explain in no uncertain terms that since stock certificates are made out of newsprint, they deserve little more value than the paper with which they are printed.

When it is all said and done, these glamorized slabs of altered newsprint are really only worth the people that put their names to the certificate, which is why professional money managers would tell us that of all the bullet points on their “Prerequisites for Investment,” there is only one word that matters, and that is the word “management.”

His crystallizing line came when this strapping Prairie lad told the group that “the last time I looked, newsprint is going for a buck eighty-six a pound!”

That statement, coming from a man with, shall I say, “limited” knowledge of the securities world, enlightened me to the stark reality that not all citizens of this planet look at stock certificates with the same kind of shock and awe envy.

Stock certificates are indeed nearly worthless in and of themselves, and only when they are recognized as “titles” to a share of a venture do they begin to get recognition.

In the current market environment, pieces of finely crafted newsprint with detailed etching and meticulous legal scribbling can be worth next to nothing if the word “gold” is contained in the scribbling, or it can be worth a small fortune if the words “artificial intelligence” can be seen.

Ten years ago in Canada, the word “cannabis” magically elevated the value of a tenth-of-a-pound certificate to many times the going rate for newsprint, and a few years later, the word “crypto” replaced “cannabis” creating yet another generation of self-enabled millionaires scalping trading profits from the safety of their cellphones.

When it is all said and done, these glamorized slabs of altered newsprint are really only worth the people that put their names to the certificate, which is why professional money managers would tell us that of all the bullet points on their “Prerequisites for Investment,” there is only one word that matters, and that is the word “management.”

Volt Lithium

With the prior few paragraphs as the appropriate preamble, it is no accident that I had yet another magical moment that only with the fullness of time can be classified as “life-altering.”

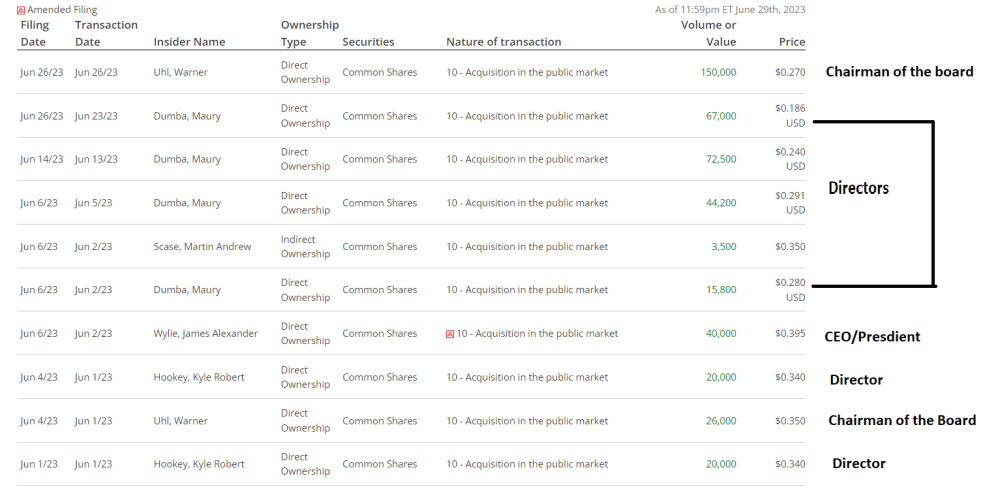
I was scanning a few of the websites that cover the companies I follow and about which I write from time to time when I came across a site that posted a screenshot of a list of insiders that had been recently buying stock. As I peered down the list, I came across the name of the Chairman of the Board of a company that I have owned since early 2021, Warner Uhl, with the company being Volt Lithium Corp. (VLT:TSV;VLTLF:US).

It seems that with the stock price down over 65% from the May 24 peak, Mr. Uhl decided to do what I have been doing, and that is buying more of that “glorified newsprint.”

I have spoken to Warner Uhl perhaps twice in my life going back to mid-2021 when I was trying to get a handle on the direction of his company (then called Allied Copper Corp.) after some early hiccups resulted in a trading halt. The second call was after I noticed his first (small) insider transaction, which was just after they announced the move to amalgamate with Volt Lithium Corp. Without hesitation, I rang him up after a brief conversation. I was delighted to learn that he was an aficionado of lithium as well as copper and that he would be staying on as Chairman.

Fast-forward to June 27, 2023.

Insiders of junior Canadian resource deals rarely buy positions in their own deals; they prefer to use the “Directors’ Incentive Options” instead of their own cash to beef up their notional, if not actual, ownership. With markets on the defensive and retail investors puking out positions at the first sign of any size bids, I found the recent insider activity at Volt to be a breath of fresh air but this last purchase by Mr. Uhl caught my undivided attention.

Why Buy Now?

Why buy now? I picked up the phone resulting in a 25-minute conversation with a man who, in his early career, toiled on the Mt. Milligan Project, and the best description of his contribution can be gleaned only after lifting it from his impressive resumé:

2009 – 2013 Project Director, AMEC (Mt. Milligan project)

  • Project Director for EPCM services, in a joint venture with Fluor, for a 60,000 tpd copper-gold project with open-pit mining, conventional concentrator, gold gravity concentration, water treatment, tailings management, utilities and infrastructure, and an offsite concentrate loading and handling facility. Managed an engineering staff of 250 and an onsite staff of 120 persons overseeing a peak of 1,600 contractors. Oversaw the design, permitting, construction, and commissioning. The work that Mr. Uhl directed was built under budget and on time. Over 5.0 million man-hours without a lost-time accident. All this was accomplished with a very inexperienced industrial workforce and significant participation by local indigenous companies.

For the past several years, Warner has toiled for the mighty Worley Canada, providers of professional services in the energy, chemicals, and resources sectors (including copper and lithium). His title is “Regional Director for Study Management in the Americas, Technology and Expert Solutions, Worley, Canada.”

Warner has over three-hundred project study managers and engineers reporting to him on various projects within a larger company employing over 50,000 people and generating over US$10 billion in sales.

Now, buying 150,000 shares in the open market for CA$40,500 may not seem like a big deal, but to my sexagenarian eyes, it was like a message from the Messiah. I asked Warner today why he bought the stock, and his reply was quite simple. The market was missing the significance of the last press release, which, after third-party vetting and sign-off by Sproule Inc., reported that their pilot plant test confirmed the cost per tonne of a mere  US$3,977 required to produce 1,000 tonnes of lithium carbonate from the oilfield brines.

It seems that the “knock” on Volt is that few investors believe their claim that their Direct Lithium Extraction (DLE) technology actually works. There are a number of companies out there that shall remain anonymous that think that their DLE technology will work on a larger scale basis, but to date, nothing compares to Volt.

By calling Warner Uhl, whose company is currently working on a US$3 billion lithium extraction deal in Argentina, I asked a man that knows lithium extraction and all of the challenges to commercial processing of oilfield brines WHY he bought the stock. As obvious as the answer is to everyone close to the deal, It was almost an embarrassment to ask that question.

Volt Lithium Process

His answer was exactly as one would expect; based upon the extrapolation of prospective profitability using a DLE technology that he trusts, the stock price was “disconnected” from its market potential.

The market “disconnect” lies in the mistaken assumption that Volt’s claim is either overstated or false, but if one drills down into Sproule, one will quickly appreciate the significance of their involvement and why IIROC gave their blessing on the release.

Warner went on to explain the “green company” benefits whereby Volt returns formerly toxic brines to the subsurface aquifer in pristine shape, free of all impurities, including oil, for which they are paid a royalty by Cabot Energy. This is a feature of immense benefit to politicians, and with a great deal of government money allocated to the battery metals hunt and to water treatment, it is not a stretch to expect Volt to be approved for government grants as a means of defraying commercial development costs.

I would urge all shareholders to do what they can to retain their positions because as a longer-term investment, I think they will do quite well.”

That is an endorsement of the highest order from Volt’s Chairman and a person with decades of experience in the building of mines around the world and who is on the record as a buyer of shares.

Under threat of “overkill,” I want to hammer home the significance of Volt’s insider activity, and as you can observe from the graphic shown below, it is not only the Chairman adding to positions. Several directors, as well as CEO Alex Wiley, have stepped up to take advantage of the recent weakness, and over my many decades of dodging the poisonous darts of the insidious TSX Venture Exchange, this is an extremely valuable tool and certainly must be heeded.

Whenever you get a stock guy (me) with several decades behind him discussing DLE technology with a veteran mine builder and engineer (Uhl), it can many times be a difficult interaction, but I have always gravitated to the technical people rather than the “pitchmen” because the validity of the “pitch” lies solely in the hands of the technicians.

Over the past forty-five years, I have encountered so much horse manure in the boardrooms of Bay and Granville Streets that I could fertilize the Canadian Prairies if I could ever have bottled it. This is why the actions of Warner Uhl spoke louder than anything on their website or in their power-point presentation. When phenomenal growth stories are disconnected from the market due to faulty assumptions, they represent truly unique opportunities once one is able to define the disconnect.

As I have now explained this “disconnect,” it explains why Volt Lithium Corp. is now my largest holding and why I am adding to the position from the grandkids’ education pool and Granny’s bingo money and since Granny will want that money back by Labor Day, I must be very confident.


Important Disclosures:

  1. As of the date of this article, officers and/or employees of Streetwise Reports LLC (including members of their household) own securities of Volt Lithium Corp.
  2. Michael Ballanger: I, or members of my immediate household or family, own securities of: Volt Lithium Corp. I determined which companies would be included in this article based on my research and understanding of the sector.
  3. Statements and opinions expressed are the opinions of the author and not of Streetwise Reports or its officers. The author is wholly responsible for the validity of the statements. The author was not paid by Streetwise Reports for this article. Streetwise Reports was not paid by the author to publish or syndicate this article. Streetwise Reports requires contributing authors to disclose any shareholdings in, or economic relationships with, companies that they write about. Streetwise Reports relies upon the authors to accurately provide this information and Streetwise Reports has no means of verifying its accuracy.
  4.  This article does not constitute investment advice. Each reader is encouraged to consult with his or her individual financial professional. By opening this page, each reader accepts and agrees to Streetwise Reports’ terms of use and full legal disclaimer. This article is not a solicitation for investment. Streetwise Reports does not render general or specific investment advice and the information on Streetwise Reports should not be considered a recommendation to buy or sell any security. Streetwise Reports does not endorse or recommend the business, products, services or securities of any company.

For additional disclosures, please click here.

Michael Ballanger Disclosures

This letter makes no guarantee or warranty on the accuracy or completeness of the data provided. Nothing contained herein is intended or shall be deemed to be investment advice, implied or otherwise. This letter represents my views and replicates trades that I am making but nothing more than that. Always consult your registered advisor to assist you with your investments. I accept no liability for any loss arising from the use of the data contained on this letter. Options and junior mining stocks contain a high level of risk that may result in the loss of part or all invested capital and therefore are suitable for experienced and professional investors and traders only. One should be familiar with the risks involved in junior mining and options trading and we recommend consulting a financial adviser if you feel you do not understand the risks involved.

Trade Of The Week: Bears Set To Tighten Grip On Gold?

By ForexTime 

  • Potential volatile trading week for gold
  • Precious metal shed roughly 2.5% in Q2
  • Scales of power seem to be swinging in favour of bears
  • Watch out for Fed minutes and US jobs report
  • How prices react around $1900 could set tone

This could be a week to remember for gold prices thanks to technical and fundamental forces.

For the most part of Q2, it felt like a choppy affair for the precious metal with prices trading within multiple ranges. However, the overall trend was bearish with gold shedding roughly 2.5% for the quarter.

As the second half of 2023 kicks off, the scales of power seem to be swinging in favour of gold bears. Indeed, appetite towards the zero-yielding metal has been hit by a stabilizing dollar, Fed hike expectations, and a return of risk appetite. On the technical front, bears remain in the driving seat with prices trading uncomfortably close to the $1900 support level.

A major breakout could be on the horizon and here are 3 reasons why:

  1. FOMC meeting minutes

All eyes will be on the minutes of the June 13-14 FOMC meeting on Wednesday.

One of the biggest takeaways from the June meeting was the hawkish dot plot which signalled two more rate hikes in 2023. Since then, there have been conflicting views from Fed officials over how the central bank might move forward. On top of this, key data from the United States remains encouraging, pointing to economic resilience and supporting expectations around the Fed keeping rates higher for longer. Investors will be paying very close attention to the minutes for fresh clarity and details on the split between hawkish and dovish policymakers.

  • Gold prices are likely to move higher if the June FOMC meeting minutes strike a more dovish tone, with cautious policymakers expressing concern over high-interest rates negatively impacting the US economy.
  • Gold prices may sink lower if the June FOMC meeting minutes strike a more hawkish tone, with policymakers determined to raise interest rates to tame still-stubborn inflation.
  1. US Jobs report

The US nonfarm payrolls report on Friday could rock gold prices, especially if it defies market expectations as we have seen in recent months.

Markets expect the US economy to have added 225,000 jobs in June, while the unemployment rate is seen ticking lower to 3.6% compared to the 3.7% seen in the previous month. Given how markets remain sensitive to anything relating to the US economy and rate hike expectations, this jobs report could trigger volatility across the board.

  • Gold prices may appreciate on a weaker US dollar if the June NFP report prints below the 225k market forecast, complemented by a higher unemployment rate. This combo may fuel speculation around the Fed pausing rate hikes down the road, offering breathing room for zero-yielding gold.
  • Gold prices may depreciate on a stronger US dollar if the June NFP reports exceeds markets expectations with the unemployment rate moving lower. This scenario may strengthen the argument around the Fed raising interest rates 2 more times this year. 
  1. Technical forces favour bears 

Despite trading within multiple ranges, gold continues to respect a bearish channel on the daily charts.

Prices are trading below the 50 and 100-day SMA while the MACD trades to the downside. Bears may step into higher gears this week if prices sink below the $1900 level. This could open a path towards $1893 and $1858 – where the 200-day SMA resides.

Should prices push back above $1932, gold bulls could test $1959, $1985, and $2000, respectively.

At the time of writing, Bloomberg’s FX model forecasts a 72.3% probability that gold trades between $1893.79 – $2049.46 through the first week of July.


Forex-Time-LogoArticle by ForexTime

ForexTime Ltd (FXTM) is an award winning international online forex broker regulated by CySEC 185/12 www.forextime.com

Gold Is Seasonally Weak, Its Time To Pick up Bargains

Source: Barry Dawes  (6/26/23)

Barry Dawes of Martin Place Securities reviews the current state of the gold market to tell you where he believes it is headed. 

Take advantage of June tax loss selling and pick up bargains of a decade.

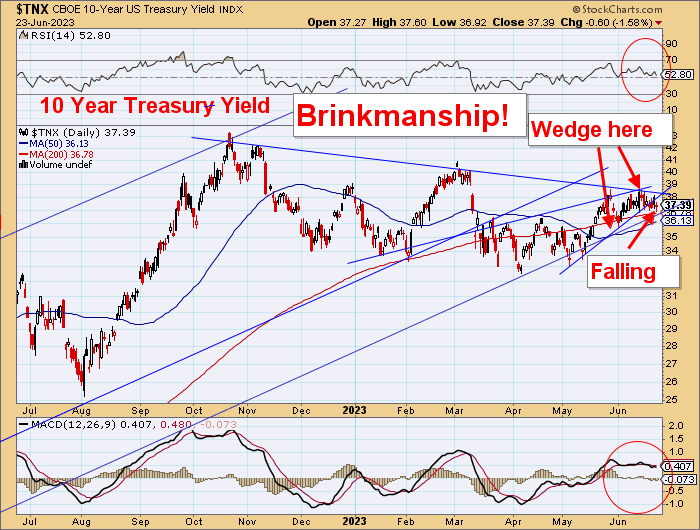
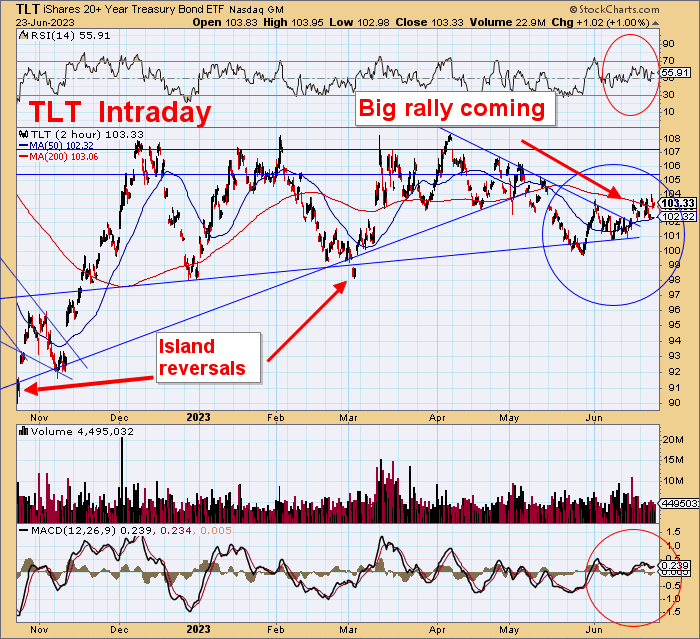
Bond brinkmanship resolved.

  • Yields falling.
  • Fed to follow!

Big bond rally to come.

Key Points

  • Gold
    • Marking time for US$ gold
      • But gold in Yen, Euros, and Sterling still looking strong
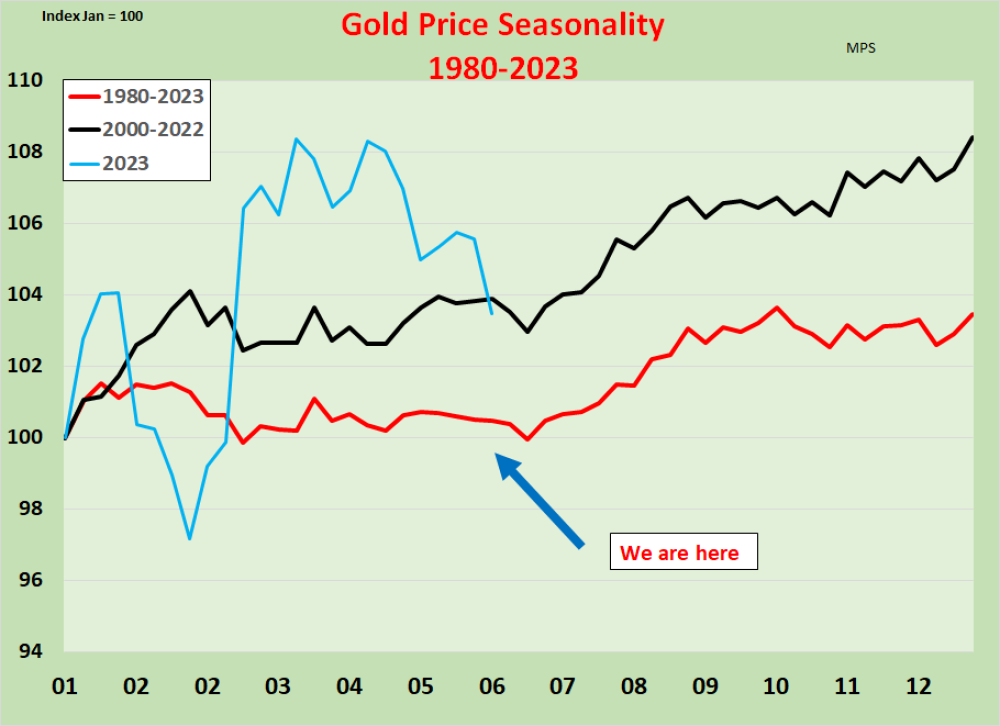
    • Seasonally slow in May-June but stronger into July and beyond
  • Gold Stocks
    • Sentiment falling away
    • Bargains on offer
    • Once in a decade opportunity here in smaller ASX Gold Stocks
  • Bonds
  • A major rally coming
  • Fed will follow market

Gold

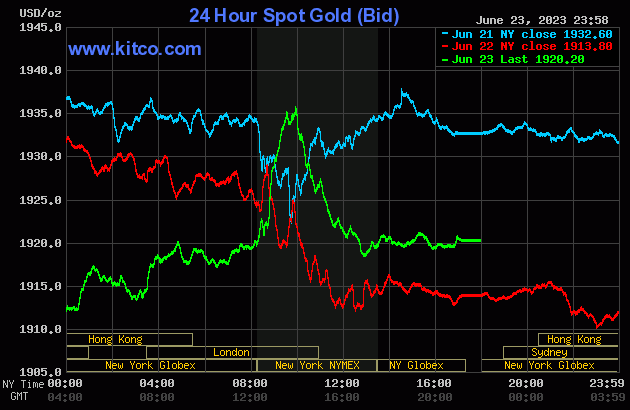
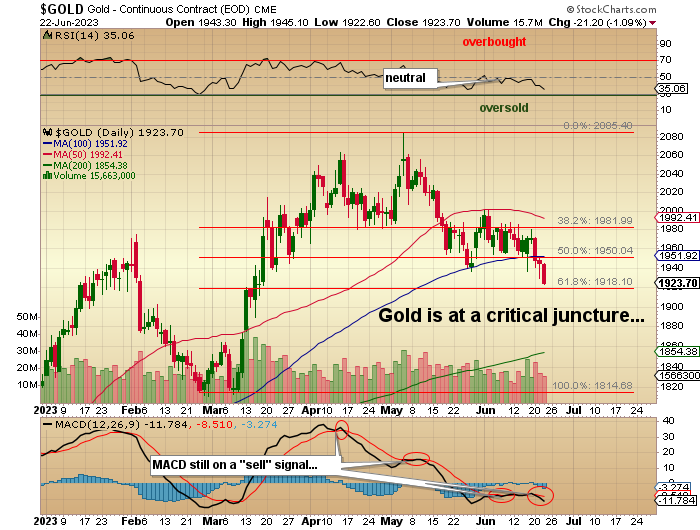
We have seen good volatility in gold as we reached the end of the June quarter. Gold is seasonally weak at this time, and so should be bottoming soon before rising in the September quarter.

There’s certainly a lot going on in U.S. politics, but it is becoming clear that the Biden criminal syndicate is now out in the open and seen for what it is. The criminal acts of the FBI and the DOJ extend into so many other federal and state administrations, and we are seeing that America is saying enough is enough.

Diversions from Russia and Ukraine shenanigans and undersea disasters won’t be enough to head this off.

A climax is coming soon, and it will be seen in the bond market, the currency, and the stock market. And, of course, the net effect will be a return to a gold standard to stop all these budget deficits caused by politicians buying votes.

Gold will be a major beneficiary.

Emerging market economies were big buyers of gold in 2022, and the first quarter of 2023 was an all-time record for central bank buying in a March Qtr. At the time of the end of the Bretton Woods Agreement in 1971, the reserves of central banks were made up of about 40% in gold, with the rest being the debt securities of various currencies but mostly US$.

Central banks currently have about 16% in gold and over 50% in US$ debt securities. It’s hard to imagine central banks being happy holding Euro debt securities which would have been financial disasters over the past couple of years. And none would enjoy holding Yen.

And then what else to hold?

As noted here before, a move to 40% gold for central bank reserves (currently around 38,000t) would require the purchase of another 4.000 tonnes gold priced around US$7,000/oz. It is coming and with a strong US$.

You saw the comment on the Yen last week. Euro next.

Gold is declining into this seasonal low which, on average, is only two weeks away.

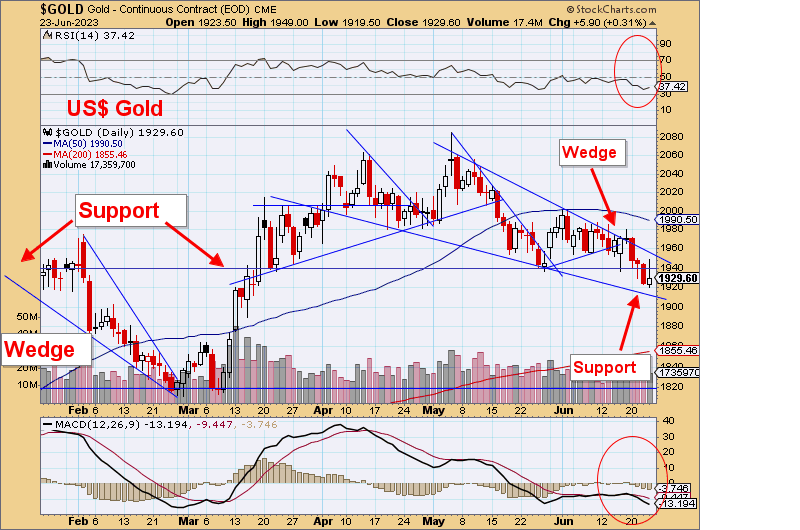
Gold in US$ has been very constructive in this declining wedge formation, so it will be very interesting to see how the seasonal aspects come into play here.

That intraday rally on Friday added to the appeal of this declining wedge which is probably now over three months old.

The longer the period, the more powerful the breakout.

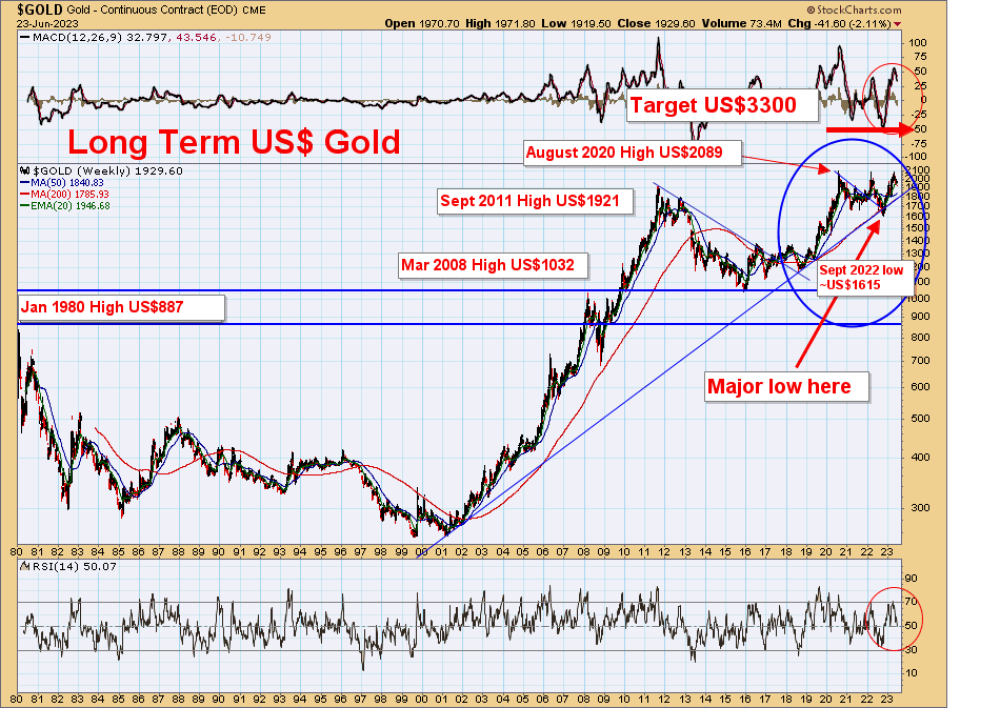
Longer term position for gold still is as powerful as ever.

We know with central bank buying and a pickup in interest in ETF gold that, the underlying demand for gold is strong.

It is only the banksters trying to hold it back.

Gold Stocks

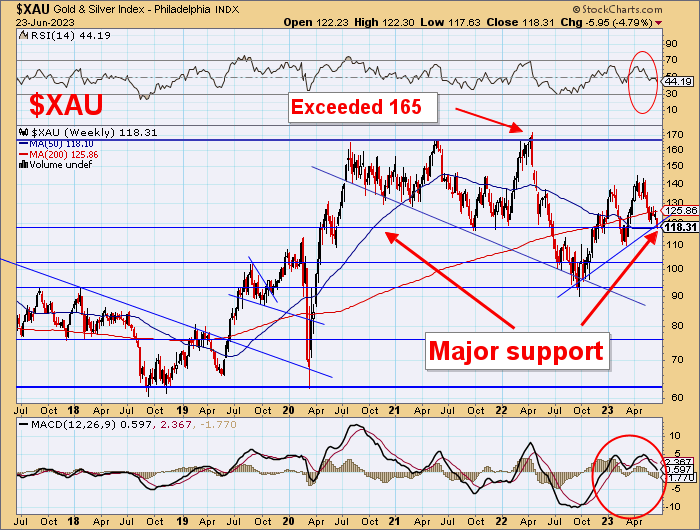
The XAU is back at important support around 118, and whilst the uptrend might be wonky, this has not been your typical unfettered technical market.

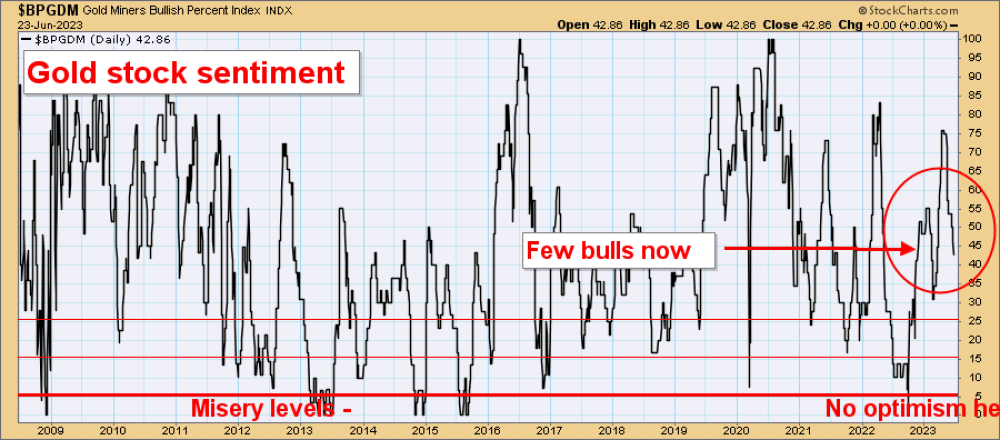
Sentiment for gold stocks is falling away toward the end of the Qtr.

So it is buying time.

ASX Gold Stocks

  • And it is buying time here
  • Tax loss selling provides bargains
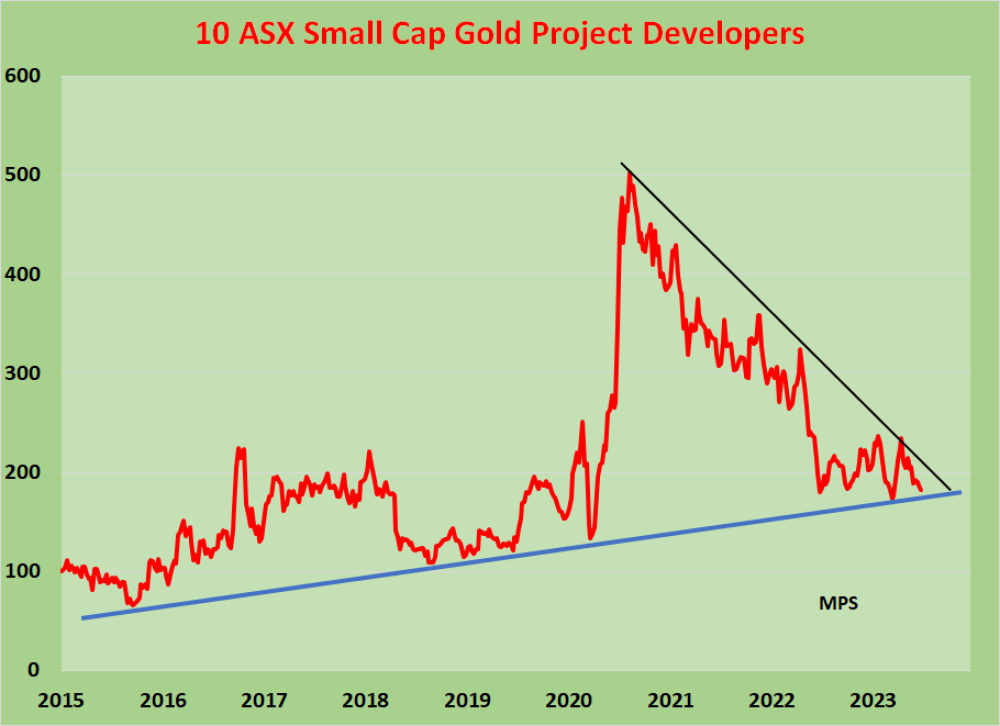
  • This index is currently down 64% from its high in August 2020
  • It is wedging nicely
  • The break upwards when it comes will be very strong

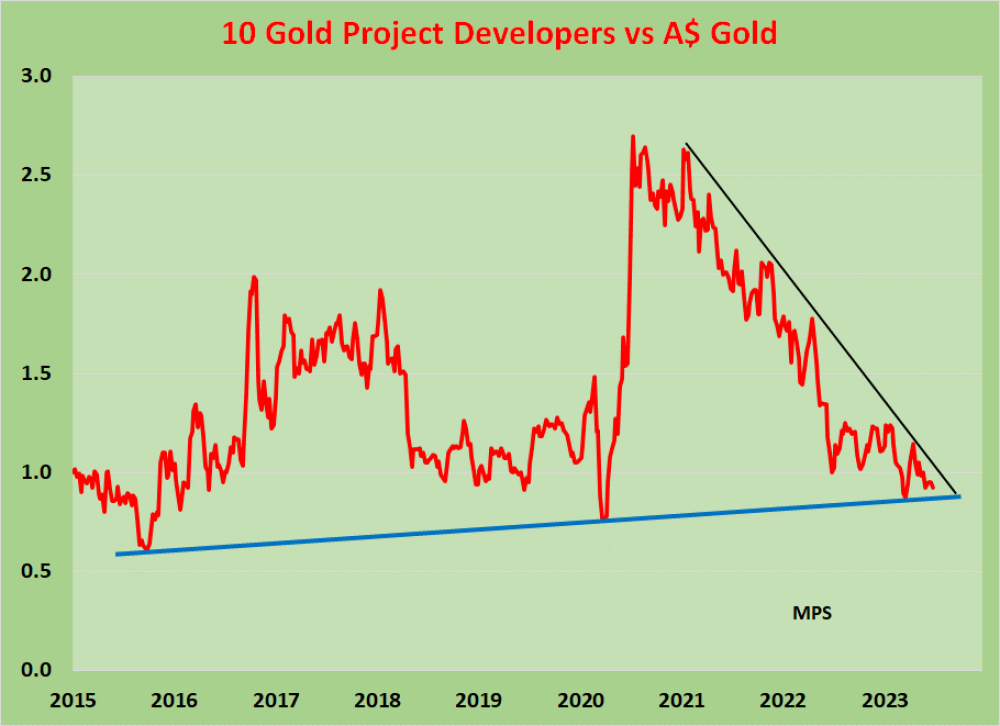
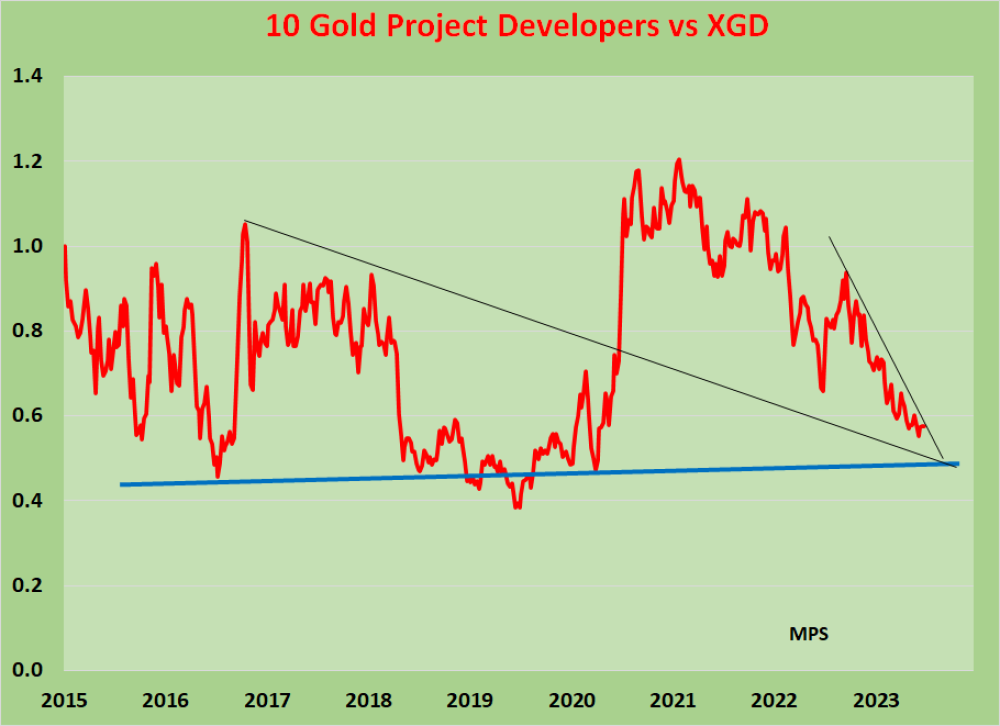
And these developers are down 66% against AU$ gold.

And down 50% against the ASX Gold Index.

All these are wedging with a strong uptrend, and a heavy downtrend suggests the bottom is close and the upturn will be very strong.

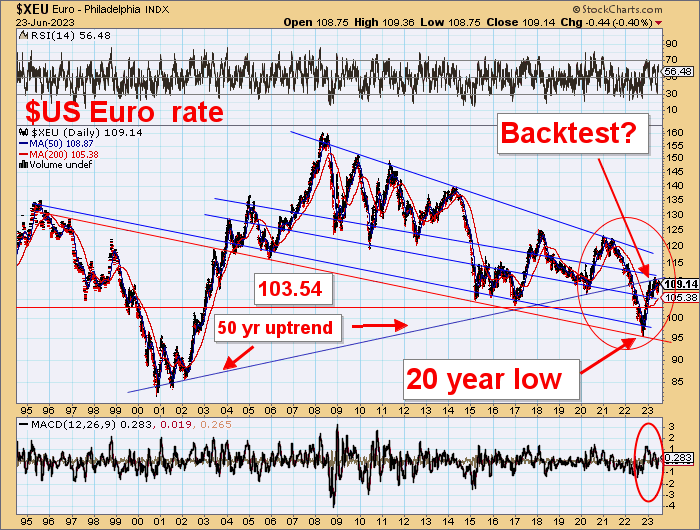
Oh, and did I mention that the Euro is next to fall over?

Timing is everything.

Heed the markets, not the commentators.


Important Disclosures:

  1. Statements and opinions expressed are the opinions of the author and not of Streetwise Reports or its officers. The author is wholly responsible for the validity of the statements. The author was not paid by Streetwise Reports for this article. Streetwise Reports was not paid by the author to publish or syndicate this article. Streetwise Reports requires contributing authors to disclose any shareholdings in, or economic relationships with, companies that they write about. Streetwise Reports relies upon the authors to accurately provide this information and Streetwise Reports has no means of verifying its accuracy.
  2. This article does not constitute investment advice. Each reader is encouraged to consult with his or her individual financial professional and any action a reader takes as a result of information presented here is his or her own responsibility. By opening this page, each reader accepts and agrees to Streetwise Reports’ terms of use and full legal disclaimer. This article is not a solicitation for investment. Streetwise Reports does not render general or specific investment advice and the information on Streetwise Reports should not be considered a recommendation to buy or sell any security. Streetwise Reports does not endorse or recommend the business, products, services or securities of any company mentioned on Streetwise Reports.

For additional disclosures, please click here.

Generational Revulsion

Source: Michael Ballanger  (6/26/23) 

Michael Ballanger of GGM Advisory Inc. looks at how newer generations are affecting the gold market, as well as new developments in the economy and TSX exchange.

As I begin to write this week’s missive, gold bullion prices are ahead US$17.50. After trading down to a low of US$1,919.85, which is a couple of dollars above the 61.8% Fibonacci retracement level, gold has since recovered nearly US$50/ounce, which has the Twitter gold bugs aflutter in expectation of US$10,000 gold and US$400 silver. (Surely, he jests!)

In earlier times, I would also be one of those afluttering at the sharp price jump with the absolute certainty that the “powers that be” had finally seen the light and were finally embracing gold for its rightful role as “protector of savings” from the ravages of government waste and corruption. The duty of all governments should be to protect the purchasing power of people’s savings through responsible stewardship of sovereign finances. Still, over the past fifty years, re-election to the office by spending taxpayer money on prospective voters has replaced fiscal prudence, and that led to massive, global currency debasement.

With gold up US$17.50 an ounce, is it not proof positive that global attitudes have finally shifted? (Surely, he jests again!)

The Younger Generations and Gold

We, old people, tend to look at this younger breed of investors as if they are clueless, uneducated, ADHD-afflicted videogame junkies that are far more sheep than shepherds and prone to mass mania susceptibility due to their obsessions with social media trends.

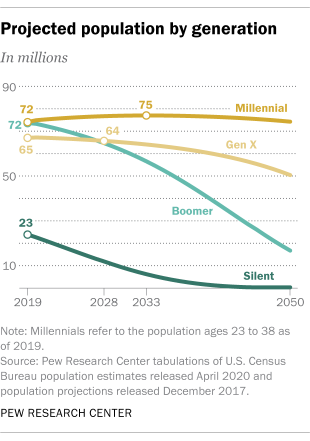
Nothing could be farther from the truth. From what I have learned in recent weeks delving into the world of Millennials and Generation X-ers’ investment trends, these two demographics are distinctly more pragmatic than their predecessor generation — the Baby Boomer Generation — and as such, take a “Buy what’s working” attitude to investing as opposed to “Buy what isn’t working now but will work when the world wakes up” investment style.

History would prove that the North American investor has been riding a wave of bullish enthusiasm that began post-WII and which stalled in the 1970s just as the children of the recently-returned soldiers were reaching young adulthood.

The Baby Boomer Generation stopped the Viet Nam war through protests in the 1970s, and once they put away their bell-bottomed jeans and love beads for pin-striped suits and Brooks Brothers shoes, markets have not looked back.

The maturation of the largest generation of people ever created in the history of mankind brought about an ever-increasing demand for new products and new technology.

And it was largely to thank for a growth era that went largely uninterrupted for almost twenty years.

The problems started to creep up when the internet bubble imploded in 2001.

Ever since, the incessant demands of the boomers created an unhealthy creep of political malfeasance and fiscal compromise.

The boomers sucked the air out of any room they entered, and it did not go unnoticed by the younger generations, the largest of which is now the Millennials and will be joined by the Generation-Xer’s by the end of the decade.

I find it fascinating that these younger, more pragmatic souls refuse to enter into intelligent speculations on precious metals but move hog-wild on cryptocurrencies as the replacement for fiat currencies despite growing regulatory scrutiny and a distinctly hostile disposition by government regulators.

Boomers such as this author have long been enraged by similar interference in the metals markets through coordinated interventions in the paper markets like the Chicago Board of Trade or the Crimex.

And yet we still invest in gold and silver thinking (perhaps erroneously) that 5,000 years of safe haven replacements for hoarding cash representing the “full faith and credit of government” is sufficient justification for ownership, not to mention amassing, hoarding, and shameless stacking.

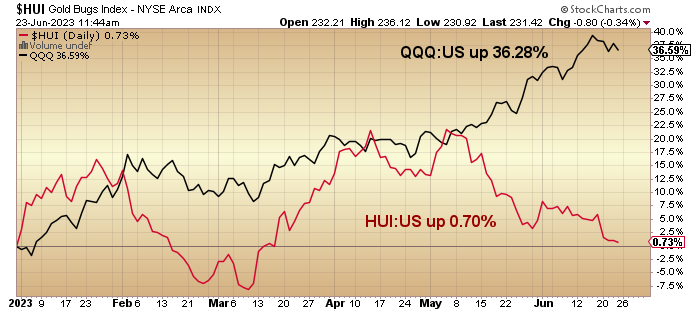
The “kiddies” (as I love to call them), many of which are now in their 40s and certainly not babies anymore, have learned over time that to own “what is working” means that they can buy Bitcoin (circa 2018) and a few tech stocks (through the QQQ’s) and let Zayde and Bubbe (Yiddish for Grandpa and Grandma) buy “what is NOT working (and hasn’t been since August/2020) like Newmont Gold and Foofoo Mines. The result shown above might be considered unfair because it excludes 2022 when crypto and tech got slaughtered, but then again, gold and silver did nothing then either.

I have been writing about gold and silver since the 1980s. Still, rather than evolving into a card-carrying gold bug complete with a megaphone, tinfoil hat, and multiple crying towels, I evolved into a pragmatist that has been able to sidestep the PMs from time to time in favor of other resource plays.

From what I have learned in recent weeks delving into the world of Millennials and Generation X-ers’ investment trends, these two demographics are distinctly more pragmatic than their predecessor generation — the Baby Boomer Generation — and as such, take a “Buy what’s working” attitude to investing as opposed to “Buy what isn’t working now but will work when the world wakes up” investment style.

Unfortunately, I was too incredibly smart to see that the electrification movement was going to benefit lithium over copper as the lithium stocks, despite correcting since 2022, continue to be the darlings of the resource stock universe.

If there is one significant takeaway from my musings this morning, it is that I wish I could find that memory-erasing gadget from Men in Black where Tommy Lee Jones can make entire crowds forget that a giant cockroach just emerged from the body of a tow-truck driver.

I would stand in front of a full-length mirror and ZAP! myself into forgetting I ever owned Consolidated Stikine, a junior gold explorer that went from CA$0.15 in early 1988 to over CA$70 per share by 1989 after discovering the massive Eskay Creek gold-silver deposit.

Then, I would conger up recollections of the mighty Voisey’s Bay discovery in NE Labrador in 1993, stare into the mirror, and ZAP! erase all vestiges of the move in Diamondfield Resources from pennies to over US$42.50 (after a 4:1 split). Then, and only then, could I return to uncluttered investing where I can buy “what’s working” — you know — hop in the shower and lather up on Nvidia or Tesla or into the hot tub with a tankard full of Microsoft ale or Bitcoin Beer.

Take out my cell phone and get up-to-the-microsecond updates on which pink sheet meme stock is about to be taken up by the flock of Millennials in charge of the pump.

If you all detect a trace of sarcasm in the preceding paragraph, please forgive me. I am a victim of my own success and a prisoner of my sexagenarian memory. As was phrased by one of my all-time favorite comedians of the old Borsht Belt circuit, Rodney Dangerfield, “It ain’t easy bein’ me!” (No jest intended.)

Recession

The decade of the 1980s started off with a stock market that bottomed with the Dow Jones Industrials just under 800 and after a two-year recession brought on by the inflation-fighting antics of Paul (I Hate Gold) Volcker, jump-started one of the truly great growth stock revivals in modern history. Technology stocks included IBM and Digital Electric and were about as exciting in 1985 as Barrick Gold in 2023. It was only in the mid-80s, when Japan’s Sony developed the Nintendo videogame console, that technology exploded.

With the arrival of technology came the downfall of leisure time reading or listening to the phonograph or stereo to the serene incantations of David Gilmour’s guitar in Pink Floyd’s Dark Side of the Moon album, which demanded a “record player” rather than ear buds and a cellphone. “Eliminating bosses” at various levels of RPGs (role-playing games) replaced sandlot games of “workup’s baseball” or road hockey as preadolescent youth embarked on a journey of a cerebral rather than sensual nature of experimentation and discovery.

If every major hedge fund in New York and Connecticut owns Nvidia at 1,100-times sales, then we all better own it before the month-end report goes out to unitholders when all of the career-ending comparisons will be drawn.

When I was in the investment business in the 1980s, a site visit involved going 300 meters down into an old gold mine that had just been de-watered, seeing an old Toronto Telegram front page from 1966 lying beside an older snub-nosed coke bottle at the end of a mine “drift” was quite the experience.

Today, there are no site visits because insurance companies would never allow it. The kids that now run the operations would never allow prospective investors to cross the line of yellow tape as their grampas did. “Turning a blind eye” was commonplace because pragmatism had to supersede policy in order to advance the course of good business.

The art of due diligence is conducted somewhat differently today as the term “liquidity” is now seen as the main driver of stock prices in contrast to “fundamentals” like earnings or debt-to-equity ratios or competition. If every major hedge fund in New York and Connecticut owns Nvidia at 1,100 times sales, then we all better own it before the month-end report goes out to unitholders when all of the career-ending comparisons will be drawn. Same with the QQQ’s or the Russell 2000 (small-caps) as investors scramble to be invested in the “safety-in-numbers” pool rather than in the “out-and-without” pool of “big fat loser” ignonimity.

I look at the current 2-and-10-year yield curve, and I have only one thought: RECESSION.

At least from the point of view of historians/economists (like my colleague David Chapman @Davcha12 who has forgotten more than I will ever know about markets), it is certainly noteworthy that this recent spike in the 2-year and 10-year yield spread (the “yield curve”) came on the heels of the 50 basis-point hike by the BOE.

Spreads like this have in the past been a dyed-in-the-wool omen of impending economic recession but, like the current foo-fah-fah over the sudden and unexpected arrival of an “official bull” with the SPX recently printing a 20% advance off the October lows, they are simply “noteworthy,” just as the arrival of the inverted yield curve back in July/22 was screaming recession, here we are nearly a year later and still no signs of a recession. Maybe the recent highs in the SPX confirmed that the “official bull” should be treated as a “sell signal,” just as the arrival of the “official bear” was a near-perfect “buy signal” back on October 14.

The TSX Venture Exchange did the unthinkable this week and closed below the psychological 600 level, once again making it the laughing stock of the global exchanges.

I am today confronted with the dilemma of whether or not to trust the historical predictive powers of the inverted yield curve (where short rates yield more than long rates) because if we are NOT going to see a weaker economy and softer earnings, then stocks are cheap.

However, if the reverse is true and darker times are on the way, then I do not wish to be an owner of stocks or commodities in H2/2023.

In fact, I will be kicking myself for not trusting the fact that the “weighted” SPX is dismally underperforming the “unweighted” SPX, which is a classic case of horrid market breadth which used to be a stalwart in determining whether markets that appeared strong were actually internally weak which always leads to a selloff.

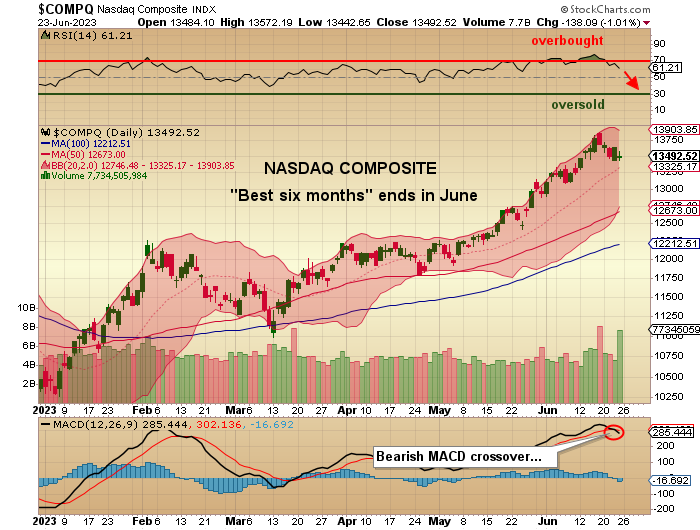
With the inverted yield curve at minus .97 and now approaching the extreme negative 2-10 spread at minus 1.02 from last March, the stage is set for a rollover of the tech sector, and I base that on the “Best Six Months” seasonality for the NASDAQ which typically ends in June and with the MACD Indicator issuing a “sell signal” today, we could be entering not a “summer rally” but rather a “summer correction” that will clip the underpinnings from all of this bullish sentiment that is urging everyone to disregard the Fed as being “no longer relevant.”

Well, they are truly “relevant” when they are cutting rates and buying MBS by the billions in order to resurrect stocks, but only when they are hostile do Wall Street and CNBC enjoy calling them “irrelevant.”

With the NASDAQ now officially rolling over, the QQQ’s are right behind, and since I am short the QQQ via a limited-risk position in the July put options, a 10% correction in these bubbly AI stock would certainly torpedo the summer rejoicing for more than a few of the Muskoka or Hamptons “flock.” However, it makes sense to expect and to benefit from a period of overdue profit-taking (and pain) without disturbing the longer-term positive trend confirmed by the bullish results of the January Barometer.

After all, there was a time not so long ago when 10% corrections were welcomed without hedge fund managers and CNBC anchors breaking into tears while demanding that the Fed “DOES SOMETHING!”

TSX Exchange Does the Unthinkable

The TSX Venture Exchange did the unthinkable this week and closed below the psychological 600 level, once again making it the laughing stock of the global exchanges. The only comparable exchange against which to measure performance is the U.S. Russell 2000, a small-cap index of non-earning corporate “hopefuls” that are in the same speculative category as the resource-based TSXV.

Surprisingly, while AI stocks and the NASDAQ have been dominating the narrative in a positive manner, the majority of higher-risk U.S. stocks have not fared as well as the TSX Venture Exchange. The TSXV is up 5.55% YTD, while the Russell 2000 is up only 3.85% YTD.

Both are pathetically underperforming relative to the NASDAQ, up 30.79% YTD, and the QQQ’s, up 20.93% YTD. Within the latter two vehicles, the bulk of the gains are narrow and concentrated in AI-related companies. So, for those of you that are feeling left behind by the “big U.S. tech rally,” the Russell 2000 and the blue-chip Dow Jones Industrials are neck-and-neck in performance, with the Russell nose ahead of the Dow, up a paltry 3.47% YTD thus illustrating just how bifurcated the investment landscape has become and how difficult it is to show consistent returns.

From where I sit, all the TSXV needs is a declining U.S. dollar leading to a commodity rally, the source of which can only happen if the trend of “real” interest rates (10-year yield minus CPI) trends negatively. In recent months, rising rates and moderating inflation has the yield on the UST 2-year at 4.71%, with the core CPI now down to 4.1%. In other words, “real” interest rates are trending positively at 0.61%, and if the Fed continues to hike and the U.S. economy continues to slow, the outcome favorable to commodities will be elusive.

You have heard me use the expression, “Never underestimate the replacement power of stocks within an inflationary spiral,” and the reason that works lies in the collateral that underpins the Fed’s beloved banking system.

You have heard me use the expression, “Never underestimate the replacement power of stocks within an inflationary spiral,” and the reason that works lies in the collateral that underpins the Fed’s beloved banking system.

Most of the suspect loans on the banks’ books have commercial real estate as collateral, and with office occupancy rates forcing commercial borrowers to throw back the keys, banks are going to need the replacement value of those empty skyscrapers to get an adrenalin injection from Grandpa Fed, and they are needing it now.

This is why stocks hate “deflation” and why banks are the purveyors of most of the inflation that is needed to shore up collateral and sanitize their loan books. Gold works in a deflationary environment because it has no master; its value is determined outside of the banking system. For this reason, if gold gets a sniff of a Fed initiative to lower interest rates or if it sees a pickup in the CPI without Fed opposition, it will scream to new highs before one can yell “transitory!”

So, given the state of commercial real estate and those dastardly loan books, my money is on an accident in one of the big U.S. cities related to defaults that lead to panic at the Fed that, in turn, leads to a series of emergency rate cuts that flips the interest rate regime from positive back to negative with precious metals the initial beneficiaries, just as they were in the months immediately after the 2008 bank bailouts and after the COVID crash triggered that unprecedented display of fiscal and monetary insanity that has caused the current inflationary mess upon which we are currently impaled.

My list of junior resource stocks is again forcing me to ignore my doctor’s orders and reach for the finely-aged bottle of single malt that, I am told, might kill me if taken to excess, given my age and temperament. However, I had to explain to him that stress is just as lethal as booze, and because I am holding all of these highly-promising junior resource deals as a means of ensuring that his bill will be paid, I might as well down a few belts of Glenfiddick each night to fight off the stress associated with these $%^%$$% juniors. Either that or sell the juniors.

Hmmm, I hadn’t thought of that. . .


Important Disclosures:

  1. Statements and opinions expressed are the opinions of the author and not of Streetwise Reports or its officers. The author is wholly responsible for the validity of the statements. The author was not paid by Streetwise Reports for this article. Streetwise Reports was not paid by the author to publish or syndicate this article. Streetwise Reports requires contributing authors to disclose any shareholdings in, or economic relationships with, companies that they write about. Streetwise Reports relies upon the authors to accurately provide this information and Streetwise Reports has no means of verifying its accuracy.
  2. This article does not constitute investment advice. Each reader is encouraged to consult with his or her individual financial professional and any action a reader takes as a result of information presented here is his or her own responsibility. By opening this page, each reader accepts and agrees to Streetwise Reports’ terms of use and full legal disclaimer. This article is not a solicitation for investment. Streetwise Reports does not render general or specific investment advice and the information on Streetwise Reports should not be considered a recommendation to buy or sell any security. Streetwise Reports does not endorse or recommend the business, products, services or securities of any company mentioned on Streetwise Reports.

For additional disclosures, please click here.

Michael Ballanger Disclosures

This letter makes no guarantee or warranty on the accuracy or completeness of the data provided. Nothing contained herein is intended or shall be deemed to be investment advice, implied or otherwise. This letter represents my views and replicates trades that I am making but nothing more than that. Always consult your registered advisor to assist you with your investments. I accept no liability for any loss arising from the use of the data contained on this letter. Options and junior mining stocks contain a high level of risk that may result in the loss of part or all invested capital and therefore are suitable for experienced and professional investors and traders only. One should be familiar with the risks involved in junior mining and options trading and we recommend consulting a financial adviser if you feel you do not understand the risks involved.


Copper Speculators raise their bets into first bullish position in 9 weeks

By InvestMacro

Here are the latest charts and statistics for the Commitment of Traders (COT) data published by the Commodities Futures Trading Commission (CFTC).

The latest COT data is updated through Tuesday June 20th and shows a quick view of how large traders (for-profit speculators and commercial entities) were positioned in the futures markets.

Weekly Speculator Changes led by Palladium & Gold

The COT metals markets speculator bets were higher this week as four out of the six metals markets we cover had higher positioning while the other two markets had lower speculator contracts.

Leading the gains for the metals was Copper (14,794 contracts) with Gold (2,766 contracts), Palladium (501 contracts) and Steel (175 contracts) also showing positive weeks.

The markets with declines in speculator bets for the week were Silver (-3,678 contracts) and Platinum (-2,500 contracts) having lower bets on the week.

Copper Speculators raise their bets into first bullish position in 9 weeks

Highlighting the COT metals data this week is the gains for the Copper speculative positions. The large speculator position in Copper futures rose by +14,794 contracts this week following a gain by +13,050 contracts last week. The speculator position has now risen by over +37,590 contracts in total over the past three weeks.

This renewed positive sentiment has brought the net position standing back into a small bullish level after spending the past eight weeks in bearish territory.

Despite the bullish return of speculators, Copper prices closed out the week lower following three straight weeks of gains. The futures price touched a six-week high on Thursday at 3.967 before turning lower and finishing the week at 3.8035.


Data Snapshot of Commodity Market Traders | Columns Legend
Jun-20-2023
OI
OI-Index
Spec-Net
Spec-Index
Com-Net
COM-Index
Smalls-Net
Smalls-Index
Gold438,0377162,97549-186,5375223,56239
Copper204,399461,88832-4,003682,11532
Silver152,6334020,05847-36,2105016,15256
Platinum69,4367019,47261-25,052425,58043
Palladium12,30487-6,63557,21496-5797


Strength Scores led by Steel & Platinum

COT Strength Scores (a normalized measure of Speculator positions over a 3-Year range, from 0 to 100 where above 80 is Extreme-Bullish and below 20 is Extreme-Bearish) showed that Steel (68 percent) and Platinum (61 percent) lead the metals markets this week.

On the downside, Palladium (5 percent) comes in at the lowest strength level currently and is in Extreme-Bearish territory (below 20 percent).

Strength Statistics:
Gold (48.8 percent) vs Gold previous week (47.6 percent)
Silver (46.9 percent) vs Silver previous week (52.1 percent)
Copper (32.5 percent) vs Copper previous week (19.7 percent)
Platinum (60.5 percent) vs Platinum previous week (66.3 percent)
Palladium (4.6 percent) vs Palladium previous week (0.0 percent)
Steel (67.8 percent) vs Palladium previous week (67.3 percent)

Copper & Steel top the 6-Week Strength Trends

COT Strength Score Trends (or move index, calculates the 6-week changes in strength scores) showed that Copper (23 percent) and Steel (6 percent) lead the past six weeks trends for metals.

Platinum (-20 percent), Silver (-18 percent) and Gold (-14 percent) lead the downside trend scores currently.

Move Statistics:
Gold (-14.5 percent) vs Gold previous week (-15.6 percent)
Silver (-17.6 percent) vs Silver previous week (-11.7 percent)
Copper (23.1 percent) vs Copper previous week (7.6 percent)
Platinum (-19.9 percent) vs Platinum previous week (-10.9 percent)
Palladium (-9.1 percent) vs Palladium previous week (-6.4 percent)
Steel (5.9 percent) vs Steel previous week (4.5 percent)


Individual Markets:

Gold Comex Futures:

Gold Futures COT ChartThe Gold Comex Futures large speculator standing this week resulted in a net position of 162,975 contracts in the data reported through Tuesday. This was a weekly lift of 2,766 contracts from the previous week which had a total of 160,209 net contracts.

This week’s current strength score (the trader positioning range over the past three years, measured from 0 to 100) shows the speculators are currently Bearish with a score of 48.8 percent. The commercials are Bullish with a score of 51.9 percent and the small traders (not shown in chart) are Bearish with a score of 39.0 percent.

Price Trend-Following Model: Weak Uptrend

Our weekly trend-following model classifies the current market price position as: Weak Uptrend. The current action for the model is considered to be: Hold – Maintain Long Position.

Gold Futures StatisticsSPECULATORSCOMMERCIALSSMALL TRADERS
– Percent of Open Interest Longs:52.327.710.8
– Percent of Open Interest Shorts:15.170.35.4
– Net Position:162,975-186,53723,562
– Gross Longs:229,308121,41947,402
– Gross Shorts:66,333307,95623,840
– Long to Short Ratio:3.5 to 10.4 to 12.0 to 1
NET POSITION TREND:
– Strength Index Score (3 Year Range Pct):48.851.939.0
– Strength Index Reading (3 Year Range):BearishBullishBearish
NET POSITION MOVEMENT INDEX:
– 6-Week Change in Strength Index:-14.513.9-7.9


Silver Comex Futures:

Silver Futures COT ChartThe Silver Comex Futures large speculator standing this week resulted in a net position of 20,058 contracts in the data reported through Tuesday. This was a weekly lowering of -3,678 contracts from the previous week which had a total of 23,736 net contracts.

This week’s current strength score (the trader positioning range over the past three years, measured from 0 to 100) shows the speculators are currently Bearish with a score of 46.9 percent. The commercials are Bullish with a score of 50.0 percent and the small traders (not shown in chart) are Bullish with a score of 56.3 percent.

Price Trend-Following Model: Weak Uptrend

Our weekly trend-following model classifies the current market price position as: Weak Uptrend. The current action for the model is considered to be: Hold – Maintain Long Position.

Silver Futures StatisticsSPECULATORSCOMMERCIALSSMALL TRADERS
– Percent of Open Interest Longs:34.430.118.5
– Percent of Open Interest Shorts:21.353.87.9
– Net Position:20,058-36,21016,152
– Gross Longs:52,54745,94128,208
– Gross Shorts:32,48982,15112,056
– Long to Short Ratio:1.6 to 10.6 to 12.3 to 1
NET POSITION TREND:
– Strength Index Score (3 Year Range Pct):46.950.056.3
– Strength Index Reading (3 Year Range):BearishBullishBullish
NET POSITION MOVEMENT INDEX:
– 6-Week Change in Strength Index:-17.612.113.0


Copper Grade #1 Futures:

Copper Futures COT ChartThe Copper Grade #1 Futures large speculator standing this week resulted in a net position of 1,888 contracts in the data reported through Tuesday. This was a weekly rise of 14,794 contracts from the previous week which had a total of -12,906 net contracts.

This week’s current strength score (the trader positioning range over the past three years, measured from 0 to 100) shows the speculators are currently Bearish with a score of 32.5 percent. The commercials are Bullish with a score of 68.3 percent and the small traders (not shown in chart) are Bearish with a score of 31.8 percent.

Price Trend-Following Model: Downtrend

Our weekly trend-following model classifies the current market price position as: Downtrend. The current action for the model is considered to be: Hold – Maintain Short Position.

Copper Futures StatisticsSPECULATORSCOMMERCIALSSMALL TRADERS
– Percent of Open Interest Longs:31.742.48.2
– Percent of Open Interest Shorts:30.744.47.2
– Net Position:1,888-4,0032,115
– Gross Longs:64,74086,76116,759
– Gross Shorts:62,85290,76414,644
– Long to Short Ratio:1.0 to 11.0 to 11.1 to 1
NET POSITION TREND:
– Strength Index Score (3 Year Range Pct):32.568.331.8
– Strength Index Reading (3 Year Range):BearishBullishBearish
NET POSITION MOVEMENT INDEX:
– 6-Week Change in Strength Index:23.1-19.7-19.0


Platinum Futures:

Platinum Futures COT ChartThe Platinum Futures large speculator standing this week resulted in a net position of 19,472 contracts in the data reported through Tuesday. This was a weekly reduction of -2,500 contracts from the previous week which had a total of 21,972 net contracts.

This week’s current strength score (the trader positioning range over the past three years, measured from 0 to 100) shows the speculators are currently Bullish with a score of 60.5 percent. The commercials are Bearish with a score of 41.7 percent and the small traders (not shown in chart) are Bearish with a score of 42.8 percent.

Price Trend-Following Model: Weak Uptrend

Our weekly trend-following model classifies the current market price position as: Weak Uptrend. The current action for the model is considered to be: Hold – Maintain Long Position.

Platinum Futures StatisticsSPECULATORSCOMMERCIALSSMALL TRADERS
– Percent of Open Interest Longs:49.128.312.9
– Percent of Open Interest Shorts:21.064.44.8
– Net Position:19,472-25,0525,580
– Gross Longs:34,05919,6828,936
– Gross Shorts:14,58744,7343,356
– Long to Short Ratio:2.3 to 10.4 to 12.7 to 1
NET POSITION TREND:
– Strength Index Score (3 Year Range Pct):60.541.742.8
– Strength Index Reading (3 Year Range):BullishBearishBearish
NET POSITION MOVEMENT INDEX:
– 6-Week Change in Strength Index:-19.915.415.7


Palladium Futures:

Palladium Futures COT ChartThe Palladium Futures large speculator standing this week resulted in a net position of -6,635 contracts in the data reported through Tuesday. This was a weekly gain of 501 contracts from the previous week which had a total of -7,136 net contracts.

This week’s current strength score (the trader positioning range over the past three years, measured from 0 to 100) shows the speculators are currently Bearish-Extreme with a score of 4.6 percent. The commercials are Bullish-Extreme with a score of 96.4 percent and the small traders (not shown in chart) are Bearish-Extreme with a score of 6.9 percent.

Price Trend-Following Model: Strong Downtrend

Our weekly trend-following model classifies the current market price position as: Strong Downtrend. The current action for the model is considered to be: Hold – Maintain Short Position.

Palladium Futures StatisticsSPECULATORSCOMMERCIALSSMALL TRADERS
– Percent of Open Interest Longs:20.567.29.6
– Percent of Open Interest Shorts:74.48.614.3
– Net Position:-6,6357,214-579
– Gross Longs:2,5258,2681,182
– Gross Shorts:9,1601,0541,761
– Long to Short Ratio:0.3 to 17.8 to 10.7 to 1
NET POSITION TREND:
– Strength Index Score (3 Year Range Pct):4.696.46.9
– Strength Index Reading (3 Year Range):Bearish-ExtremeBullish-ExtremeBearish-Extreme
NET POSITION MOVEMENT INDEX:
– 6-Week Change in Strength Index:-9.110.3-15.7


Steel Futures Futures:

Steel Futures COT ChartThe Steel Futures large speculator standing this week resulted in a net position of -1,855 contracts in the data reported through Tuesday. This was a weekly advance of 175 contracts from the previous week which had a total of -2,030 net contracts.

This week’s current strength score (the trader positioning range over the past three years, measured from 0 to 100) shows the speculators are currently Bullish with a score of 67.8 percent. The commercials are Bearish with a score of 32.0 percent and the small traders (not shown in chart) are Bearish with a score of 38.9 percent.

Price Trend-Following Model: Weak Uptrend

Our weekly trend-following model classifies the current market price position as: Weak Uptrend. The current action for the model is considered to be: Hold – Maintain Long Position.

Steel Futures StatisticsSPECULATORSCOMMERCIALSSMALL TRADERS
– Percent of Open Interest Longs:14.878.01.0
– Percent of Open Interest Shorts:21.571.80.4
– Net Position:-1,8551,710145
– Gross Longs:4,08521,522264
– Gross Shorts:5,94019,812119
– Long to Short Ratio:0.7 to 11.1 to 12.2 to 1
NET POSITION TREND:
– Strength Index Score (3 Year Range Pct):67.832.038.9
– Strength Index Reading (3 Year Range):BullishBearishBearish
NET POSITION MOVEMENT INDEX:
– 6-Week Change in Strength Index:5.9-6.422.1


Article By InvestMacroReceive our weekly COT Newsletter

*COT Report: The COT data, released weekly to the public each Friday, is updated through the most recent Tuesday (data is 3 days old) and shows a quick view of how large speculators or non-commercials (for-profit traders) were positioned in the futures markets.

The CFTC categorizes trader positions according to commercial hedgers (traders who use futures contracts for hedging as part of the business), non-commercials (large traders who speculate to realize trading profits) and nonreportable traders (usually small traders/speculators) as well as their open interest (contracts open in the market at time of reporting). See CFTC criteria here.