
By RoboForex Analytical Department
The precious metals sector continues to face challenges, as gold has experienced a meager 5.1% increase from January to June 2023. This growth pales in comparison to the indicators seen in the US stock markets. Currently, the price of one troy ounce of gold stands at $1917 as we enter the second half of the year.
One of the key factors weighing on XAUUSD is the upward trend in interest rates, particularly in the US. This trend leads to higher yields in US government bonds and a stronger USD exchange rate. Historically, gold prices have exhibited an inverse correlation with these indicators.
Technical Analysis of XAU/USD:
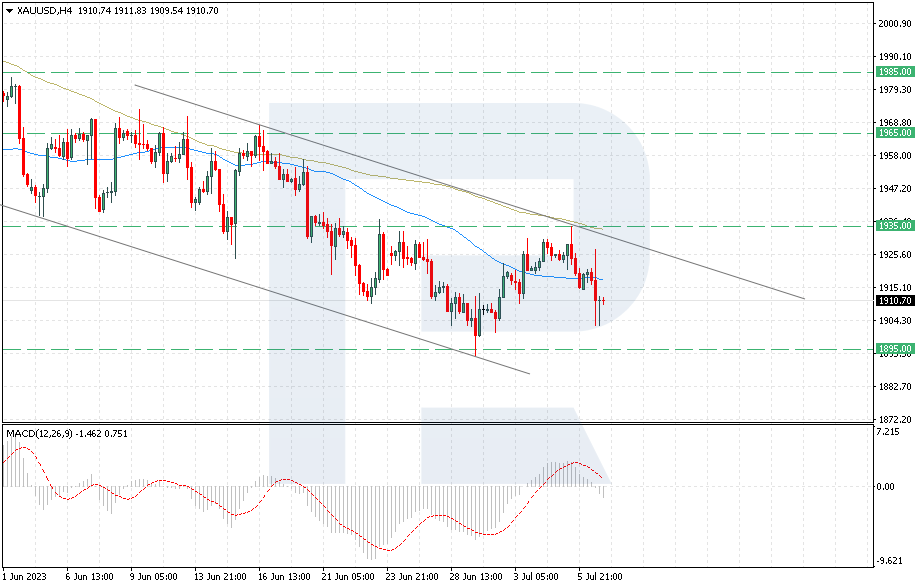
On the H4 XAU/USD chart, the price has once again rebounded from the moving averages, indicating the development of a bearish trend since May 22, 2023. This price behavior reinforces the strength of the current trend and the ongoing pressure from sellers. The closest support area lies at the level of 1895, and a breakout below this level would pave the way for a decline towards 1860. Technically, this scenario is supported by the MACD, as its signal line has moved out of the histogram area, signaling a decline and the continuation of the bearish trend. It is worth noting the formation of a bullish divergence signal on the MACD indicator on June 30, 2023, when the quotes reached 1935, and the signal was successfully executed.
Free Reports:
 Get our Weekly Commitment of Traders Reports - See where the biggest traders (Hedge Funds and Commercial Hedgers) are positioned in the futures markets on a weekly basis.
 Sign Up for Our Stock Market Newsletter – Get updated on News, Charts & Rankings of Public Companies when you join our Stocks Newsletter
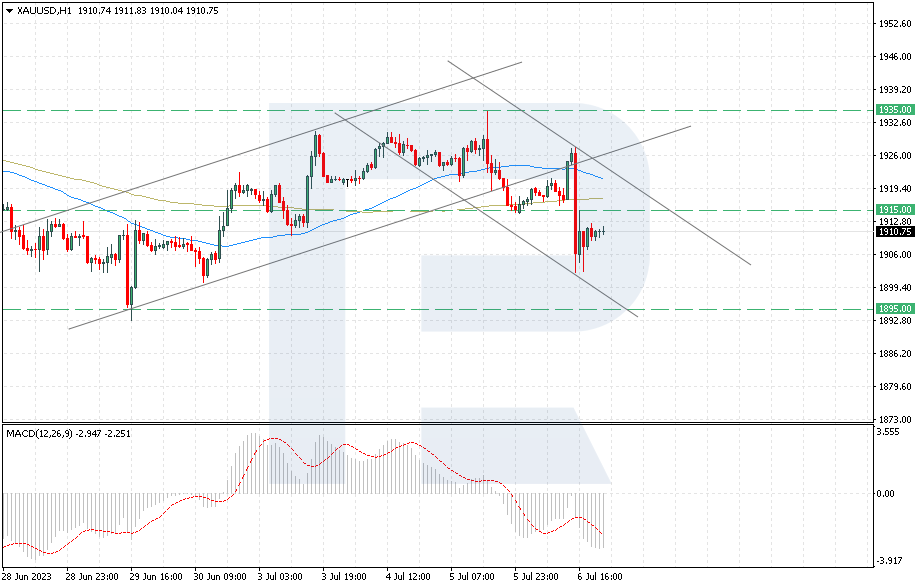
On the H1 XAU/USD chart, the quotes have broken out of the boundaries of the bullish correction channel. The price is currently below the 200-day moving average, indicating increasing pressure from sellers and a lack of upward movement in the market. There is still potential for a minor bullish correction, with a possible test of the 1915 level before a decline towards 1895 is expected. Technically, this scenario is confirmed by the MACD, as histogram bars have dropped below the July 5, 2023 minimum, nullifying the attempt to form a bullish divergence. A favorable scenario for sellers would be a breakout of the resistance area with the price consolidating above the 1920 level.
Disclaimer
Any forecasts contained herein are based on the author’s particular opinion. This analysis may not be treated as trading advice. RoboForex bears no responsibility for trading results based on trading recommendations and reviews contained herein.

- Geopolitical and macroeconomic conditions continue to pressure market sentiment Jul 20, 2026
- USD/JPY Poised to Continue Gains as Expensive Oil and Lack of Support Weigh on Yen Jul 20, 2026
- COT Metals Charts: Weekly Speculator Bets led by Copper & Steel Jul 18, 2026
- COT Bonds Charts: Weekly Speculator Bets led by 2-Year, SOFR 3M & 5-Year Bonds Jul 18, 2026
- COT Energy Charts: Weekly Speculator Bets led by Brent Oil & Heating Oil Jul 18, 2026
- COT Soft Commodities Charts: Weekly Speculator Bets led by Wheat, Corn & Soybean Meal Jul 18, 2026
- The Bank of Canada kept its interest rate unchanged. Platinum prices reached a three‑week high Jul 16, 2026
- Stock indices rose after the release of US inflation data. China’s GDP slowed sharply Jul 15, 2026
- GBP/USD Awaits Political News: What Will Happen Next Jul 15, 2026
- USD/JPY Holds at Highs: Pressure Lingers on Yen Jul 14, 2026