By InvestMacro
Here are the latest charts and statistics for the Commitment of Traders (COT) data published by the Commodities Futures Trading Commission (CFTC).
The latest COT data is updated through Tuesday November 12th and shows a quick view of how large traders (for-profit speculators and commercial entities) were positioned in the futures markets.
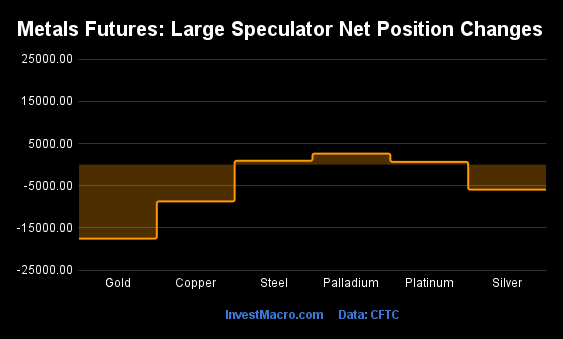
Weekly Speculator Changes led lower by Gold & Platinum
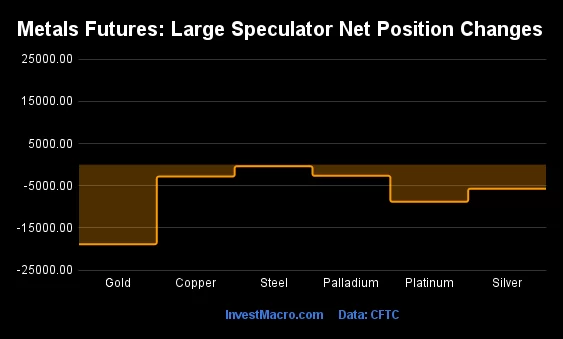
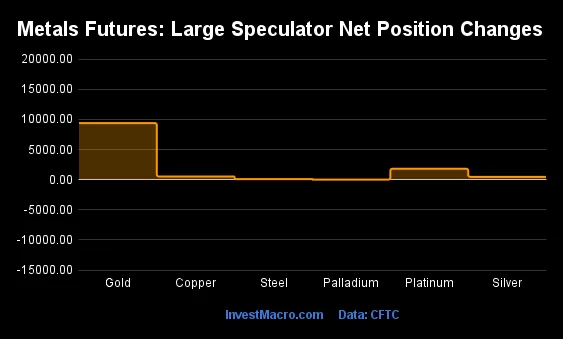
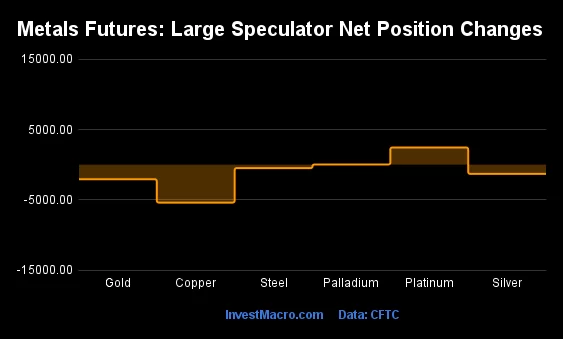
The COT metals markets speculator bets were lower this week as all of the six metals markets we cover lower speculator contracts.
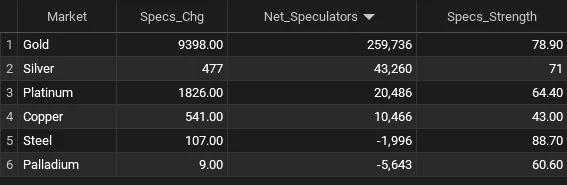
Leading markets with declines in speculator bets were Gold (-18,878 contracts) with Platinum (-8,808 contracts), Silver (-5,704 contracts), Copper (-2,825 contracts), Palladium (-2,646 contracts) and Steel (-394 contracts) also showing lower contracts for the week.
The metals markets have now seen multiple down weeks in a row with Copper recording six straight weeks of declines while Gold and Silver have fallen for three straight weeks of declines. Steel, Palladium and Platinum have also had two straight weeks of falling contracts as well. Despite the recent weakness, the metals markets are still in strong positions compared to their 3-Year ranges as all the markets have at least a 50 percent strength score or, in other words, the speculator positions are in the top half of their 3-Year ranges. Steel, Silver and Gold are in the top 70 percent of their ranges at the moment.
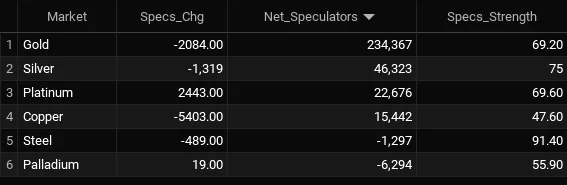
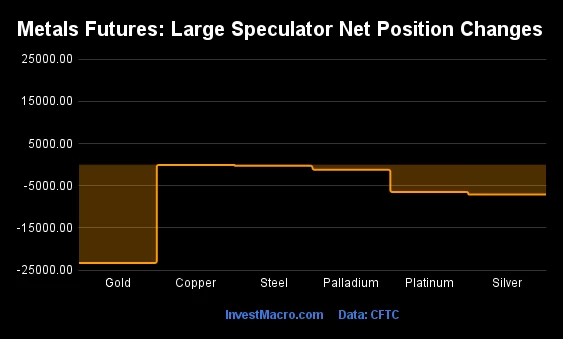
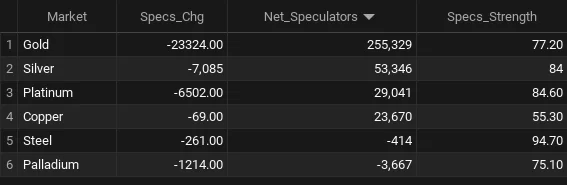
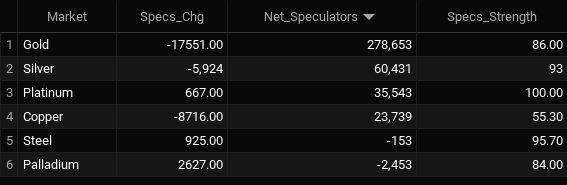
Metals Net Speculators Leaderboard
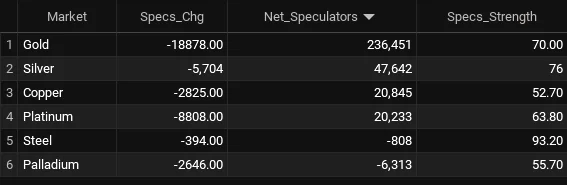
Legend: Weekly Speculators Change | Speculators Current Net Position | Speculators Strength Score compared to last 3-Years (0-100 range)
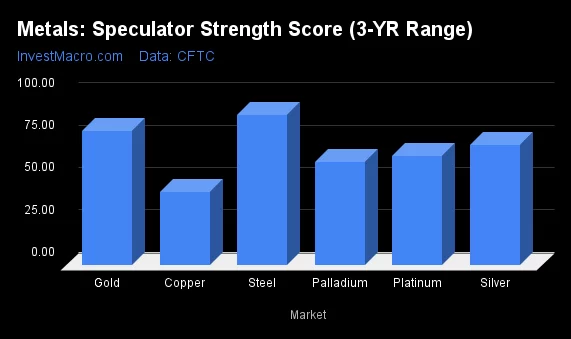
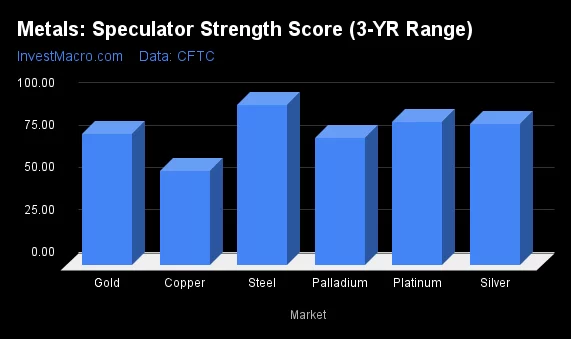
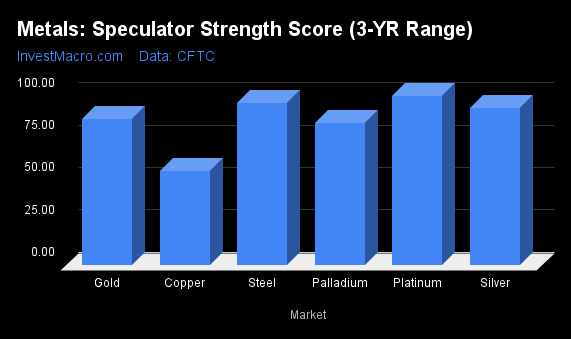
Strength Scores led by Steel & Silver
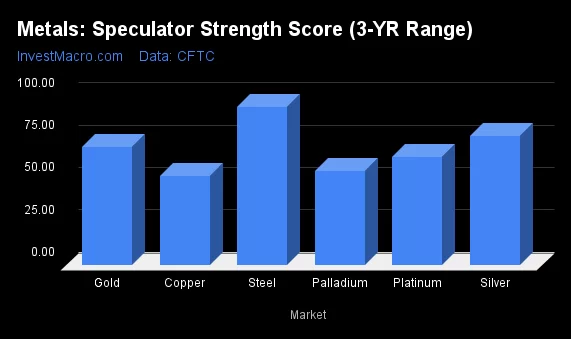
COT Strength Scores (a normalized measure of Speculator positions over a 3-Year range, from 0 to 100 where above 80 is Extreme-Bullish and below 20 is Extreme-Bearish) showed that Steel (93 percent) and Silver (76 percent) lead the metals markets this week. Gold (70 percent) comes in as the next highest in the weekly strength scores.
Copper (53 percent) comes in at the lowest strength level currently while the next lowest strength score was Palladium (56 percent).
Strength Statistics:
Gold (70.0 percent) vs Gold previous week (77.2 percent)
Silver (76.4 percent) vs Silver previous week (83.6 percent)
Copper (52.7 percent) vs Copper previous week (55.3 percent)
Platinum (63.8 percent) vs Platinum previous week (84.6 percent)
Palladium (55.7 percent) vs Palladium previous week (75.1 percent)
Steel (93.2 percent) vs Palladium previous week (94.7 percent)
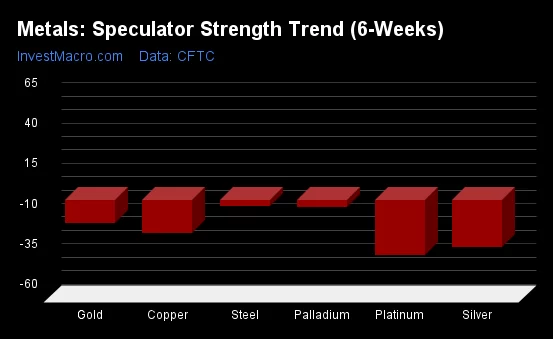
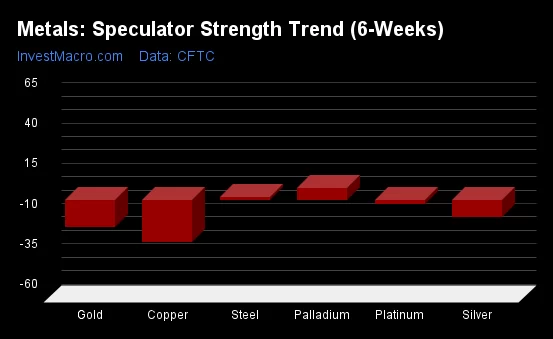
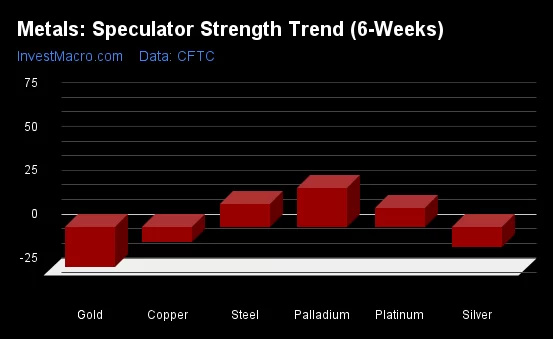
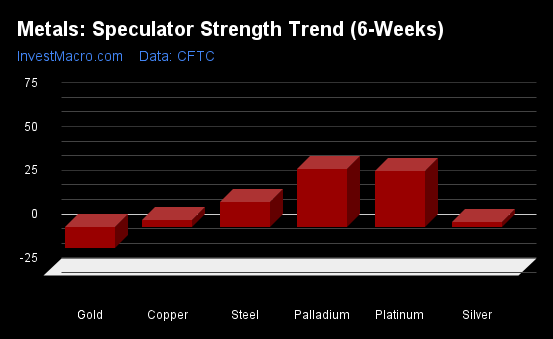
Palladium & Steel top the 6-Week Strength Trends
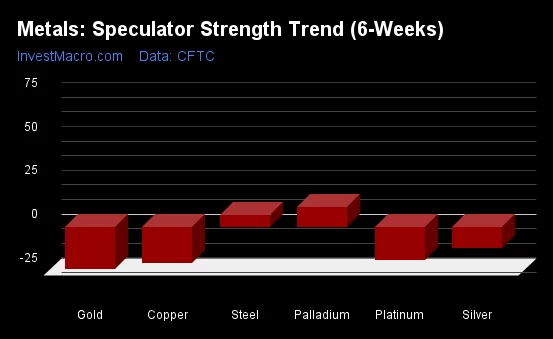
COT Strength Score Trends (or move index, calculates the 6-week changes in strength scores) showed that Palladium (11 percent) and Steel (7 percent) lead the past six weeks trends for metals.
Gold (-24 percent) leads the downside trend scores currently with Copper (-21 percent) and Platinum (-19 percent) as the next markets with lower trend scores.
Move Statistics:
Gold (-24.1 percent) vs Gold previous week (-22.8 percent)
Silver (-11.7 percent) vs Silver previous week (-11.2 percent)
Copper (-20.8 percent) vs Copper previous week (-8.8 percent)
Platinum (-18.7 percent) vs Platinum previous week (11.0 percent)
Palladium (11.4 percent) vs Palladium previous week (22.5 percent)
Steel (7.0 percent) vs Steel previous week (12.9 percent)
Individual Markets:
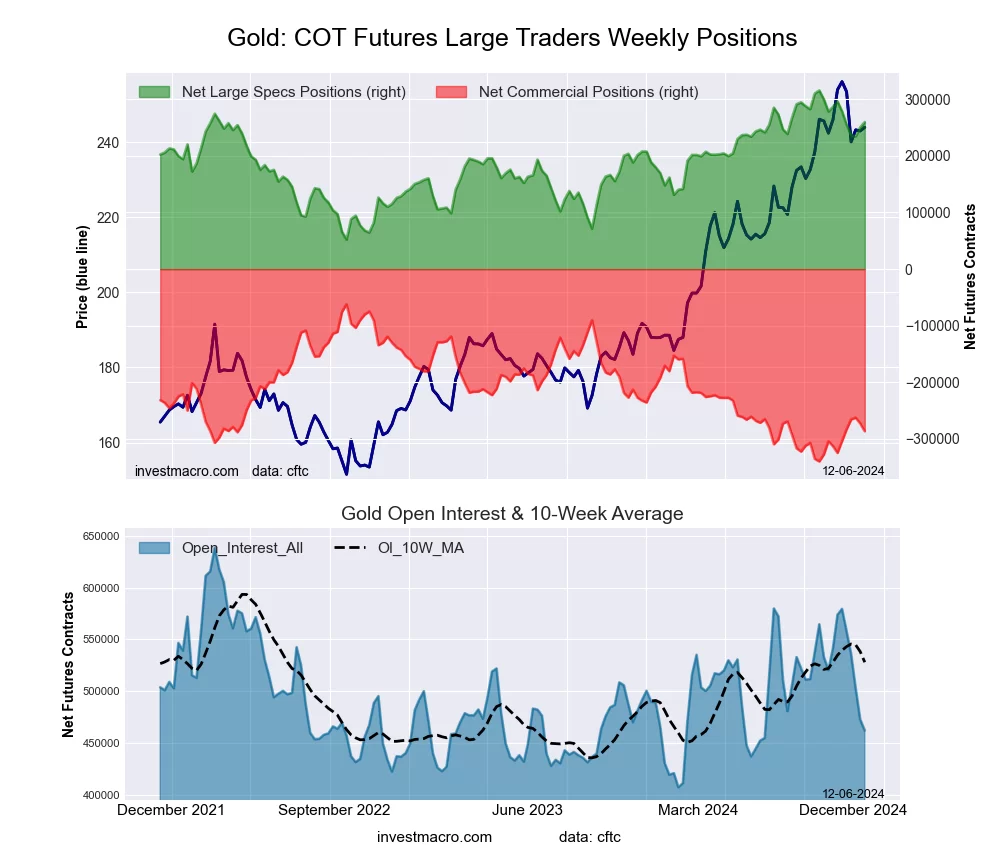
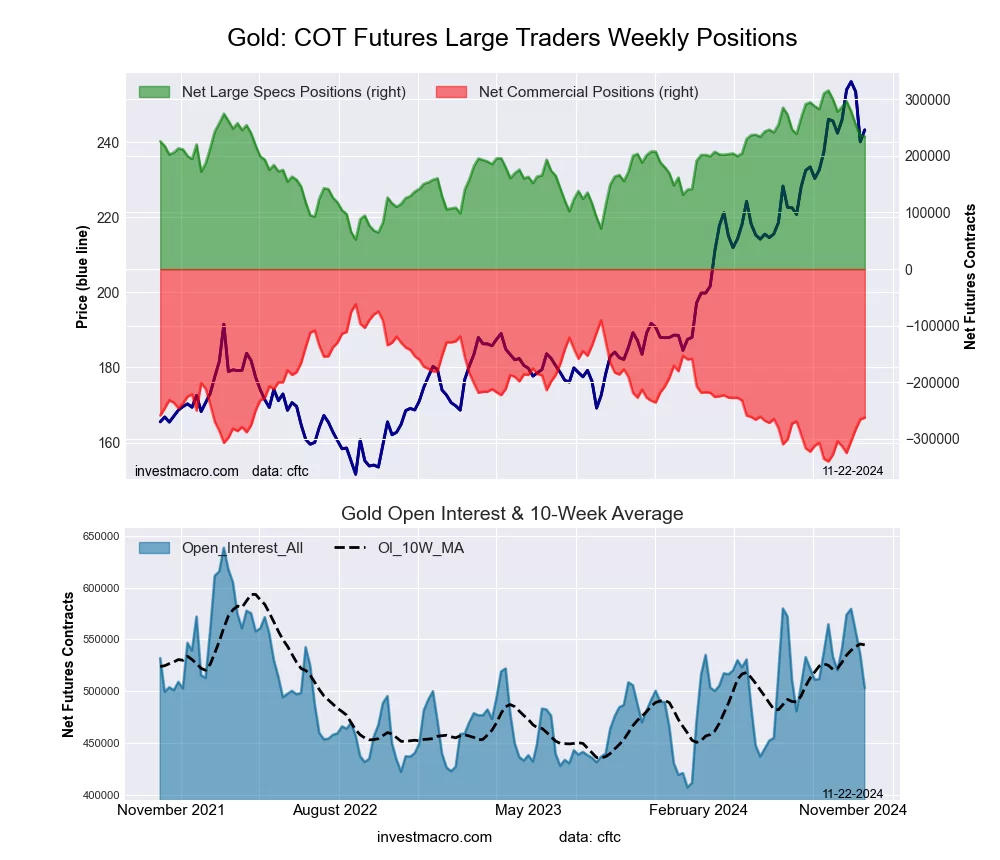
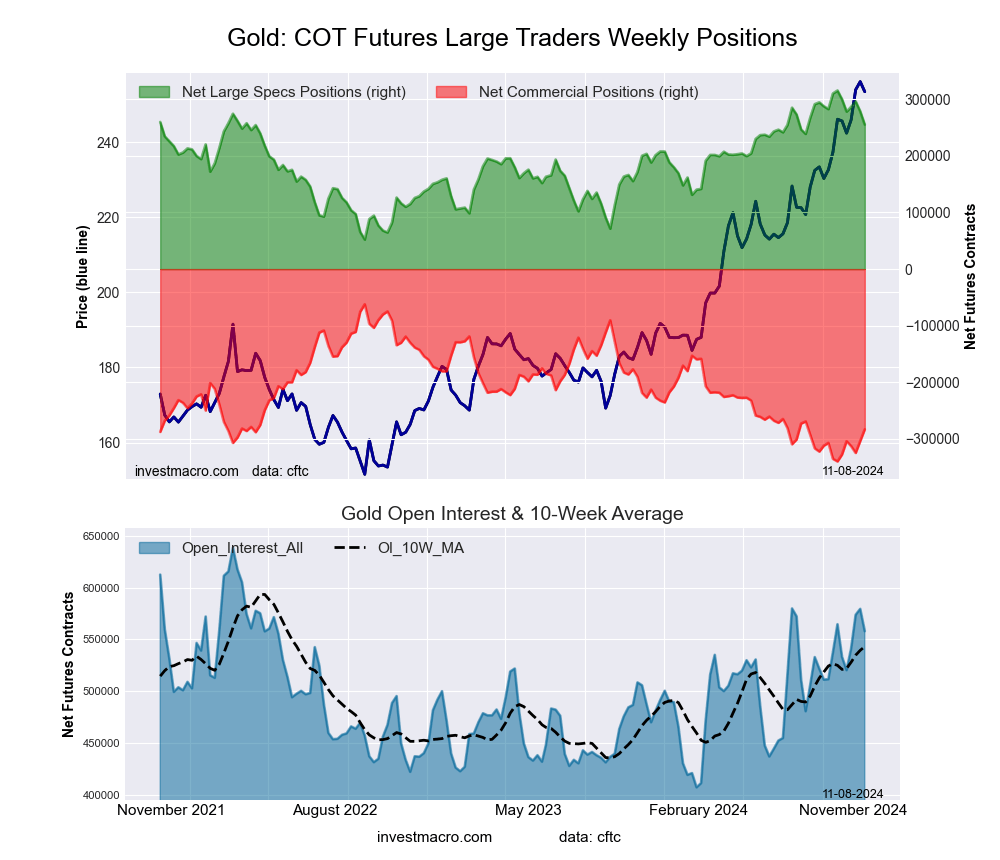
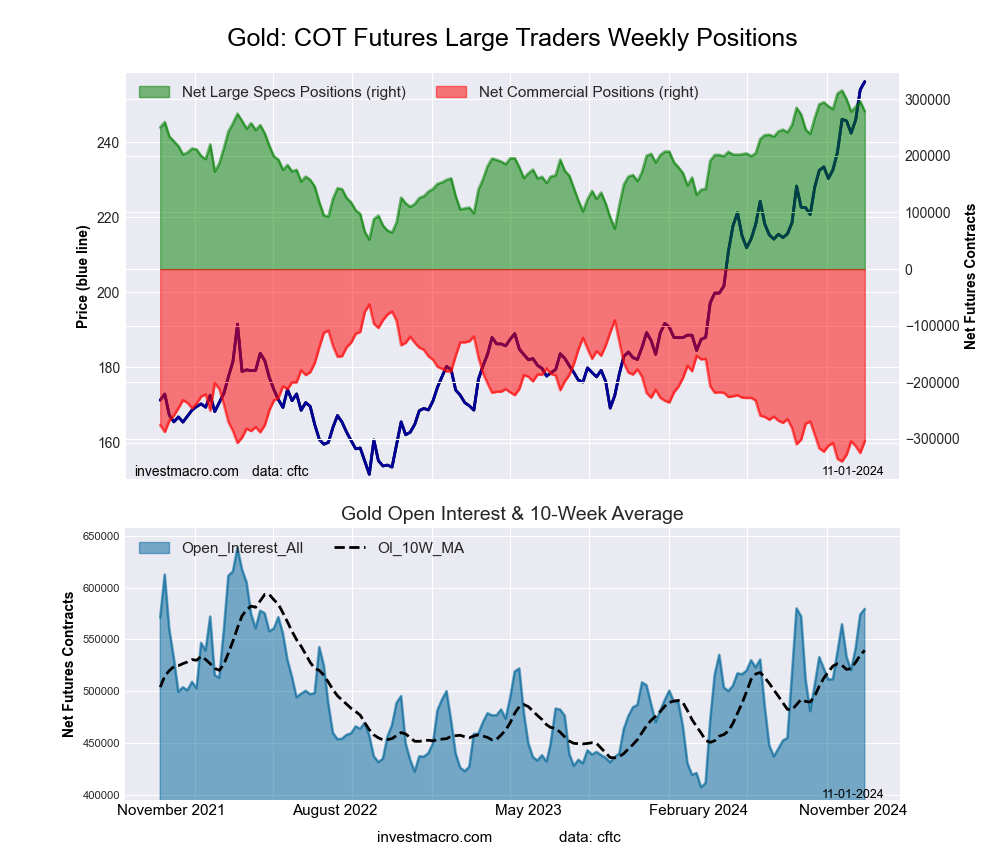
Gold Comex Futures:
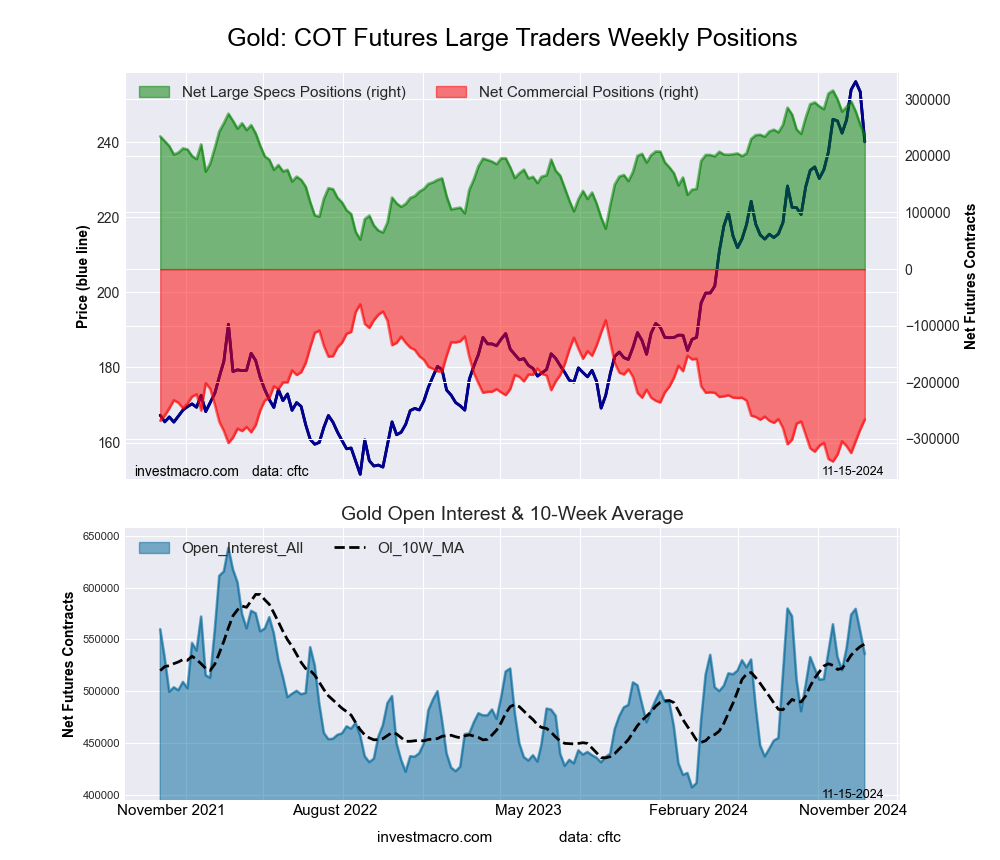 The Gold Comex Futures large speculator standing this week totaled a net position of 236,451 contracts in the data reported through Tuesday. This was a weekly decrease of -18,878 contracts from the previous week which had a total of 255,329 net contracts.
This week’s current strength score (the trader positioning range over the past three years, measured from 0 to 100) shows the speculators are currently Bullish with a score of 70.0 percent. The commercials are Bearish with a score of 26.7 percent and the small traders (not shown in chart) are Bullish with a score of 76.1 percent.
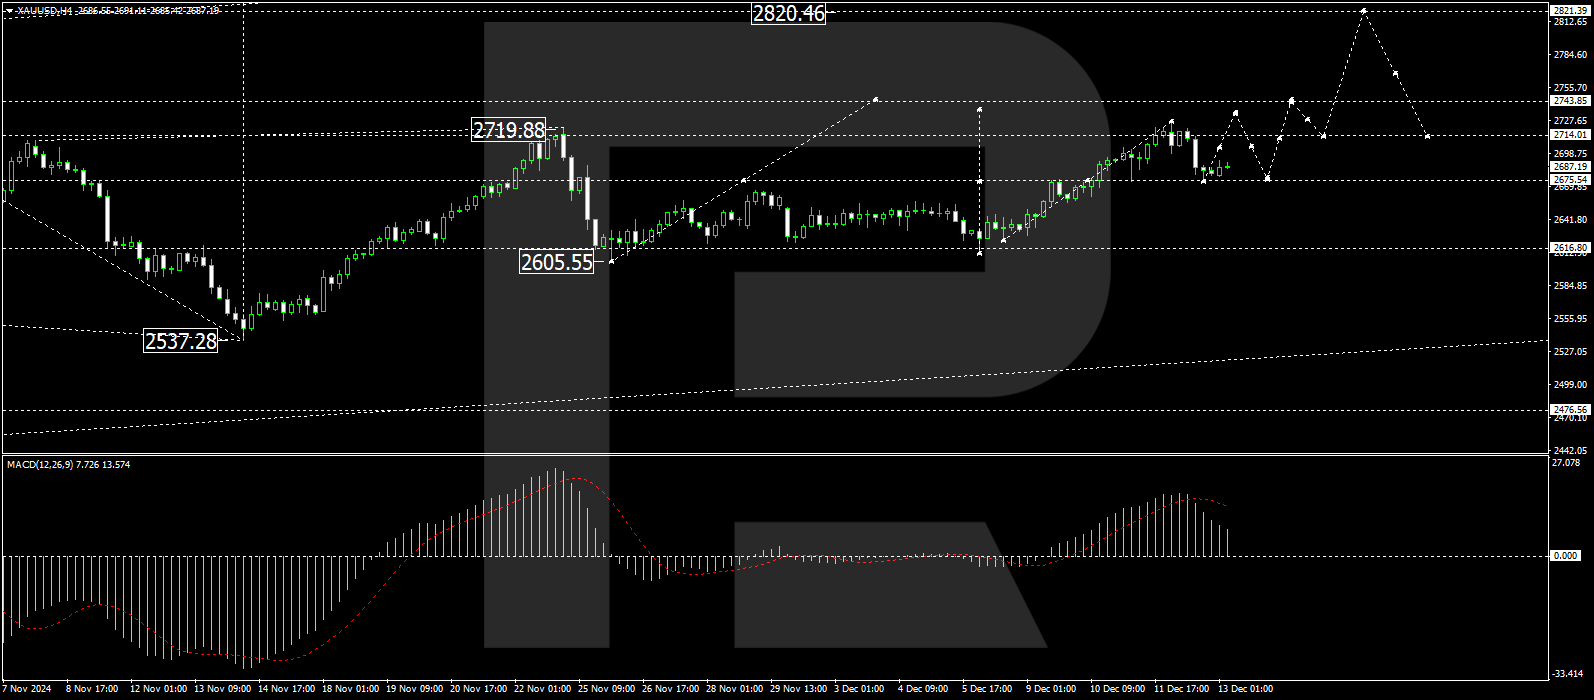
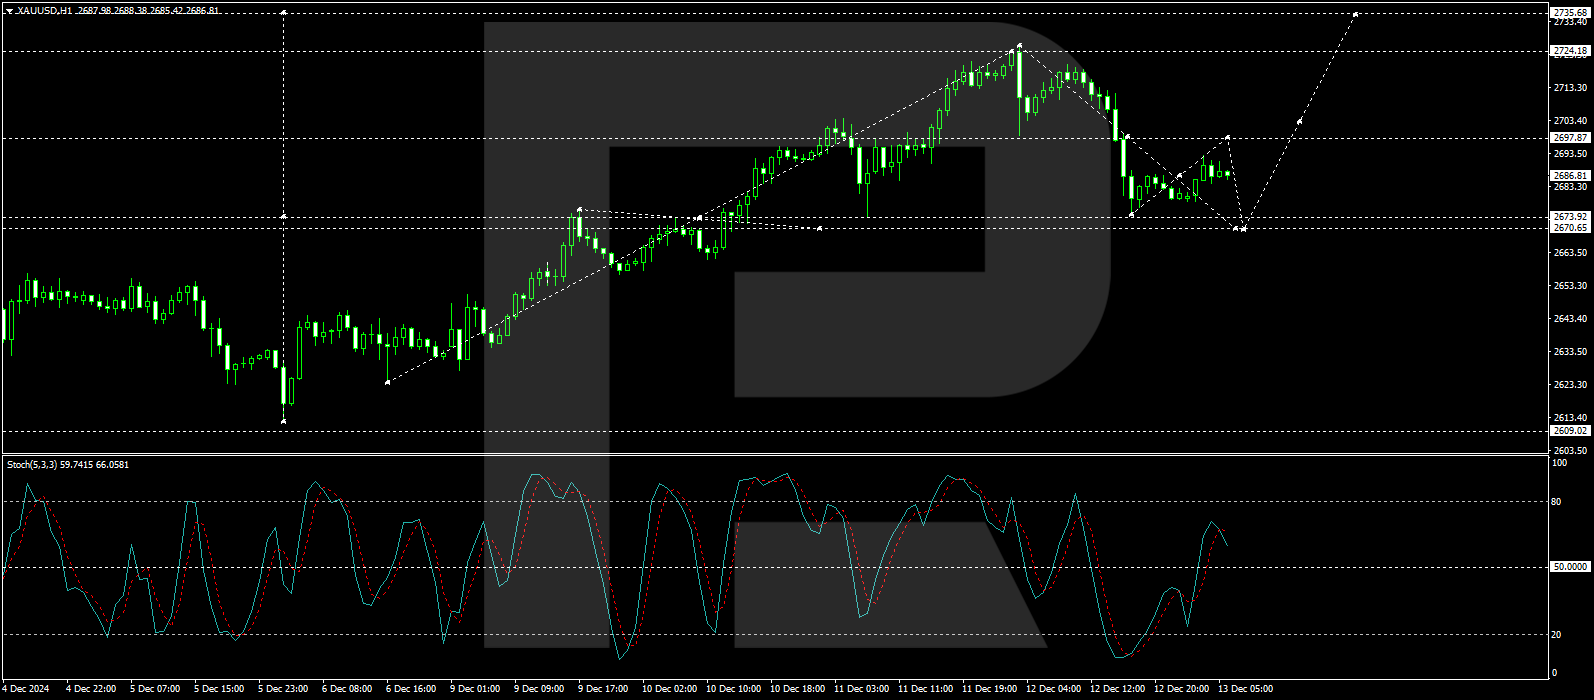
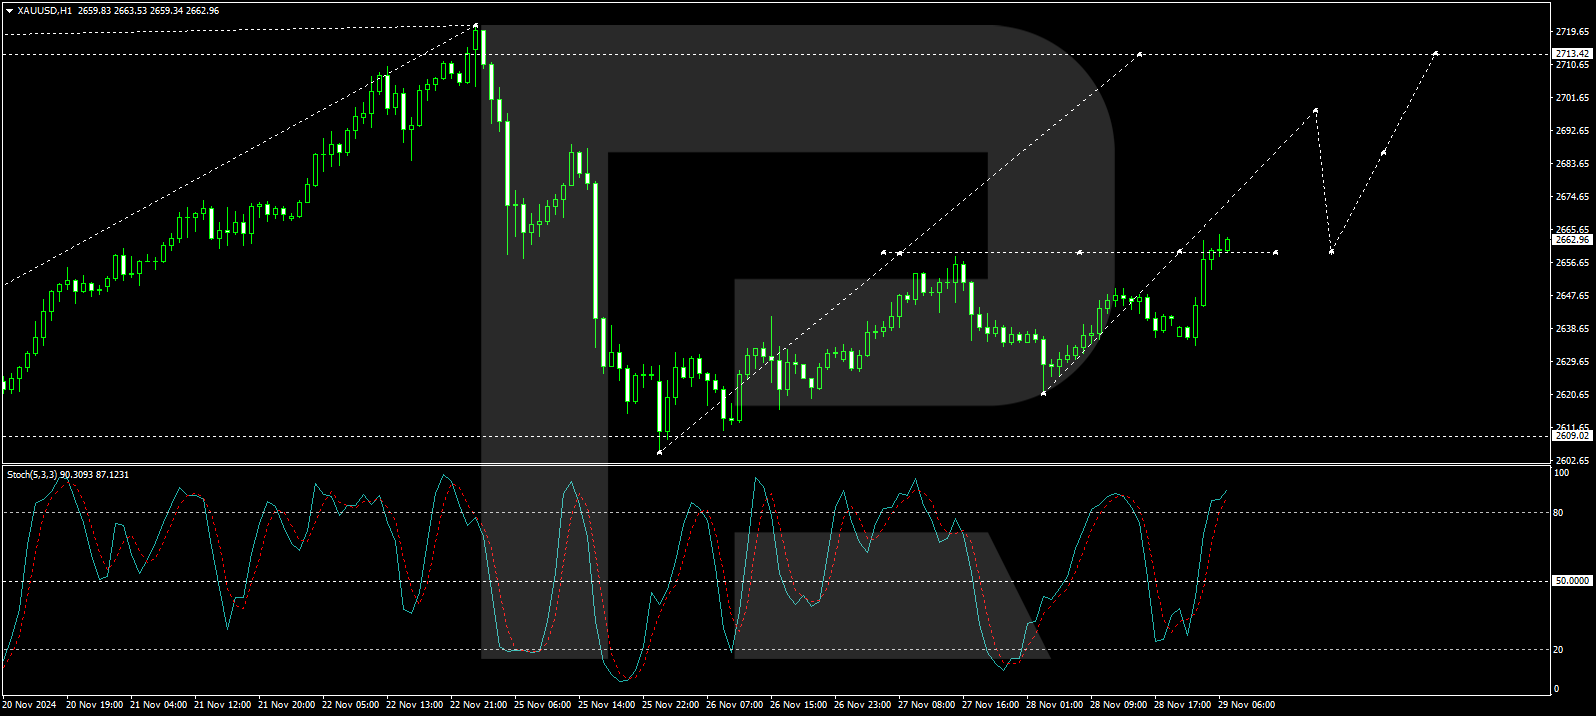
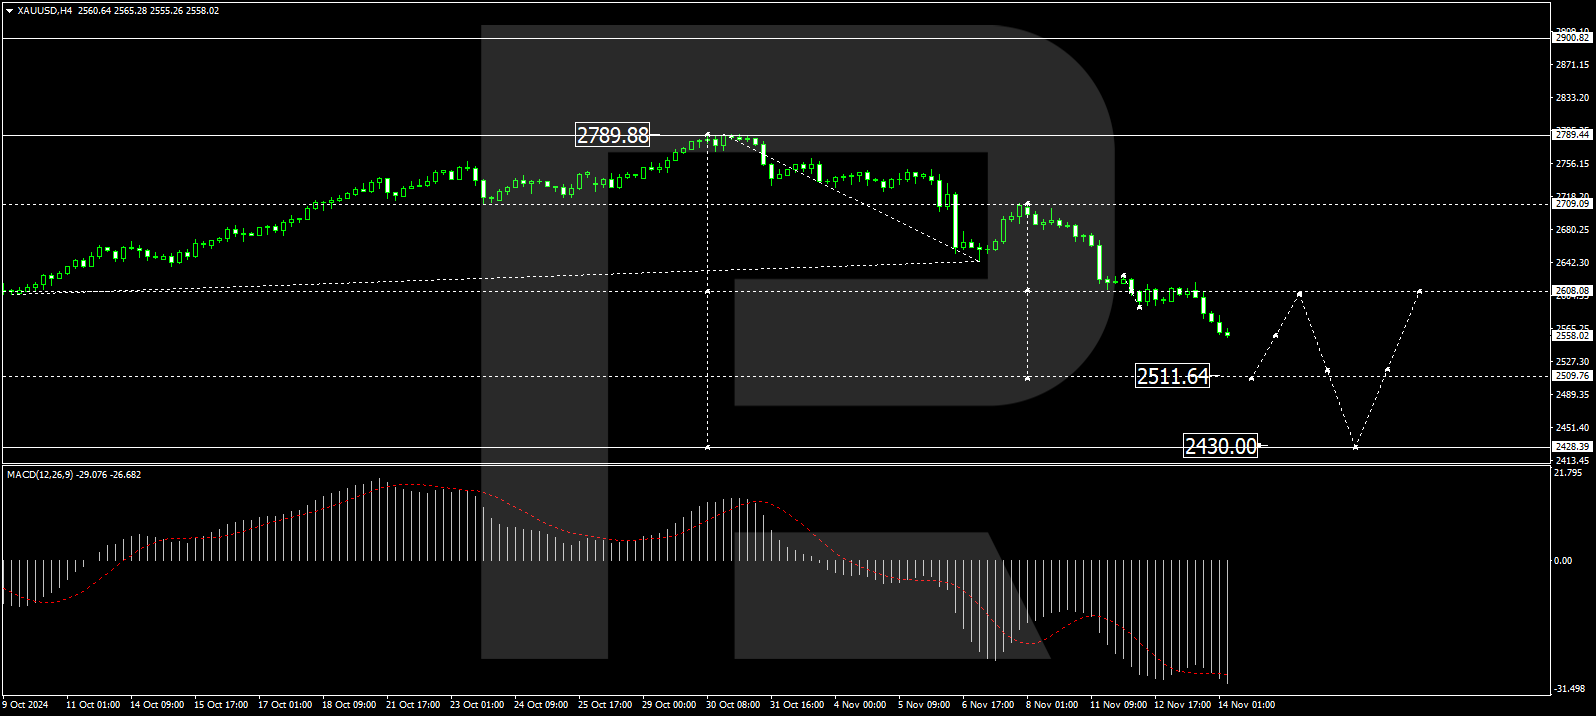
Price Trend-Following Model: Uptrend
Our weekly trend-following model classifies the current market price position as: Uptrend.
| Gold Futures Statistics | SPECULATORS | COMMERCIALS | SMALL TRADERS |
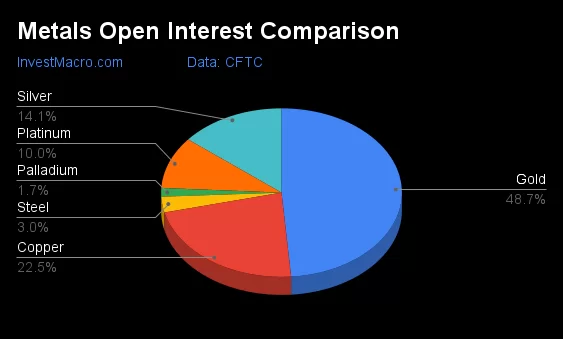
| – Percent of Open Interest Longs: | 59.0 | 14.1 | 10.6 |
| – Percent of Open Interest Shorts: | 14.9 | 63.6 | 5.2 |
| – Net Position: | 236,451 | -265,582 | 29,131 |
| – Gross Longs: | 316,225 | 75,347 | 56,838 |
| – Gross Shorts: | 79,774 | 340,929 | 27,707 |
| – Long to Short Ratio: | 4.0 to 1 | 0.2 to 1 | 2.1 to 1 |
| NET POSITION TREND: | | | |
| – Strength Index Score (3 Year Range Pct): | 70.0 | 26.7 | 76.1 |
| – Strength Index Reading (3 Year Range): | Bullish | Bearish | Bullish |
| NET POSITION MOVEMENT INDEX: | | | |
| – 6-Week Change in Strength Index: | -24.1 | 22.3 | 5.5 |
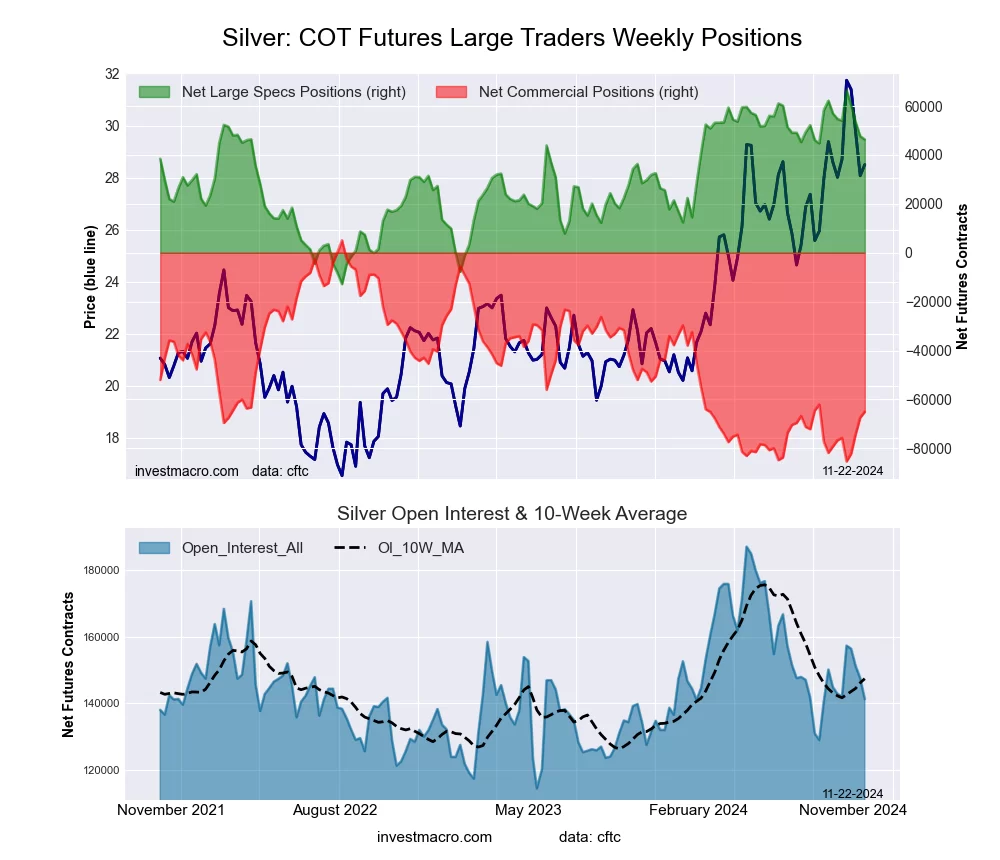
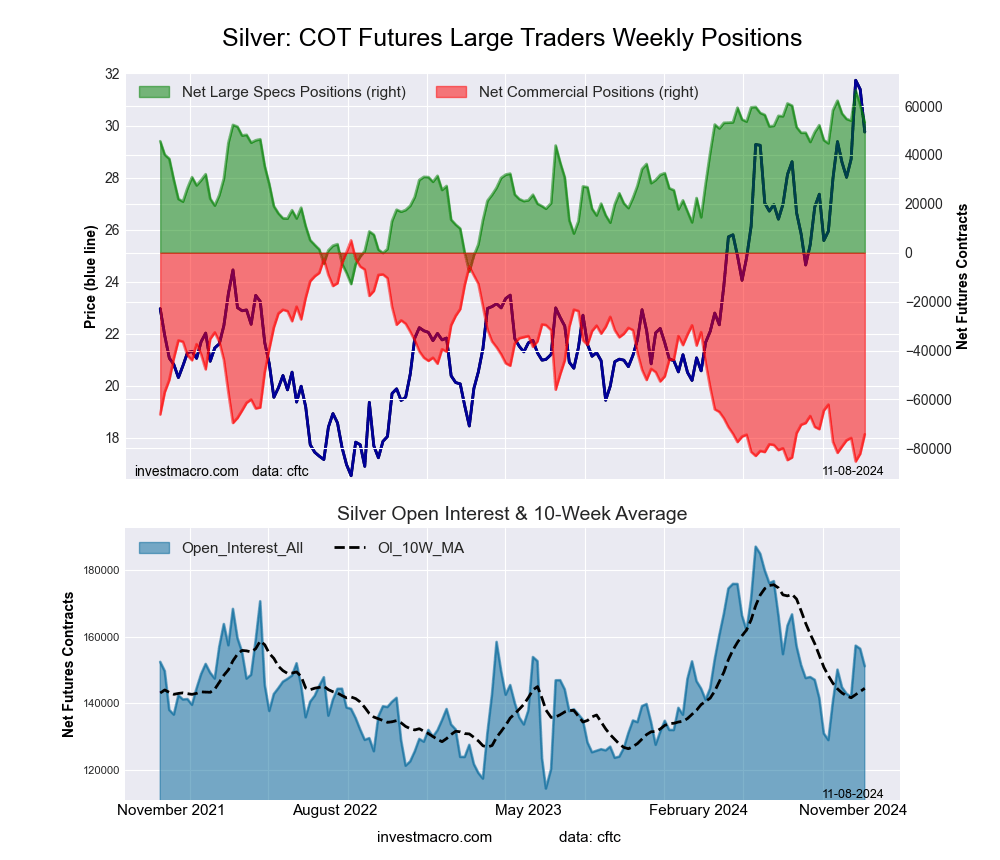
Silver Comex Futures:
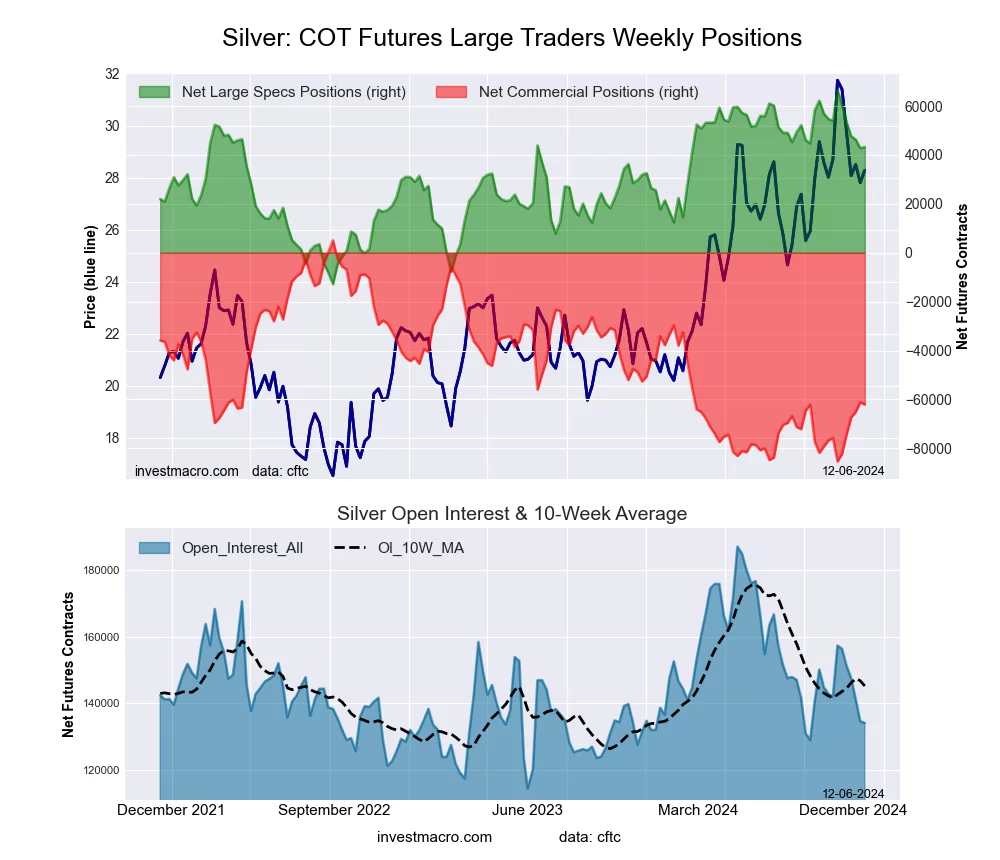
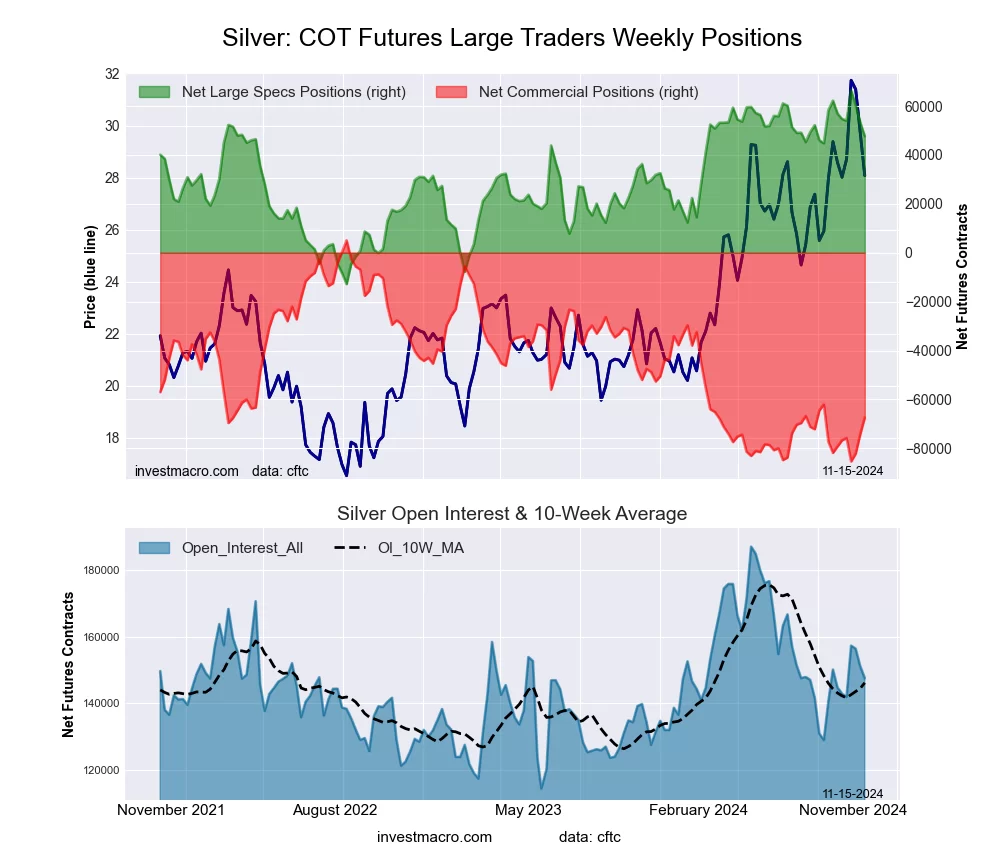 The Silver Comex Futures large speculator standing this week totaled a net position of 47,642 contracts in the data reported through Tuesday. This was a weekly reduction of -5,704 contracts from the previous week which had a total of 53,346 net contracts.
This week’s current strength score (the trader positioning range over the past three years, measured from 0 to 100) shows the speculators are currently Bullish with a score of 76.4 percent. The commercials are Bearish-Extreme with a score of 19.9 percent and the small traders (not shown in chart) are Bullish with a score of 66.3 percent.
Price Trend-Following Model: Weak Uptrend
Our weekly trend-following model classifies the current market price position as: Weak Uptrend.
| Silver Futures Statistics | SPECULATORS | COMMERCIALS | SMALL TRADERS |
| – Percent of Open Interest Longs: | 46.7 | 22.5 | 21.1 |
| – Percent of Open Interest Shorts: | 14.4 | 68.2 | 7.7 |
| – Net Position: | 47,642 | -67,407 | 19,765 |
| – Gross Longs: | 68,951 | 33,197 | 31,167 |
| – Gross Shorts: | 21,309 | 100,604 | 11,402 |
| – Long to Short Ratio: | 3.2 to 1 | 0.3 to 1 | 2.7 to 1 |
| NET POSITION TREND: | | | |
| – Strength Index Score (3 Year Range Pct): | 76.4 | 19.9 | 66.3 |
| – Strength Index Reading (3 Year Range): | Bullish | Bearish-Extreme | Bullish |
| NET POSITION MOVEMENT INDEX: | | | |
| – 6-Week Change in Strength Index: | -11.7 | 13.1 | -12.3 |
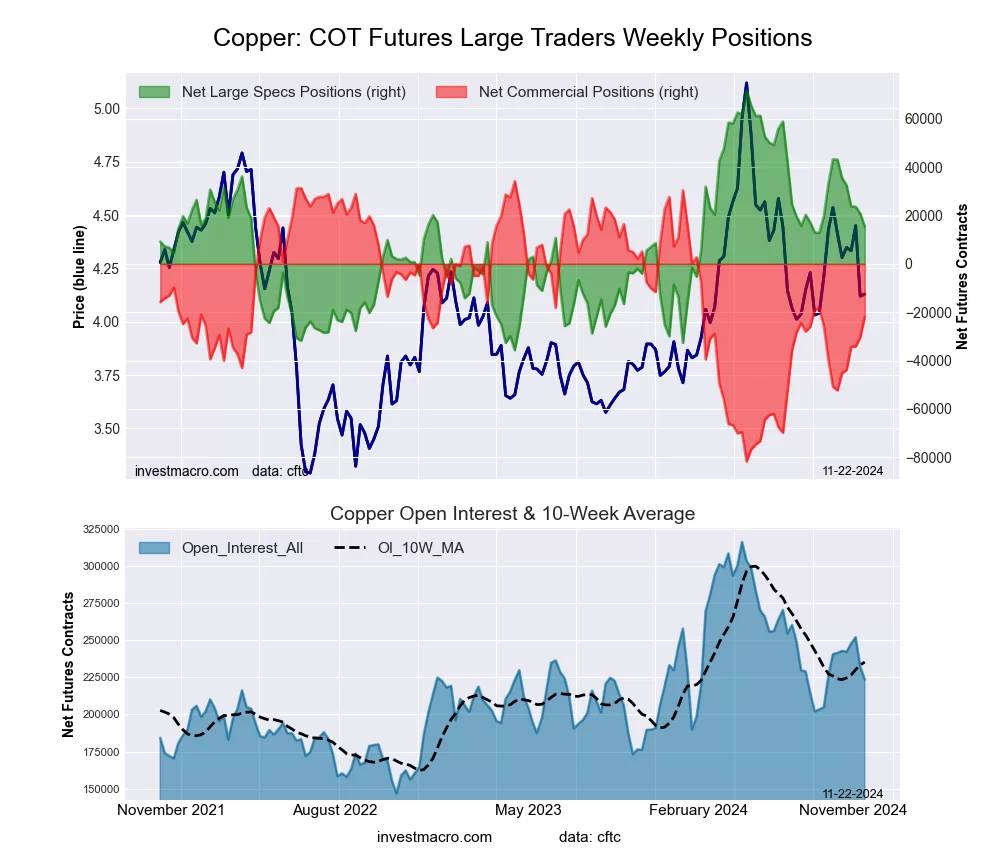
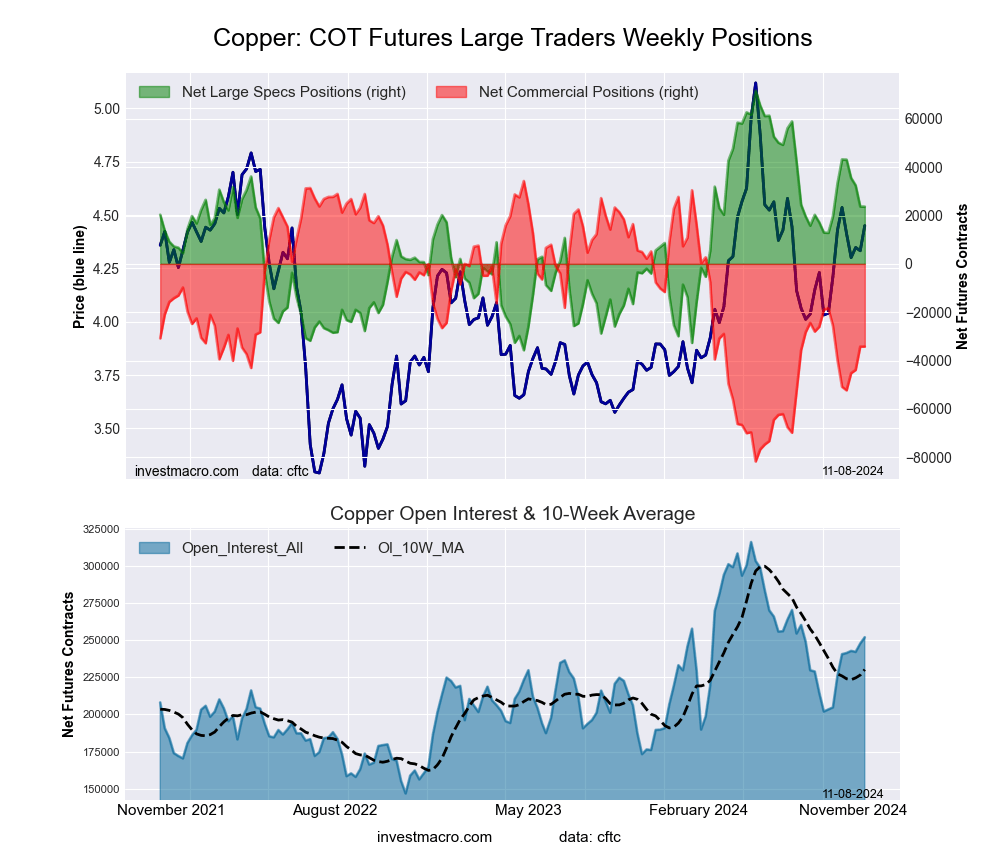
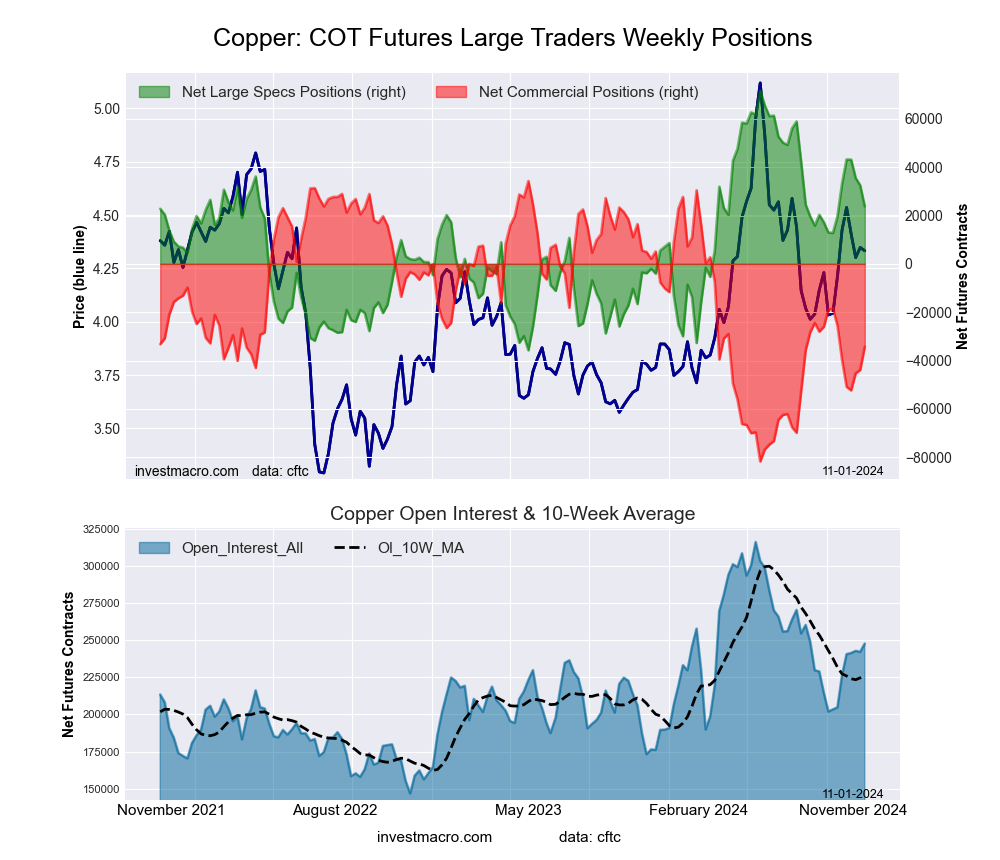
Copper Grade #1 Futures:
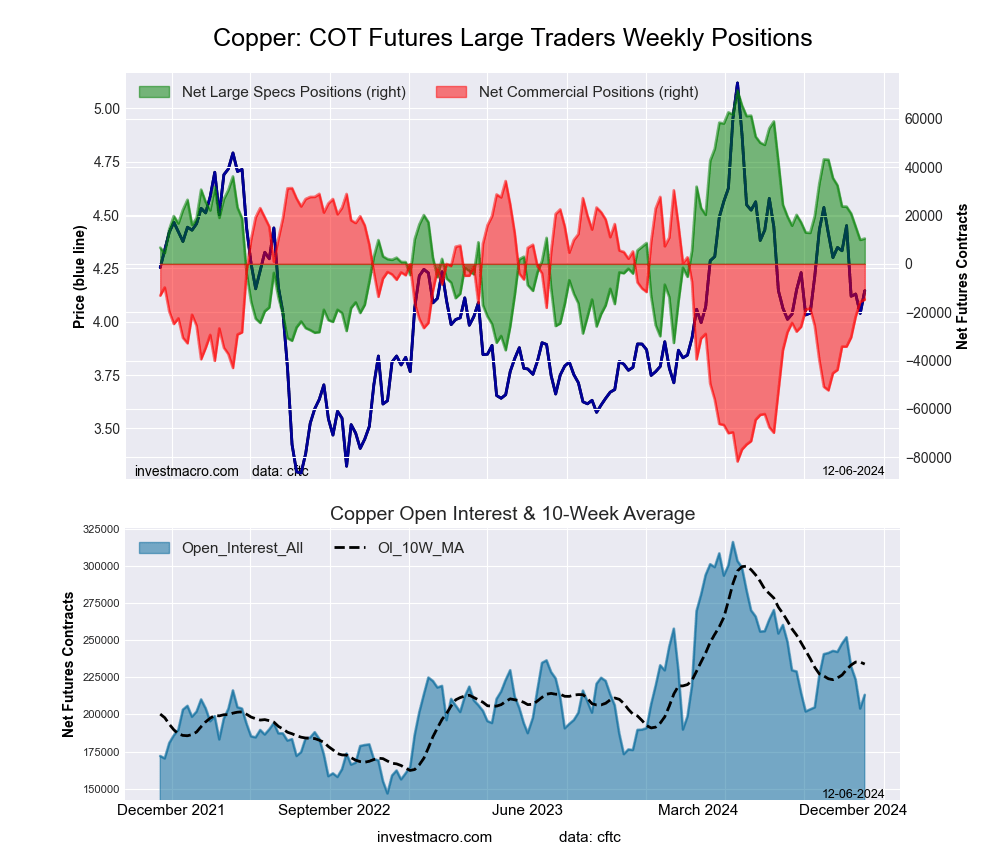
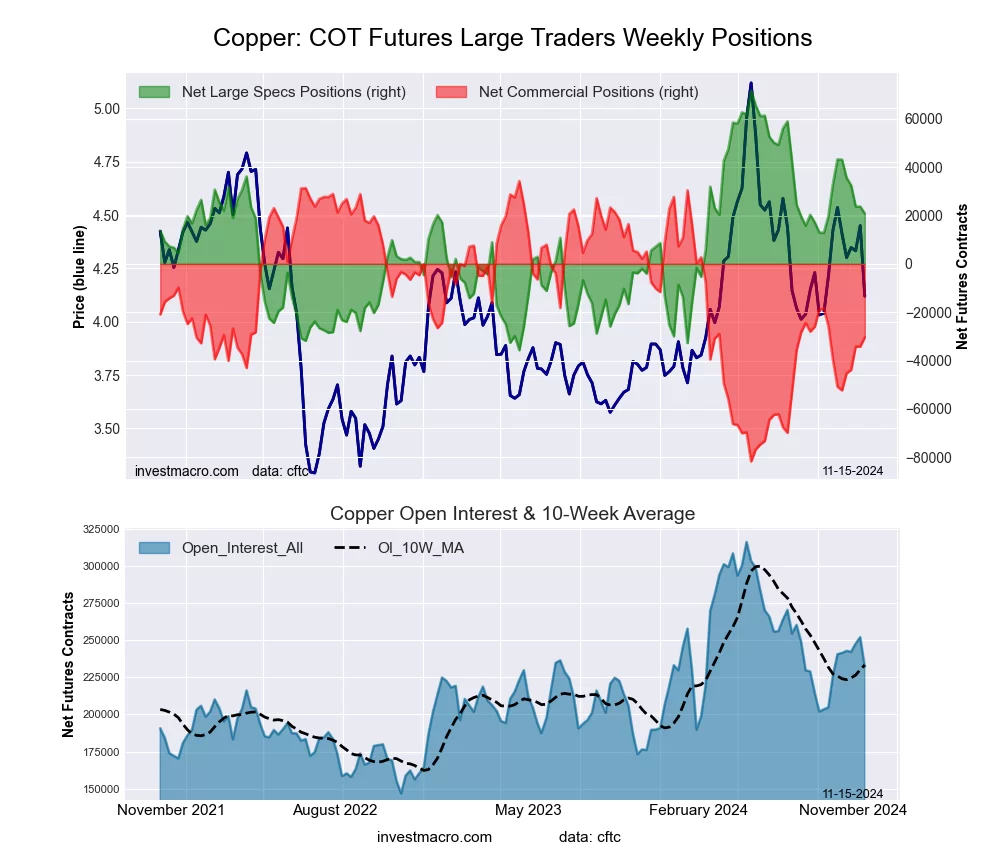 The Copper Grade #1 Futures large speculator standing this week totaled a net position of 20,845 contracts in the data reported through Tuesday. This was a weekly fall of -2,825 contracts from the previous week which had a total of 23,670 net contracts.
This week’s current strength score (the trader positioning range over the past three years, measured from 0 to 100) shows the speculators are currently Bullish with a score of 52.7 percent. The commercials are Bearish with a score of 44.2 percent and the small traders (not shown in chart) are Bullish with a score of 75.7 percent.
Price Trend-Following Model: Strong Downtrend
Our weekly trend-following model classifies the current market price position as: Strong Downtrend.
| Copper Futures Statistics | SPECULATORS | COMMERCIALS | SMALL TRADERS |
| – Percent of Open Interest Longs: | 40.4 | 33.4 | 8.8 |
| – Percent of Open Interest Shorts: | 31.5 | 46.5 | 4.6 |
| – Net Position: | 20,845 | -30,413 | 9,568 |
| – Gross Longs: | 93,941 | 77,575 | 20,369 |
| – Gross Shorts: | 73,096 | 107,988 | 10,801 |
| – Long to Short Ratio: | 1.3 to 1 | 0.7 to 1 | 1.9 to 1 |
| NET POSITION TREND: | | | |
| – Strength Index Score (3 Year Range Pct): | 52.7 | 44.2 | 75.7 |
| – Strength Index Reading (3 Year Range): | Bullish | Bearish | Bullish |
| NET POSITION MOVEMENT INDEX: | | | |
| – 6-Week Change in Strength Index: | -20.8 | 17.6 | 11.6 |
Platinum Futures:
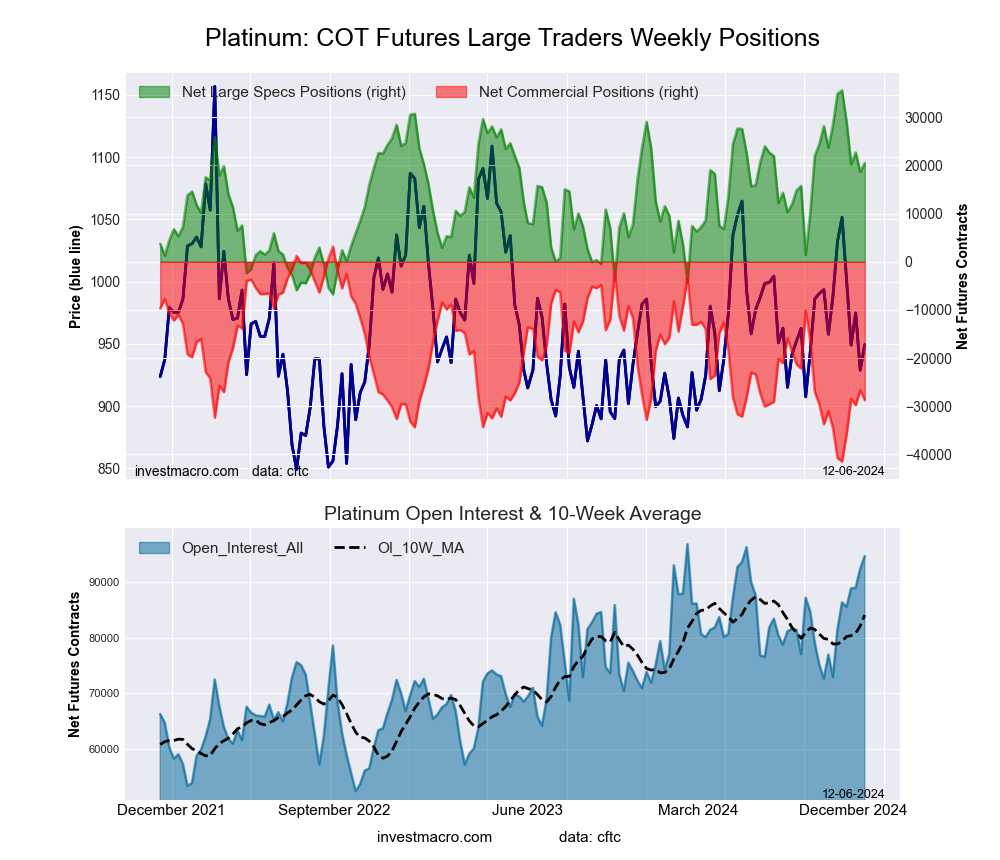
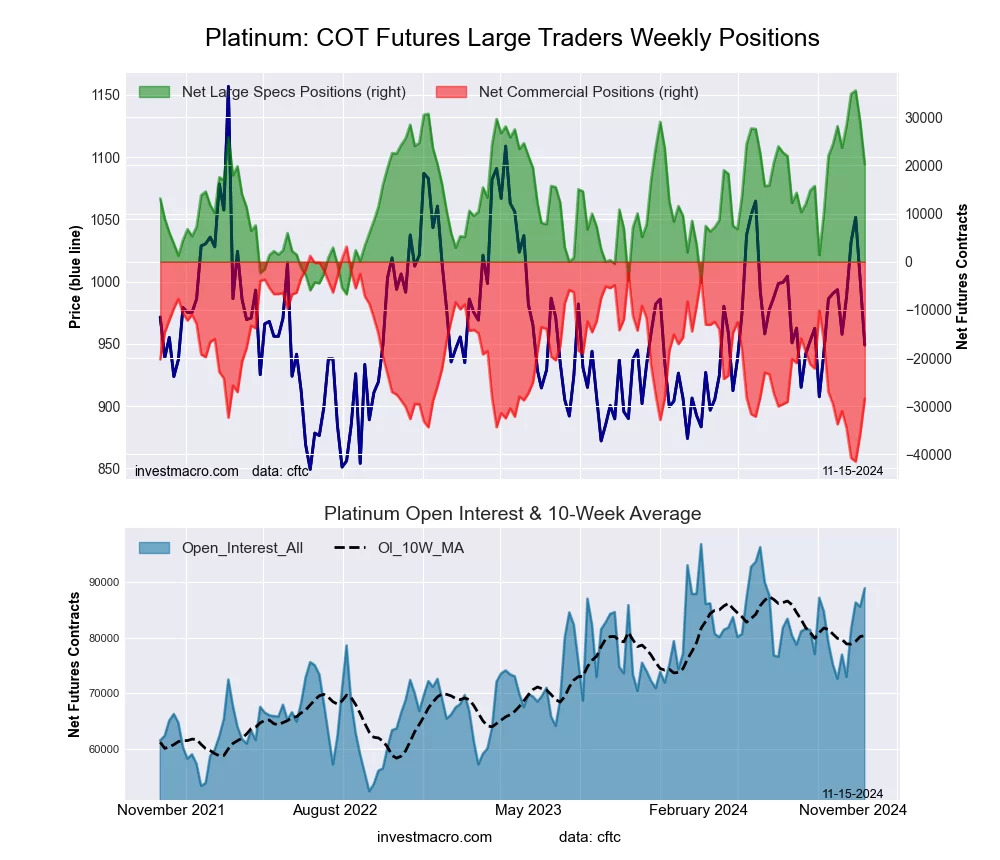 The Platinum Futures large speculator standing this week totaled a net position of 20,233 contracts in the data reported through Tuesday. This was a weekly lowering of -8,808 contracts from the previous week which had a total of 29,041 net contracts.
This week’s current strength score (the trader positioning range over the past three years, measured from 0 to 100) shows the speculators are currently Bullish with a score of 63.8 percent. The commercials are Bearish with a score of 29.2 percent and the small traders (not shown in chart) are Bullish-Extreme with a score of 91.1 percent.
Price Trend-Following Model: Weak Uptrend
Our weekly trend-following model classifies the current market price position as: Weak Uptrend.
| Platinum Futures Statistics | SPECULATORS | COMMERCIALS | SMALL TRADERS |
| – Percent of Open Interest Longs: | 59.9 | 18.9 | 12.8 |
| – Percent of Open Interest Shorts: | 37.2 | 50.9 | 3.6 |
| – Net Position: | 20,233 | -28,419 | 8,186 |
| – Gross Longs: | 53,283 | 16,825 | 11,361 |
| – Gross Shorts: | 33,050 | 45,244 | 3,175 |
| – Long to Short Ratio: | 1.6 to 1 | 0.4 to 1 | 3.6 to 1 |
| NET POSITION TREND: | | | |
| – Strength Index Score (3 Year Range Pct): | 63.8 | 29.2 | 91.1 |
| – Strength Index Reading (3 Year Range): | Bullish | Bearish | Bullish-Extreme |
| NET POSITION MOVEMENT INDEX: | | | |
| – 6-Week Change in Strength Index: | -18.7 | 11.9 | 40.7 |
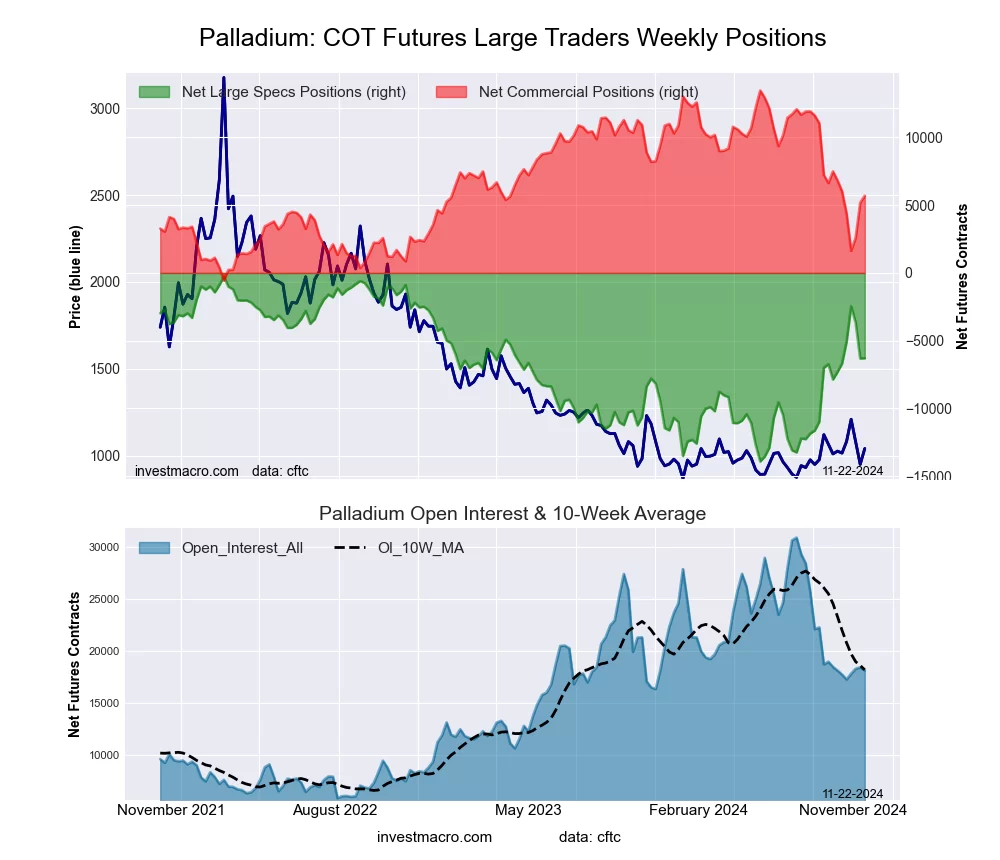
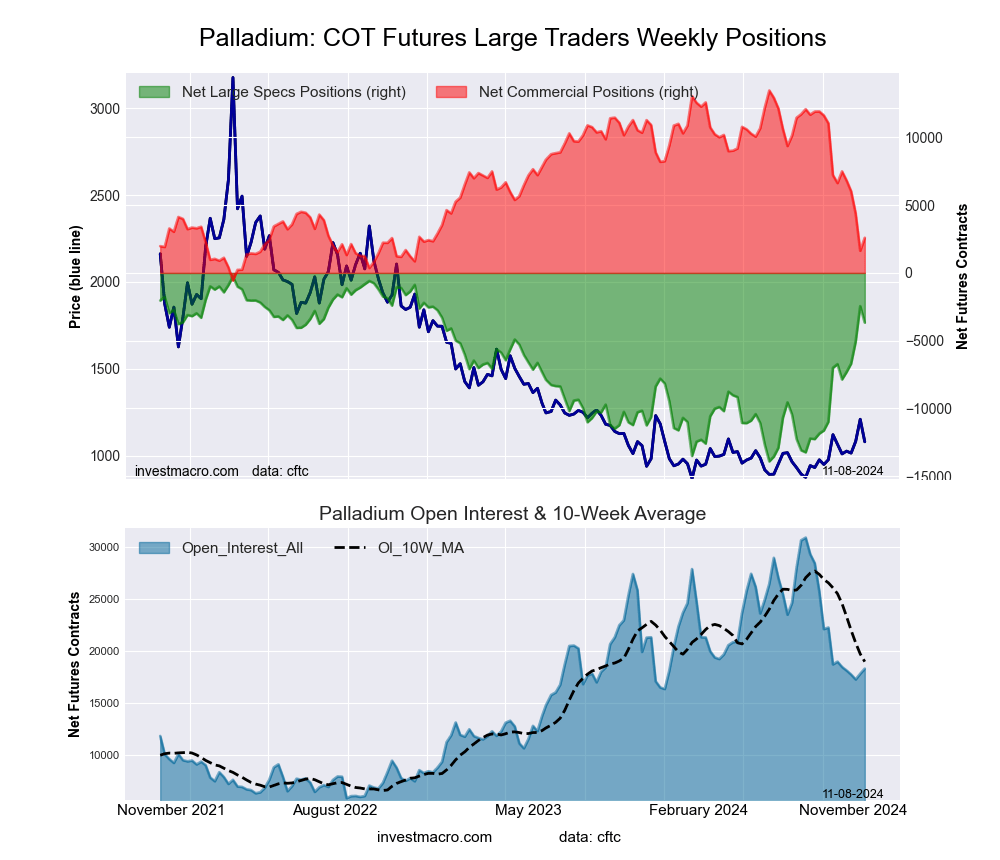
Palladium Futures:
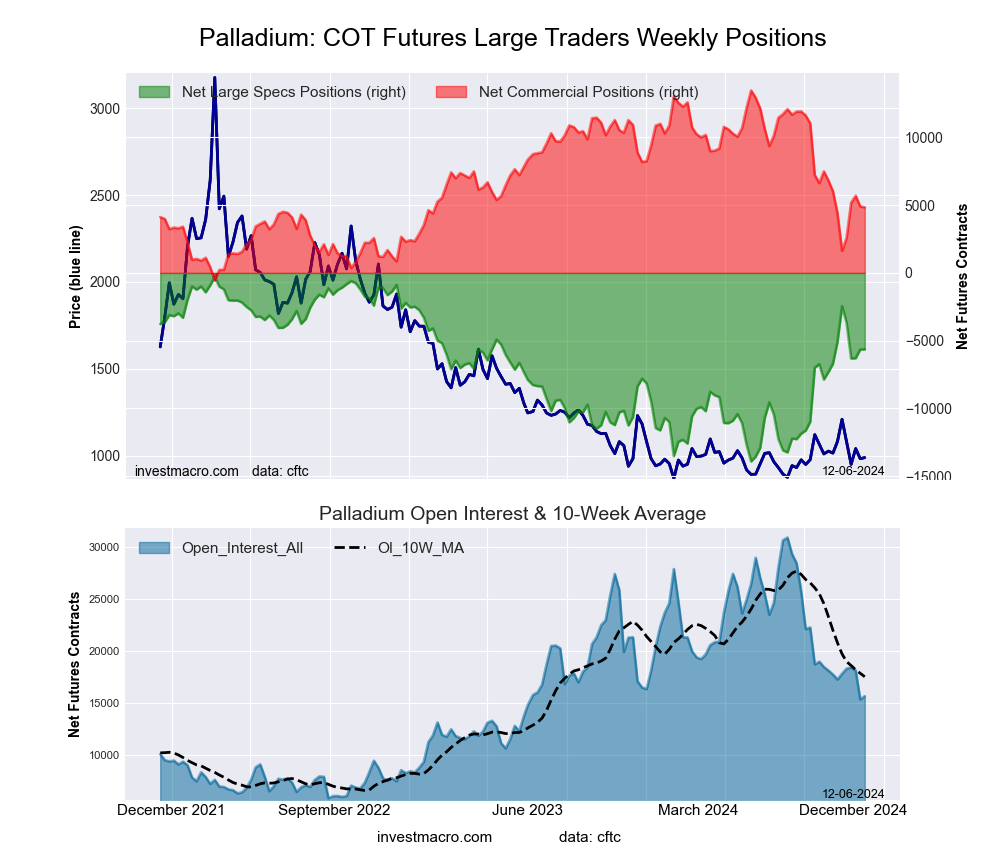
 The Palladium Futures large speculator standing this week totaled a net position of -6,313 contracts in the data reported through Tuesday. This was a weekly fall of -2,646 contracts from the previous week which had a total of -3,667 net contracts.
This week’s current strength score (the trader positioning range over the past three years, measured from 0 to 100) shows the speculators are currently Bullish with a score of 55.7 percent. The commercials are Bearish with a score of 41.0 percent and the small traders (not shown in chart) are Bullish-Extreme with a score of 88.0 percent.
Price Trend-Following Model: Weak Uptrend
Our weekly trend-following model classifies the current market price position as: Weak Uptrend.
| Palladium Futures Statistics | SPECULATORS | COMMERCIALS | SMALL TRADERS |
| – Percent of Open Interest Longs: | 25.3 | 48.4 | 13.5 |
| – Percent of Open Interest Shorts: | 59.6 | 20.3 | 7.3 |
| – Net Position: | -6,313 | 5,183 | 1,130 |
| – Gross Longs: | 4,667 | 8,919 | 2,480 |
| – Gross Shorts: | 10,980 | 3,736 | 1,350 |
| – Long to Short Ratio: | 0.4 to 1 | 2.4 to 1 | 1.8 to 1 |
| NET POSITION TREND: | | | |
| – Strength Index Score (3 Year Range Pct): | 55.7 | 41.0 | 88.0 |
| – Strength Index Reading (3 Year Range): | Bullish | Bearish | Bullish-Extreme |
| NET POSITION MOVEMENT INDEX: | | | |
| – 6-Week Change in Strength Index: | 11.4 | -16.5 | 36.7 |
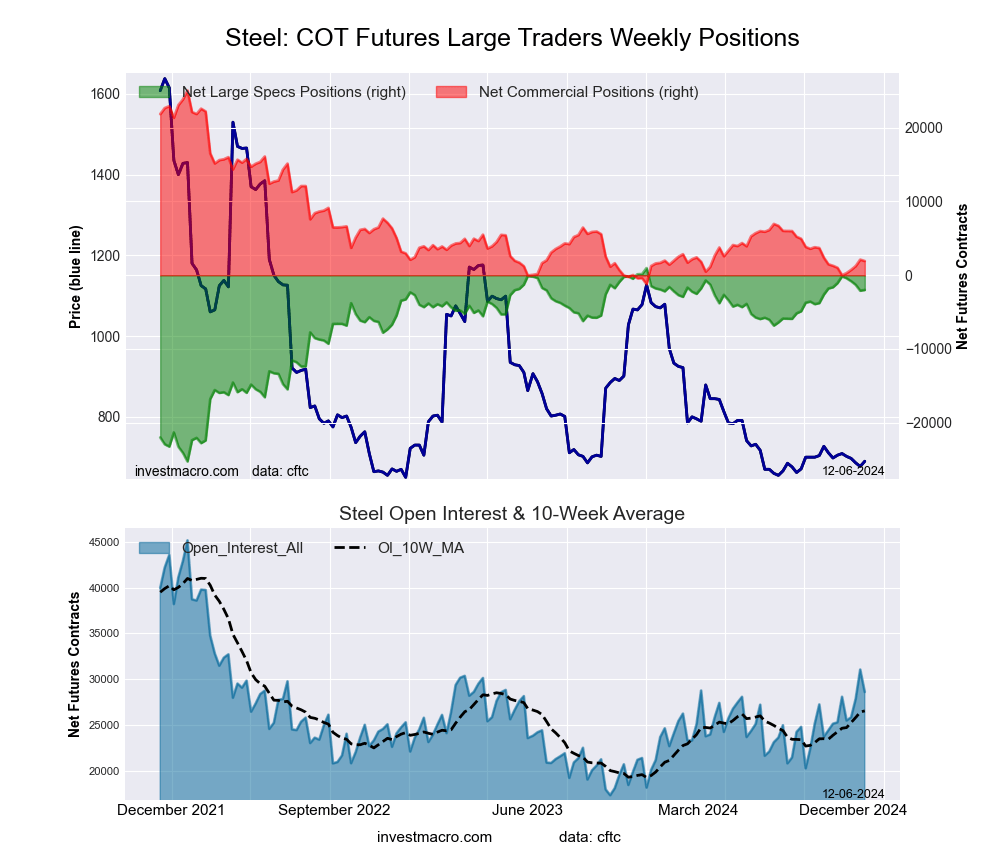
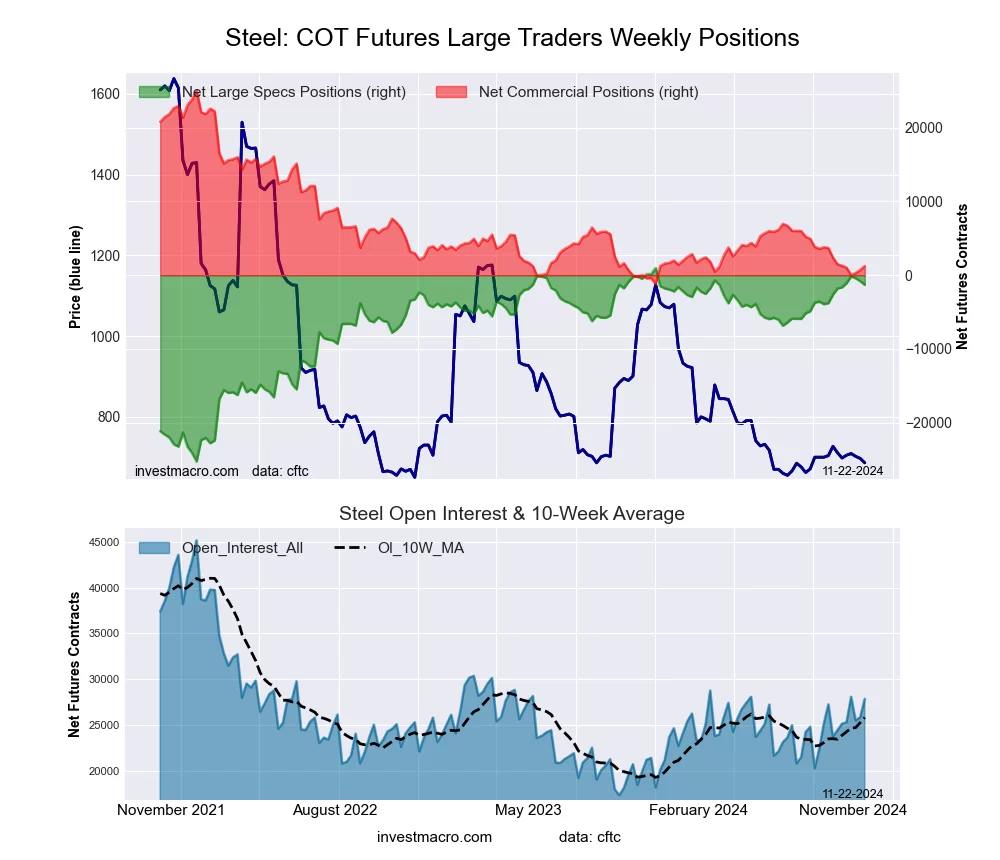
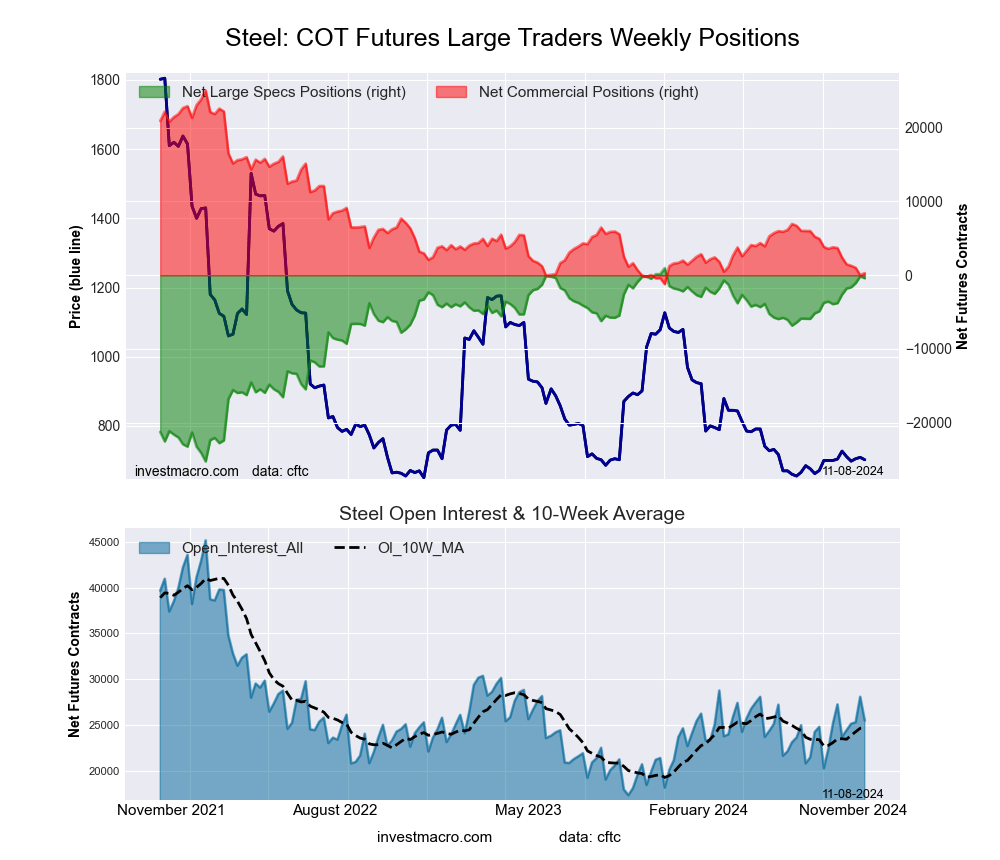
Steel Futures Futures:
 The Steel Futures large speculator standing this week totaled a net position of -808 contracts in the data reported through Tuesday. This was a weekly decrease of -394 contracts from the previous week which had a total of -414 net contracts.
This week’s current strength score (the trader positioning range over the past three years, measured from 0 to 100) shows the speculators are currently Bullish-Extreme with a score of 93.2 percent. The commercials are Bearish-Extreme with a score of 7.4 percent and the small traders (not shown in chart) are Bearish with a score of 41.2 percent.
Price Trend-Following Model: Weak Uptrend
Our weekly trend-following model classifies the current market price position as: Weak Uptrend.
| Steel Futures Statistics | SPECULATORS | COMMERCIALS | SMALL TRADERS |
| – Percent of Open Interest Longs: | 24.2 | 71.0 | 1.0 |
| – Percent of Open Interest Shorts: | 27.3 | 68.2 | 0.7 |
| – Net Position: | -808 | 727 | 81 |
| – Gross Longs: | 6,257 | 18,343 | 256 |
| – Gross Shorts: | 7,065 | 17,616 | 175 |
| – Long to Short Ratio: | 0.9 to 1 | 1.0 to 1 | 1.5 to 1 |
| NET POSITION TREND: | | | |
| – Strength Index Score (3 Year Range Pct): | 93.2 | 7.4 | 41.2 |
| – Strength Index Reading (3 Year Range): | Bullish-Extreme | Bearish-Extreme | Bearish |
| NET POSITION MOVEMENT INDEX: | | | |
| – 6-Week Change in Strength Index: | 7.0 | -6.3 | -17.7 |
Article By InvestMacro – Receive our weekly COT Newsletter
*COT Report: The COT data, released weekly to the public each Friday, is updated through the most recent Tuesday (data is 3 days old) and shows a quick view of how large speculators or non-commercials (for-profit traders) were positioned in the futures markets.
The CFTC categorizes trader positions according to commercial hedgers (traders who use futures contracts for hedging as part of the business), non-commercials (large traders who speculate to realize trading profits) and nonreportable traders (usually small traders/speculators) as well as their open interest (contracts open in the market at time of reporting). See CFTC criteria here.