By InvestMacro

Here are the latest charts and statistics for the Commitment of Traders (COT) data published by the Commodities Futures Trading Commission (CFTC).
The latest COT data is updated through Tuesday June 3rd and shows a quick view of how large traders (for-profit speculators and commercial entities) were positioned in the futures markets.
Weekly Speculator Changes led higher by Gold & Silver

The COT metals markets speculator bets were higher this week as four out of the six metals markets we cover had higher positioning while the other two markets had lower speculator contracts.
Leading the gains for the metals was Gold (13,721 contracts) with Silver (7,758 contracts), Copper (1,513 contracts) and Palladium (233 contracts) having positive weeks.
The markets with declines in speculator bets for the week were Platinum (-5,294 contracts) and with Steel (-1,279 contracts) also registering lower bets on the week.
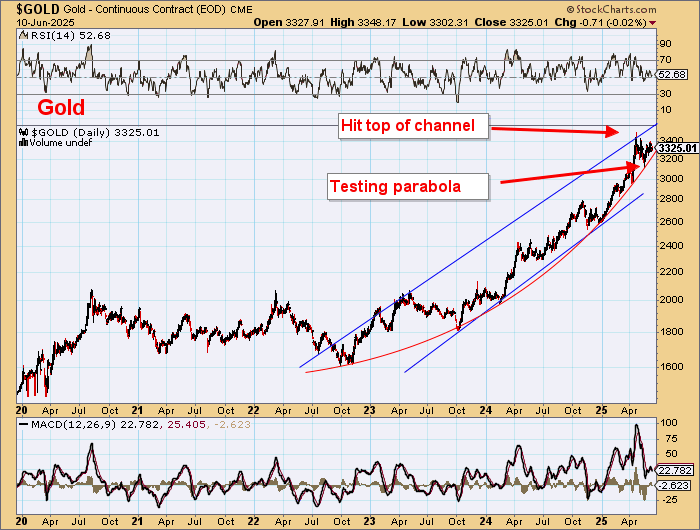
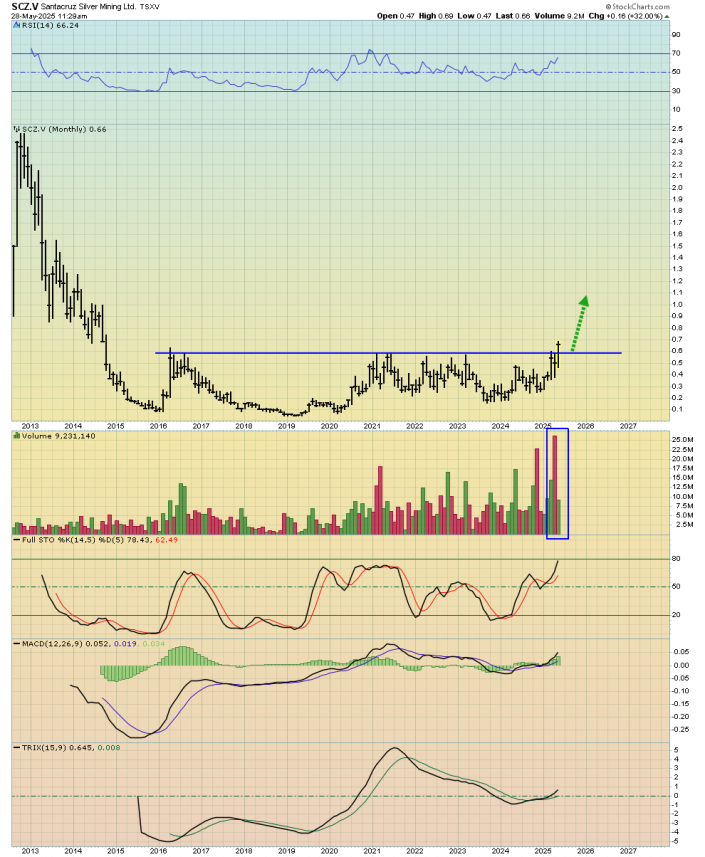
Gold bets rose this week for the third straight this week after having fallen in the previous four weeks. Currently, the gold speculator bets are up to their highest level in the past seven weeks. Silver bets meanwhile, also rose for the third straight week and they are now at their highest level in the past ten weeks, dating back to March 25th.
Metals Price Performance in last 5-Days:
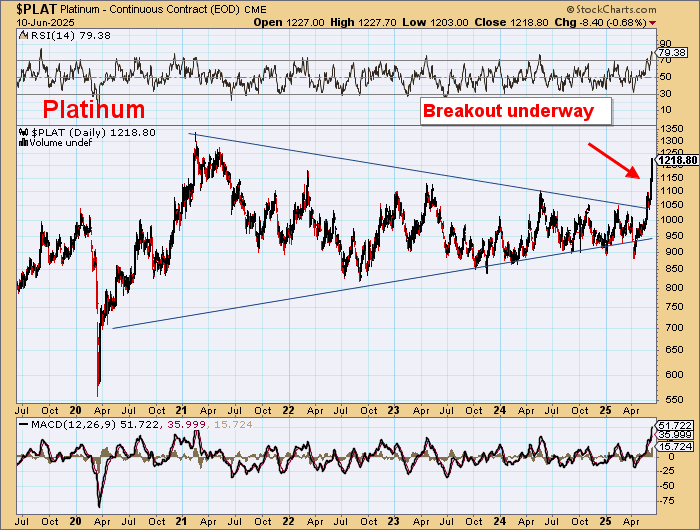
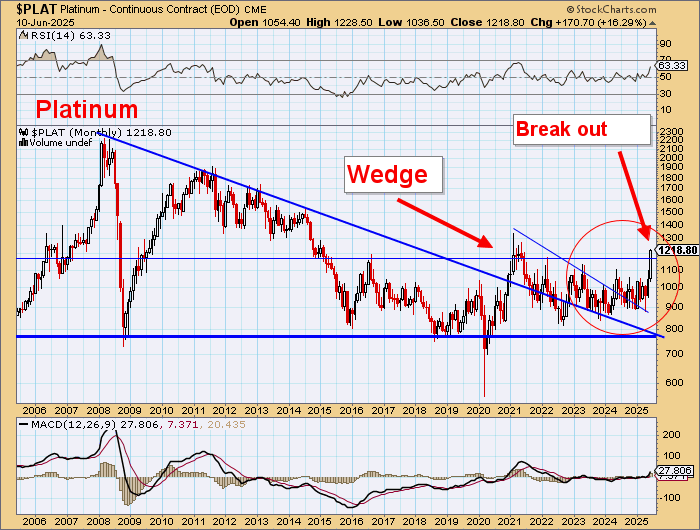
– Platinum was the big riser with a 10% gain.
– Silver was up by 9%.
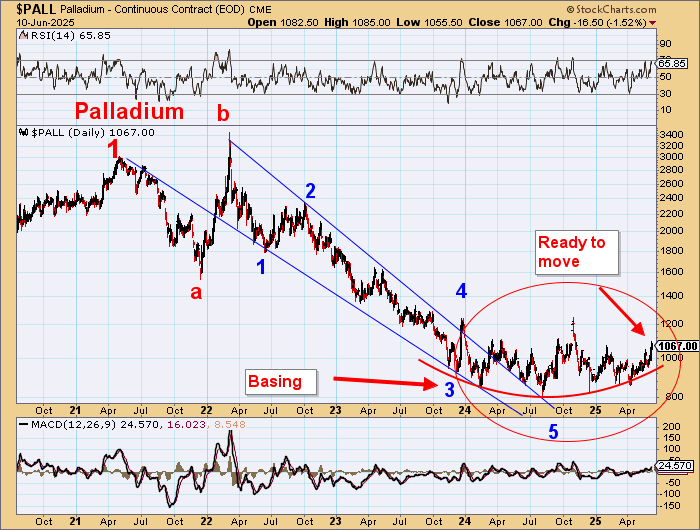
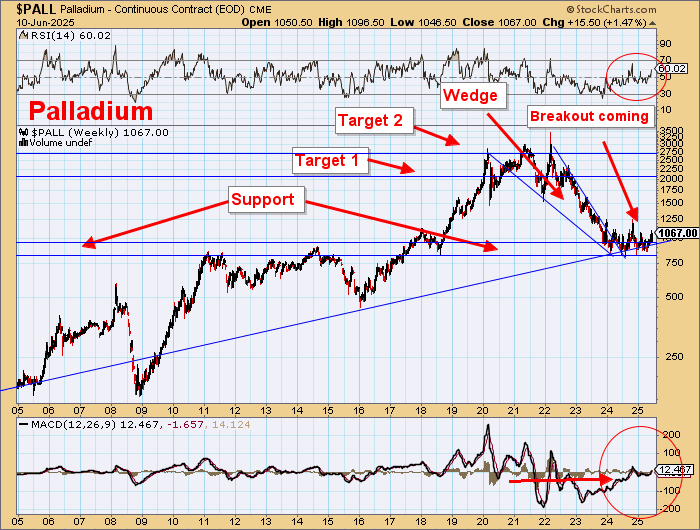
– Palladium over 7.5%.
– Copper rose by 3%.
– Gold was up by 0.5%.
– Steel was down by 9% in the last 5 days.
– All of the metals markets have been up by at least 5% or more in the last 90 days, with platinum & gold up by approximately 20% and steel up by almost 20%.
Metals Data:

Legend: Weekly Speculators Change | Speculators Current Net Position | Speculators Strength Score compared to last 3-Years (0-100 range)
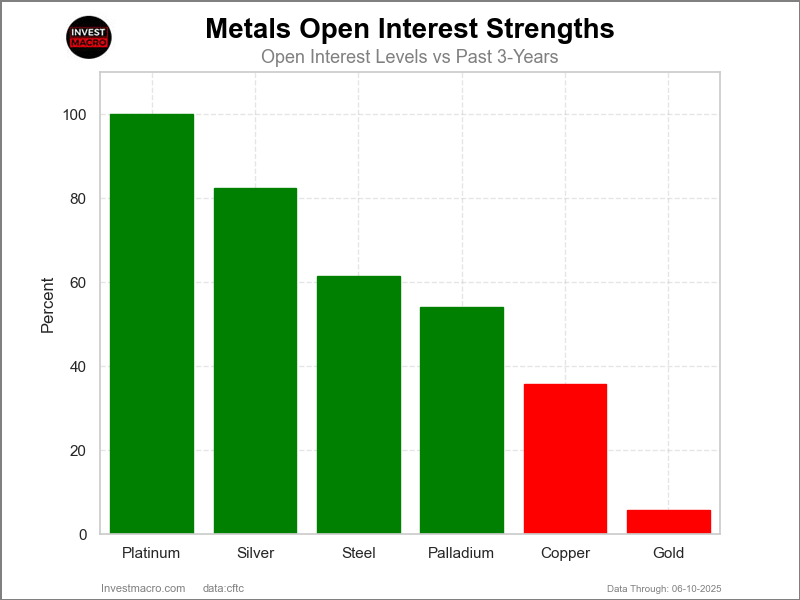
Strength Scores led by Silver

COT Strength Scores (a normalized measure of Speculator positions over a 3-Year range, from 0 to 100 where above 80 is Extreme-Bullish and below 20 is Extreme-Bearish) showed that Silver (93 percent) leads the metals markets this week. Steel (68 percent) and Platinum (63 percent) come in as the next highest in the weekly strength scores.
On the downside, Palladium (50 percent) and Gold (52 percent) come in at the lowest strength level currently.
Strength Statistics:
Gold (51.6 percent) vs Gold previous week (46.4 percent)
Silver (92.9 percent) vs Silver previous week (83.1 percent)
Copper (55.7 percent) vs Copper previous week (54.3 percent)
Platinum (63.4 percent) vs Platinum previous week (75.9 percent)
Palladium (49.7 percent) vs Palladium previous week (48.0 percent)
Steel (67.7 percent) vs Palladium previous week (74.0 percent)
Platinum & Palladium top the 6-Week Strength Trends

COT Strength Score Trends (or move index, calculates the 6-week changes in strength scores) showed that Platinum (34 percent) and Palladium (27 percent) lead the past six weeks trends for metals.
Steel (-13 percent) leads the downside trend scores currently with Copper (-1 percent) as the next market with lower trend scores.
Move Statistics:
Gold (4.8 percent) vs Gold previous week (-10.6 percent)
Silver (20.3 percent) vs Silver previous week (11.5 percent)
Copper (-0.6 percent) vs Copper previous week (2.9 percent)
Platinum (34.0 percent) vs Platinum previous week (45.7 percent)
Palladium (26.7 percent) vs Palladium previous week (18.6 percent)
Steel (-12.9 percent) vs Steel previous week (-8.3 percent)
Individual Markets:
Gold Comex Futures:
 The Gold Comex Futures large speculator standing this week came in at a net position of 187,905 contracts in the data reported through Tuesday. This was a weekly lift of 13,721 contracts from the previous week which had a total of 174,184 net contracts.
This week’s current strength score (the trader positioning range over the past three years, measured from 0 to 100) shows the speculators are currently Bullish with a score of 51.6 percent. The commercials are Bearish with a score of 42.8 percent and the small traders (not shown in chart) are Bullish-Extreme with a score of 97.1 percent.
Price Trend-Following Model: Uptrend
Our weekly trend-following model classifies the current market price position as: Uptrend.
| Gold Futures Statistics | SPECULATORS | COMMERCIALS | SMALL TRADERS |
| – Percent of Open Interest Longs: | 59.4 | 17.0 | 12.5 |
| – Percent of Open Interest Shorts: | 14.2 | 70.1 | 4.6 |
| – Net Position: | 187,905 | -220,826 | 32,921 |
| – Gross Longs: | 246,982 | 70,905 | 51,996 |
| – Gross Shorts: | 59,077 | 291,731 | 19,075 |
| – Long to Short Ratio: | 4.2 to 1 | 0.2 to 1 | 2.7 to 1 |
| NET POSITION TREND: | | | |
| – Strength Index Score (3 Year Range Pct): | 51.6 | 42.8 | 97.1 |
| – Strength Index Reading (3 Year Range): | Bullish | Bearish | Bullish-Extreme |
| NET POSITION MOVEMENT INDEX: | | | |
| – 6-Week Change in Strength Index: | 4.8 | -6.7 | 23.5 |
Silver Comex Futures:
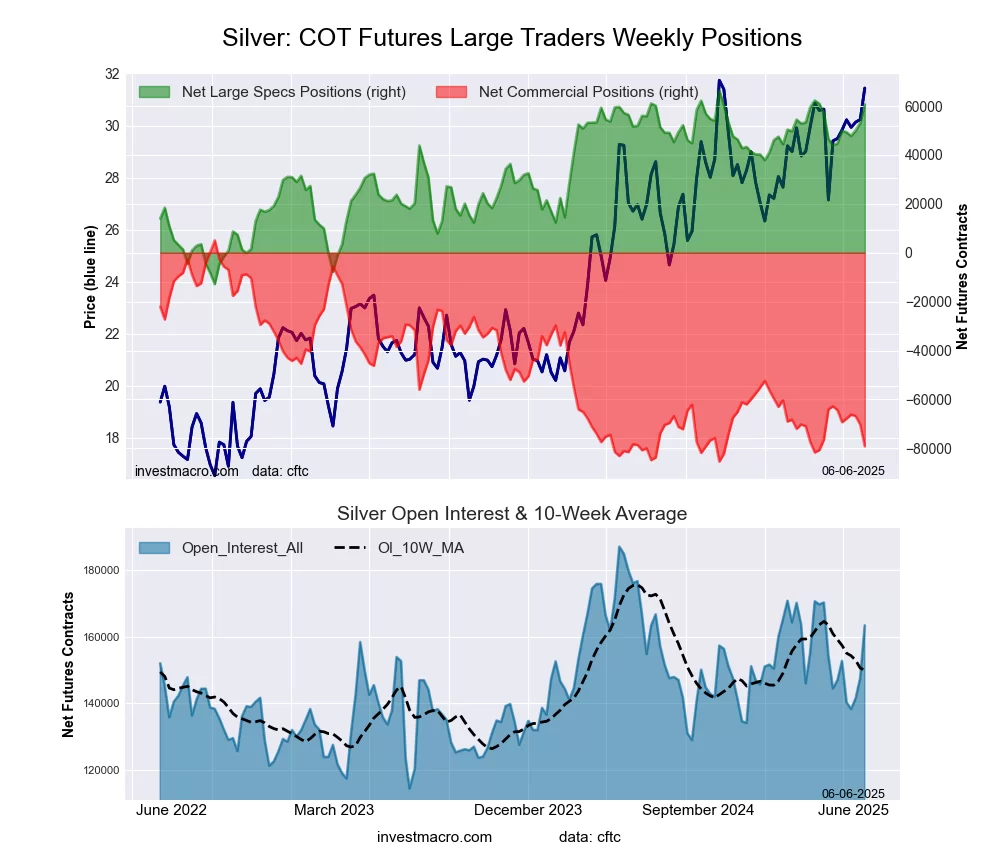 The Silver Comex Futures large speculator standing this week came in at a net position of 60,770 contracts in the data reported through Tuesday. This was a weekly advance of 7,758 contracts from the previous week which had a total of 53,012 net contracts.
This week’s current strength score (the trader positioning range over the past three years, measured from 0 to 100) shows the speculators are currently Bullish-Extreme with a score of 92.9 percent. The commercials are Bearish-Extreme with a score of 6.9 percent and the small traders (not shown in chart) are Bullish with a score of 59.6 percent.
Price Trend-Following Model: Strong Uptrend
Our weekly trend-following model classifies the current market price position as: Strong Uptrend.
| Silver Futures Statistics | SPECULATORS | COMMERCIALS | SMALL TRADERS |
| – Percent of Open Interest Longs: | 50.2 | 20.0 | 18.3 |
| – Percent of Open Interest Shorts: | 13.0 | 68.5 | 7.1 |
| – Net Position: | 60,770 | -79,141 | 18,371 |
| – Gross Longs: | 81,981 | 32,689 | 29,969 |
| – Gross Shorts: | 21,211 | 111,830 | 11,598 |
| – Long to Short Ratio: | 3.9 to 1 | 0.3 to 1 | 2.6 to 1 |
| NET POSITION TREND: | | | |
| – Strength Index Score (3 Year Range Pct): | 92.9 | 6.9 | 59.6 |
| – Strength Index Reading (3 Year Range): | Bullish-Extreme | Bearish-Extreme | Bullish |
| NET POSITION MOVEMENT INDEX: | | | |
| – 6-Week Change in Strength Index: | 20.3 | -16.3 | -6.2 |
Copper Grade #1 Futures:
 The Copper Grade #1 Futures large speculator standing this week came in at a net position of 24,094 contracts in the data reported through Tuesday. This was a weekly gain of 1,513 contracts from the previous week which had a total of 22,581 net contracts.
This week’s current strength score (the trader positioning range over the past three years, measured from 0 to 100) shows the speculators are currently Bullish with a score of 55.7 percent. The commercials are Bearish with a score of 47.2 percent and the small traders (not shown in chart) are Bearish with a score of 35.4 percent.
Price Trend-Following Model: Strong Uptrend
Our weekly trend-following model classifies the current market price position as: Strong Uptrend.
| Copper Futures Statistics | SPECULATORS | COMMERCIALS | SMALL TRADERS |
| – Percent of Open Interest Longs: | 33.6 | 30.5 | 6.9 |
| – Percent of Open Interest Shorts: | 22.3 | 43.3 | 5.5 |
| – Net Position: | 24,094 | -27,013 | 2,919 |
| – Gross Longs: | 71,249 | 64,639 | 14,562 |
| – Gross Shorts: | 47,155 | 91,652 | 11,643 |
| – Long to Short Ratio: | 1.5 to 1 | 0.7 to 1 | 1.3 to 1 |
| NET POSITION TREND: | | | |
| – Strength Index Score (3 Year Range Pct): | 55.7 | 47.2 | 35.4 |
| – Strength Index Reading (3 Year Range): | Bullish | Bearish | Bearish |
| NET POSITION MOVEMENT INDEX: | | | |
| – 6-Week Change in Strength Index: | -0.6 | -2.9 | 24.4 |
Platinum Futures:
 The Platinum Futures large speculator standing this week came in at a net position of 20,049 contracts in the data reported through Tuesday. This was a weekly decrease of -5,294 contracts from the previous week which had a total of 25,343 net contracts.
This week’s current strength score (the trader positioning range over the past three years, measured from 0 to 100) shows the speculators are currently Bullish with a score of 63.4 percent. The commercials are Bearish with a score of 40.8 percent and the small traders (not shown in chart) are Bearish with a score of 35.3 percent.
Price Trend-Following Model: Strong Uptrend
Our weekly trend-following model classifies the current market price position as: Strong Uptrend.
| Platinum Futures Statistics | SPECULATORS | COMMERCIALS | SMALL TRADERS |
| – Percent of Open Interest Longs: | 62.0 | 17.1 | 10.9 |
| – Percent of Open Interest Shorts: | 40.9 | 41.5 | 7.5 |
| – Net Position: | 20,049 | -23,233 | 3,184 |
| – Gross Longs: | 59,019 | 16,293 | 10,349 |
| – Gross Shorts: | 38,970 | 39,526 | 7,165 |
| – Long to Short Ratio: | 1.5 to 1 | 0.4 to 1 | 1.4 to 1 |
| NET POSITION TREND: | | | |
| – Strength Index Score (3 Year Range Pct): | 63.4 | 40.8 | 35.3 |
| – Strength Index Reading (3 Year Range): | Bullish | Bearish | Bearish |
| NET POSITION MOVEMENT INDEX: | | | |
| – 6-Week Change in Strength Index: | 34.0 | -26.0 | -32.1 |
Palladium Futures:
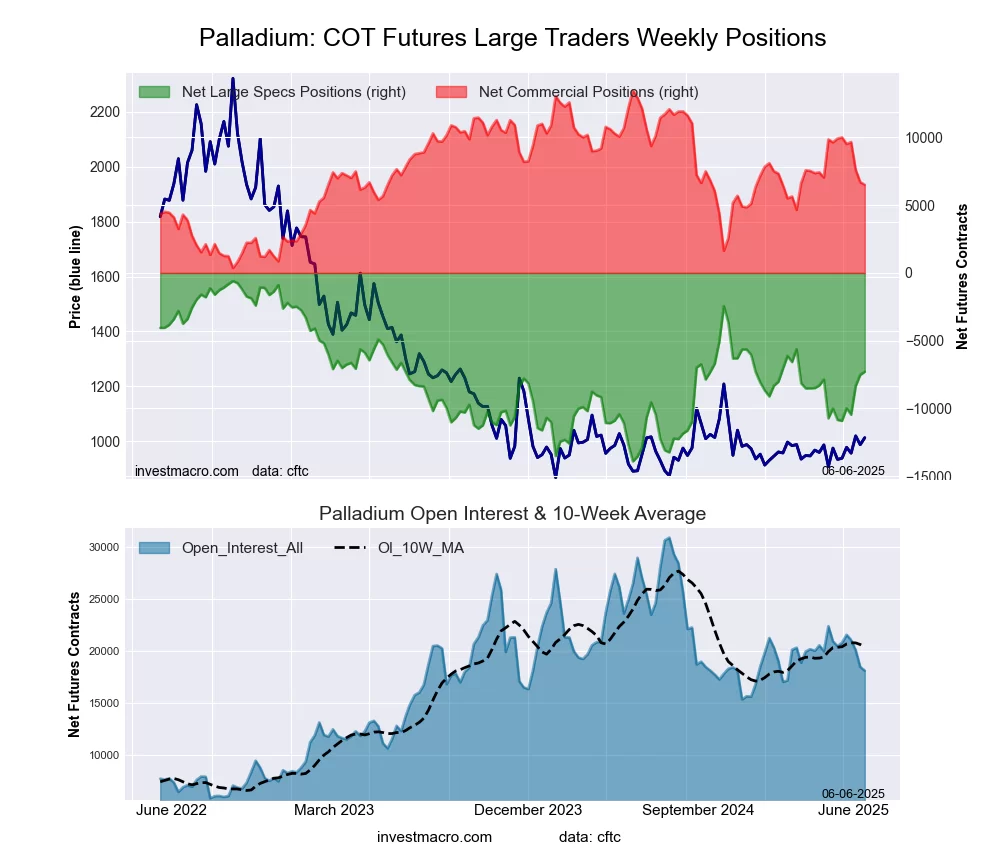 The Palladium Futures large speculator standing this week came in at a net position of -7,293 contracts in the data reported through Tuesday. This was a weekly lift of 233 contracts from the previous week which had a total of -7,526 net contracts.
This week’s current strength score (the trader positioning range over the past three years, measured from 0 to 100) shows the speculators are currently Bearish with a score of 49.7 percent. The commercials are Bearish with a score of 46.9 percent and the small traders (not shown in chart) are Bullish with a score of 67.3 percent.
Price Trend-Following Model: Strong Uptrend
Our weekly trend-following model classifies the current market price position as: Strong Uptrend.
| Palladium Futures Statistics | SPECULATORS | COMMERCIALS | SMALL TRADERS |
| – Percent of Open Interest Longs: | 36.3 | 46.9 | 12.9 |
| – Percent of Open Interest Shorts: | 76.5 | 11.0 | 8.5 |
| – Net Position: | -7,293 | 6,502 | 791 |
| – Gross Longs: | 6,570 | 8,498 | 2,336 |
| – Gross Shorts: | 13,863 | 1,996 | 1,545 |
| – Long to Short Ratio: | 0.5 to 1 | 4.3 to 1 | 1.5 to 1 |
| NET POSITION TREND: | | | |
| – Strength Index Score (3 Year Range Pct): | 49.7 | 46.9 | 67.3 |
| – Strength Index Reading (3 Year Range): | Bearish | Bearish | Bullish |
| NET POSITION MOVEMENT INDEX: | | | |
| – 6-Week Change in Strength Index: | 26.7 | -26.0 | -6.3 |
Steel Futures Futures:
 The Steel Futures large speculator standing this week came in at a net position of -1,544 contracts in the data reported through Tuesday. This was a weekly reduction of -1,279 contracts from the previous week which had a total of -265 net contracts.
This week’s current strength score (the trader positioning range over the past three years, measured from 0 to 100) shows the speculators are currently Bullish with a score of 67.7 percent. The commercials are Bearish with a score of 33.1 percent and the small traders (not shown in chart) are Bearish with a score of 49.0 percent.
Price Trend-Following Model: Weak Uptrend
Our weekly trend-following model classifies the current market price position as: Weak Uptrend.
| Steel Futures Statistics | SPECULATORS | COMMERCIALS | SMALL TRADERS |
| – Percent of Open Interest Longs: | 24.2 | 69.9 | 0.9 |
| – Percent of Open Interest Shorts: | 29.0 | 65.4 | 0.5 |
| – Net Position: | -1,544 | 1,434 | 110 |
| – Gross Longs: | 7,698 | 22,265 | 274 |
| – Gross Shorts: | 9,242 | 20,831 | 164 |
| – Long to Short Ratio: | 0.8 to 1 | 1.1 to 1 | 1.7 to 1 |
| NET POSITION TREND: | | | |
| – Strength Index Score (3 Year Range Pct): | 67.7 | 33.1 | 49.0 |
| – Strength Index Reading (3 Year Range): | Bullish | Bearish | Bearish |
| NET POSITION MOVEMENT INDEX: | | | |
| – 6-Week Change in Strength Index: | -12.9 | 12.1 | 23.6 |
Article By InvestMacro – Receive our weekly COT Newsletter
*COT Report: The COT data, released weekly to the public each Friday, is updated through the most recent Tuesday (data is 3 days old) and shows a quick view of how large speculators or non-commercials (for-profit traders) were positioned in the futures markets.
The CFTC categorizes trader positions according to commercial hedgers (traders who use futures contracts for hedging as part of the business), non-commercials (large traders who speculate to realize trading profits) and nonreportable traders (usually small traders/speculators) as well as their open interest (contracts open in the market at time of reporting). See CFTC criteria here.