Archive for investing – Page 18

COT Energy Futures Charts: Heating Oil, Natural Gas, Bloomberg Index, Crude Oil positions

By CountingPips.com COT Home | Data Tables | Data Downloads | Newsletter

Here are the latest charts and statistics for the Commitment of Traders (COT) data published by the Commodities Futures Trading Commission (CFTC).

The latest COT data is updated through Tuesday April 13 2021 and shows a quick view of how large traders (for-profit speculators and commercial entities) were positioned in the futures markets.


WTI Crude Oil Futures Futures:
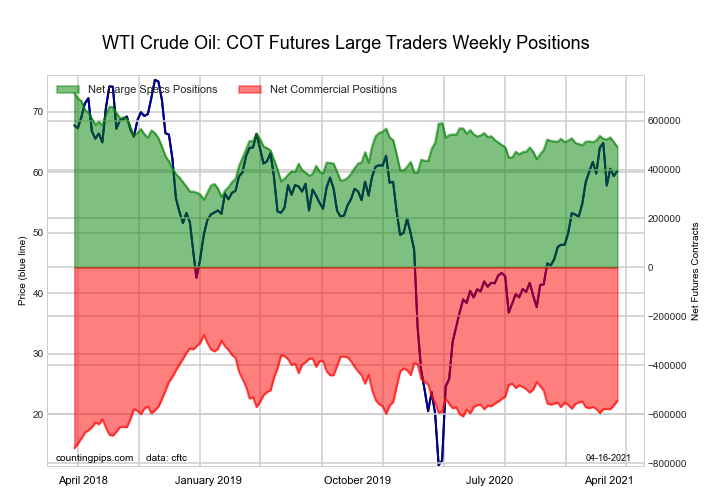

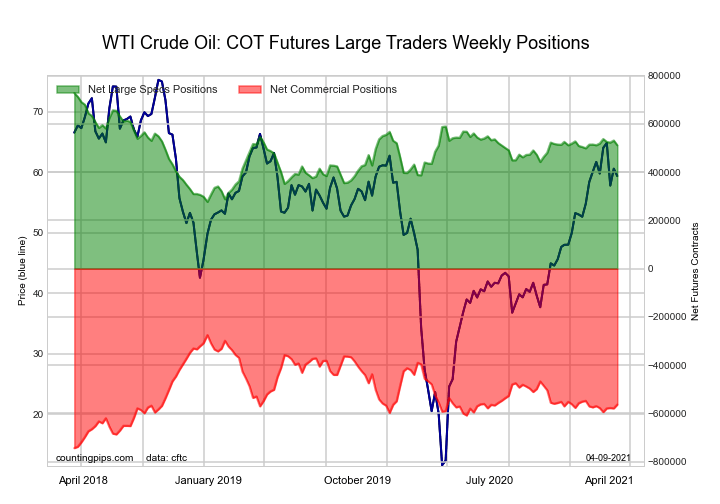
The WTI Crude Oil Futures large speculator standing this week recorded a net position of 492,678 contracts in the data reported through Tuesday. This was a weekly decline of -19,047 contracts from the previous week which had a total of 511,725 net contracts.

This week’s current strength score (the trader positioning range over the past three years, measured from 0 to 100) shows the speculators are currently Bearish with a score of 49.5 percent. The commercials are Bearish with a score of 41.8 percent and the small traders (not shown in chart) are Bullish-Extreme with a score of 88.6 percent.

WTI Crude Oil Futures StatisticsSPECULATORSCOMMERCIALSSMALL TRADERS
– Percent of Open Interest Longs:28.035.04.6
– Percent of Open Interest Shorts:6.658.72.4
– Net Position:492,678-544,68852,010
– Gross Longs:643,807805,801106,355
– Gross Shorts:151,1291,350,48954,345
– Long to Short Ratio:4.3 to 10.6 to 12.0 to 1
NET POSITION TREND:
– COT Index Score (3 Year Range Pct):49.541.888.6
– COT Index Reading (3 Year Range):BearishBearishBullish-Extreme
NET POSITION MOVEMENT INDEX:
– 6-Week Change in Strength Index:-6.17.2-9.6


Brent Crude Oil Futures Futures:


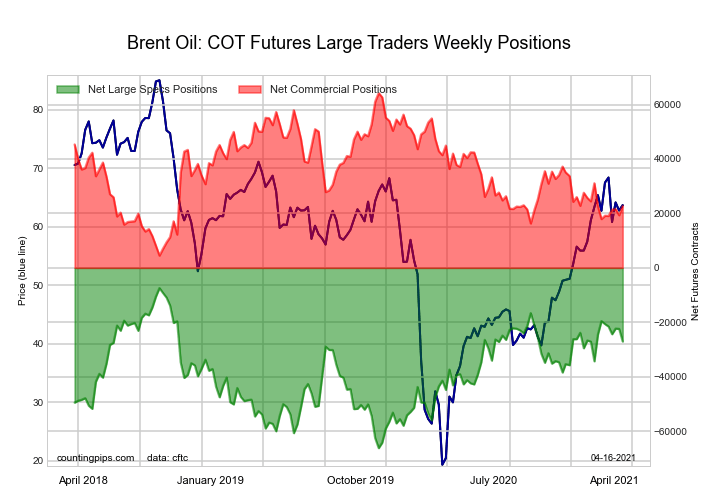
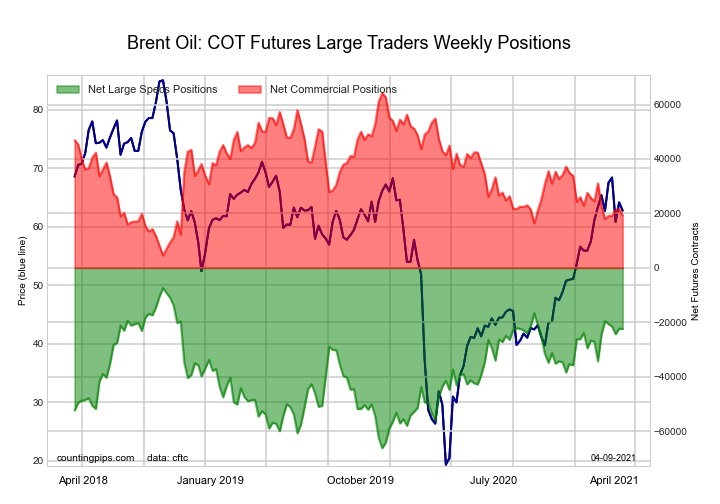
The Brent Crude Oil Futures large speculator standing this week recorded a net position of -27,037 contracts in the data reported through Tuesday. This was a weekly reduction of -4,627 contracts from the previous week which had a total of -22,410 net contracts.

This week’s current strength score (the trader positioning range over the past three years, measured from 0 to 100) shows the speculators are currently Bullish with a score of 66.6 percent. The commercials are Bearish with a score of 30.5 percent and the small traders (not shown in chart) are Bullish with a score of 51.1 percent.

Brent Crude Oil Futures StatisticsSPECULATORSCOMMERCIALSSMALL TRADERS
– Percent of Open Interest Longs:17.544.54.3
– Percent of Open Interest Shorts:30.133.82.2
– Net Position:-27,03722,7184,319
– Gross Longs:37,19094,7299,108
– Gross Shorts:64,22772,0114,789
– Long to Short Ratio:0.6 to 11.3 to 11.9 to 1
NET POSITION TREND:
– COT Index Score (3 Year Range Pct):66.630.551.1
– COT Index Reading (3 Year Range):BullishBearishBullish
NET POSITION MOVEMENT INDEX:
– 6-Week Change in Strength Index:-12.78.016.5


Natural Gas Futures Futures:

Natural Gas Futures large speculator
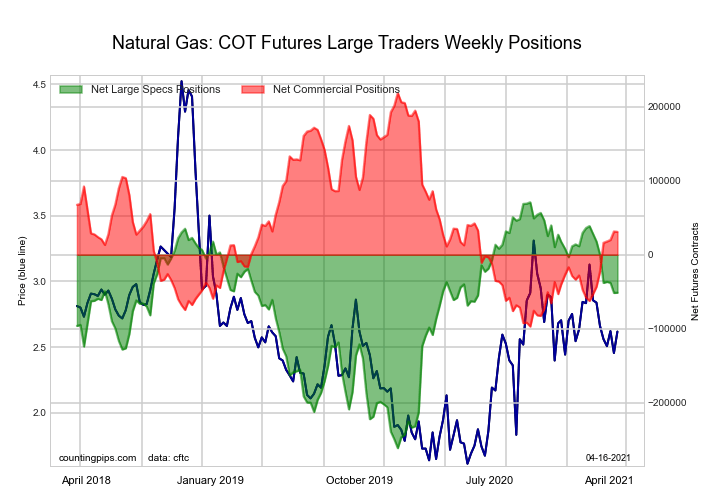
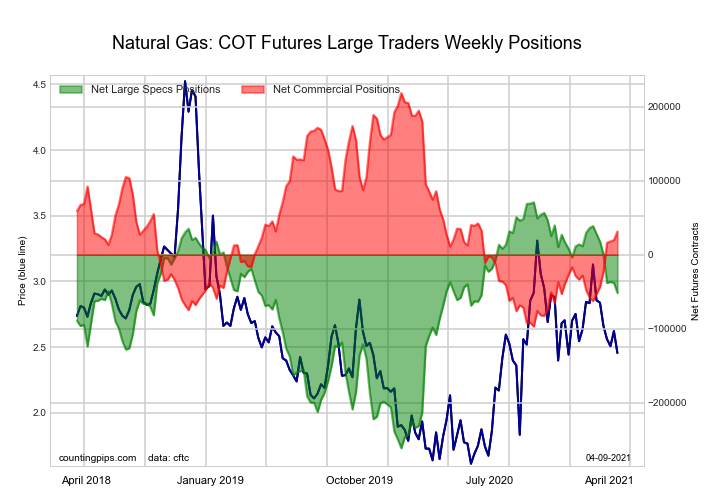
The Natural Gas Futures large speculator standing this week recorded a net position of -51,276 contracts in the data reported through Tuesday. This was a weekly gain of 307 contracts from the previous week which had a total of -51,583 net contracts.

This week’s current strength score (the trader positioning range over the past three years, measured from 0 to 100) shows the speculators are currently Bullish with a score of 63.2 percent. The commercials are Bearish with a score of 40.5 percent and the small traders (not shown in chart) are Bearish-Extreme with a score of 12.3 percent.

Natural Gas Futures StatisticsSPECULATORSCOMMERCIALSSMALL TRADERS
– Percent of Open Interest Longs:21.043.04.7
– Percent of Open Interest Shorts:25.340.43.0
– Net Position:-51,27630,99020,286
– Gross Longs:250,427512,76855,836
– Gross Shorts:301,703481,77835,550
– Long to Short Ratio:0.8 to 11.1 to 11.6 to 1
NET POSITION TREND:
– COT Index Score (3 Year Range Pct):63.240.512.3
– COT Index Reading (3 Year Range):BullishBearishBearish-Extreme
NET POSITION MOVEMENT INDEX:
– 6-Week Change in Strength Index:-20.823.5-16.2


Gasoline Blendstock Futures Futures:

Gasoline Blendstock Futures large speculator
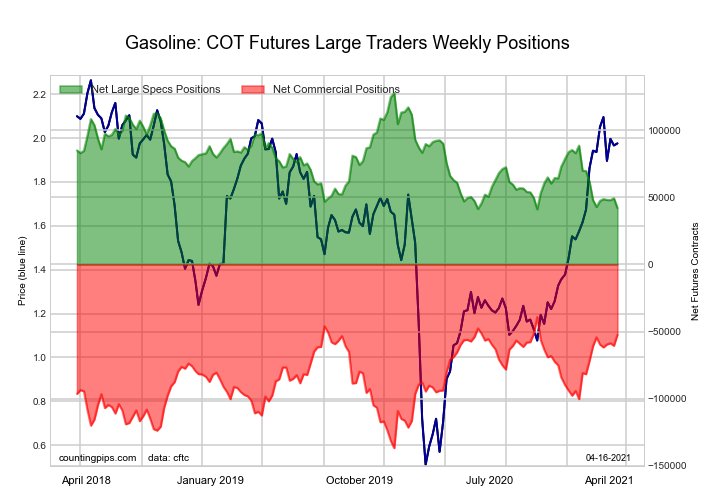
The Gasoline Blendstock Futures large speculator standing this week recorded a net position of 42,034 contracts in the data reported through Tuesday. This was a weekly fall of -7,286 contracts from the previous week which had a total of 49,320 net contracts.

This week’s current strength score (the trader positioning range over the past three years, measured from 0 to 100) shows the speculators are currently Bearish-Extreme with a score of 1.0 percent. The commercials are Bullish-Extreme with a score of 86.5 percent and the small traders (not shown in chart) are Bullish with a score of 73.6 percent.

Nasdaq Mini Futures StatisticsSPECULATORSCOMMERCIALSSMALL TRADERS
– Percent of Open Interest Longs:24.549.16.6
– Percent of Open Interest Shorts:13.363.03.9
– Net Position:42,034-52,41310,379
– Gross Longs:92,222184,68724,969
– Gross Shorts:50,188237,10014,590
– Long to Short Ratio:1.8 to 10.8 to 11.7 to 1
NET POSITION TREND:
– COT Index Score (3 Year Range Pct):1.086.573.6
– COT Index Reading (3 Year Range):Bearish-ExtremeBullish-ExtremeBullish
NET POSITION MOVEMENT INDEX:
– 6-Week Change in Strength Index:-1.02.0-6.3


#2 Heating Oil NY-Harbor Futures Futures:
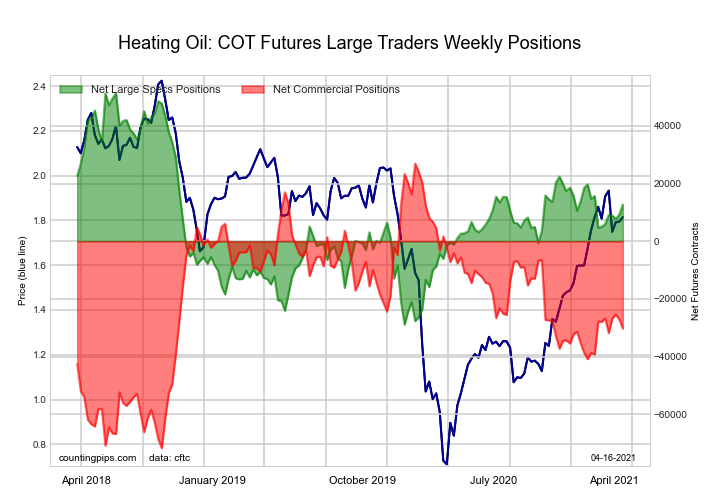
#2 Heating Oil NY-Harbor Futures large speculator
The #2 Heating Oil NY-Harbor Futures large speculator standing this week recorded a net position of 12,702 contracts in the data reported through Tuesday. This was a weekly increase of 3,410 contracts from the previous week which had a total of 9,292 net contracts.

This week’s current strength score (the trader positioning range over the past three years, measured from 0 to 100) shows the speculators are currently Bullish with a score of 51.8 percent. The commercials are Bearish with a score of 42.0 percent and the small traders (not shown in chart) are Bullish with a score of 69.9 percent.

Heating Oil Futures StatisticsSPECULATORSCOMMERCIALSSMALL TRADERS
– Percent of Open Interest Longs:15.748.410.5
– Percent of Open Interest Shorts:12.655.86.2
– Net Position:12,702-30,22717,525
– Gross Longs:64,015197,02842,846
– Gross Shorts:51,313227,25525,321
– Long to Short Ratio:1.2 to 10.9 to 11.7 to 1
NET POSITION TREND:
– COT Index Score (3 Year Range Pct):51.842.069.9
– COT Index Reading (3 Year Range):BullishBearishBullish
NET POSITION MOVEMENT INDEX:
– 6-Week Change in Strength Index:9.5-2.4-21.7


Bloomberg Commodity Index Futures Futures:

Bloomberg Commodity Index Futures large speculator
The Bloomberg Commodity Index Futures large speculator standing this week recorded a net position of -12,101 contracts in the data reported through Tuesday. This was a weekly increase of 46 contracts from the previous week which had a total of -12,147 net contracts.

This week’s current strength score (the trader positioning range over the past three years, measured from 0 to 100) shows the speculators are currently Bearish with a score of 33.5 percent. The commercials are Bullish with a score of 66.3 percent and the small traders (not shown in chart) are Bullish with a score of 69.9 percent.

Bloomberg Index Futures StatisticsSPECULATORSCOMMERCIALSSMALL TRADERS
– Percent of Open Interest Longs:51.446.81.3
– Percent of Open Interest Shorts:87.012.20.2
– Net Position:-12,10111,724377
– Gross Longs:17,45615,882429
– Gross Shorts:29,5574,15852
– Long to Short Ratio:0.6 to 13.8 to 18.2 to 1
NET POSITION TREND:
– COT Index Score (3 Year Range Pct):33.566.369.9
– COT Index Reading (3 Year Range):BearishBullishBullish
NET POSITION MOVEMENT INDEX:
– 6-Week Change in Strength Index:33.5-33.71.2


Article By CountingPips.comReceive our weekly COT Reports by Email

*COT Report: The COT data, released weekly to the public each Friday, is updated through the most recent Tuesday (data is 3 days old) and shows a quick view of how large speculators or non-commercials (for-profit traders) were positioned in the futures markets.

The CFTC categorizes trader positions according to commercial hedgers (traders who use futures contracts for hedging as part of the business), non-commercials (large traders who speculate to realize trading profits) and nonreportable traders (usually small traders/speculators).

Find CFTC criteria here: (http://www.cftc.gov/MarketReports/CommitmentsofTraders/ExplanatoryNotes/index.htm).

COT Bonds Futures Charts: Eurodollar, 2-Year Treasury Notes, 5-Year Treasury Notes, Fed Funds,

By CountingPips.com COT Home | Data Tables | Data Downloads | Newsletter

Here are the latest charts and statistics for the Commitment of Traders (COT) data published by the Commodities Futures Trading Commission (CFTC).

The latest COT data is updated through Tuesday April 13 2021 and shows a quick view of how large traders (for-profit speculators and commercial entities) were positioned in the futures markets.


30-Day Federal Funds Futures:

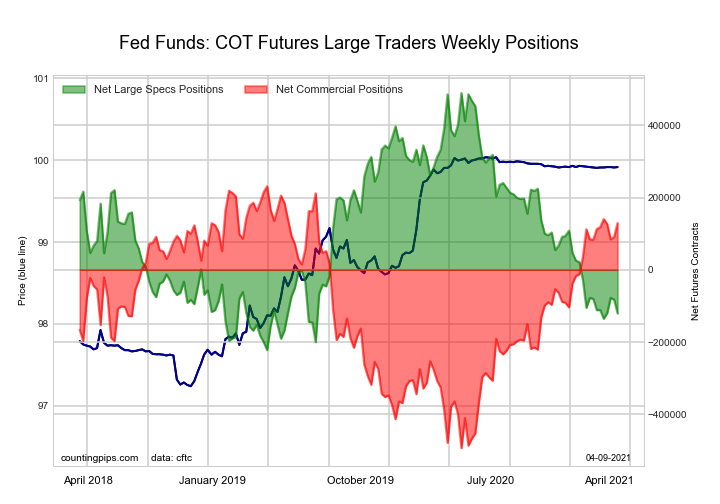
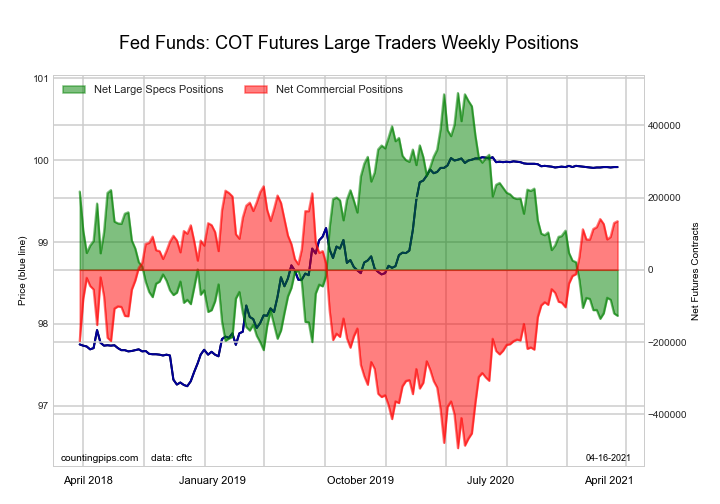
The 30-Day Federal Funds large speculator standing this week came in at a net position of -127,125 contracts in the data reported through Tuesday. This was a weekly lowering of -6,452 contracts from the previous week which had a total of -120,673 net contracts.

This week’s current strength score (the trader positioning range over the past three years, measured from 0 to 100) shows the speculators are currently Bearish-Extreme with a score of 13.3 percent. The commercials are Bullish-Extreme with a score of 86.7 percent and the small traders (not shown in chart) are Bullish with a score of 57.6 percent.

30-Day Federal Funds StatisticsSPECULATORSCOMMERCIALSSMALL TRADERS
– Percent of Open Interest Longs:8.169.82.3
– Percent of Open Interest Shorts:20.456.83.0
– Net Position:-127,125134,520-7,395
– Gross Longs:83,807723,58423,358
– Gross Shorts:210,932589,06430,753
– Long to Short Ratio:0.4 to 11.2 to 10.8 to 1
NET POSITION TREND:
– COT Index Score (3 Year Range Pct):13.386.757.6
– COT Index Reading (3 Year Range):Bearish-ExtremeBullish-ExtremeBullish
NET POSITION MOVEMENT INDEX:
– 6-Week Change in Strength Index:-2.32.2-0.4


2-Year Treasury Note Futures:

2-Year Treasury Note Futures

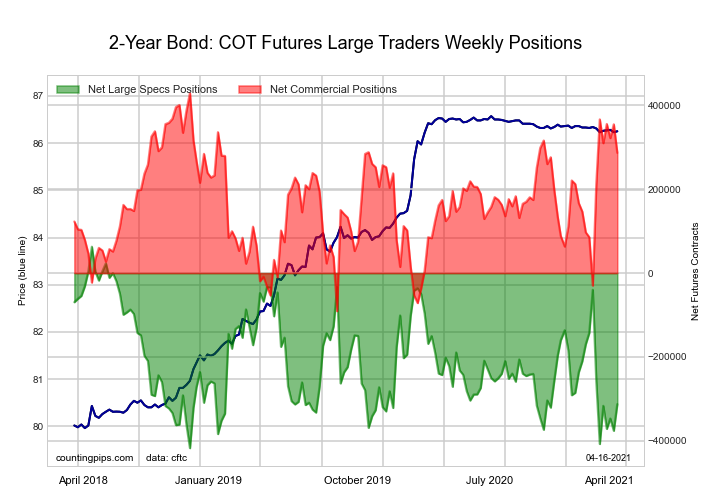
The 2-Year Treasury Note large speculator standing this week came in at a net position of -312,432 contracts in the data reported through Tuesday. This was a weekly increase of 63,388 contracts from the previous week which had a total of -375,820 net contracts.

This week’s current strength score (the trader positioning range over the past three years, measured from 0 to 100) shows the speculators are currently Bearish with a score of 21.8 percent. The commercials are Bullish with a score of 72.6 percent and the small traders (not shown in chart) are Bearish with a score of 48.4 percent.

2-Year Treasury Note StatisticsSPECULATORSCOMMERCIALSSMALL TRADERS
– Percent of Open Interest Longs:16.276.66.3
– Percent of Open Interest Shorts:29.964.05.2
– Net Position:-312,432286,80925,623
– Gross Longs:371,1741,749,602144,097
– Gross Shorts:683,6061,462,793118,474
– Long to Short Ratio:0.5 to 11.2 to 11.2 to 1
NET POSITION TREND:
– COT Index Score (3 Year Range Pct):21.872.648.4
– COT Index Reading (3 Year Range):BearishBullishBearish
NET POSITION MOVEMENT INDEX:
– 6-Week Change in Strength Index:-11.414.5-10.8


5-Year Treasury Note Futures:

5-Year Treasury Note Futures

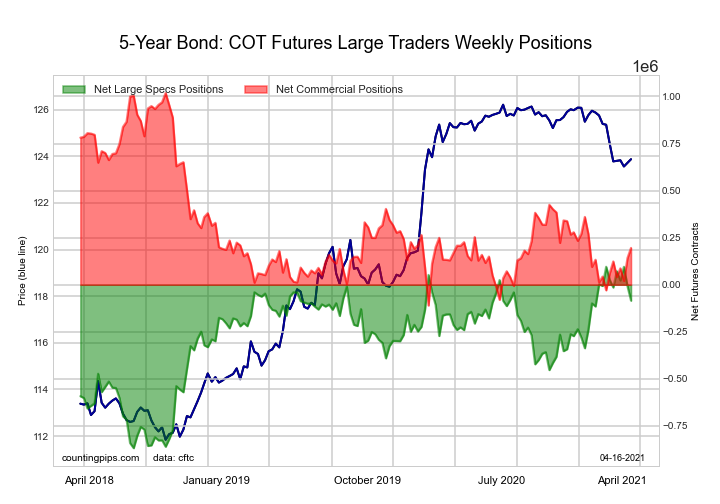
The 5-Year Treasury Note large speculator standing this week came in at a net position of -84,247 contracts in the data reported through Tuesday. This was a weekly fall of -76,630 contracts from the previous week which had a total of -7,617 net contracts.

This week’s current strength score (the trader positioning range over the past three years, measured from 0 to 100) shows the speculators are currently Bullish-Extreme with a score of 81.3 percent. The commercials are Bearish with a score of 27.1 percent and the small traders (not shown in chart) are Bearish with a score of 30.2 percent.

5-Year Treasury Note StatisticsSPECULATORSCOMMERCIALSSMALL TRADERS
– Percent of Open Interest Longs:10.678.78.2
– Percent of Open Interest Shorts:13.073.011.4
– Net Position:-84,247195,397-111,150
– Gross Longs:364,2832,708,144282,197
– Gross Shorts:448,5302,512,747393,347
– Long to Short Ratio:0.8 to 11.1 to 10.7 to 1
NET POSITION TREND:
– COT Index Score (3 Year Range Pct):81.327.130.2
– COT Index Reading (3 Year Range):Bullish-ExtremeBearishBearish
NET POSITION MOVEMENT INDEX:
– 6-Week Change in Strength Index:-11.511.9-9.1


10-Year Treasury Note Futures:

10-Year Treasury Note large speculator standing

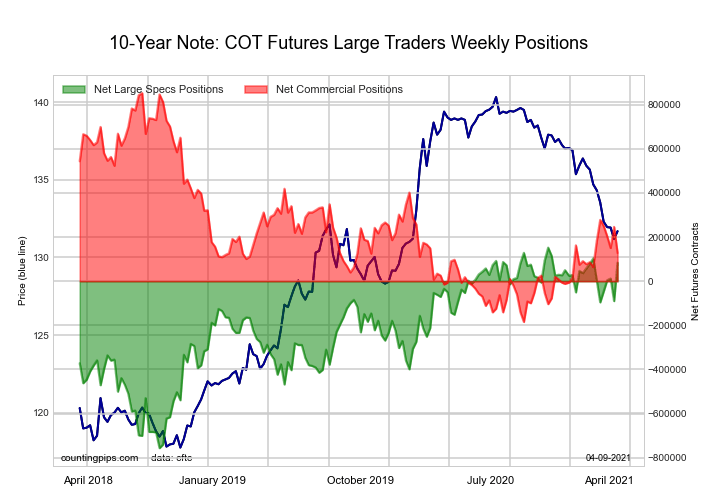
The 10-Year Treasury Note large speculator standing this week came in at a net position of -2,652 contracts in the data reported through Tuesday. This was a weekly lowering of -87,211 contracts from the previous week which had a total of 84,559 net contracts.

This week’s current strength score (the trader positioning range over the past three years, measured from 0 to 100) shows the speculators are currently Bullish-Extreme with a score of 82.9 percent. The commercials are Bearish with a score of 40.3 percent and the small traders (not shown in chart) are Bearish-Extreme with a score of 11.3 percent.

10-Year Treasury Note StatisticsSPECULATORSCOMMERCIALSSMALL TRADERS
– Percent of Open Interest Longs:17.772.87.9
– Percent of Open Interest Shorts:17.866.813.8
– Net Position:-2,652233,204-230,552
– Gross Longs:689,7202,837,439308,644
– Gross Shorts:692,3722,604,235539,196
– Long to Short Ratio:1.0 to 11.1 to 10.6 to 1
NET POSITION TREND:
– COT Index Score (3 Year Range Pct):82.940.311.3
– COT Index Reading (3 Year Range):Bullish-ExtremeBearishBearish-Extreme
NET POSITION MOVEMENT INDEX:
– 6-Week Change in Strength Index:10.2-4.3-13.2


Ultra 10-Year Notes Futures:

Ultra 10-Year Notes large speculator standing

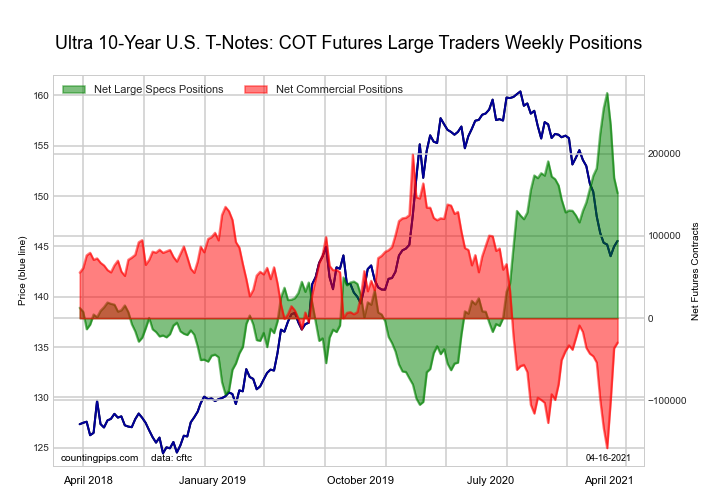
The Ultra 10-Year Notes large speculator standing this week came in at a net position of 151,971 contracts in the data reported through Tuesday. This was a weekly decline of -18,664 contracts from the previous week which had a total of 170,635 net contracts.

This week’s current strength score (the trader positioning range over the past three years, measured from 0 to 100) shows the speculators are currently Bullish with a score of 67.9 percent. The commercials are Bearish with a score of 36.0 percent and the small traders (not shown in chart) are Bearish-Extreme with a score of 10.9 percent.

Ultra 10-Year Notes StatisticsSPECULATORSCOMMERCIALSSMALL TRADERS
– Percent of Open Interest Longs:20.370.88.1
– Percent of Open Interest Shorts:9.872.916.5
– Net Position:151,971-29,596-122,375
– Gross Longs:294,4651,027,763117,111
– Gross Shorts:142,4941,057,359239,486
– Long to Short Ratio:2.1 to 11.0 to 10.5 to 1
NET POSITION TREND:
– COT Index Score (3 Year Range Pct):67.936.010.9
– COT Index Reading (3 Year Range):BullishBearishBearish-Extreme
NET POSITION MOVEMENT INDEX:
– 6-Week Change in Strength Index:-8.06.85.5


US Treasury Bonds Futures:

US Treasury Bonds large speculator standing

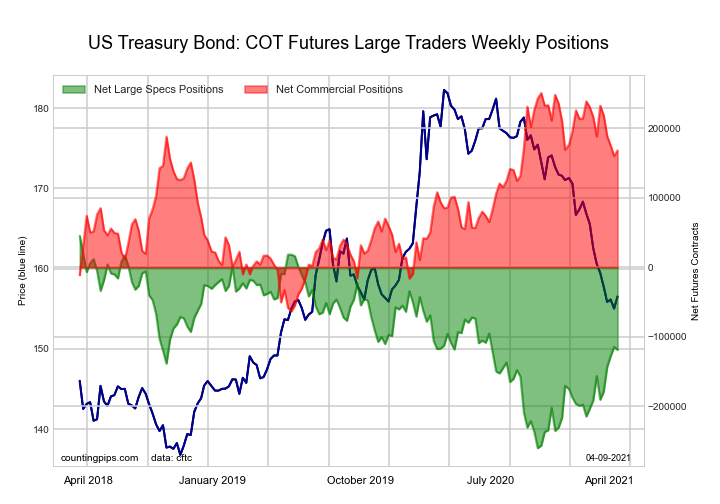
The US Treasury Bonds large speculator standing this week came in at a net position of -118,009 contracts in the data reported through Tuesday. This was a weekly advance of 485 contracts from the previous week which had a total of -118,494 net contracts.

This week’s current strength score (the trader positioning range over the past three years, measured from 0 to 100) shows the speculators are currently Bullish with a score of 51.0 percent. The commercials are Bullish with a score of 72.6 percent and the small traders (not shown in chart) are Bearish-Extreme with a score of 18.5 percent.

US Treasury Bonds StatisticsSPECULATORSCOMMERCIALSSMALL TRADERS
– Percent of Open Interest Longs:6.777.513.5
– Percent of Open Interest Shorts:16.863.417.5
– Net Position:-118,009164,665-46,656
– Gross Longs:78,935907,628158,390
– Gross Shorts:196,944742,963205,046
– Long to Short Ratio:0.4 to 11.2 to 10.8 to 1
NET POSITION TREND:
– COT Index Score (3 Year Range Pct):51.072.618.5
– COT Index Reading (3 Year Range):BullishBullishBearish-Extreme
NET POSITION MOVEMENT INDEX:
– 6-Week Change in Strength Index:26.0-21.6-3.5


Ultra US Treasury Bonds Futures:

Ultra US Treasury Bonds large speculators

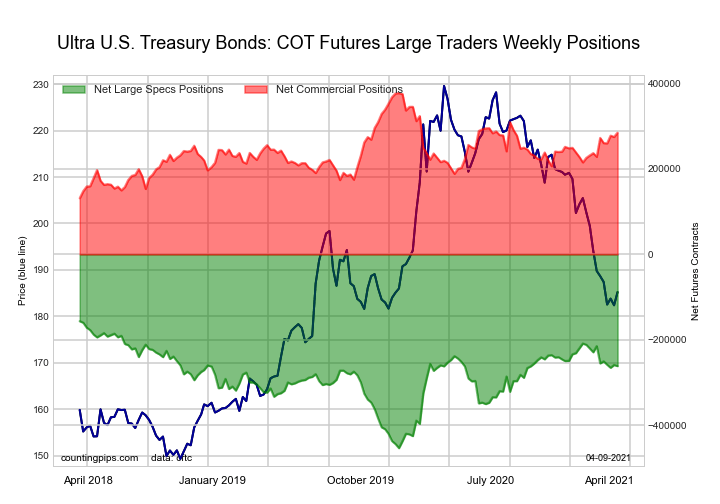
The Ultra US Treasury Bonds large speculator standing this week came in at a net position of -267,848 contracts in the data reported through Tuesday. This was a weekly fall of -6,029 contracts from the previous week which had a total of -261,819 net contracts.

This week’s current strength score (the trader positioning range over the past three years, measured from 0 to 100) shows the speculators are currently Bullish with a score of 63.3 percent. The commercials are Bullish with a score of 60.9 percent and the small traders (not shown in chart) are Bearish-Extreme with a score of 2.5 percent.

Ultra US Treasury Bonds StatisticsSPECULATORSCOMMERCIALSSMALL TRADERS
– Percent of Open Interest Longs:5.482.411.8
– Percent of Open Interest Shorts:29.057.013.6
– Net Position:-267,848287,986-20,138
– Gross Longs:61,551935,097133,920
– Gross Shorts:329,399647,111154,058
– Long to Short Ratio:0.2 to 11.4 to 10.9 to 1
NET POSITION TREND:
– COT Index Score (3 Year Range Pct):63.360.92.5
– COT Index Reading (3 Year Range):BullishBullishBearish-Extreme
NET POSITION MOVEMENT INDEX:
– 6-Week Change in Strength Index:-4.26.7-2.4


3-Month Eurodollars Futures:

3-Month Eurodollars large speculator standings

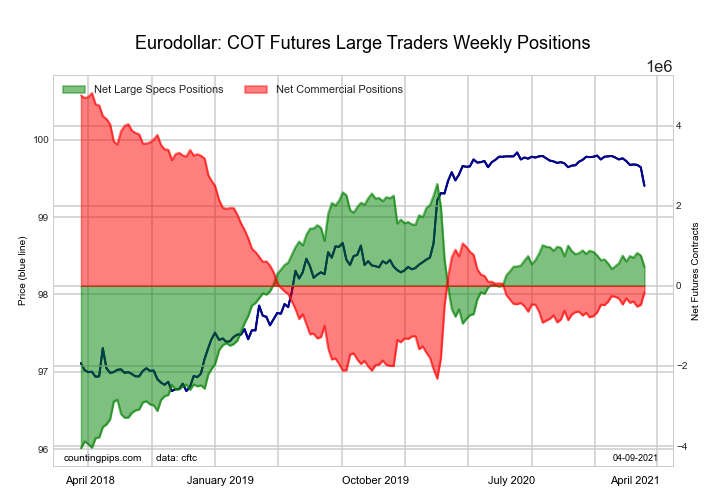
The 3-Month Eurodollars large speculator standing this week came in at a net position of 397,584 contracts in the data reported through Tuesday. This was a weekly reduction of -70,861 contracts from the previous week which had a total of 468,445 net contracts.

This week’s current strength score (the trader positioning range over the past three years, measured from 0 to 100) shows the speculators are currently Bullish with a score of 67.4 percent. The commercials are Bearish with a score of 31.7 percent and the small traders (not shown in chart) are Bullish with a score of 59.2 percent.

3-Month Eurodollars StatisticsSPECULATORSCOMMERCIALSSMALL TRADERS
– Percent of Open Interest Longs:19.949.64.9
– Percent of Open Interest Shorts:16.550.07.8
– Net Position:397,584-56,761-340,823
– Gross Longs:2,325,8935,798,474576,408
– Gross Shorts:1,928,3095,855,235917,231
– Long to Short Ratio:1.2 to 11.0 to 10.6 to 1
NET POSITION TREND:
– COT Index Score (3 Year Range Pct):67.431.759.2
– COT Index Reading (3 Year Range):BullishBearishBullish
NET POSITION MOVEMENT INDEX:
– 6-Week Change in Strength Index:-3.23.5-5.5


Article By CountingPips.comReceive our weekly COT Reports by Email

*COT Report: The COT data, released weekly to the public each Friday, is updated through the most recent Tuesday (data is 3 days old) and shows a quick view of how large speculators or non-commercials (for-profit traders) were positioned in the futures markets.

The CFTC categorizes trader positions according to commercial hedgers (traders who use futures contracts for hedging as part of the business), non-commercials (large traders who speculate to realize trading profits) and nonreportable traders (usually small traders/speculators).

Find CFTC criteria here: (http://www.cftc.gov/MarketReports/CommitmentsofTraders/ExplanatoryNotes/index.htm).
COT Currency Futures Charts: Brazil Real, Swiss Franc, Euro, US Dollar & Bitcoin

By CountingPips.comReceive our weekly COT Reports by Email

Here are the latest charts and statistics for the Commitment of Traders (COT) data published by the Commodities Futures Trading Commission (CFTC).

The latest COT data is updated through Tuesday April 06 2021 and shows a quick view of how large traders (for-profit speculators and commercial entities) were positioned in the futures markets. All currency positions are in direct relation to the US dollar where, for example, a bet for the euro is a bet that the euro will rise versus the dollar while a bet against the euro will be a bet that the euro will decline versus the dollar.


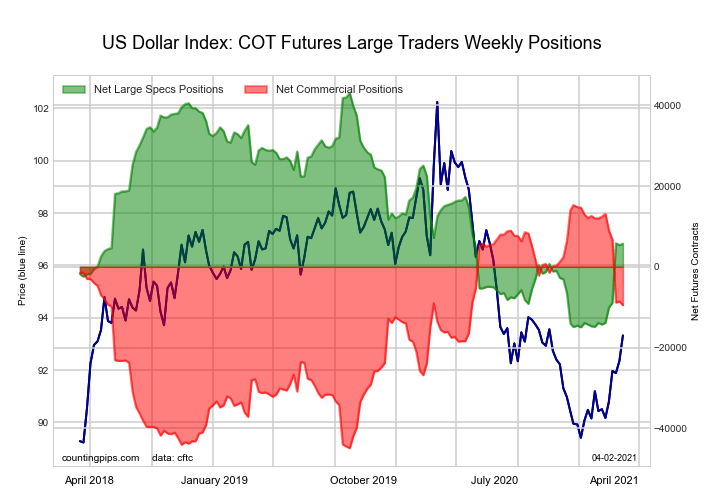
US DOLLAR INDEX Futures:


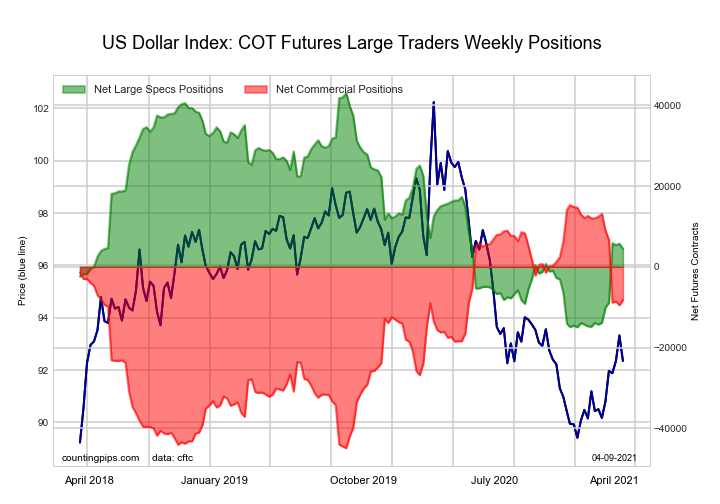
The US DOLLAR INDEX: large speculator standing this week equaled a net position of 4,449 contracts in the data reported through Tuesday. This was a weekly decrease of -1,277 contracts from the previous week which had a total of 5,726 net contracts.

This week’s current strength score (the trader positioning range over the past three years, measured from 0 to 100) shows the speculators are currently Bearish with a score of 33.5 percent. The commercials are Bullish with a score of 60.9 percent and the small traders (not shown in chart) are Bullish with a score of 68.3 percent.

US DOLLAR INDEX StatisticsSPECULATORSCOMMERCIALSSMALL TRADERS
– Percent of Open Interest Longs:70.86.915.8
– Percent of Open Interest Shorts:59.528.06.1
– Net Position:4,449-8,2313,782
– Gross Longs:27,7062,7136,179
– Gross Shorts:23,25710,9442,397
– Long to Short Ratio:1.2 to 10.2 to 12.6 to 1
NET POSITION TREND:
– COT Index Score (3 Year Range Pct):33.560.968.3
– COT Index Reading (3 Year Range):BearishBullishBullish
NET POSITION MOVEMENT INDEX:
– 6-Week Change in Strength Index:31.6-35.539.3


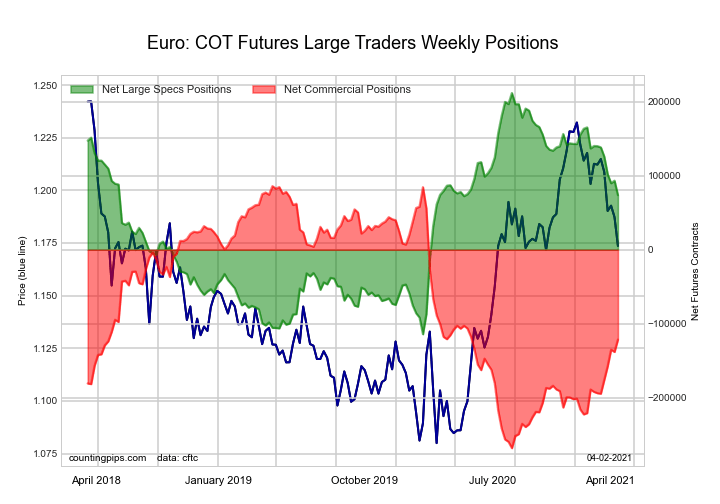
EURO Currency Futures:


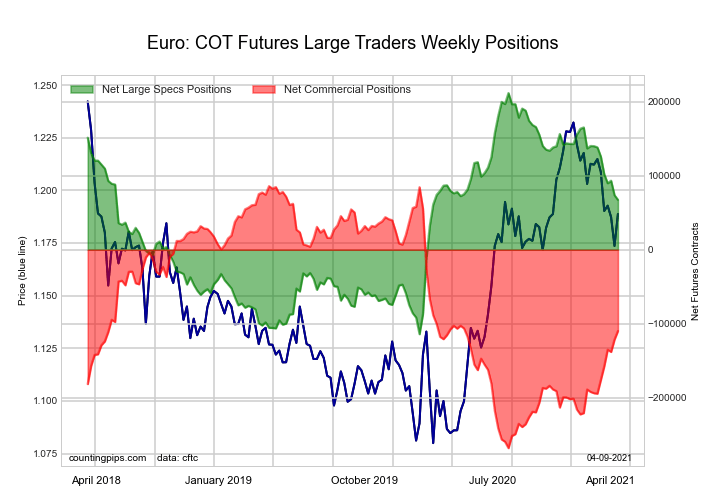
The EURO Currency: large speculator standing this week equaled a net position of 67,522 contracts in the data reported through Tuesday. This was a weekly reduction of -6,217 contracts from the previous week which had a total of 73,739 net contracts.

This week’s current strength score (the trader positioning range over the past three years, measured from 0 to 100) shows the speculators are currently Bullish with a score of 55.7 percent. The commercials are Bearish with a score of 44.7 percent and the small traders (not shown in chart) are Bullish with a score of 64.6 percent.

EURO Currency StatisticsSPECULATORSCOMMERCIALSSMALL TRADERS
– Percent of Open Interest Longs:29.955.114.0
– Percent of Open Interest Shorts:19.472.27.4
– Net Position:67,522-109,74142,219
– Gross Longs:192,230354,40189,693
– Gross Shorts:124,708464,14247,474
– Long to Short Ratio:1.5 to 10.8 to 11.9 to 1
NET POSITION TREND:
– COT Index Score (3 Year Range Pct):55.744.764.6
– COT Index Reading (3 Year Range):BullishBearishBullish
NET POSITION MOVEMENT INDEX:
– 6-Week Change in Strength Index:-21.723.9-24.2


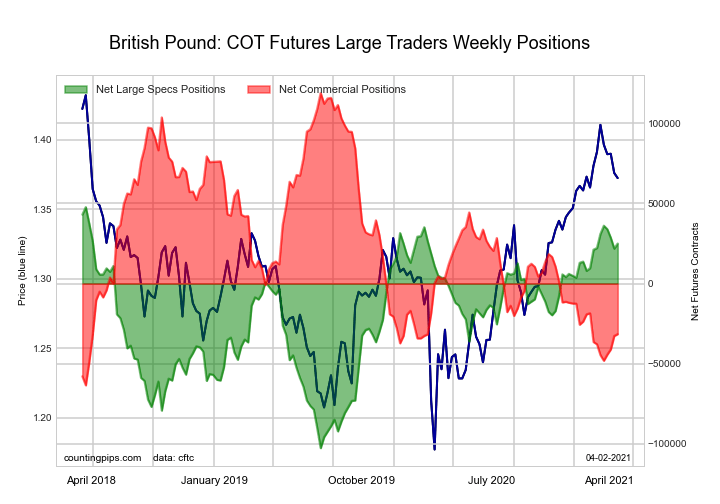
BRITISH POUND STERLING Futures:


The BRITISH POUND STERLING: large speculator standing this week equaled a net position of 19,951 contracts in the data reported through Tuesday. This was a weekly lowering of -5,008 contracts from the previous week which had a total of 24,959 net contracts.

This week’s current strength score (the trader positioning range over the past three years, measured from 0 to 100) shows the speculators are currently Bullish-Extreme with a score of 81.5 percent. The commercials are Bearish-Extreme with a score of 18.3 percent and the small traders (not shown in chart) are Bullish-Extreme with a score of 86.8 percent.

BRITISH POUND StatisticsSPECULATORSCOMMERCIALSSMALL TRADERS
– Percent of Open Interest Longs:32.242.524.9
– Percent of Open Interest Shorts:18.063.917.6
– Net Position:19,951-30,12710,176
– Gross Longs:45,27059,71434,960
– Gross Shorts:25,31989,84124,784
– Long to Short Ratio:1.8 to 10.7 to 11.4 to 1
NET POSITION TREND:
– COT Index Score (3 Year Range Pct):81.518.386.8
– COT Index Reading (3 Year Range):Bullish-ExtremeBearish-ExtremeBullish-Extreme
NET POSITION MOVEMENT INDEX:
– 6-Week Change in Strength Index:-7.38.0-8.2


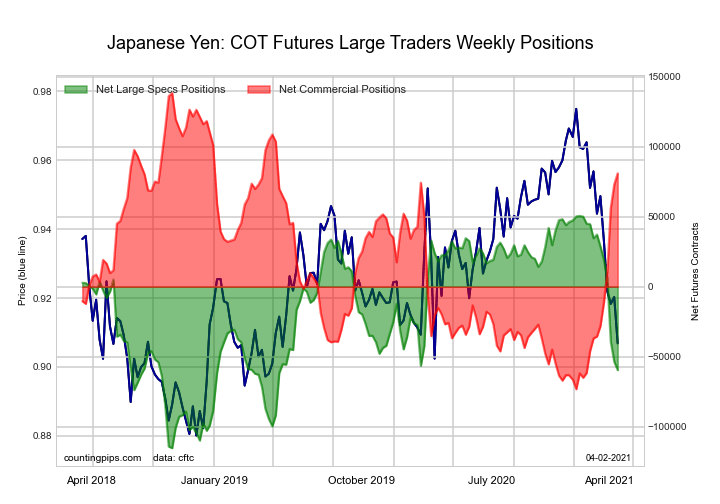
JAPANESE YEN Futures:


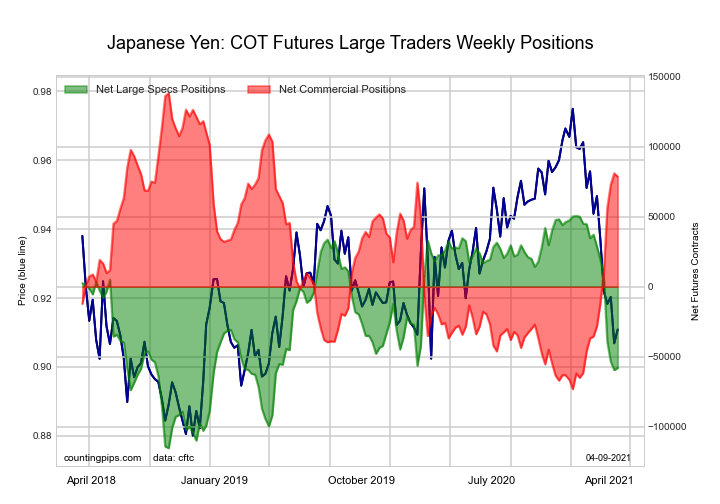
The JAPANESE YEN: large speculator standing this week equaled a net position of -57,989 contracts in the data reported through Tuesday. This was a weekly lift of 1,492 contracts from the previous week which had a total of -59,481 net contracts.

This week’s current strength score (the trader positioning range over the past three years, measured from 0 to 100) shows the speculators are currently Bearish with a score of 34.5 percent. The commercials are Bullish with a score of 71.8 percent and the small traders (not shown in chart) are Bearish-Extreme with a score of 16.9 percent.

JAPANESE YEN StatisticsSPECULATORSCOMMERCIALSSMALL TRADERS
– Percent of Open Interest Longs:16.371.711.5
– Percent of Open Interest Shorts:51.623.924.0
– Net Position:-57,98978,537-20,548
– Gross Longs:26,794117,84618,907
– Gross Shorts:84,78339,30939,455
– Long to Short Ratio:0.3 to 13.0 to 10.5 to 1
NET POSITION TREND:
– COT Index Score (3 Year Range Pct):34.571.816.9
– COT Index Reading (3 Year Range):BearishBullishBearish-Extreme
NET POSITION MOVEMENT INDEX:
– 6-Week Change in Strength Index:-52.350.5-38.2


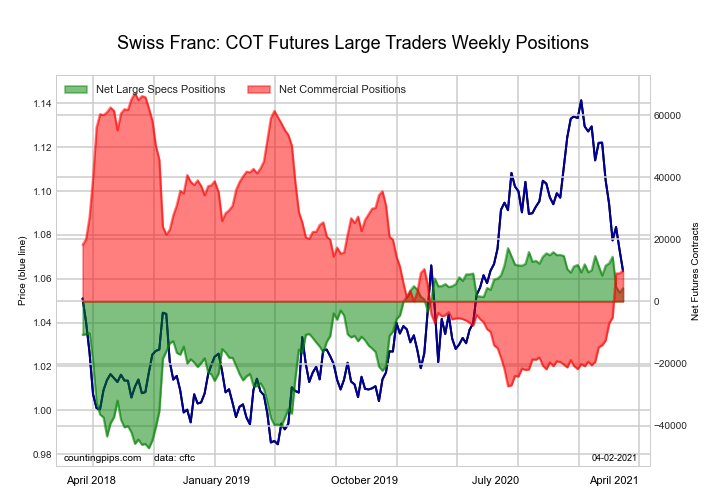
SWISS FRANC Futures:


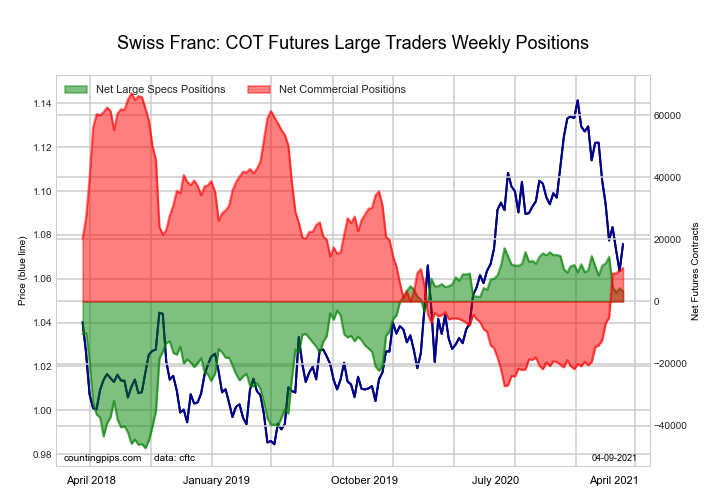
The SWISS FRANC: large speculator standing this week equaled a net position of 3,245 contracts in the data reported through Tuesday. This was a weekly decrease of -1,024 contracts from the previous week which had a total of 4,269 net contracts.

This week’s current strength score (the trader positioning range over the past three years, measured from 0 to 100) shows the speculators are currently Bullish with a score of 78.4 percent. The commercials are Bearish with a score of 40.3 percent and the small traders (not shown in chart) are Bearish with a score of 27.5 percent.

SWISS FRANC StatisticsSPECULATORSCOMMERCIALSSMALL TRADERS
– Percent of Open Interest Longs:35.943.420.3
– Percent of Open Interest Shorts:28.518.752.4
– Net Position:3,24510,786-14,031
– Gross Longs:15,69018,9708,848
– Gross Shorts:12,4458,18422,879
– Long to Short Ratio:1.3 to 12.3 to 10.4 to 1
NET POSITION TREND:
– COT Index Score (3 Year Range Pct):78.440.327.5
– COT Index Reading (3 Year Range):BullishBearishBearish
NET POSITION MOVEMENT INDEX:
– 6-Week Change in Strength Index:-12.924.7-41.1


CANADIAN DOLLAR Futures:


The CANADIAN DOLLAR: large speculator standing this week equaled a net position of 2,690 contracts in the data reported through Tuesday. This was a weekly lowering of -3,828 contracts from the previous week which had a total of 6,518 net contracts.

This week’s current strength score (the trader positioning range over the past three years, measured from 0 to 100) shows the speculators are currently Bullish with a score of 57.2 percent. The commercials are Bearish with a score of 29.0 percent and the small traders (not shown in chart) are Bullish-Extreme with a score of 87.1 percent.

CANADIAN DOLLAR StatisticsSPECULATORSCOMMERCIALSSMALL TRADERS
– Percent of Open Interest Longs:28.642.927.5
– Percent of Open Interest Shorts:27.060.611.4
– Net Position:2,690-29,42126,731
– Gross Longs:47,50671,32945,729
– Gross Shorts:44,816100,75018,998
– Long to Short Ratio:1.1 to 10.7 to 12.4 to 1
NET POSITION TREND:
– COT Index Score (3 Year Range Pct):57.229.087.1
– COT Index Reading (3 Year Range):BullishBearishBullish-Extreme
NET POSITION MOVEMENT INDEX:
– 6-Week Change in Strength Index:-5.47.7-7.6


AUSTRALIAN DOLLAR Futures:


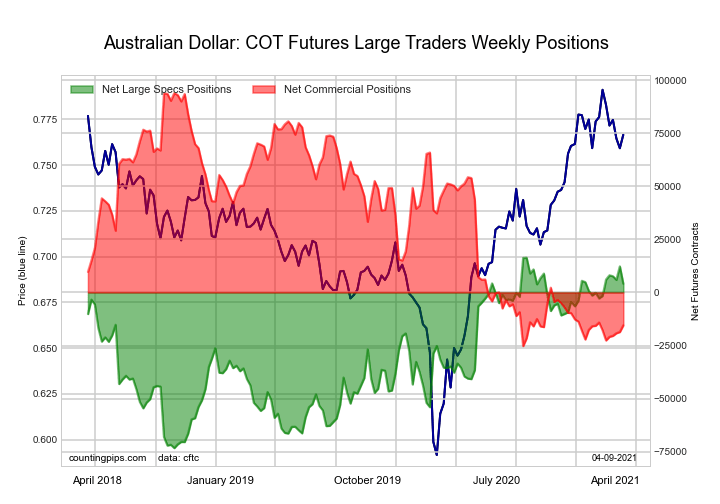
The AUSTRALIAN DOLLAR: large speculator standing this week equaled a net position of 4,066 contracts in the data reported through Tuesday. This was a weekly decrease of -8,197 contracts from the previous week which had a total of 12,263 net contracts.

This week’s current strength score (the trader positioning range over the past three years, measured from 0 to 100) shows the speculators are currently Bullish-Extreme with a score of 86.3 percent. The commercials are Bearish-Extreme with a score of 8.2 percent and the small traders (not shown in chart) are Bullish-Extreme with a score of 82.2 percent.

AUSTRALIAN DOLLAR StatisticsSPECULATORSCOMMERCIALSSMALL TRADERS
– Percent of Open Interest Longs:45.932.321.4
– Percent of Open Interest Shorts:42.943.613.1
– Net Position:4,066-15,49411,428
– Gross Longs:62,99144,30829,395
– Gross Shorts:58,92559,80217,967
– Long to Short Ratio:1.1 to 10.7 to 11.6 to 1
NET POSITION TREND:
– COT Index Score (3 Year Range Pct):86.38.282.2
– COT Index Reading (3 Year Range):Bullish-ExtremeBearish-ExtremeBullish-Extreme
NET POSITION MOVEMENT INDEX:
– 6-Week Change in Strength Index:6.42.0-17.8


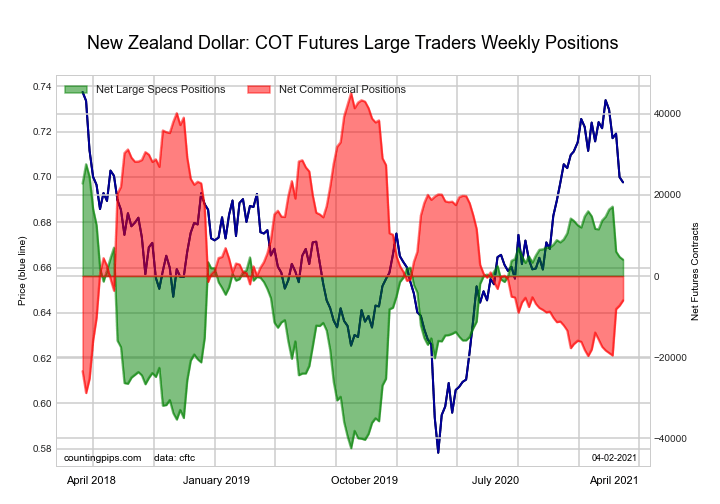
NEW ZEALAND DOLLAR Futures:


The NEW ZEALAND DOLLAR: large speculator standing this week equaled a net position of 3,138 contracts in the data reported through Tuesday. This was a weekly decline of -908 contracts from the previous week which had a total of 4,046 net contracts.

This week’s current strength score (the trader positioning range over the past three years, measured from 0 to 100) shows the speculators are currently Bullish with a score of 65.1 percent. The commercials are Bearish with a score of 32.3 percent and the small traders (not shown in chart) are Bullish with a score of 73.2 percent.

NEW ZEALAND DOLLAR StatisticsSPECULATORSCOMMERCIALSSMALL TRADERS
– Percent of Open Interest Longs:51.431.413.7
– Percent of Open Interest Shorts:43.044.68.9
– Net Position:3,138-4,9261,788
– Gross Longs:19,19911,7325,127
– Gross Shorts:16,06116,6583,339
– Long to Short Ratio:1.2 to 10.7 to 11.5 to 1
NET POSITION TREND:
– COT Index Score (3 Year Range Pct):65.132.373.2
– COT Index Reading (3 Year Range):BullishBearishBullish
NET POSITION MOVEMENT INDEX:
– 6-Week Change in Strength Index:-16.418.2-21.4


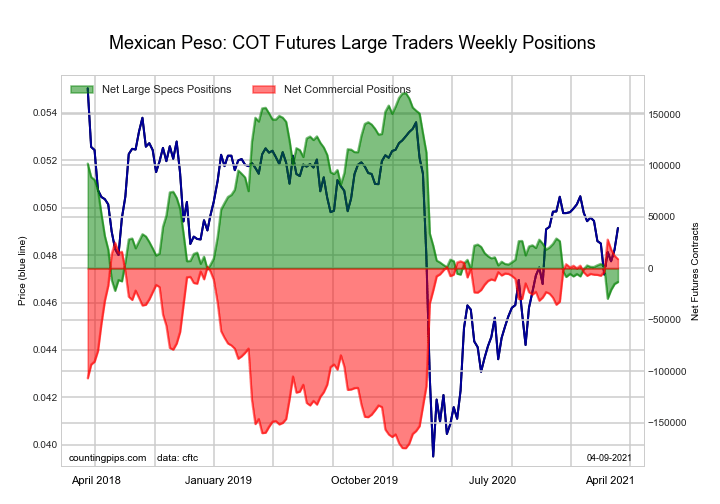
MEXICAN PESO Futures:


The MEXICAN PESO: large speculator standing this week equaled a net position of -13,142 contracts in the data reported through Tuesday. This was a weekly boost of 1,971 contracts from the previous week which had a total of -15,113 net contracts.

This week’s current strength score (the trader positioning range over the past three years, measured from 0 to 100) shows the speculators are currently Bearish-Extreme with a score of 8.2 percent. The commercials are Bullish-Extreme with a score of 90.6 percent and the small traders (not shown in chart) are Bullish with a score of 60.4 percent.

MEXICAN PESO StatisticsSPECULATORSCOMMERCIALSSMALL TRADERS
– Percent of Open Interest Longs:42.151.15.2
– Percent of Open Interest Shorts:51.744.52.2
– Net Position:-13,1429,0544,088
– Gross Longs:57,61069,9307,085
– Gross Shorts:70,75260,8762,997
– Long to Short Ratio:0.8 to 11.1 to 12.4 to 1
NET POSITION TREND:
– COT Index Score (3 Year Range Pct):8.290.660.4
– COT Index Reading (3 Year Range):Bearish-ExtremeBullish-ExtremeBullish
NET POSITION MOVEMENT INDEX:
– 6-Week Change in Strength Index:-8.17.63.7


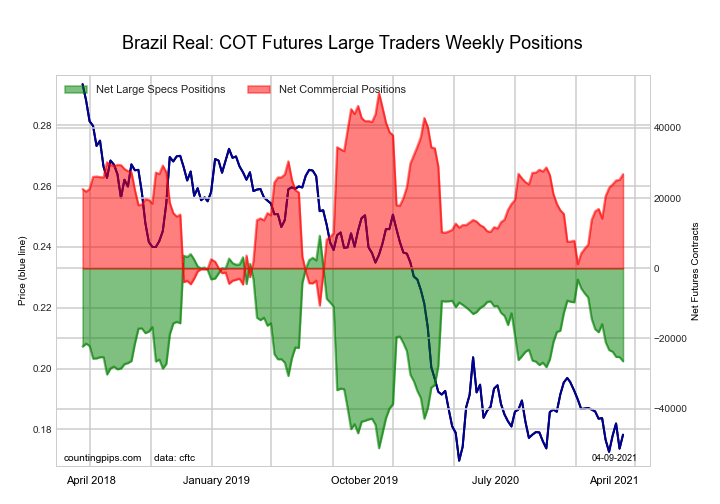
BRAZIL REAL Futures:


The BRAZIL REAL: large speculator standing this week equaled a net position of -26,506 contracts in the data reported through Tuesday. This was a weekly fall of -1,197 contracts from the previous week which had a total of -25,309 net contracts.

This week’s current strength score (the trader positioning range over the past three years, measured from 0 to 100) shows the speculators are currently Bearish with a score of 40.9 percent. The commercials are Bullish with a score of 61.8 percent and the small traders (not shown in chart) are Bullish with a score of 67.1 percent.

BRAZIL REAL StatisticsSPECULATORSCOMMERCIALSSMALL TRADERS
– Percent of Open Interest Longs:22.470.36.0
– Percent of Open Interest Shorts:81.111.06.7
– Net Position:-26,50626,820-314
– Gross Longs:10,10331,7662,716
– Gross Shorts:36,6094,9463,030
– Long to Short Ratio:0.3 to 16.4 to 10.9 to 1
NET POSITION TREND:
– COT Index Score (3 Year Range Pct):40.961.867.1
– COT Index Reading (3 Year Range):BearishBullishBullish
NET POSITION MOVEMENT INDEX:
– 6-Week Change in Strength Index:-17.520.9-26.7


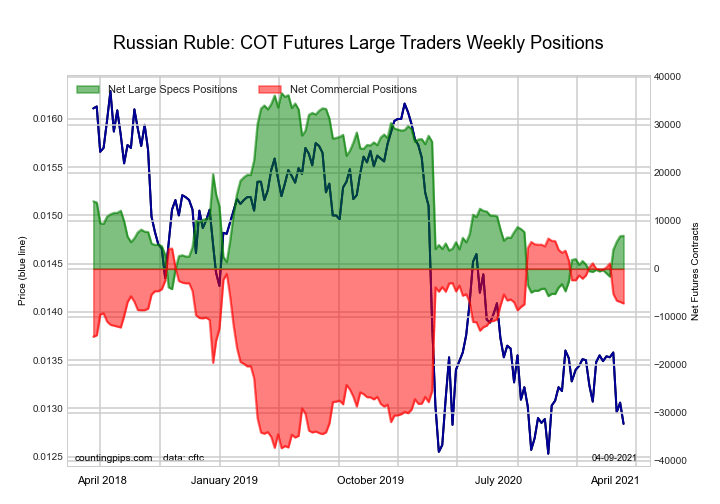
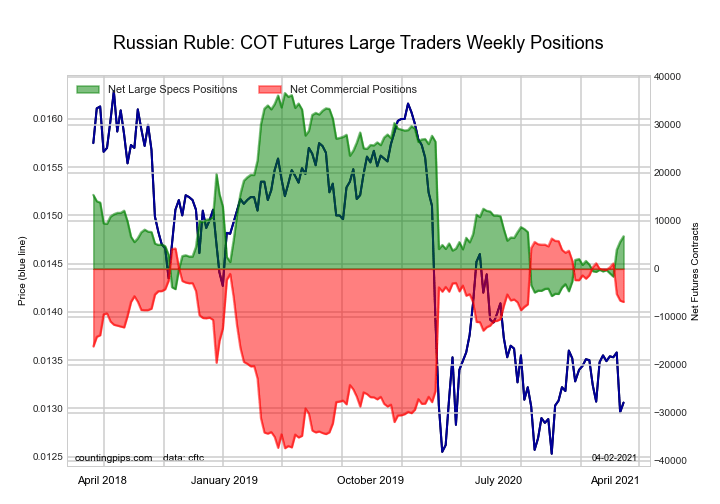
RUSSIAN RUBLE Futures:


The RUSSIAN RUBLE: large speculator standing this week equaled a net position of 6,875 contracts in the data reported through Tuesday. This was a weekly boost of 91 contracts from the previous week which had a total of 6,784 net contracts.

This week’s current strength score (the trader positioning range over the past three years, measured from 0 to 100) shows the speculators are currently Bearish with a score of 29.7 percent. The commercials are Bullish with a score of 69.1 percent and the small traders (not shown in chart) are Bullish with a score of 53.0 percent.

RUSSIAN RUBLE StatisticsSPECULATORSCOMMERCIALSSMALL TRADERS
– Percent of Open Interest Longs:32.661.55.8
– Percent of Open Interest Shorts:9.385.94.7
– Net Position:6,875-7,185310
– Gross Longs:9,60018,1091,700
– Gross Shorts:2,72525,2941,390
– Long to Short Ratio:3.5 to 10.7 to 11.2 to 1
NET POSITION TREND:
– COT Index Score (3 Year Range Pct):29.769.153.0
– COT Index Reading (3 Year Range):BearishBullishBullish
NET POSITION MOVEMENT INDEX:
– 6-Week Change in Strength Index:16.9-16.0-5.4


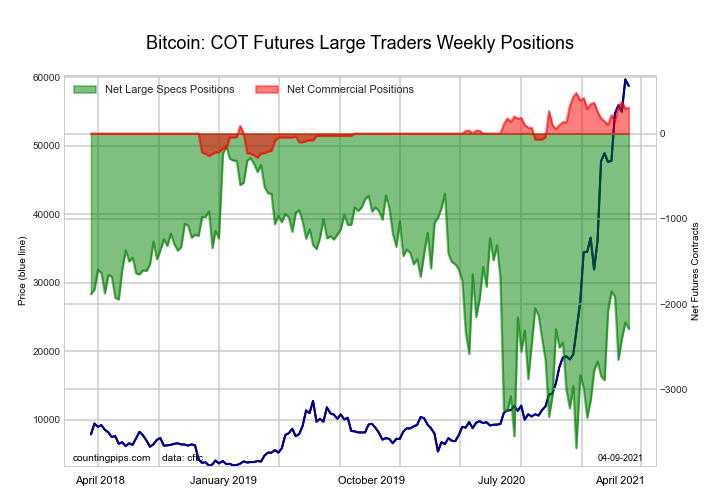
BITCOIN FUTURES Futures:


The BITCOIN FUTURES: large speculator standing this week equaled a net position of -2,292 contracts in the data reported through Tuesday. This was a weekly decline of -77 contracts from the previous week which had a total of -2,215 net contracts.

This week’s current strength score (the trader positioning range over the past three years, measured from 0 to 100) shows the speculators are currently Bearish with a score of 39.4 percent. The commercials are Bullish with a score of 76.9 percent and the small traders (not shown in chart) are Bullish with a score of 55.3 percent.

BITCOIN StatisticsSPECULATORSCOMMERCIALSSMALL TRADERS
– Percent of Open Interest Longs:60.25.127.8
– Percent of Open Interest Shorts:83.42.17.6
– Net Position:-2,2923001,992
– Gross Longs:5,9385042,742
– Gross Shorts:8,230204750
– Long to Short Ratio:0.7 to 12.5 to 13.7 to 1
NET POSITION TREND:
– COT Index Score (3 Year Range Pct):39.476.955.3
– COT Index Reading (3 Year Range):BearishBullishBullish
NET POSITION MOVEMENT INDEX:
– 6-Week Change in Strength Index:-5.826.30.3


Article By CountingPips.comReceive our weekly COT Reports by Email

*COT Report: The COT data, released weekly to the public each Friday, is updated through the most recent Tuesday (data is 3 days old) and shows a quick view of how large speculators or non-commercials (for-profit traders) were positioned in the futures markets.

The CFTC categorizes trader positions according to commercial hedgers (traders who use futures contracts for hedging as part of the business), non-commercials (large traders who speculate to realize trading profits) and nonreportable traders (usually small traders/speculators).

Find CFTC criteria here: (http://www.cftc.gov/MarketReports/CommitmentsofTraders/ExplanatoryNotes/index.htm).
COT Bonds Futures Charts: Fed Funds, 5-Year Treasury Notes, Eurodollar, 10-Year Treasury Notes

By CountingPips.comReceive our weekly COT Reports by Email

Here are the latest charts and statistics for the Commitment of Traders (COT) data published by the Commodities Futures Trading Commission (CFTC).

The latest COT data is updated through Tuesday April 06 2021 and shows a quick view of how large traders (for-profit speculators and commercial entities) were positioned in the futures markets.


30-Day Federal Funds Futures:

The 30-Day Federal Funds large speculator standing this week recorded a net position of -120,673 contracts in the data reported through Tuesday. This was a weekly fall of -38,042 contracts from the previous week which had a total of -82,631 net contracts.

This week’s current strength score (the trader positioning range over the past three years, measured from 0 to 100) shows the speculators are currently Bearish-Extreme with a score of 14.3 percent. The commercials are Bullish-Extreme with a score of 86.0 percent and the small traders (not shown in chart) are Bullish with a score of 55.3 percent.

30-Day Federal Funds StatisticsSPECULATORSCOMMERCIALSSMALL TRADERS
– Percent of Open Interest Longs:8.370.52.2
– Percent of Open Interest Shorts:20.357.73.0
– Net Position:-120,673129,362-8,689
– Gross Longs:84,005711,31321,909
– Gross Shorts:204,678581,95130,598
– Long to Short Ratio:0.4 to 11.2 to 10.7 to 1
NET POSITION TREND:
– COT Index Score (3 Year Range Pct):14.386.055.3
– COT Index Reading (3 Year Range):Bearish-ExtremeBullish-ExtremeBullish
NET POSITION MOVEMENT INDEX:
– 6-Week Change in Strength Index:-1.32.3-13.4


2-Year Treasury Note Futures:

The 2-Year Treasury Note large speculator standing this week recorded a net position of -375,820 contracts in the data reported through Tuesday. This was a weekly lowering of -29,128 contracts from the previous week which had a total of -346,692 net contracts.

This week’s current strength score (the trader positioning range over the past three years, measured from 0 to 100) shows the speculators are currently Bearish-Extreme with a score of 8.6 percent. The commercials are Bullish-Extreme with a score of 85.7 percent and the small traders (not shown in chart) are Bearish with a score of 46.0 percent.

2-Year Treasury Note StatisticsSPECULATORSCOMMERCIALSSMALL TRADERS
– Percent of Open Interest Longs:16.975.96.2
– Percent of Open Interest Shorts:33.260.65.3
– Net Position:-375,820354,77721,043
– Gross Longs:390,9011,754,671142,678
– Gross Shorts:766,7211,399,894121,635
– Long to Short Ratio:0.5 to 11.3 to 11.2 to 1
NET POSITION TREND:
– COT Index Score (3 Year Range Pct):8.685.746.0
– COT Index Reading (3 Year Range):Bearish-ExtremeBullish-ExtremeBearish
NET POSITION MOVEMENT INDEX:
– 6-Week Change in Strength Index:-70.073.9-25.6


5-Year Treasury Note Futures:

The 5-Year Treasury Note large speculator standing this week recorded a net position of -7,617 contracts in the data reported through Tuesday. This was a weekly lowering of -102,952 contracts from the previous week which had a total of 95,335 net contracts.

This week’s current strength score (the trader positioning range over the past three years, measured from 0 to 100) shows the speculators are currently Bullish-Extreme with a score of 89.3 percent. The commercials are Bearish with a score of 22.3 percent and the small traders (not shown in chart) are Bearish with a score of 21.4 percent.

5-Year Treasury Note StatisticsSPECULATORSCOMMERCIALSSMALL TRADERS
– Percent of Open Interest Longs:13.676.37.6
– Percent of Open Interest Shorts:13.872.311.3
– Net Position:-7,617141,544-133,927
– Gross Longs:485,2392,727,948271,735
– Gross Shorts:492,8562,586,404405,662
– Long to Short Ratio:1.0 to 11.1 to 10.7 to 1
NET POSITION TREND:
– COT Index Score (3 Year Range Pct):89.322.321.4
– COT Index Reading (3 Year Range):Bullish-ExtremeBearishBearish
NET POSITION MOVEMENT INDEX:
– 6-Week Change in Strength Index:-10.715.1-26.1


10-Year Treasury Note Futures:

The 10-Year Treasury Note large speculator standing this week recorded a net position of 84,559 contracts in the data reported through Tuesday. This was a weekly gain of 174,361 contracts from the previous week which had a total of -89,802 net contracts.

This week’s current strength score (the trader positioning range over the past three years, measured from 0 to 100) shows the speculators are currently Bullish-Extreme with a score of 92.5 percent. The commercials are Bearish with a score of 30.1 percent and the small traders (not shown in chart) are Bearish-Extreme with a score of 16.2 percent.

10-Year Treasury Note StatisticsSPECULATORSCOMMERCIALSSMALL TRADERS
– Percent of Open Interest Longs:18.772.08.0
– Percent of Open Interest Shorts:16.568.713.4
– Net Position:84,559128,010-212,569
– Gross Longs:732,6872,821,476313,947
– Gross Shorts:648,1282,693,466526,516
– Long to Short Ratio:1.1 to 11.0 to 10.6 to 1
NET POSITION TREND:
– COT Index Score (3 Year Range Pct):92.530.116.2
– COT Index Reading (3 Year Range):Bullish-ExtremeBearishBearish-Extreme
NET POSITION MOVEMENT INDEX:
– 6-Week Change in Strength Index:9.0-5.1-7.8


Ultra 10-Year Notes Futures:

The Ultra 10-Year Notes large speculator standing this week recorded a net position of 170,635 contracts in the data reported through Tuesday. This was a weekly decrease of -64,475 contracts from the previous week which had a total of 235,110 net contracts.

This week’s current strength score (the trader positioning range over the past three years, measured from 0 to 100) shows the speculators are currently Bullish with a score of 72.8 percent. The commercials are Bearish with a score of 34.0 percent and the small traders (not shown in chart) are Bearish-Extreme with a score of 0.0 percent.

Ultra 10-Year Notes StatisticsSPECULATORSCOMMERCIALSSMALL TRADERS
– Percent of Open Interest Longs:21.071.17.6
– Percent of Open Interest Shorts:9.173.717.0
– Net Position:170,635-36,437-134,198
– Gross Longs:300,2461,017,164108,960
– Gross Shorts:129,6111,053,601243,158
– Long to Short Ratio:2.3 to 11.0 to 10.4 to 1
NET POSITION TREND:
– COT Index Score (3 Year Range Pct):72.834.00.0
– COT Index Reading (3 Year Range):BullishBearishBearish-Extreme
NET POSITION MOVEMENT INDEX:
– 6-Week Change in Strength Index:-0.72.7-6.6


US Treasury Bonds Futures:

The US Treasury Bonds large speculator standing this week recorded a net position of -118,494 contracts in the data reported through Tuesday. This was a weekly decrease of -4,055 contracts from the previous week which had a total of -114,439 net contracts.

This week’s current strength score (the trader positioning range over the past three years, measured from 0 to 100) shows the speculators are currently Bearish with a score of 46.3 percent. The commercials are Bullish with a score of 73.7 percent and the small traders (not shown in chart) are Bearish-Extreme with a score of 16.2 percent.

US Treasury Bonds StatisticsSPECULATORSCOMMERCIALSSMALL TRADERS
– Percent of Open Interest Longs:6.278.613.2
– Percent of Open Interest Shorts:16.364.317.5
– Net Position:-118,494168,164-49,670
– Gross Longs:72,722920,918154,881
– Gross Shorts:191,216752,754204,551
– Long to Short Ratio:0.4 to 11.2 to 10.8 to 1
NET POSITION TREND:
– COT Index Score (3 Year Range Pct):46.373.716.2
– COT Index Reading (3 Year Range):BearishBullishBearish-Extreme
NET POSITION MOVEMENT INDEX:
– 6-Week Change in Strength Index:12.4-6.4-13.6


Ultra US Treasury Bonds Futures:

The Ultra US Treasury Bonds large speculator standing this week recorded a net position of -261,819 contracts in the data reported through Tuesday. This was a weekly reduction of -2,695 contracts from the previous week which had a total of -259,124 net contracts.

This week’s current strength score (the trader positioning range over the past three years, measured from 0 to 100) shows the speculators are currently Bullish with a score of 64.6 percent. The commercials are Bullish with a score of 62.3 percent and the small traders (not shown in chart) are Bearish-Extreme with a score of 0.0 percent.

Ultra US Treasury Bonds StatisticsSPECULATORSCOMMERCIALSSMALL TRADERS
– Percent of Open Interest Longs:5.182.711.8
– Percent of Open Interest Shorts:28.257.613.8
– Net Position:-261,819285,070-23,251
– Gross Longs:58,261938,845133,842
– Gross Shorts:320,080653,775157,093
– Long to Short Ratio:0.2 to 11.4 to 10.9 to 1
NET POSITION TREND:
– COT Index Score (3 Year Range Pct):64.662.30.0
– COT Index Reading (3 Year Range):BullishBullishBearish-Extreme
NET POSITION MOVEMENT INDEX:
– 6-Week Change in Strength Index:-15.722.9-7.9


3-Month Eurodollars Futures:

The 3-Month Eurodollars large speculator standing this week recorded a net position of 468,445 contracts in the data reported through Tuesday. This was a weekly fall of -289,661 contracts from the previous week which had a total of 758,106 net contracts.

This week’s current strength score (the trader positioning range over the past three years, measured from 0 to 100) shows the speculators are currently Bullish with a score of 68.5 percent. The commercials are Bearish with a score of 30.2 percent and the small traders (not shown in chart) are Bullish with a score of 63.7 percent.

3-Month Eurodollars StatisticsSPECULATORSCOMMERCIALSSMALL TRADERS
– Percent of Open Interest Longs:20.149.55.1
– Percent of Open Interest Shorts:16.050.97.8
– Net Position:468,445-163,288-305,157
– Gross Longs:2,331,7615,751,008596,999
– Gross Shorts:1,863,3165,914,296902,156
– Long to Short Ratio:1.3 to 11.0 to 10.7 to 1
NET POSITION TREND:
– COT Index Score (3 Year Range Pct):68.530.263.7
– COT Index Reading (3 Year Range):BullishBearishBullish
NET POSITION MOVEMENT INDEX:
– 6-Week Change in Strength Index:-4.34.2-2.3


Article By CountingPips.comReceive our weekly COT Reports by Email

*COT Report: The COT data, released weekly to the public each Friday, is updated through the most recent Tuesday (data is 3 days old) and shows a quick view of how large speculators or non-commercials (for-profit traders) were positioned in the futures markets.

The CFTC categorizes trader positions according to commercial hedgers (traders who use futures contracts for hedging as part of the business), non-commercials (large traders who speculate to realize trading profits) and nonreportable traders (usually small traders/speculators).

Find CFTC criteria here: (http://www.cftc.gov/MarketReports/CommitmentsofTraders/ExplanatoryNotes/index.htm).
COT Energy Futures Charts: Natural Gas, Bloomberg Index, Crude Oil, Heating Oil

By CountingPips.comReceive our weekly COT Reports by Email

Here are the latest charts and statistics for the Commitment of Traders (COT) data published by the Commodities Futures Trading Commission (CFTC).

The latest COT data is updated through Tuesday April 06 2021 and shows a quick view of how large traders (for-profit speculators and commercial entities) were positioned in the futures markets.


WTI Crude Oil Futures: Futures:


The WTI Crude Oil Futures: large speculator standing this week was a net position of 511,725 contracts in the data reported through Tuesday. This was a weekly reduction of -19,585 contracts from the previous week which had a total of 531,310 net contracts.

This week’s current strength score (the trader positioning range over the past three years, measured from 0 to 100) shows the speculators are currently Bullish with a score of 52.0 percent. The commercials are Bearish with a score of 38.5 percent and the small traders (not shown in chart) are Bullish-Extreme with a score of 88.2 percent.

WTI Crude Oil Futures StatisticsSPECULATORSCOMMERCIALSSMALL TRADERS
– Percent of Open Interest Longs:27.733.54.4
– Percent of Open Interest Shorts:5.957.62.2
– Net Position:511,725-563,47451,749
– Gross Longs:649,237784,153102,770
– Gross Shorts:137,5121,347,62751,021
– Long to Short Ratio:4.7 to 10.6 to 12.0 to 1
NET POSITION TREND:
– COT Index Score (3 Year Range Pct):52.038.588.2
– COT Index Reading (3 Year Range):BullishBearishBullish-Extreme
NET POSITION MOVEMENT INDEX:
– 6-Week Change in Strength Index:-0.01.4-8.8


Brent Crude Oil Futures (LAST DAY): Futures:


The Brent Crude Oil Futures (LAST DAY): large speculator standing this week was a net position of -22,410 contracts in the data reported through Tuesday. This was a weekly lowering of -89 contracts from the previous week which had a total of -22,321 net contracts.

This week’s current strength score (the trader positioning range over the past three years, measured from 0 to 100) shows the speculators are currently Bullish with a score of 74.5 percent. The commercials are Bearish with a score of 24.8 percent and the small traders (not shown in chart) are Bearish with a score of 43.5 percent.

Brent Crude Oil Futures StatisticsSPECULATORSCOMMERCIALSSMALL TRADERS
– Percent of Open Interest Longs:18.042.13.4
– Percent of Open Interest Shorts:28.333.22.0
– Net Position:-22,41019,3233,087
– Gross Longs:39,22491,5637,482
– Gross Shorts:61,63472,2404,395
– Long to Short Ratio:0.6 to 11.3 to 11.7 to 1
NET POSITION TREND:
– COT Index Score (3 Year Range Pct):74.524.843.5
– COT Index Reading (3 Year Range):BullishBearishBearish
NET POSITION MOVEMENT INDEX:
– 6-Week Change in Strength Index:3.5-5.47.1


Natural Gas Futures (CME): Futures:


The Natural Gas Futures (CME): large speculator standing this week was a net position of -51,583 contracts in the data reported through Tuesday. This was a weekly lowering of -13,699 contracts from the previous week which had a total of -37,884 net contracts.

This week’s current strength score (the trader positioning range over the past three years, measured from 0 to 100) shows the speculators are currently Bullish with a score of 63.1 percent. The commercials are Bearish with a score of 40.7 percent and the small traders (not shown in chart) are Bearish-Extreme with a score of 11.7 percent.

Natural Gas Futures StatisticsSPECULATORSCOMMERCIALSSMALL TRADERS
– Percent of Open Interest Longs:20.343.94.5
– Percent of Open Interest Shorts:24.541.32.9
– Net Position:-51,58331,49920,084
– Gross Longs:247,254535,66855,021
– Gross Shorts:298,837504,16934,937
– Long to Short Ratio:0.8 to 11.1 to 11.6 to 1
NET POSITION TREND:
– COT Index Score (3 Year Range Pct):63.140.711.7
– COT Index Reading (3 Year Range):BullishBearishBearish-Extreme
NET POSITION MOVEMENT INDEX:
– 6-Week Change in Strength Index:-24.026.8-15.9


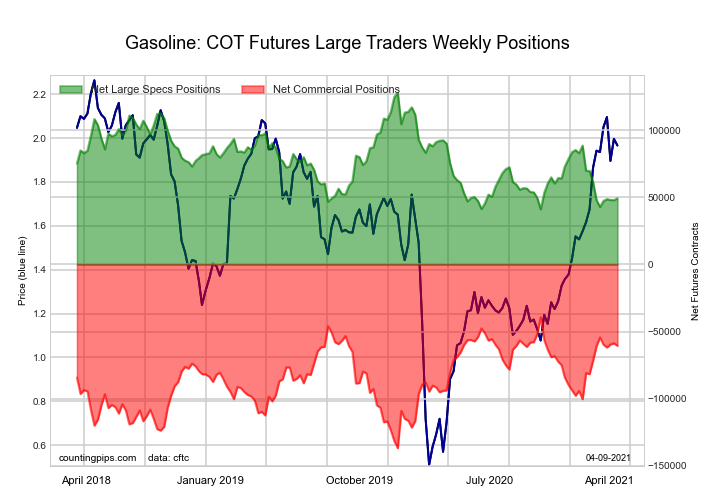
Gasoline Blendstock Futures: Futures:


The Gasoline Blendstock Futures: large speculator standing this week was a net position of 49,320 contracts in the data reported through Tuesday. This was a weekly boost of 1,391 contracts from the previous week which had a total of 47,929 net contracts.

This week’s current strength score (the trader positioning range over the past three years, measured from 0 to 100) shows the speculators are currently Bearish-Extreme with a score of 9.4 percent. The commercials are Bullish with a score of 78.1 percent and the small traders (not shown in chart) are Bullish with a score of 78.8 percent.

Nasdaq Mini Futures StatisticsSPECULATORSCOMMERCIALSSMALL TRADERS
– Percent of Open Interest Longs:27.148.36.5
– Percent of Open Interest Shorts:13.764.73.5
– Net Position:49,320-60,57511,255
– Gross Longs:99,723177,45024,075
– Gross Shorts:50,403238,02512,820
– Long to Short Ratio:2.0 to 10.7 to 11.9 to 1
NET POSITION TREND:
– COT Index Score (3 Year Range Pct):9.478.178.8
– COT Index Reading (3 Year Range):Bearish-ExtremeBullishBullish
NET POSITION MOVEMENT INDEX:
– 6-Week Change in Strength Index:1.60.2-9.8


#2 Heating Oil NY-Harbor Futures: Futures:


The #2 Heating Oil NY-Harbor Futures: large speculator standing this week was a net position of 9,292 contracts in the data reported through Tuesday. This was a weekly increase of 1,533 contracts from the previous week which had a total of 7,759 net contracts.

This week’s current strength score (the trader positioning range over the past three years, measured from 0 to 100) shows the speculators are currently Bearish with a score of 47.5 percent. The commercials are Bearish with a score of 45.3 percent and the small traders (not shown in chart) are Bullish with a score of 70.7 percent.

Heating Oil Futures StatisticsSPECULATORSCOMMERCIALSSMALL TRADERS
– Percent of Open Interest Longs:15.350.110.6
– Percent of Open Interest Shorts:13.056.76.2
– Net Position:9,292-27,00717,715
– Gross Longs:62,333204,07043,111
– Gross Shorts:53,041231,07725,396
– Long to Short Ratio:1.2 to 10.9 to 11.7 to 1
NET POSITION TREND:
– COT Index Score (3 Year Range Pct):47.545.370.7
– COT Index Reading (3 Year Range):BearishBearishBullish
NET POSITION MOVEMENT INDEX:
– 6-Week Change in Strength Index:5.70.9-22.2


Bloomberg Commodity Index Futures: Futures:


The Bloomberg Commodity Index Futures: large speculator standing this week was a net position of -12,147 contracts in the data reported through Tuesday. This was a weekly lift of 3,051 contracts from the previous week which had a total of -15,198 net contracts.

This week’s current strength score (the trader positioning range over the past three years, measured from 0 to 100) shows the speculators are currently Bearish with a score of 33.4 percent. The commercials are Bullish with a score of 66.4 percent and the small traders (not shown in chart) are Bullish with a score of 70.8 percent.

Bloomberg Index Futures StatisticsSPECULATORSCOMMERCIALSSMALL TRADERS
– Percent of Open Interest Longs:51.247.01.3
– Percent of Open Interest Shorts:86.812.50.2
– Net Position:-12,14711,758389
– Gross Longs:17,45716,018448
– Gross Shorts:29,6044,26059
– Long to Short Ratio:0.6 to 13.8 to 17.6 to 1
NET POSITION TREND:
– COT Index Score (3 Year Range Pct):33.466.470.8
– COT Index Reading (3 Year Range):BearishBullishBullish
NET POSITION MOVEMENT INDEX:
– 6-Week Change in Strength Index:23.0-23.12.6


Article By CountingPips.comReceive our weekly COT Reports by Email

*COT Report: The COT data, released weekly to the public each Friday, is updated through the most recent Tuesday (data is 3 days old) and shows a quick view of how large speculators or non-commercials (for-profit traders) were positioned in the futures markets.

The CFTC categorizes trader positions according to commercial hedgers (traders who use futures contracts for hedging as part of the business), non-commercials (large traders who speculate to realize trading profits) and nonreportable traders (usually small traders/speculators).

Find CFTC criteria here: (http://www.cftc.gov/MarketReports/CommitmentsofTraders/ExplanatoryNotes/index.htm).

COT Stock Market Futures Charts: Nasdaq-Mini, SP500, Russell-Mini, VIX, Dow-Mini

By CountingPips.comReceive our weekly COT Reports by Email

Here are the latest charts and statistics for the Commitment of Traders (COT) data published by the Commodities Futures Trading Commission (CFTC).

The latest COT data is updated through Tuesday April 06 2021 and shows a quick view of how large traders (for-profit speculators and commercial entities) were positioned in the futures markets.


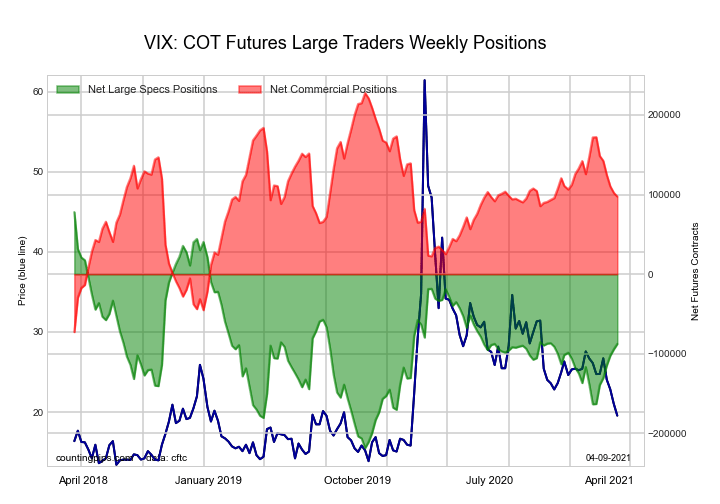
VIX Volatility Futures: Futures:

The VIX Volatility Futures: large speculator standing this week recorded a net position of -87,573 contracts in the data reported through Tuesday. This was a weekly lift of 6,817 contracts from the previous week which had a total of -94,390 net contracts.

This week’s current strength score (the trader positioning range over the past three years, measured from 0 to 100) shows the speculators are currently Bearish with a score of 44.1 percent. The commercials are Bullish with a score of 56.7 percent and the small traders (not shown in chart) are Bearish-Extreme with a score of 18.9 percent.

VIX Volatility Futures StatisticsSPECULATORSCOMMERCIALSSMALL TRADERS
– Percent of Open Interest Longs:19.056.55.5
– Percent of Open Interest Shorts:43.029.88.2
– Net Position:-87,57397,456-9,883
– Gross Longs:69,212205,87120,056
– Gross Shorts:156,785108,41529,939
– Long to Short Ratio:0.4 to 11.9 to 10.7 to 1
NET POSITION TREND:
– COT Index Score (3 Year Range Pct):44.156.718.9
– COT Index Reading (3 Year Range):BearishBullishBearish-Extreme
NET POSITION MOVEMENT INDEX:
– 6-Week Change in Strength Index:25.4-24.9-2.6


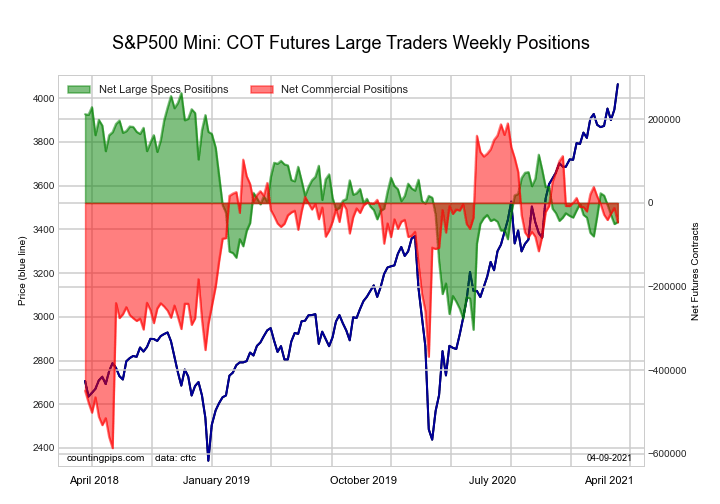
S&P500 Mini Futures: Futures:

The S&P500 Mini Futures: large speculator standing this week recorded a net position of -45,343 contracts in the data reported through Tuesday. This was a weekly rise of 4,988 contracts from the previous week which had a total of -50,331 net contracts.

This week’s current strength score (the trader positioning range over the past three years, measured from 0 to 100) shows the speculators are currently Bearish with a score of 45.6 percent. The commercials are Bullish with a score of 69.5 percent and the small traders (not shown in chart) are Bearish with a score of 40.0 percent.

S&P500 Mini Futures StatisticsSPECULATORSCOMMERCIALSSMALL TRADERS
– Percent of Open Interest Longs:13.173.112.1
– Percent of Open Interest Shorts:14.874.98.6
– Net Position:-45,343-46,32391,666
– Gross Longs:341,6221,908,972316,050
– Gross Shorts:386,9651,955,295224,384
– Long to Short Ratio:0.9 to 11.0 to 11.4 to 1
NET POSITION TREND:
– COT Index Score (3 Year Range Pct):45.669.540.0
– COT Index Reading (3 Year Range):BearishBullishBearish
NET POSITION MOVEMENT INDEX:
– 6-Week Change in Strength Index:-2.5-8.014.0


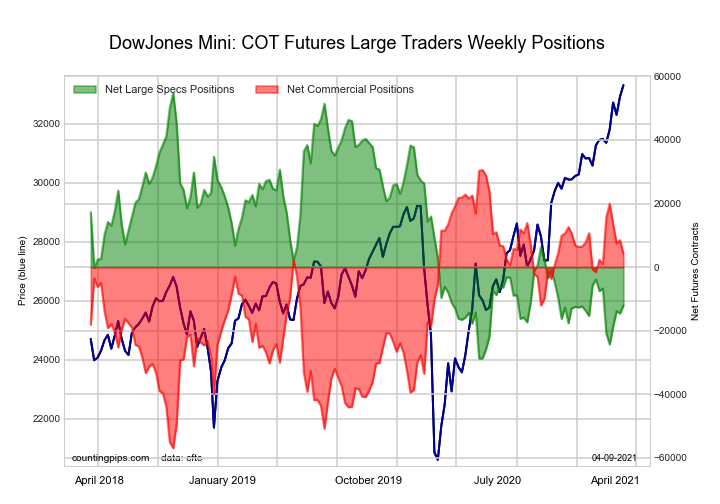
Dow Jones Mini Futures: Futures:

The Dow Jones Mini Futures: large speculator standing this week recorded a net position of -12,055 contracts in the data reported through Tuesday. This was a weekly increase of 2,495 contracts from the previous week which had a total of -14,550 net contracts.

This week’s current strength score (the trader positioning range over the past three years, measured from 0 to 100) shows the speculators are currently Bearish-Extreme with a score of 20.0 percent. The commercials are Bullish with a score of 69.8 percent and the small traders (not shown in chart) are Bullish-Extreme with a score of 93.4 percent.

Dow Jones Mini Futures StatisticsSPECULATORSCOMMERCIALSSMALL TRADERS
– Percent of Open Interest Longs:28.347.021.5
– Percent of Open Interest Shorts:41.142.613.1
– Net Position:-12,0554,1347,921
– Gross Longs:26,64144,32320,301
– Gross Shorts:38,69640,18912,380
– Long to Short Ratio:0.7 to 11.1 to 11.6 to 1
NET POSITION TREND:
– COT Index Score (3 Year Range Pct):20.069.893.4
– COT Index Reading (3 Year Range):Bearish-ExtremeBullishBullish-Extreme
NET POSITION MOVEMENT INDEX:
– 6-Week Change in Strength Index:-6.43.613.7


Nasdaq Mini Futures: Futures:

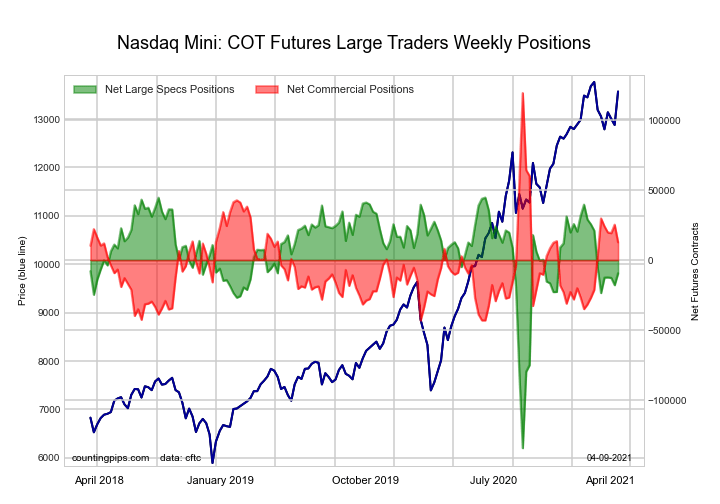
The Nasdaq Mini Futures: large speculator standing this week recorded a net position of -9,396 contracts in the data reported through Tuesday. This was a weekly boost of 8,469 contracts from the previous week which had a total of -17,865 net contracts.

This week’s current strength score (the trader positioning range over the past three years, measured from 0 to 100) shows the speculators are currently Bullish with a score of 69.8 percent. The commercials are Bearish with a score of 34.3 percent and the small traders (not shown in chart) are Bearish with a score of 36.5 percent.

Nasdaq Mini Futures StatisticsSPECULATORSCOMMERCIALSSMALL TRADERS
– Percent of Open Interest Longs:26.855.516.3
– Percent of Open Interest Shorts:31.149.517.9
– Net Position:-9,39612,730-3,334
– Gross Longs:57,439119,01835,071
– Gross Shorts:66,835106,28838,405
– Long to Short Ratio:0.9 to 11.1 to 10.9 to 1
NET POSITION TREND:
– COT Index Score (3 Year Range Pct):69.834.336.5
– COT Index Reading (3 Year Range):BullishBearishBearish
NET POSITION MOVEMENT INDEX:
– 6-Week Change in Strength Index:-2.26.1-13.1


Russell 2000 Mini Futures: Futures:

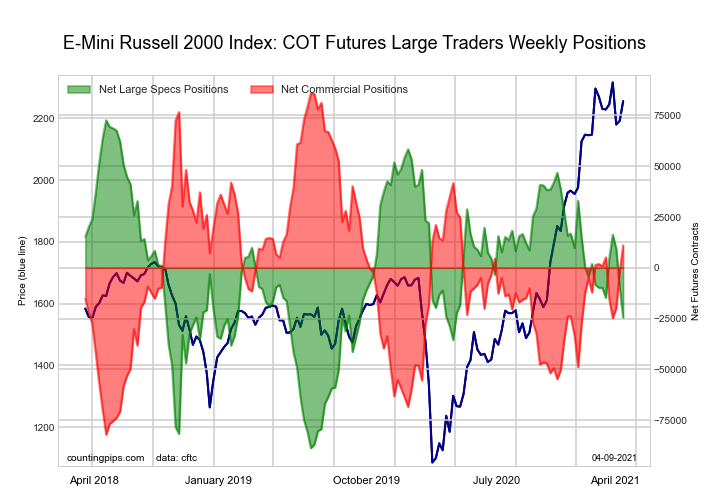
The Russell 2000 Mini Futures: large speculator standing this week recorded a net position of -24,398 contracts in the data reported through Tuesday. This was a weekly decrease of -14,398 contracts from the previous week which had a total of -10,000 net contracts.

This week’s current strength score (the trader positioning range over the past three years, measured from 0 to 100) shows the speculators are currently Bearish with a score of 39.9 percent. The commercials are Bullish with a score of 55.4 percent and the small traders (not shown in chart) are Bullish with a score of 70.8 percent.

Russell 2000 Mini Futures StatisticsSPECULATORSCOMMERCIALSSMALL TRADERS
– Percent of Open Interest Longs:12.380.86.5
– Percent of Open Interest Shorts:17.478.53.7
– Net Position:-24,39811,02513,373
– Gross Longs:57,946382,08030,669
– Gross Shorts:82,344371,05517,296
– Long to Short Ratio:0.7 to 11.0 to 11.8 to 1
NET POSITION TREND:
– COT Index Score (3 Year Range Pct):39.955.470.8
– COT Index Reading (3 Year Range):BearishBullishBullish
NET POSITION MOVEMENT INDEX:
– 6-Week Change in Strength Index:-9.06.112.3


Nikkei Stock Average Futures (USD): Futures:

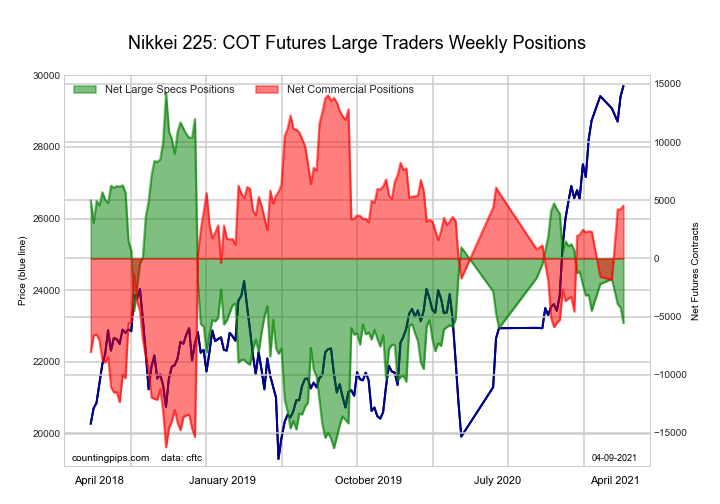
The Nikkei Stock Average Futures (USD): large speculator standing this week recorded a net position of -5,553 contracts in the data reported through Tuesday. This was a weekly lowering of -1,349 contracts from the previous week which had a total of -4,204 net contracts.

This week’s current strength score (the trader positioning range over the past three years, measured from 0 to 100) shows the speculators are currently Bearish with a score of 35.2 percent. The commercials are Bullish with a score of 68.7 percent and the small traders (not shown in chart) are Bearish with a score of 30.4 percent.

Nikkei Stock Average Futures StatisticsSPECULATORSCOMMERCIALSSMALL TRADERS
– Percent of Open Interest Longs:10.455.434.1
– Percent of Open Interest Shorts:47.724.827.4
– Net Position:-5,5534,5481,005
– Gross Longs:1,5428,2395,071
– Gross Shorts:7,0953,6914,066
– Long to Short Ratio:0.2 to 12.2 to 11.2 to 1
NET POSITION TREND:
– COT Index Score (3 Year Range Pct):35.268.730.4
– COT Index Reading (3 Year Range):BearishBullishBearish
NET POSITION MOVEMENT INDEX:
– 6-Week Change in Strength Index:-8.07.32.6


MSCI EAFE Mini Futures: Futures:

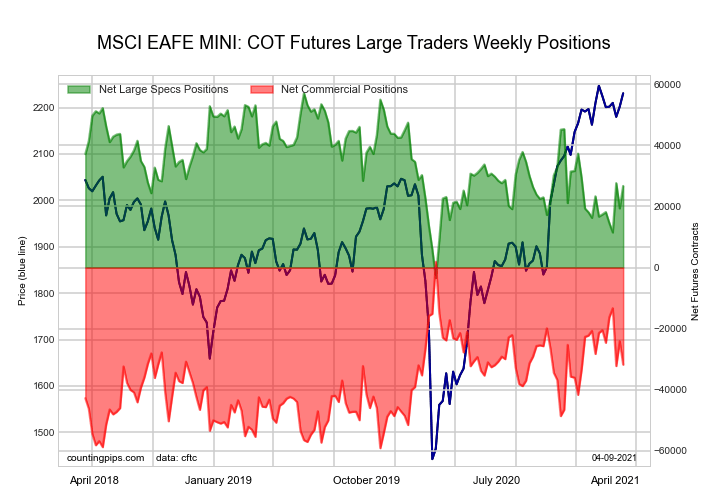
The MSCI EAFE Mini Futures: large speculator standing this week recorded a net position of 26,731 contracts in the data reported through Tuesday. This was a weekly increase of 7,338 contracts from the previous week which had a total of 19,393 net contracts.

This week’s current strength score (the trader positioning range over the past three years, measured from 0 to 100) shows the speculators are currently Bearish with a score of 49.7 percent. The commercials are Bearish with a score of 44.8 percent and the small traders (not shown in chart) are Bullish with a score of 62.1 percent.

MSCI EAFE Mini Futures StatisticsSPECULATORSCOMMERCIALSSMALL TRADERS
– Percent of Open Interest Longs:8.888.42.5
– Percent of Open Interest Shorts:2.396.21.2
– Net Position:26,731-31,8215,090
– Gross Longs:35,992362,67010,147
– Gross Shorts:9,261394,4915,057
– Long to Short Ratio:3.9 to 10.9 to 12.0 to 1
NET POSITION TREND:
– COT Index Score (3 Year Range Pct):49.744.862.1
– COT Index Reading (3 Year Range):BearishBearishBullish
NET POSITION MOVEMENT INDEX:
– 6-Week Change in Strength Index:15.4-18.517.9


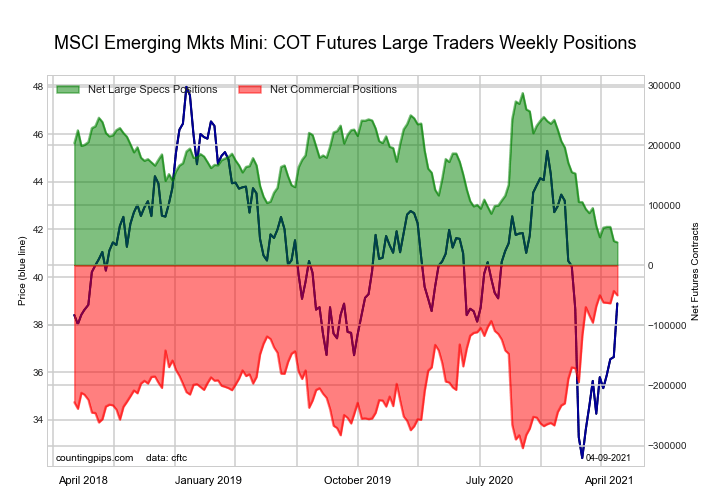
MSCI Emerging Mkts Mini Futures: Futures:

The MSCI Emerging Mkts Mini Futures: large speculator standing this week recorded a net position of 38,211 contracts in the data reported through Tuesday. This was a weekly decline of -2,219 contracts from the previous week which had a total of 40,430 net contracts.

This week’s current strength score (the trader positioning range over the past three years, measured from 0 to 100) shows the speculators are currently Bearish-Extreme with a score of 0.0 percent. The commercials are Bullish-Extreme with a score of 97.2 percent and the small traders (not shown in chart) are Bearish with a score of 40.4 percent.

MSCI Emerging Mkts Mini Futures StatisticsSPECULATORSCOMMERCIALSSMALL TRADERS
– Percent of Open Interest Longs:14.382.22.4
– Percent of Open Interest Shorts:11.086.51.3
– Net Position:38,211-49,88611,675
– Gross Longs:165,150950,68527,250
– Gross Shorts:126,9391,000,57115,575
– Long to Short Ratio:1.3 to 11.0 to 11.7 to 1
NET POSITION TREND:
– COT Index Score (3 Year Range Pct):0.097.240.4
– COT Index Reading (3 Year Range):Bearish-ExtremeBullish-ExtremeBearish
NET POSITION MOVEMENT INDEX:
– 6-Week Change in Strength Index:-11.06.87.3


Article By CountingPips.comReceive our weekly COT Reports by Email

*COT Report: The COT data, released weekly to the public each Friday, is updated through the most recent Tuesday (data is 3 days old) and shows a quick view of how large speculators or non-commercials (for-profit traders) were positioned in the futures markets.

The CFTC categorizes trader positions according to commercial hedgers (traders who use futures contracts for hedging as part of the business), non-commercials (large traders who speculate to realize trading profits) and nonreportable traders (usually small traders/speculators).

Find CFTC criteria here: (http://www.cftc.gov/MarketReports/CommitmentsofTraders/ExplanatoryNotes/index.htm).
COT Soft Commodities Futures Charts: Cattle, Hogs, Sugar, Corn, Soybeans, Wheat, Coffee

By CountingPips.comReceive our weekly COT Reports by Email

Here are the latest charts and statistics for the Commitment of Traders (COT) data published by the Commodities Futures Trading Commission (CFTC).

The latest COT data is updated through Tuesday April 06 2021 and shows a quick view of how large traders (for-profit speculators and commercial entities) were positioned in the futures markets.


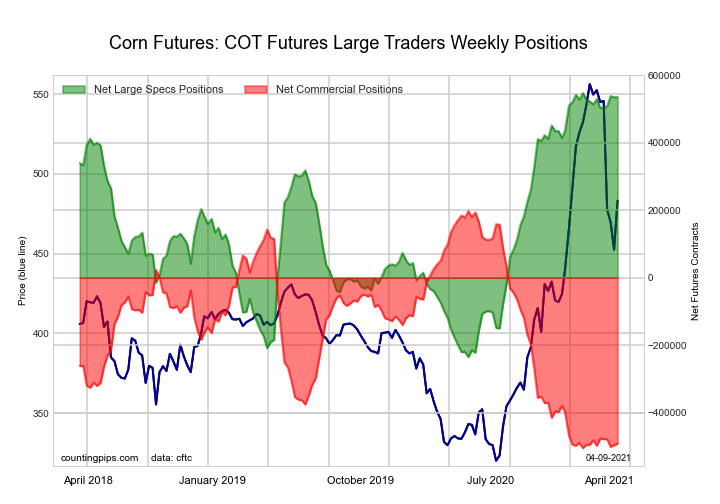
CORN Futures:


The CORN large speculator standing this week totaled a net position of 536,152 contracts in the data reported through Tuesday. This was a weekly gain of 807 contracts from the previous week which had a total of 535,345 net contracts.

This week’s current strength score (the trader positioning range over the past three years, measured from 0 to 100) shows the speculators are currently Bullish-Extreme with a score of 98.5 percent. The commercials are Bearish-Extreme with a score of 1.9 percent and the small traders (not shown in chart) are Bearish with a score of 22.7 percent.

CORN Futures StatisticsSPECULATORSCOMMERCIALSSMALL TRADERS
– Percent of Open Interest Longs:34.545.08.2
– Percent of Open Interest Shorts:4.172.910.7
– Net Position:536,152-491,962-44,190
– Gross Longs:608,489794,377145,283
– Gross Shorts:72,3371,286,339189,473
– Long to Short Ratio:8.4 to 10.6 to 10.8 to 1
NET POSITION TREND:
– COT Index Score (3 Year Range Pct):98.51.922.7
– COT Index Reading (3 Year Range):Bullish-ExtremeBearish-ExtremeBearish
NET POSITION MOVEMENT INDEX:
– 6-Week Change in Strength Index:0.80.8-6.5


SUGAR Futures:


The SUGAR large speculator standing this week totaled a net position of 183,005 contracts in the data reported through Tuesday. This was a weekly reduction of -7,164 contracts from the previous week which had a total of 190,169 net contracts.

This week’s current strength score (the trader positioning range over the past three years, measured from 0 to 100) shows the speculators are currently Bullish with a score of 74.2 percent. The commercials are Bearish with a score of 24.9 percent and the small traders (not shown in chart) are Bullish with a score of 63.9 percent.

SUGAR Futures StatisticsSPECULATORSCOMMERCIALSSMALL TRADERS
– Percent of Open Interest Longs:23.154.59.4
– Percent of Open Interest Shorts:5.676.35.0
– Net Position:183,005-228,32945,324
– Gross Longs:241,563568,50097,651
– Gross Shorts:58,558796,82952,327
– Long to Short Ratio:4.1 to 10.7 to 11.9 to 1
NET POSITION TREND:
– COT Index Score (3 Year Range Pct):74.224.963.9
– COT Index Reading (3 Year Range):BullishBearishBullish
NET POSITION MOVEMENT INDEX:
– 6-Week Change in Strength Index:-11.315.9-36.1


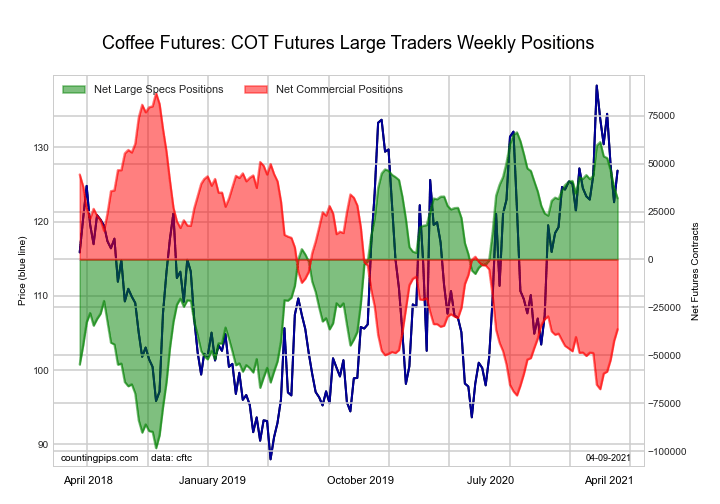
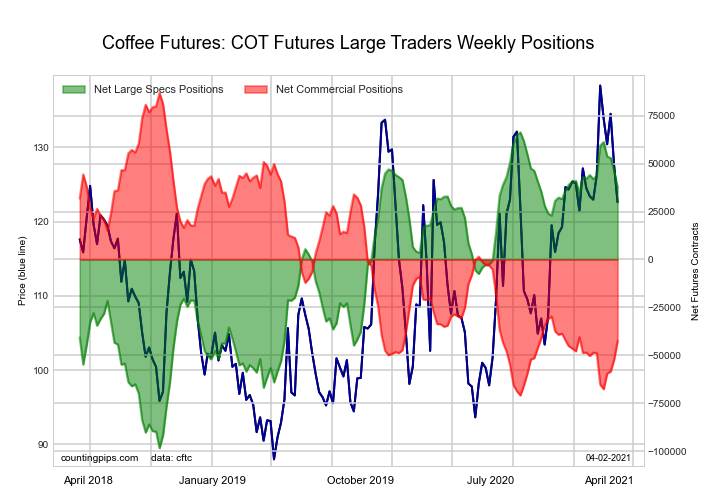
COFFEE Futures:


The COFFEE large speculator standing this week totaled a net position of 31,904 contracts in the data reported through Tuesday. This was a weekly fall of -5,713 contracts from the previous week which had a total of 37,617 net contracts.

This week’s current strength score (the trader positioning range over the past three years, measured from 0 to 100) shows the speculators are currently Bullish with a score of 79.1 percent. The commercials are Bearish with a score of 21.9 percent and the small traders (not shown in chart) are Bearish-Extreme with a score of 19.5 percent.

COFFEE Futures StatisticsSPECULATORSCOMMERCIALSSMALL TRADERS
– Percent of Open Interest Longs:23.449.54.2
– Percent of Open Interest Shorts:12.362.12.7
– Net Position:31,904-36,4084,504
– Gross Longs:67,634143,34912,223
– Gross Shorts:35,730179,7577,719
– Long to Short Ratio:1.9 to 10.8 to 11.6 to 1
NET POSITION TREND:
– COT Index Score (3 Year Range Pct):79.121.919.5
– COT Index Reading (3 Year Range):BullishBearishBearish-Extreme
NET POSITION MOVEMENT INDEX:
– 6-Week Change in Strength Index:-16.718.3-9.6


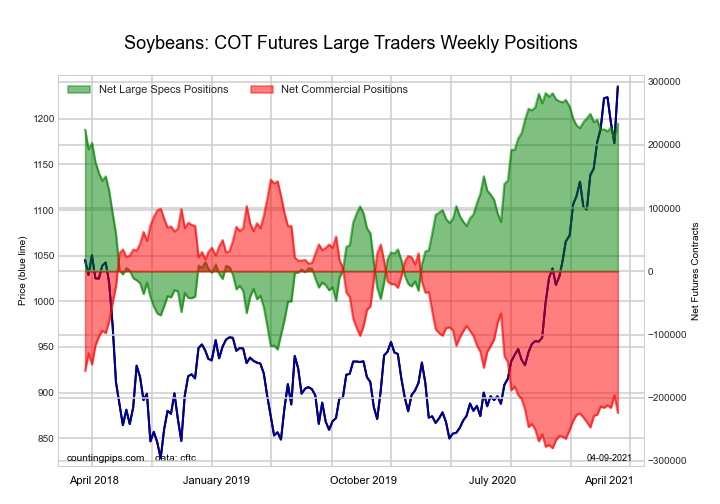
SOYBEANS Futures:


The SOYBEANS large speculator standing this week totaled a net position of 233,803 contracts in the data reported through Tuesday. This was a weekly boost of 22,124 contracts from the previous week which had a total of 211,679 net contracts.

This week’s current strength score (the trader positioning range over the past three years, measured from 0 to 100) shows the speculators are currently Bullish-Extreme with a score of 88.1 percent. The commercials are Bearish-Extreme with a score of 13.1 percent and the small traders (not shown in chart) are Bullish with a score of 68.0 percent.

SOYBEANS Futures StatisticsSPECULATORSCOMMERCIALSSMALL TRADERS
– Percent of Open Interest Longs:31.845.37.7
– Percent of Open Interest Shorts:5.071.18.8
– Net Position:233,803-224,010-9,793
– Gross Longs:276,934394,40866,733
– Gross Shorts:43,131618,41876,526
– Long to Short Ratio:6.4 to 10.6 to 10.9 to 1
NET POSITION TREND:
– COT Index Score (3 Year Range Pct):88.113.168.0
– COT Index Reading (3 Year Range):Bullish-ExtremeBearish-ExtremeBullish
NET POSITION MOVEMENT INDEX:
– 6-Week Change in Strength Index:-1.50.63.9


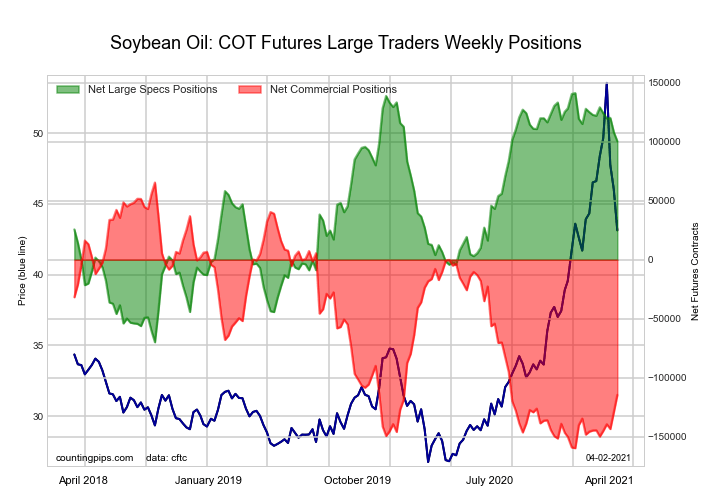
SOYBEAN OIL Futures:


The SOYBEAN OIL large speculator standing this week totaled a net position of 94,703 contracts in the data reported through Tuesday. This was a weekly fall of -5,688 contracts from the previous week which had a total of 100,391 net contracts.

This week’s current strength score (the trader positioning range over the past three years, measured from 0 to 100) shows the speculators are currently Bullish with a score of 78.0 percent. The commercials are Bearish with a score of 20.7 percent and the small traders (not shown in chart) are Bullish-Extreme with a score of 81.4 percent.

SOYBEAN OIL Futures StatisticsSPECULATORSCOMMERCIALSSMALL TRADERS
– Percent of Open Interest Longs:27.547.19.1
– Percent of Open Interest Shorts:8.469.85.4
– Net Position:94,703-112,92418,221
– Gross Longs:136,684233,92645,209
– Gross Shorts:41,981346,85026,988
– Long to Short Ratio:3.3 to 10.7 to 11.7 to 1
NET POSITION TREND:
– COT Index Score (3 Year Range Pct):78.020.781.4
– COT Index Reading (3 Year Range):BullishBearishBullish-Extreme
NET POSITION MOVEMENT INDEX:
– 6-Week Change in Strength Index:-16.316.4-8.9


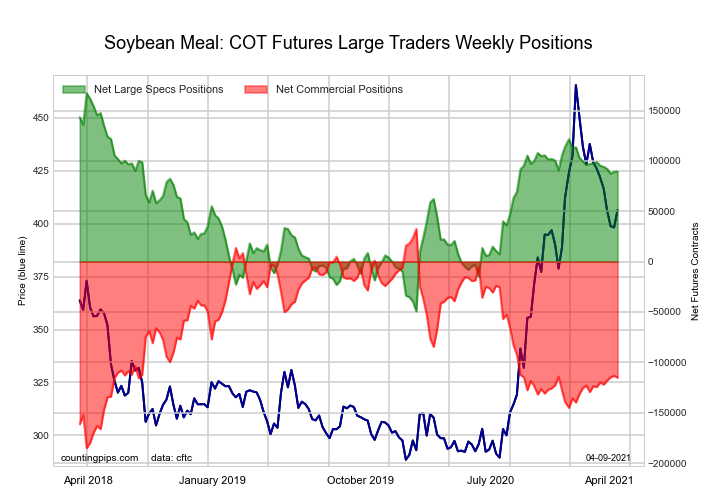
SOYBEAN MEAL Futures:


The SOYBEAN MEAL large speculator standing this week totaled a net position of 89,453 contracts in the data reported through Tuesday. This was a weekly lift of 125 contracts from the previous week which had a total of 89,328 net contracts.

This week’s current strength score (the trader positioning range over the past three years, measured from 0 to 100) shows the speculators are currently Bullish with a score of 64.0 percent. The commercials are Bearish with a score of 32.2 percent and the small traders (not shown in chart) are Bullish with a score of 73.7 percent.

SOYBEAN MEAL Futures StatisticsSPECULATORSCOMMERCIALSSMALL TRADERS
– Percent of Open Interest Longs:24.849.112.9
– Percent of Open Interest Shorts:3.376.86.7
– Net Position:89,453-115,17825,725
– Gross Longs:103,009203,51153,489
– Gross Shorts:13,556318,68927,764
– Long to Short Ratio:7.6 to 10.6 to 11.9 to 1
NET POSITION TREND:
– COT Index Score (3 Year Range Pct):64.032.273.7
– COT Index Reading (3 Year Range):BullishBearishBullish
NET POSITION MOVEMENT INDEX:
– 6-Week Change in Strength Index:-4.34.30.0


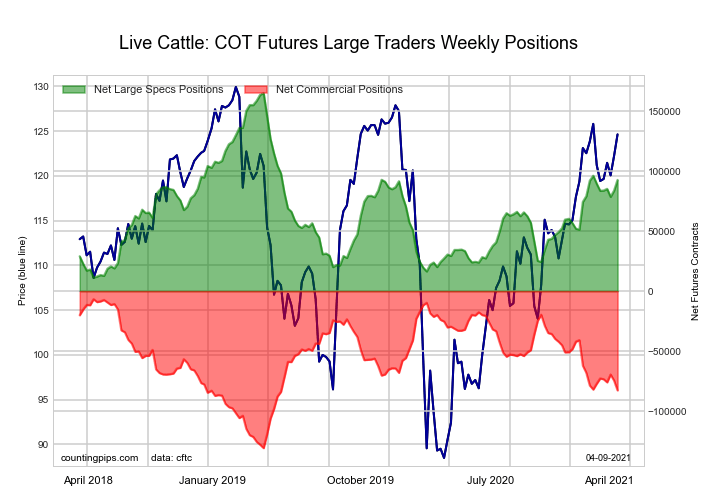
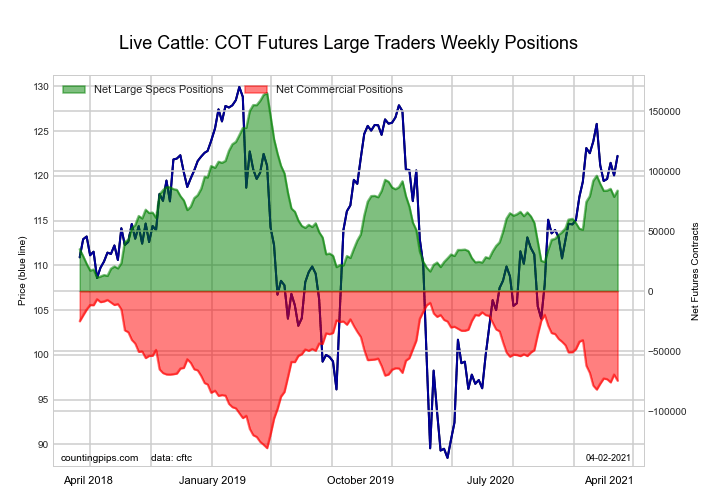
LIVE CATTLE Futures:


The LIVE CATTLE large speculator standing this week totaled a net position of 92,683 contracts in the data reported through Tuesday. This was a weekly gain of 8,827 contracts from the previous week which had a total of 83,856 net contracts.

This week’s current strength score (the trader positioning range over the past three years, measured from 0 to 100) shows the speculators are currently Bullish with a score of 52.9 percent. The commercials are Bearish with a score of 38.8 percent and the small traders (not shown in chart) are Bullish with a score of 62.8 percent.

LIVE CATTLE Futures StatisticsSPECULATORSCOMMERCIALSSMALL TRADERS
– Percent of Open Interest Longs:39.135.89.6
– Percent of Open Interest Shorts:12.159.912.5
– Net Position:92,683-82,699-9,984
– Gross Longs:134,251123,13833,149
– Gross Shorts:41,568205,83743,133
– Long to Short Ratio:3.2 to 10.6 to 10.8 to 1
NET POSITION TREND:
– COT Index Score (3 Year Range Pct):52.938.862.8
– COT Index Reading (3 Year Range):BullishBearishBullish
NET POSITION MOVEMENT INDEX:
– 6-Week Change in Strength Index:2.1-4.55.8


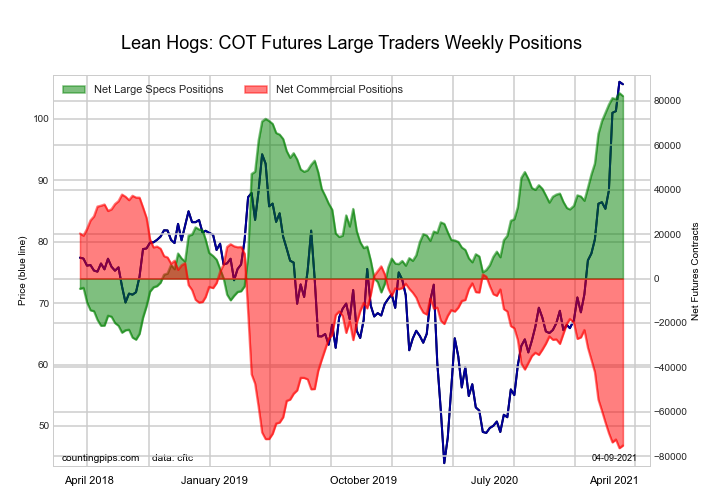
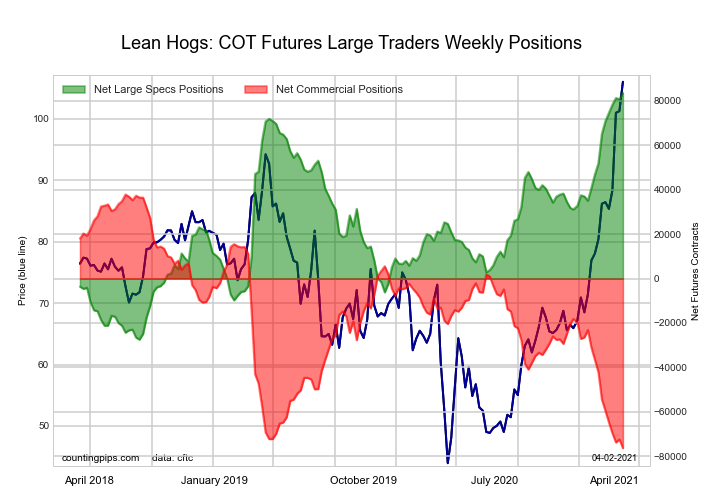
LEAN HOGS Futures:


The LEAN HOGS large speculator standing this week totaled a net position of 82,207 contracts in the data reported through Tuesday. This was a weekly decline of -1,344 contracts from the previous week which had a total of 83,551 net contracts.

This week’s current strength score (the trader positioning range over the past three years, measured from 0 to 100) shows the speculators are currently Bullish-Extreme with a score of 98.8 percent. The commercials are Bearish-Extreme with a score of 1.0 percent and the small traders (not shown in chart) are Bearish with a score of 44.4 percent.

LEAN HOGS Futures StatisticsSPECULATORSCOMMERCIALSSMALL TRADERS
– Percent of Open Interest Longs:42.029.69.3
– Percent of Open Interest Shorts:13.655.511.7
– Net Position:82,207-75,178-7,029
– Gross Longs:121,64285,68626,899
– Gross Shorts:39,435160,86433,928
– Long to Short Ratio:3.1 to 10.5 to 10.8 to 1
NET POSITION TREND:
– COT Index Score (3 Year Range Pct):98.81.044.4
– COT Index Reading (3 Year Range):Bullish-ExtremeBearish-ExtremeBearish
NET POSITION MOVEMENT INDEX:
– 6-Week Change in Strength Index:10.2-13.720.6


COTTON Futures:


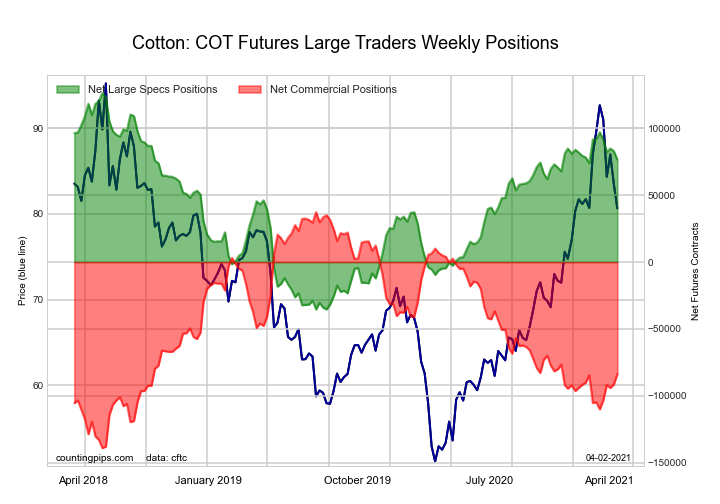
The COTTON large speculator standing this week totaled a net position of 74,388 contracts in the data reported through Tuesday. This was a weekly decline of -2,263 contracts from the previous week which had a total of 76,651 net contracts.

This week’s current strength score (the trader positioning range over the past three years, measured from 0 to 100) shows the speculators are currently Bullish with a score of 67.9 percent. The commercials are Bearish with a score of 32.0 percent and the small traders (not shown in chart) are Bullish with a score of 60.8 percent.

COTTON Futures StatisticsSPECULATORSCOMMERCIALSSMALL TRADERS
– Percent of Open Interest Longs:37.441.07.0
– Percent of Open Interest Shorts:5.077.03.4
– Net Position:74,388-82,6448,256
– Gross Longs:85,82294,11216,044
– Gross Shorts:11,434176,7567,788
– Long to Short Ratio:7.5 to 10.5 to 12.1 to 1
NET POSITION TREND:
– COT Index Score (3 Year Range Pct):67.932.060.8
– COT Index Reading (3 Year Range):BullishBearishBullish
NET POSITION MOVEMENT INDEX:
– 6-Week Change in Strength Index:-14.015.5-27.8


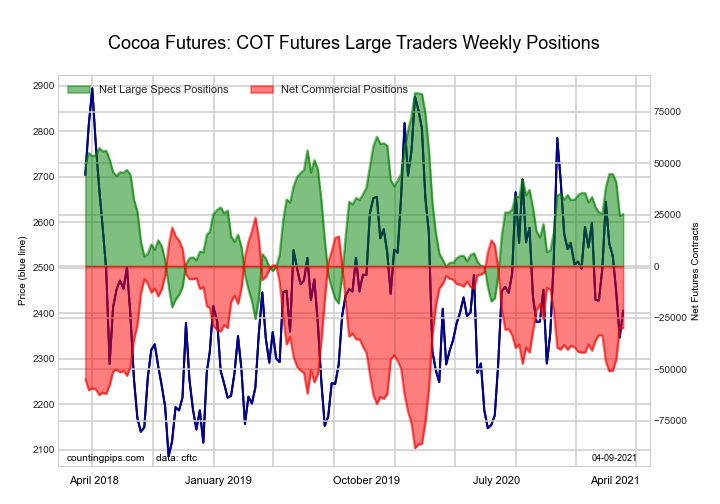
COCOA Futures:


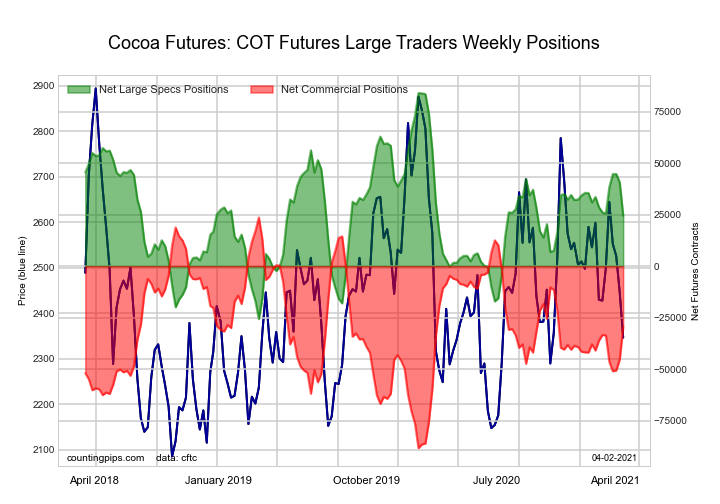
The COCOA large speculator standing this week totaled a net position of 25,372 contracts in the data reported through Tuesday. This was a weekly boost of 874 contracts from the previous week which had a total of 24,498 net contracts.

This week’s current strength score (the trader positioning range over the past three years, measured from 0 to 100) shows the speculators are currently Bearish with a score of 46.5 percent. The commercials are Bullish with a score of 52.1 percent and the small traders (not shown in chart) are Bullish with a score of 60.8 percent.

COCOA Futures StatisticsSPECULATORSCOMMERCIALSSMALL TRADERS
– Percent of Open Interest Longs:29.847.16.1
– Percent of Open Interest Shorts:16.463.03.7
– Net Position:25,372-29,9764,604
– Gross Longs:56,36089,12211,585
– Gross Shorts:30,988119,0986,981
– Long to Short Ratio:1.8 to 10.7 to 11.7 to 1
NET POSITION TREND:
– COT Index Score (3 Year Range Pct):46.552.160.8
– COT Index Reading (3 Year Range):BearishBullishBullish
NET POSITION MOVEMENT INDEX:
– 6-Week Change in Strength Index:-0.23.2-38.1


WHEAT Futures:


The WHEAT large speculator standing this week totaled a net position of 11,204 contracts in the data reported through Tuesday. This was a weekly increase of 8,120 contracts from the previous week which had a total of 3,084 net contracts.

This week’s current strength score (the trader positioning range over the past three years, measured from 0 to 100) shows the speculators are currently Bearish with a score of 46.8 percent. The commercials are Bullish with a score of 56.5 percent and the small traders (not shown in chart) are Bearish with a score of 44.1 percent.

WHEAT Futures StatisticsSPECULATORSCOMMERCIALSSMALL TRADERS
– Percent of Open Interest Longs:29.236.77.4
– Percent of Open Interest Shorts:26.536.510.3
– Net Position:11,204828-12,032
– Gross Longs:120,515151,69730,431
– Gross Shorts:109,311150,86942,463
– Long to Short Ratio:1.1 to 11.0 to 10.7 to 1
NET POSITION TREND:
– COT Index Score (3 Year Range Pct):46.856.544.1
– COT Index Reading (3 Year Range):BearishBullishBearish
NET POSITION MOVEMENT INDEX:
– 6-Week Change in Strength Index:-11.411.8-0.4


Article By CountingPips.comReceive our weekly COT Reports by Email

*COT Report: The COT data, released weekly to the public each Friday, is updated through the most recent Tuesday (data is 3 days old) and shows a quick view of how large speculators or non-commercials (for-profit traders) were positioned in the futures markets.

The CFTC categorizes trader positions according to commercial hedgers (traders who use futures contracts for hedging as part of the business), non-commercials (large traders who speculate to realize trading profits) and nonreportable traders (usually small traders/speculators).

Find CFTC criteria here: (http://www.cftc.gov/MarketReports/CommitmentsofTraders/ExplanatoryNotes/index.htm).

COT Metals Futures Charts: Gold, Silver, Palladium, Platinum & Copper

By CountingPips.comReceive our weekly COT Reports by Email

Here are the latest charts and statistics for the Commitment of Traders (COT) data published by the Commodities Futures Trading Commission (CFTC).

The latest COT data is updated through Tuesday April 06 2021 and shows a quick view of how large traders (for-profit speculators and commercial entities) were positioned in the futures markets.


Gold Comex Futures: Futures:

The Gold Comex Futures: large speculator standing this week recorded a net position of 189,509 contracts in the data reported through Tuesday. This was a weekly boost of 21,981 contracts from the previous week which had a total of 167,528 net contracts.

This week’s current strength score (the trader positioning range over the past three years, measured from 0 to 100) shows the speculators are currently Bullish with a score of 58.1 percent. The commercials are Bearish with a score of 41.5 percent and the small traders (not shown in chart) are Bearish with a score of 44.8 percent.

Gold Futures StatisticsSPECULATORSCOMMERCIALSSMALL TRADERS
– Percent of Open Interest Longs:59.521.210.0
– Percent of Open Interest Shorts:18.667.54.5
– Net Position:189,509-214,79925,290
– Gross Longs:275,70398,19646,301
– Gross Shorts:86,194312,99521,011
– Long to Short Ratio:3.2 to 10.3 to 12.2 to 1
NET POSITION TREND:
– COT Index Score (3 Year Range Pct):58.141.544.8
– COT Index Reading (3 Year Range):BullishBearishBearish
NET POSITION MOVEMENT INDEX:
– 6-Week Change in Strength Index:-6.79.0-26.2


Silver Comex Futures: Futures:

The Silver Comex Futures: large speculator standing this week recorded a net position of 32,315 contracts in the data reported through Tuesday. This was a weekly increase of 3,345 contracts from the previous week which had a total of 28,970 net contracts.

This week’s current strength score (the trader positioning range over the past three years, measured from 0 to 100) shows the speculators are currently Bullish with a score of 57.4 percent. The commercials are Bearish with a score of 43.5 percent and the small traders (not shown in chart) are Bearish with a score of 47.4 percent.

Silver Futures StatisticsSPECULATORSCOMMERCIALSSMALL TRADERS
– Percent of Open Interest Longs:43.532.018.7
– Percent of Open Interest Shorts:22.664.76.9
– Net Position:32,315-50,58518,270
– Gross Longs:67,24549,41528,893
– Gross Shorts:34,930100,00010,623
– Long to Short Ratio:1.9 to 10.5 to 12.7 to 1
NET POSITION TREND:
– COT Index Score (3 Year Range Pct):57.443.547.4
– COT Index Reading (3 Year Range):BullishBearishBearish
NET POSITION MOVEMENT INDEX:
– 6-Week Change in Strength Index:-14.317.2-27.3


Copper Grade #1 Futures: Futures:

The Copper Grade #1 Futures: large speculator standing this week recorded a net position of 43,010 contracts in the data reported through Tuesday. This was a weekly decline of -857 contracts from the previous week which had a total of 43,867 net contracts.

This week’s current strength score (the trader positioning range over the past three years, measured from 0 to 100) shows the speculators are currently Bullish with a score of 73.3 percent. The commercials are Bearish with a score of 22.6 percent and the small traders (not shown in chart) are Bullish-Extreme with a score of 92.8 percent.

Copper Futures StatisticsSPECULATORSCOMMERCIALSSMALL TRADERS
– Percent of Open Interest Longs:45.229.69.1
– Percent of Open Interest Shorts:27.551.74.8
– Net Position:43,010-53,62910,619
– Gross Longs:109,98572,13622,246
– Gross Shorts:66,975125,76511,627
– Long to Short Ratio:1.6 to 10.6 to 11.9 to 1
NET POSITION TREND:
– COT Index Score (3 Year Range Pct):73.322.692.8
– COT Index Reading (3 Year Range):BullishBearishBullish-Extreme
NET POSITION MOVEMENT INDEX:
– 6-Week Change in Strength Index:-23.322.6-3.1


Platinum Futures: Futures:

The Platinum Futures: large speculator standing this week recorded a net position of 32,748 contracts in the data reported through Tuesday. This was a weekly lift of 2,142 contracts from the previous week which had a total of 30,606 net contracts.

This week’s current strength score (the trader positioning range over the past three years, measured from 0 to 100) shows the speculators are currently Bullish with a score of 56.2 percent. The commercials are Bearish with a score of 43.0 percent and the small traders (not shown in chart) are Bullish-Extreme with a score of 82.3 percent.

Platinum Futures StatisticsSPECULATORSCOMMERCIALSSMALL TRADERS
– Percent of Open Interest Longs:64.014.815.6
– Percent of Open Interest Shorts:16.075.03.5
– Net Position:32,748-40,9818,233
– Gross Longs:43,62110,08010,620
– Gross Shorts:10,87351,0612,387
– Long to Short Ratio:4.0 to 10.2 to 14.4 to 1
NET POSITION TREND:
– COT Index Score (3 Year Range Pct):56.243.082.3
– COT Index Reading (3 Year Range):BullishBearishBullish-Extreme
NET POSITION MOVEMENT INDEX:
– 6-Week Change in Strength Index:-2.83.2-6.3


Palladium Futures: Futures:

The Palladium Futures: large speculator standing this week recorded a net position of 2,538 contracts in the data reported through Tuesday. This was a weekly boost of 195 contracts from the previous week which had a total of 2,343 net contracts.

This week’s current strength score (the trader positioning range over the past three years, measured from 0 to 100) shows the speculators are currently Bearish-Extreme with a score of 15.3 percent. The commercials are Bullish with a score of 78.8 percent and the small traders (not shown in chart) are Bullish-Extreme with a score of 96.1 percent.

Palladium Futures StatisticsSPECULATORSCOMMERCIALSSMALL TRADERS
– Percent of Open Interest Longs:50.928.015.3
– Percent of Open Interest Shorts:26.860.47.0
– Net Position:2,538-3,411873
– Gross Longs:5,3612,9521,612
– Gross Shorts:2,8236,363739
– Long to Short Ratio:1.9 to 10.5 to 12.2 to 1
NET POSITION TREND:
– COT Index Score (3 Year Range Pct):15.378.896.1
– COT Index Reading (3 Year Range):Bearish-ExtremeBullishBullish-Extreme
NET POSITION MOVEMENT INDEX:
– 6-Week Change in Strength Index:14.6-13.8-3.9


Article By CountingPips.comReceive our weekly COT Reports by Email

*COT Report: The COT data, released weekly to the public each Friday, is updated through the most recent Tuesday (data is 3 days old) and shows a quick view of how large speculators or non-commercials (for-profit traders) were positioned in the futures markets.

The CFTC categorizes trader positions according to commercial hedgers (traders who use futures contracts for hedging as part of the business), non-commercials (large traders who speculate to realize trading profits) and nonreportable traders (usually small traders/speculators).

Find CFTC criteria here: (http://www.cftc.gov/MarketReports/CommitmentsofTraders/ExplanatoryNotes/index.htm).
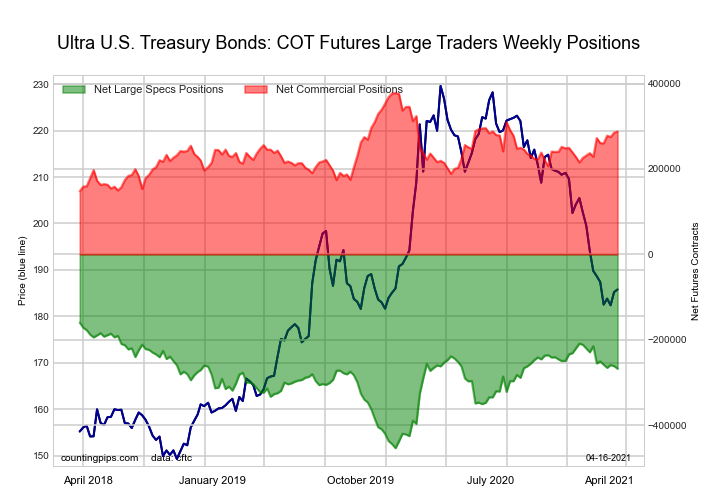
COT Currency Futures Charts: Bitcoin, US Dollar Index, Euro, Japanese Yen & Mexican Peso

By CountingPips.comReceive our weekly COT Reports by Email 

Here are the latest charts and statistics for the Commitment of Traders (COT) data published by the Commodities Futures Trading Commission (CFTC).

The latest COT data is updated through Tuesday March 30 2021 and shows a quick view of how large traders (for-profit speculators and commercial entities) were positioned in the futures markets. All currency positions are in direct relation to the US dollar where, for example, a bet for the euro is a bet that the euro will rise versus the dollar while a bet against the euro will be a bet that the euro will decline versus the dollar.


US DOLLAR INDEX:

US DOLLAR INDEX StatisticsSPECULATORSCOMMERCIALSSMALL TRADERS
– Percent of Open Interest Longs:75.74.515.3
– Percent of Open Interest Shorts:61.528.06.0
– Net Position:5,726-9,5013,775
– Gross Longs:30,5131,7986,175
– Gross Shorts:24,78711,2992,400
– Long to Short Ratio:1.2 to 10.2 to 12.6 to 1
NET POSITION TREND:
– COT Index Score (3 Year Range Pct):35.758.868.2
– COT Index Reading (3 Year Range):BearishBullishBullish
NET POSITION MOVEMENT INDEX:
– 6-Week Change in Strength Index:34.5-36.424.8


EURO Currency:

EURO Currency StatisticsSPECULATORSCOMMERCIALSSMALL TRADERS
– Percent of Open Interest Longs:30.254.514.2
– Percent of Open Interest Shorts:18.873.36.8
– Net Position:73,739-121,32847,589
– Gross Longs:194,763351,29291,621
– Gross Shorts:121,024472,62044,032
– Long to Short Ratio:1.6 to 10.7 to 12.1 to 1
NET POSITION TREND:
– COT Index Score (3 Year Range Pct):57.641.474.0
– COT Index Reading (3 Year Range):BullishBearishBullish
NET POSITION MOVEMENT INDEX:
– 6-Week Change in Strength Index:-20.320.5-10.8


BRITISH POUND STERLING:

BRITISH POUND StatisticsSPECULATORSCOMMERCIALSSMALL TRADERS
– Percent of Open Interest Longs:33.841.224.5
– Percent of Open Interest Shorts:15.963.819.7
– Net Position:24,959-31,5806,621
– Gross Longs:47,22257,58434,194
– Gross Shorts:22,26389,16427,573
– Long to Short Ratio:2.1 to 10.6 to 11.2 to 1
NET POSITION TREND:
– COT Index Score (3 Year Range Pct):84.917.578.4
– COT Index Reading (3 Year Range):Bullish-ExtremeBearish-ExtremeBullish
NET POSITION MOVEMENT INDEX:
– 6-Week Change in Strength Index:1.93.4-21.3


JAPANESE YEN:

JAPANESE YEN StatisticsSPECULATORSCOMMERCIALSSMALL TRADERS
– Percent of Open Interest Longs:14.972.911.3
– Percent of Open Interest Shorts:50.724.224.2
– Net Position:-59,48180,881-21,400
– Gross Longs:24,724121,11518,838
– Gross Shorts:84,20540,23440,238
– Long to Short Ratio:0.3 to 13.0 to 10.5 to 1
NET POSITION TREND:
– COT Index Score (3 Year Range Pct):33.672.915.3
– COT Index Reading (3 Year Range):BearishBullishBearish-Extreme
NET POSITION MOVEMENT INDEX:
– 6-Week Change in Strength Index:-58.355.1-37.6


SWISS FRANC:

SWISS FRANC StatisticsSPECULATORSCOMMERCIALSSMALL TRADERS
– Percent of Open Interest Longs:37.639.822.0
– Percent of Open Interest Shorts:27.616.555.3
– Net Position:4,2699,957-14,226
– Gross Longs:16,08617,0129,414
– Gross Shorts:11,8177,05523,640
– Long to Short Ratio:1.4 to 12.4 to 10.4 to 1
NET POSITION TREND:
– COT Index Score (3 Year Range Pct):80.039.426.9
– COT Index Reading (3 Year Range):BullishBearishBearish
NET POSITION MOVEMENT INDEX:
– 6-Week Change in Strength Index:-6.425.5-54.4


CANADIAN DOLLAR:

CANADIAN DOLLAR StatisticsSPECULATORSCOMMERCIALSSMALL TRADERS
– Percent of Open Interest Longs:29.541.628.0
– Percent of Open Interest Shorts:25.562.311.3
– Net Position:6,518-34,05127,533
– Gross Longs:48,46268,22846,055
– Gross Shorts:41,944102,27918,522
– Long to Short Ratio:1.2 to 10.7 to 12.5 to 1
NET POSITION TREND:
– COT Index Score (3 Year Range Pct):60.426.088.3
– COT Index Reading (3 Year Range):BullishBearishBullish-Extreme
NET POSITION MOVEMENT INDEX:
– 6-Week Change in Strength Index:-1.4-0.33.2


AUSTRALIAN DOLLAR:

AUSTRALIAN DOLLAR StatisticsSPECULATORSCOMMERCIALSSMALL TRADERS
– Percent of Open Interest Longs:48.530.920.0
– Percent of Open Interest Shorts:39.644.515.4
– Net Position:12,263-18,6376,374
– Gross Longs:66,60742,45027,517
– Gross Shorts:54,34461,08721,143
– Long to Short Ratio:1.2 to 10.7 to 11.3 to 1
NET POSITION TREND:
– COT Index Score (3 Year Range Pct):95.55.671.1
– COT Index Reading (3 Year Range):Bullish-ExtremeBearish-ExtremeBullish
NET POSITION MOVEMENT INDEX:
– 6-Week Change in Strength Index:16.8-3.7-23.3


NEW ZEALAND DOLLAR:

NEW ZEALAND DOLLAR StatisticsSPECULATORSCOMMERCIALSSMALL TRADERS
– Percent of Open Interest Longs:51.529.814.5
– Percent of Open Interest Shorts:40.546.29.2
– Net Position:4,046-6,0171,971
– Gross Longs:18,94510,9715,351
– Gross Shorts:14,89916,9883,380
– Long to Short Ratio:1.3 to 10.6 to 11.6 to 1
NET POSITION TREND:
– COT Index Score (3 Year Range Pct):66.430.975.3
– COT Index Reading (3 Year Range):BullishBearishBullish
NET POSITION MOVEMENT INDEX:
– 6-Week Change in Strength Index:-13.815.4-19.6


MEXICAN PESO:

MEXICAN PESO StatisticsSPECULATORSCOMMERCIALSSMALL TRADERS
– Percent of Open Interest Longs:42.652.14.7
– Percent of Open Interest Shorts:53.643.12.6
– Net Position:-15,11312,2742,839
– Gross Longs:58,08971,0956,389
– Gross Shorts:73,20258,8213,550
– Long to Short Ratio:0.8 to 11.2 to 11.8 to 1
NET POSITION TREND:
– COT Index Score (3 Year Range Pct):7.292.255.1
– COT Index Reading (3 Year Range):Bearish-ExtremeBullish-ExtremeBullish
NET POSITION MOVEMENT INDEX:
– 6-Week Change in Strength Index:-8.39.0-7.6


BRAZIL REAL:

BRAZIL REAL StatisticsSPECULATORSCOMMERCIALSSMALL TRADERS
– Percent of Open Interest Longs:16.578.04.1
– Percent of Open Interest Shorts:55.039.74.0
– Net Position:-25,30925,21990
– Gross Longs:10,88851,3422,709
– Gross Shorts:36,19726,1232,619
– Long to Short Ratio:0.3 to 12.0 to 11.0 to 1
NET POSITION TREND:
– COT Index Score (3 Year Range Pct):42.959.272.3
– COT Index Reading (3 Year Range):BearishBullishBullish
NET POSITION MOVEMENT INDEX:
– 6-Week Change in Strength Index:-11.713.7-15.6


RUSSIAN RUBLE:

RUSSIAN RUBLE StatisticsSPECULATORSCOMMERCIALSSMALL TRADERS
– Percent of Open Interest Longs:33.160.86.0
– Percent of Open Interest Shorts:10.084.25.7
– Net Position:6,784-6,87288
– Gross Longs:9,71417,8311,746
– Gross Shorts:2,93024,7031,658
– Long to Short Ratio:3.3 to 10.7 to 11.1 to 1
NET POSITION TREND:
– COT Index Score (3 Year Range Pct):29.469.845.6
– COT Index Reading (3 Year Range):BearishBullishBearish
NET POSITION MOVEMENT INDEX:
– 6-Week Change in Strength Index:17.3-15.5-19.1


BITCOIN FUTURES:

BITCOIN StatisticsSPECULATORSCOMMERCIALSSMALL TRADERS
– Percent of Open Interest Longs:60.95.327.8
– Percent of Open Interest Shorts:84.62.27.3
– Net Position:-2,2152951,920
– Gross Longs:5,6764982,596
– Gross Shorts:7,891203676
– Long to Short Ratio:0.7 to 12.5 to 13.8 to 1
NET POSITION TREND:
– COT Index Score (3 Year Range Pct):41.676.252.9
– COT Index Reading (3 Year Range):BearishBullishBullish
NET POSITION MOVEMENT INDEX:
– 6-Week Change in Strength Index:19.119.8-27.3


Article By CountingPips.comReceive our weekly COT Reports by Email

*COT Report: The COT data, released weekly to the public each Friday, is updated through the most recent Tuesday (data is 3 days old) and shows a quick view of how large speculators or non-commercials (for-profit traders) were positioned in the futures markets.

The CFTC categorizes trader positions according to commercial hedgers (traders who use futures contracts for hedging as part of the business), non-commercials (large traders who speculate to realize trading profits) and nonreportable traders (usually small traders/speculators).

Find CFTC criteria here: (http://www.cftc.gov/MarketReports/CommitmentsofTraders/ExplanatoryNotes/index.htm).
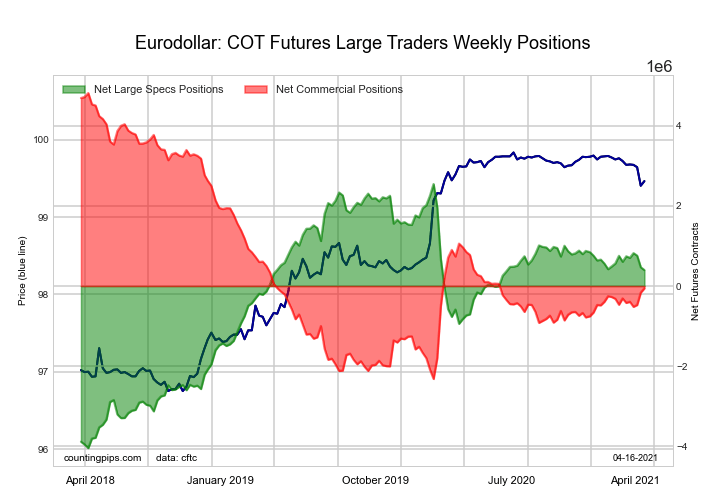
COT Soft Commodities Futures Charts: Sugar, Coffee, Wheat, Cattle, Corn, Soybeans, Hogs

By CountingPips.comReceive our weekly COT Reports by Email

Here are the latest charts and statistics for the Commitment of Traders (COT) data published by the Commodities Futures Trading Commission (CFTC).
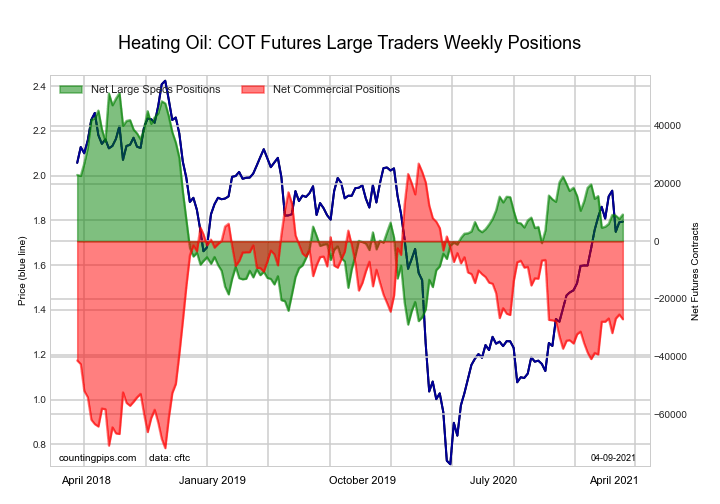
The latest COT data is updated through Tuesday March 30 2021 and shows a quick view of how large traders (for-profit speculators and commercial entities) were positioned in the futures markets.
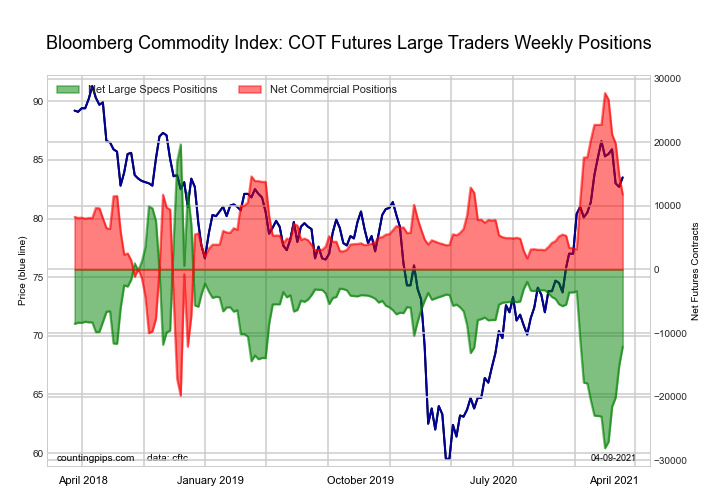

CORN:

CORN

CORN Futures StatisticsSPECULATORSCOMMERCIALSSMALL TRADERS
– Percent of Open Interest Longs:35.244.98.1
– Percent of Open Interest Shorts:4.573.410.3
– Net Position:535,345-495,989-39,356
– Gross Longs:613,446782,465140,798
– Gross Shorts:78,1011,278,454180,154
– Long to Short Ratio:7.9 to 10.6 to 10.8 to 1
NET POSITION TREND:
– COT Index Score (3 Year Range Pct):98.41.325.3
– COT Index Reading (3 Year Range):Bullish-ExtremeBearish-ExtremeBearish
NET POSITION MOVEMENT INDEX:
– 6-Week Change in Strength Index:2.7-2.1-3.4


SUGAR:

SUGAR

SUGAR Futures StatisticsSPECULATORSCOMMERCIALSSMALL TRADERS
– Percent of Open Interest Longs:23.852.78.9
– Percent of Open Interest Shorts:5.775.24.5
– Net Position:190,169-236,64446,475
– Gross Longs:249,957552,69893,917
– Gross Shorts:59,788789,34247,442
– Long to Short Ratio:4.2 to 10.7 to 12.0 to 1
NET POSITION TREND:
– COT Index Score (3 Year Range Pct):75.723.365.3
– COT Index Reading (3 Year Range):BullishBearishBullish
NET POSITION MOVEMENT INDEX:
– 6-Week Change in Strength Index:-7.610.9-25.7


COFFEE:

COFFEE

COFFEE Futures StatisticsSPECULATORSCOMMERCIALSSMALL TRADERS
– Percent of Open Interest Longs:24.649.44.5
– Percent of Open Interest Shorts:11.564.22.8
– Net Position:37,617-42,5444,927
– Gross Longs:70,698142,08212,980
– Gross Shorts:33,081184,6268,053
– Long to Short Ratio:2.1 to 10.8 to 11.6 to 1
NET POSITION TREND:
– COT Index Score (3 Year Range Pct):82.618.022.4
– COT Index Reading (3 Year Range):Bullish-ExtremeBearish-ExtremeBearish
NET POSITION MOVEMENT INDEX:
– 6-Week Change in Strength Index:-3.74.0-1.5


SOYBEANS:

SOYBEANS

SOYBEANS Futures StatisticsSPECULATORSCOMMERCIALSSMALL TRADERS
– Percent of Open Interest Longs:30.346.37.4
– Percent of Open Interest Shorts:5.869.09.2
– Net Position:211,679-196,006-15,673
– Gross Longs:261,759399,81763,830
– Gross Shorts:50,080595,82379,503
– Long to Short Ratio:5.2 to 10.7 to 10.8 to 1
NET POSITION TREND:
– COT Index Score (3 Year Range Pct):82.619.761.0
– COT Index Reading (3 Year Range):Bullish-ExtremeBearish-ExtremeBullish
NET POSITION MOVEMENT INDEX:
– 6-Week Change in Strength Index:-6.07.8-10.2


SOYBEAN OIL:

SOYBEAN OIL

SOYBEAN OIL Futures StatisticsSPECULATORSCOMMERCIALSSMALL TRADERS
– Percent of Open Interest Longs:29.946.58.2
– Percent of Open Interest Shorts:9.669.85.4
– Net Position:100,391-114,48914,098
– Gross Longs:147,627229,45040,590
– Gross Shorts:47,236343,93926,492
– Long to Short Ratio:3.1 to 10.7 to 11.5 to 1
NET POSITION TREND:
– COT Index Score (3 Year Range Pct):80.720.066.0
– COT Index Reading (3 Year Range):Bullish-ExtremeBearishBullish
NET POSITION MOVEMENT INDEX:
– 6-Week Change in Strength Index:-10.213.3-31.1


SOYBEAN MEAL:

SOYBEAN MEAL

SOYBEAN MEAL Futures StatisticsSPECULATORSCOMMERCIALSSMALL TRADERS
– Percent of Open Interest Longs:25.648.612.9
– Percent of Open Interest Shorts:3.876.37.1
– Net Position:89,328-113,25123,923
– Gross Longs:104,701199,02152,819
– Gross Shorts:15,373312,27228,896
– Long to Short Ratio:6.8 to 10.6 to 11.8 to 1
NET POSITION TREND:
– COT Index Score (3 Year Range Pct):64.033.066.5
– COT Index Reading (3 Year Range):BullishBearishBullish
NET POSITION MOVEMENT INDEX:
– 6-Week Change in Strength Index:-3.84.7-8.2


LIVE CATTLE:

LIVE CATTLE

LIVE CATTLE Futures StatisticsSPECULATORSCOMMERCIALSSMALL TRADERS
– Percent of Open Interest Longs:37.236.99.8
– Percent of Open Interest Shorts:12.359.012.5
– Net Position:83,856-74,627-9,229
– Gross Longs:125,535124,73133,087
– Gross Shorts:41,679199,35842,316
– Long to Short Ratio:3.0 to 10.6 to 10.8 to 1
NET POSITION TREND:
– COT Index Score (3 Year Range Pct):47.245.364.6
– COT Index Reading (3 Year Range):BearishBearishBullish
NET POSITION MOVEMENT INDEX:
– 6-Week Change in Strength Index:-8.05.912.1


LEAN HOGS:

LEAN HOGS

LEAN HOGS Futures StatisticsSPECULATORSCOMMERCIALSSMALL TRADERS
– Percent of Open Interest Longs:42.729.79.2
– Percent of Open Interest Shorts:13.356.611.7
– Net Position:83,551-76,344-7,207
– Gross Longs:121,31184,45726,081
– Gross Shorts:37,760160,80133,288
– Long to Short Ratio:3.2 to 10.5 to 10.8 to 1
NET POSITION TREND:
– COT Index Score (3 Year Range Pct):100.00.043.5
– COT Index Reading (3 Year Range):Bullish-ExtremeBearish-ExtremeBearish
NET POSITION MOVEMENT INDEX:
– 6-Week Change in Strength Index:16.6-19.216.4


COTTON:

COTTON Futures

COTTON Futures StatisticsSPECULATORSCOMMERCIALSSMALL TRADERS
– Percent of Open Interest Longs:38.143.17.1
– Percent of Open Interest Shorts:4.479.84.0
– Net Position:76,651-83,6967,045
– Gross Longs:86,79798,34216,155
– Gross Shorts:10,146182,0389,110
– Long to Short Ratio:8.6 to 10.5 to 11.8 to 1
NET POSITION TREND:
– COT Index Score (3 Year Range Pct):69.231.453.8
– COT Index Reading (3 Year Range):BullishBearishBullish
NET POSITION MOVEMENT INDEX:
– 6-Week Change in Strength Index:-9.512.0-33.5


COCOA:

COCOA

COCOA Futures StatisticsSPECULATORSCOMMERCIALSSMALL TRADERS
– Percent of Open Interest Longs:32.643.66.0
– Percent of Open Interest Shorts:19.859.03.4
– Net Position:24,498-29,5235,025
– Gross Longs:62,67283,93911,511
– Gross Shorts:38,174113,4626,486
– Long to Short Ratio:1.6 to 10.7 to 11.8 to 1
NET POSITION TREND:
– COT Index Score (3 Year Range Pct):45.752.565.6
– COT Index Reading (3 Year Range):BearishBullishBullish
NET POSITION MOVEMENT INDEX:
– 6-Week Change in Strength Index:-1.53.4-24.7


WHEAT:

WHEAT Futures

WHEAT Futures StatisticsSPECULATORSCOMMERCIALSSMALL TRADERS
– Percent of Open Interest Longs:27.837.57.5
– Percent of Open Interest Shorts:27.135.510.2
– Net Position:3,0848,423-11,507
– Gross Longs:117,365158,26831,567
– Gross Shorts:114,281149,84543,074
– Long to Short Ratio:1.0 to 11.1 to 10.7 to 1
NET POSITION TREND:
– COT Index Score (3 Year Range Pct):41.162.146.6
– COT Index Reading (3 Year Range):BearishBullishBearish
NET POSITION MOVEMENT INDEX:
– 6-Week Change in Strength Index:-20.321.4-3.5


Article By CountingPips.comReceive our weekly COT Reports by Email

*COT Report: The COT data, released weekly to the public each Friday, is updated through the most recent Tuesday (data is 3 days old) and shows a quick view of how large speculators or non-commercials (for-profit traders) were positioned in the futures markets.

The CFTC categorizes trader positions according to commercial hedgers (traders who use futures contracts for hedging as part of the business), non-commercials (large traders who speculate to realize trading profits) and nonreportable traders (usually small traders/speculators).

Find CFTC criteria here: (http://www.cftc.gov/MarketReports/CommitmentsofTraders/ExplanatoryNotes/index.htm).