
By CountingPips.com – Receive our weekly COT Reports by Email
Here are the latest charts and statistics for the Commitment of Traders (COT) data published by the Commodities Futures Trading Commission (CFTC).
The latest COT data is updated through Tuesday April 06 2021 and shows a quick view of how large traders (for-profit speculators and commercial entities) were positioned in the futures markets.
Gold Comex Futures: Futures:
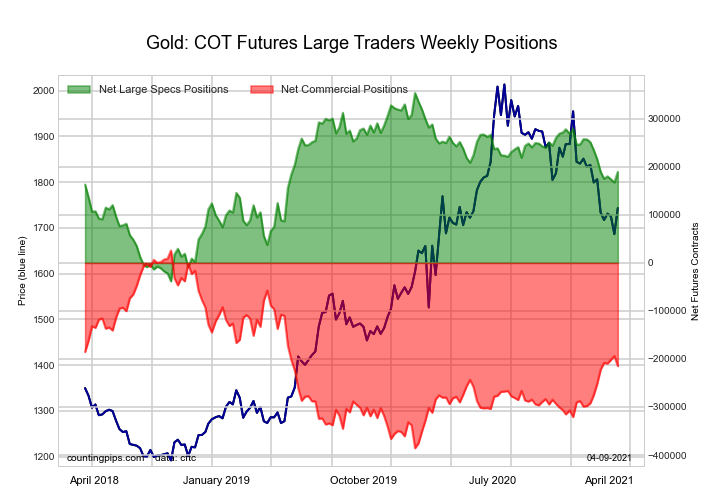
The Gold Comex Futures: large speculator standing this week recorded a net position of 189,509 contracts in the data reported through Tuesday. This was a weekly boost of 21,981 contracts from the previous week which had a total of 167,528 net contracts.
This week’s current strength score (the trader positioning range over the past three years, measured from 0 to 100) shows the speculators are currently Bullish with a score of 58.1 percent. The commercials are Bearish with a score of 41.5 percent and the small traders (not shown in chart) are Bearish with a score of 44.8 percent.
Free Reports:
 Get our Weekly Commitment of Traders Reports - See where the biggest traders (Hedge Funds and Commercial Hedgers) are positioned in the futures markets on a weekly basis.
 Download Our Metatrader 4 Indicators – Put Our Free MetaTrader 4 Custom Indicators on your charts when you join our Weekly Newsletter
| Gold Futures Statistics | SPECULATORS | COMMERCIALS | SMALL TRADERS |
| – Percent of Open Interest Longs: | 59.5 | 21.2 | 10.0 |
| – Percent of Open Interest Shorts: | 18.6 | 67.5 | 4.5 |
| – Net Position: | 189,509 | -214,799 | 25,290 |
| – Gross Longs: | 275,703 | 98,196 | 46,301 |
| – Gross Shorts: | 86,194 | 312,995 | 21,011 |
| – Long to Short Ratio: | 3.2 to 1 | 0.3 to 1 | 2.2 to 1 |
| NET POSITION TREND: | |||
| – COT Index Score (3 Year Range Pct): | 58.1 | 41.5 | 44.8 |
| – COT Index Reading (3 Year Range): | Bullish | Bearish | Bearish |
| NET POSITION MOVEMENT INDEX: | |||
| – 6-Week Change in Strength Index: | -6.7 | 9.0 | -26.2 |
Silver Comex Futures: Futures:
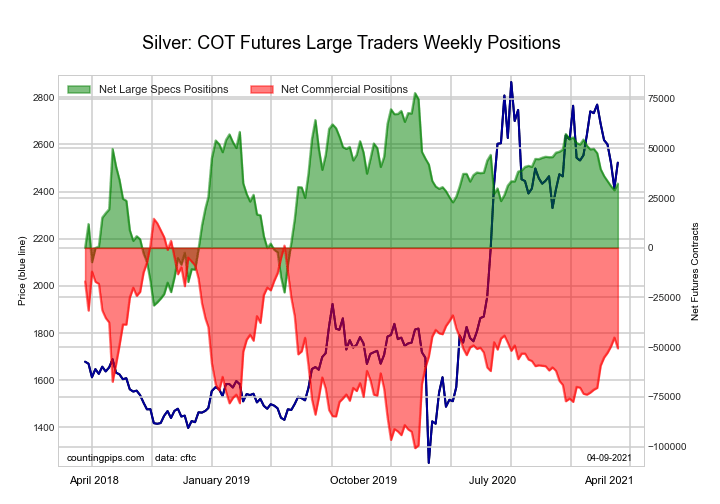
The Silver Comex Futures: large speculator standing this week recorded a net position of 32,315 contracts in the data reported through Tuesday. This was a weekly increase of 3,345 contracts from the previous week which had a total of 28,970 net contracts.
This week’s current strength score (the trader positioning range over the past three years, measured from 0 to 100) shows the speculators are currently Bullish with a score of 57.4 percent. The commercials are Bearish with a score of 43.5 percent and the small traders (not shown in chart) are Bearish with a score of 47.4 percent.
| Silver Futures Statistics | SPECULATORS | COMMERCIALS | SMALL TRADERS |
| – Percent of Open Interest Longs: | 43.5 | 32.0 | 18.7 |
| – Percent of Open Interest Shorts: | 22.6 | 64.7 | 6.9 |
| – Net Position: | 32,315 | -50,585 | 18,270 |
| – Gross Longs: | 67,245 | 49,415 | 28,893 |
| – Gross Shorts: | 34,930 | 100,000 | 10,623 |
| – Long to Short Ratio: | 1.9 to 1 | 0.5 to 1 | 2.7 to 1 |
| NET POSITION TREND: | |||
| – COT Index Score (3 Year Range Pct): | 57.4 | 43.5 | 47.4 |
| – COT Index Reading (3 Year Range): | Bullish | Bearish | Bearish |
| NET POSITION MOVEMENT INDEX: | |||
| – 6-Week Change in Strength Index: | -14.3 | 17.2 | -27.3 |
Copper Grade #1 Futures: Futures:
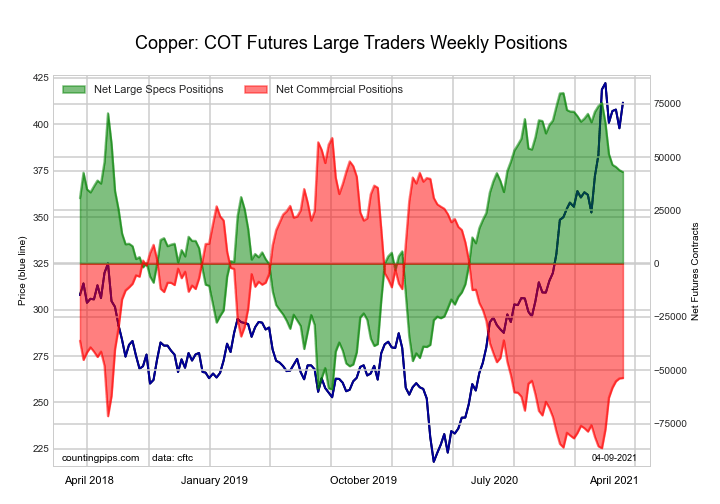
The Copper Grade #1 Futures: large speculator standing this week recorded a net position of 43,010 contracts in the data reported through Tuesday. This was a weekly decline of -857 contracts from the previous week which had a total of 43,867 net contracts.
This week’s current strength score (the trader positioning range over the past three years, measured from 0 to 100) shows the speculators are currently Bullish with a score of 73.3 percent. The commercials are Bearish with a score of 22.6 percent and the small traders (not shown in chart) are Bullish-Extreme with a score of 92.8 percent.
| Copper Futures Statistics | SPECULATORS | COMMERCIALS | SMALL TRADERS |
| – Percent of Open Interest Longs: | 45.2 | 29.6 | 9.1 |
| – Percent of Open Interest Shorts: | 27.5 | 51.7 | 4.8 |
| – Net Position: | 43,010 | -53,629 | 10,619 |
| – Gross Longs: | 109,985 | 72,136 | 22,246 |
| – Gross Shorts: | 66,975 | 125,765 | 11,627 |
| – Long to Short Ratio: | 1.6 to 1 | 0.6 to 1 | 1.9 to 1 |
| NET POSITION TREND: | |||
| – COT Index Score (3 Year Range Pct): | 73.3 | 22.6 | 92.8 |
| – COT Index Reading (3 Year Range): | Bullish | Bearish | Bullish-Extreme |
| NET POSITION MOVEMENT INDEX: | |||
| – 6-Week Change in Strength Index: | -23.3 | 22.6 | -3.1 |
Platinum Futures: Futures:

The Platinum Futures: large speculator standing this week recorded a net position of 32,748 contracts in the data reported through Tuesday. This was a weekly lift of 2,142 contracts from the previous week which had a total of 30,606 net contracts.
This week’s current strength score (the trader positioning range over the past three years, measured from 0 to 100) shows the speculators are currently Bullish with a score of 56.2 percent. The commercials are Bearish with a score of 43.0 percent and the small traders (not shown in chart) are Bullish-Extreme with a score of 82.3 percent.
| Platinum Futures Statistics | SPECULATORS | COMMERCIALS | SMALL TRADERS |
| – Percent of Open Interest Longs: | 64.0 | 14.8 | 15.6 |
| – Percent of Open Interest Shorts: | 16.0 | 75.0 | 3.5 |
| – Net Position: | 32,748 | -40,981 | 8,233 |
| – Gross Longs: | 43,621 | 10,080 | 10,620 |
| – Gross Shorts: | 10,873 | 51,061 | 2,387 |
| – Long to Short Ratio: | 4.0 to 1 | 0.2 to 1 | 4.4 to 1 |
| NET POSITION TREND: | |||
| – COT Index Score (3 Year Range Pct): | 56.2 | 43.0 | 82.3 |
| – COT Index Reading (3 Year Range): | Bullish | Bearish | Bullish-Extreme |
| NET POSITION MOVEMENT INDEX: | |||
| – 6-Week Change in Strength Index: | -2.8 | 3.2 | -6.3 |
Palladium Futures: Futures:
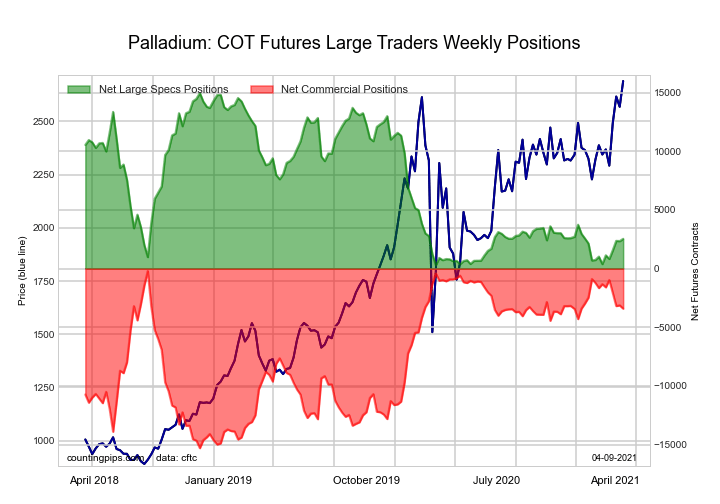
The Palladium Futures: large speculator standing this week recorded a net position of 2,538 contracts in the data reported through Tuesday. This was a weekly boost of 195 contracts from the previous week which had a total of 2,343 net contracts.
This week’s current strength score (the trader positioning range over the past three years, measured from 0 to 100) shows the speculators are currently Bearish-Extreme with a score of 15.3 percent. The commercials are Bullish with a score of 78.8 percent and the small traders (not shown in chart) are Bullish-Extreme with a score of 96.1 percent.
| Palladium Futures Statistics | SPECULATORS | COMMERCIALS | SMALL TRADERS |
| – Percent of Open Interest Longs: | 50.9 | 28.0 | 15.3 |
| – Percent of Open Interest Shorts: | 26.8 | 60.4 | 7.0 |
| – Net Position: | 2,538 | -3,411 | 873 |
| – Gross Longs: | 5,361 | 2,952 | 1,612 |
| – Gross Shorts: | 2,823 | 6,363 | 739 |
| – Long to Short Ratio: | 1.9 to 1 | 0.5 to 1 | 2.2 to 1 |
| NET POSITION TREND: | |||
| – COT Index Score (3 Year Range Pct): | 15.3 | 78.8 | 96.1 |
| – COT Index Reading (3 Year Range): | Bearish-Extreme | Bullish | Bullish-Extreme |
| NET POSITION MOVEMENT INDEX: | |||
| – 6-Week Change in Strength Index: | 14.6 | -13.8 | -3.9 |
Article By CountingPips.com – Receive our weekly COT Reports by Email
*COT Report: The COT data, released weekly to the public each Friday, is updated through the most recent Tuesday (data is 3 days old) and shows a quick view of how large speculators or non-commercials (for-profit traders) were positioned in the futures markets.
The CFTC categorizes trader positions according to commercial hedgers (traders who use futures contracts for hedging as part of the business), non-commercials (large traders who speculate to realize trading profits) and nonreportable traders (usually small traders/speculators).
Find CFTC criteria here: (http://www.cftc.gov/MarketReports/CommitmentsofTraders/ExplanatoryNotes/index.htm).

- The US introduces new import tariffs for 60 countries. Brent crude surpasses $100 per barrel Jul 24, 2026
- USD/JPY Breaks Records: Nothing Slows the Yen’s Decline Jul 24, 2026
- Oil prices reached a 6‑week high. The AUD strengthened on the back of a strong labor‑market report Jul 23, 2026
- EUR/USD Recovers as Dollar Weakens Jul 23, 2026
- Bitcoin rose to $66,000. The New Zealand dollar continues to strengthen Jul 22, 2026
- Inflationary pressure is easing in Canada. In New Zealand, on the contrary, inflation is rising Jul 21, 2026
- GBP/USD Falls After Cabinet Changes Jul 21, 2026
- Geopolitical and macroeconomic conditions continue to pressure market sentiment Jul 20, 2026
- USD/JPY Poised to Continue Gains as Expensive Oil and Lack of Support Weigh on Yen Jul 20, 2026
- COT Metals Charts: Weekly Speculator Bets led by Copper & Steel Jul 18, 2026