By InvestMacro
Here are the latest charts and statistics for the Commitment of Traders (COT) data published by the Commodities Futures Trading Commission (CFTC).
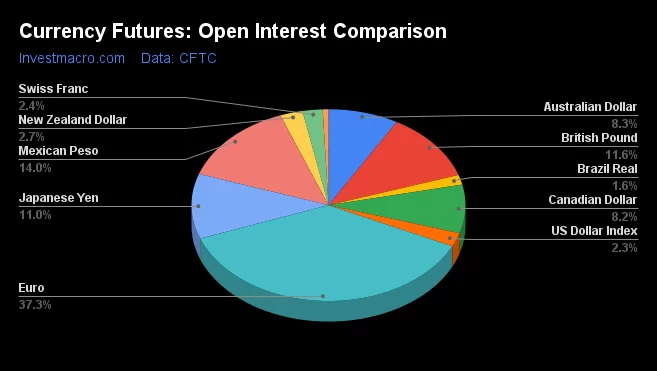
The latest COT data is updated through Tuesday December 13th and shows a quick view of how large market participants (for-profit speculators and commercial traders) were positioned in the futures markets. All currency positions are in direct relation to the US dollar where, for example, a bet for the euro is a bet that the euro will rise versus the dollar while a bet against the euro will be a bet that the euro will decline versus the dollar.
Weekly Speculator Changes led by Japanese Yen
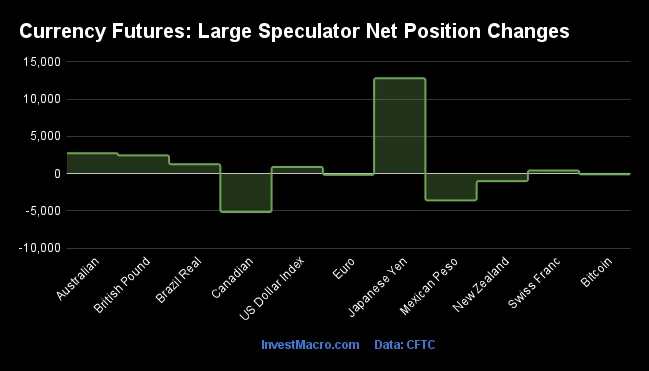
The COT currency market speculator bets were higher this week as six out of the eleven currency markets we cover had higher positioning while the other five markets had lower speculator contracts.
Leading the gains for the currency markets was the Japanese Yen (12,808 contracts) with the Australian Dollar (2,726 contracts), British Pound (2,454 contracts), Brazilian Real (1,261 contracts), US Dollar Index (892 contracts) and the Swiss Franc (419 contracts) also showing positive weeks.
The currencies seeing declines in speculator bets on the week were the Canadian Dollar (-5,158 contracts), Mexican Peso (-3,588 contracts), New Zealand Dollar (-1,008 contracts), EuroFX (-168 contracts) and Bitcoin (-107 contracts) also registering lower bets on the week.
Highlighting the COT currencies data this week is the improvement being seen in the Japanese yen speculator positioning. The large speculator bets for the Japanese yen have risen for two straight weeks and in six out of the past seven weeks. This improvement for the yen has taken the net position from a total of -102,618 contracts on October 25th to just a total of -53,188 contracts this week for a total reduction in the bearish position by +49,430 contracts. The yen speculator position is now at the least bearish level in the past fifteen weeks.
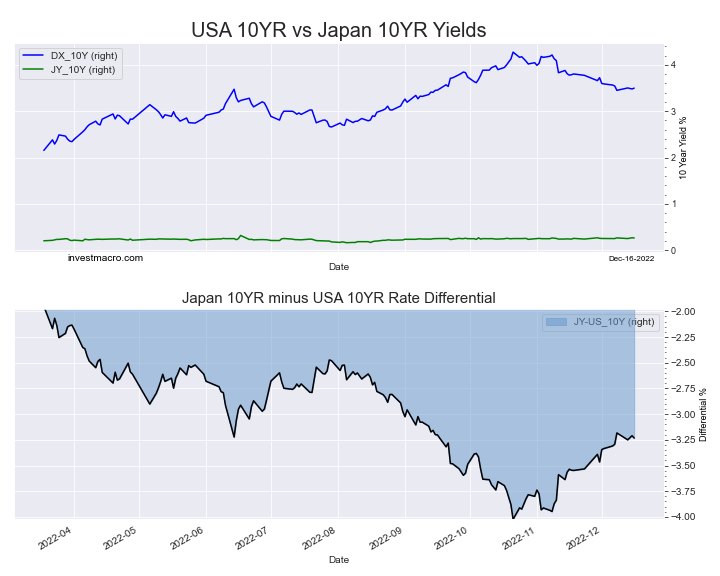
The yen exchange rate versus the dollar has been on the mend as well after falling to over a 30-year low in October at the 151.94 exchange rate. The yen has rallied by approximately 10 percent since the recent low and has been helped out by a decreasing interest rate differential between the US bonds and the Japanese bonds (see chart below). The yen could see further improvement if the USDJPY falls below the approaching the 200-day moving average.
| Dec-13-2022 | OI | OI-Index | Spec-Net | Spec-Index | Com-Net | COM-Index | Smalls-Net | Smalls-Index |
|---|
| USD Index | 48,069 | 63 | 25,778 | 68 | -28,482 | 31 | 2,704 | 46 |
| EUR | 772,800 | 100 | 124,715 | 73 | -157,377 | 31 | 32,662 | 31 |
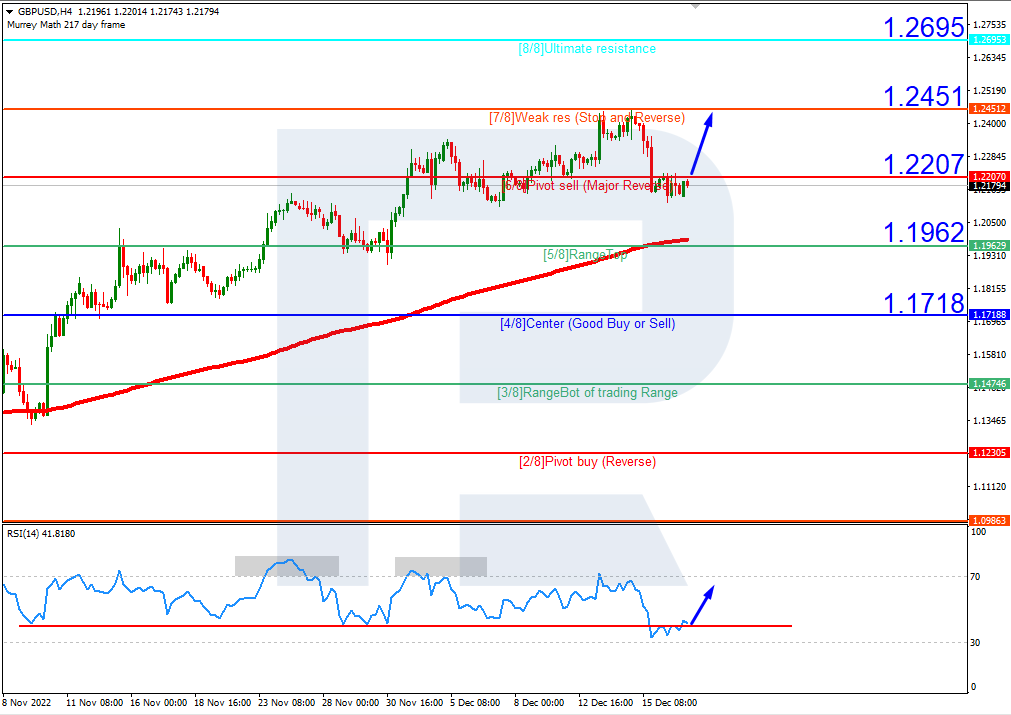
| GBP | 240,264 | 61 | -25,739 | 47 | 31,288 | 55 | -5,549 | 47 |
| JPY | 226,964 | 66 | -53,188 | 36 | 59,029 | 64 | -5,841 | 42 |
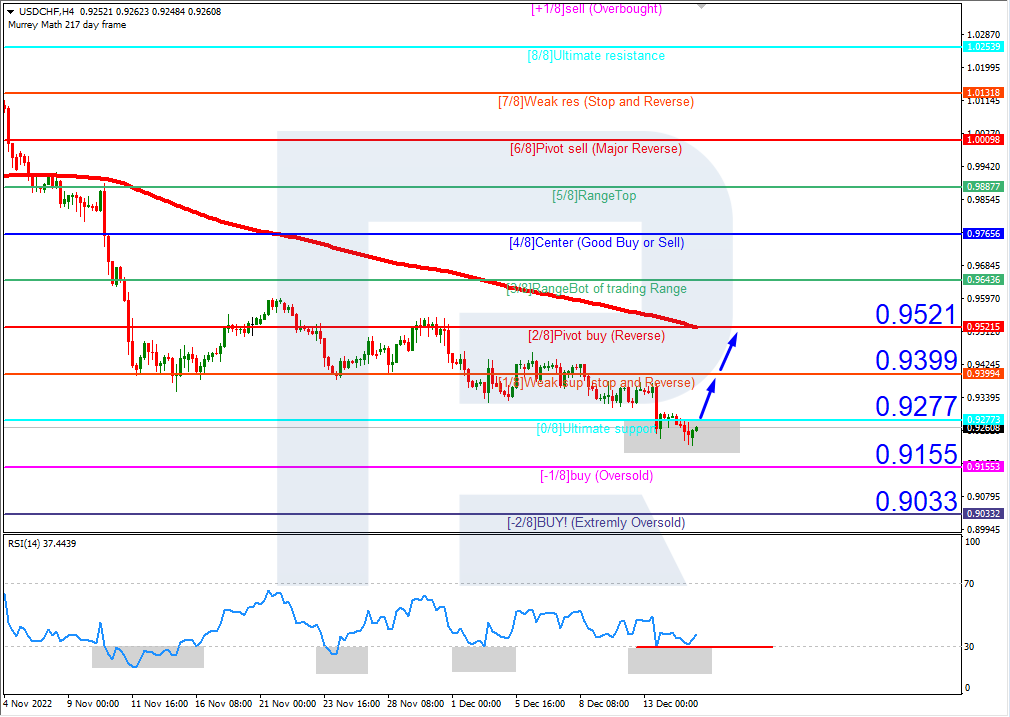
| CHF | 49,340 | 64 | -11,811 | 23 | 15,972 | 71 | -4,161 | 43 |
| CAD | 169,433 | 43 | -27,248 | 9 | 24,924 | 89 | 2,324 | 35 |
| AUD | 172,269 | 62 | -37,837 | 50 | 42,845 | 51 | -5,008 | 40 |
| NZD | 55,294 | 64 | -7,506 | 34 | 6,096 | 61 | 1,410 | 68 |
| MXN | 290,116 | 91 | 44,364 | 46 | -49,811 | 52 | 5,447 | 66 |
| RUB | 20,930 | 4 | 7,543 | 31 | -7,150 | 69 | -393 | 24 |
| BRL | 34,190 | 19 | 3,459 | 50 | -5,560 | 49 | 2,101 | 86 |
| Bitcoin | 13,989 | 71 | -40 | 76 | -409 | 0 | 449 | 23 |
Strength Scores led by Bitcoin & EuroFX
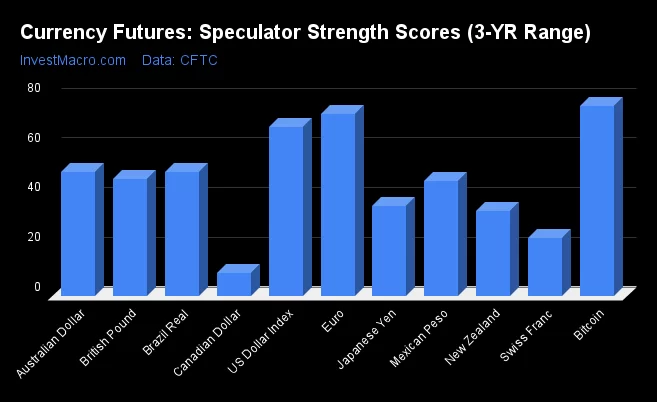
COT Strength Scores (a normalized measure of Speculator positions over a 3-Year range, from 0 to 100 where above 80 is Extreme-Bullish and below 20 is Extreme-Bearish) showed that Bitcoin (76 percent) and the EuroFX (73 percent) lead the currency markets this week. The US Dollar Index (68 percent), Australian Dollar (50 percent) and the Brazilian Real (50 percent) come in as the next highest in the weekly strength scores.
On the downside, the Canadian Dollar (9 percent) is at the lowest strength level currently and is in Extreme-Bearish territory (below 20 percent). The next lowest strength scores are the Swiss Franc (23 percent), New Zealand Dollar (34 percent) and the Japanese Yen (36 percent).
Strength Statistics:
US Dollar Index (67.9 percent) vs US Dollar Index previous week (66.4 percent)
EuroFX (73.3 percent) vs EuroFX previous week (73.3 percent)
British Pound Sterling (46.9 percent) vs British Pound Sterling previous week (44.8 percent)
Japanese Yen (36.1 percent) vs Japanese Yen previous week (28.2 percent)
Swiss Franc (23.4 percent) vs Swiss Franc previous week (22.3 percent)
Canadian Dollar (9.3 percent) vs Canadian Dollar previous week (15.5 percent)
Australian Dollar (49.8 percent) vs Australian Dollar previous week (47.2 percent)
New Zealand Dollar (34.1 percent) vs New Zealand Dollar previous week (36.8 percent)
Mexican Peso (46.3 percent) vs Mexican Peso previous week (47.8 percent)
Brazilian Real (49.6 percent) vs Brazilian Real previous week (48.3 percent)
Bitcoin (76.2 percent) vs Bitcoin previous week (78.1 percent)
British Pound & Japanese Yen top the 6-Week Strength Trends
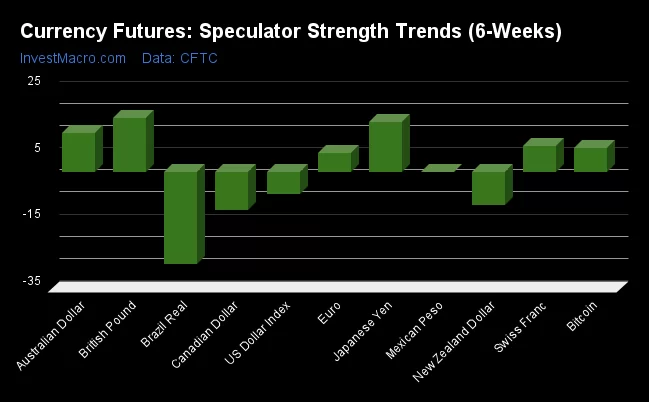
COT Strength Score Trends (or move index, calculates the 6-week changes in strength scores) showed that the British Pound (16 percent) and the Japanese Yen (15 percent) lead the past six weeks trends for the currencies. The Australian Dollar (12 percent), the Swiss Franc (8 percent) and the Bitcoin (7 percent) are the next highest positive movers in the latest trends data.
The Brazilian Real (-28 percent) leads the downside trend scores currently with the Canadian Dollar (-11 percent), New Zealand Dollar (-10 percent) and the US Dollar Index (-7 percent) following next with lower trend scores.
Strength Trend Statistics:
US Dollar Index (-6.7 percent) vs US Dollar Index previous week (-8.7 percent)
EuroFX (5.8 percent) vs EuroFX previous week (15.3 percent)
British Pound Sterling (16.4 percent) vs British Pound Sterling previous week (16.8 percent)
Japanese Yen (15.0 percent) vs Japanese Yen previous week (22.6 percent)
Swiss Franc (7.9 percent) vs Swiss Franc previous week (-2.5 percent)
Canadian Dollar (-11.5 percent) vs Canadian Dollar previous week (-4.7 percent)
Australian Dollar (11.8 percent) vs Australian Dollar previous week (10.1 percent)
New Zealand Dollar (-9.8 percent) vs New Zealand Dollar previous week (17.1 percent)
Mexican Peso (0.1 percent) vs Mexican Peso previous week (15.1 percent)
Brazilian Real (-27.5 percent) vs Brazilian Real previous week (-28.9 percent)
Bitcoin (7.2 percent) vs Bitcoin previous week (0.8 percent)
Individual COT Forex Markets:
US Dollar Index Futures:
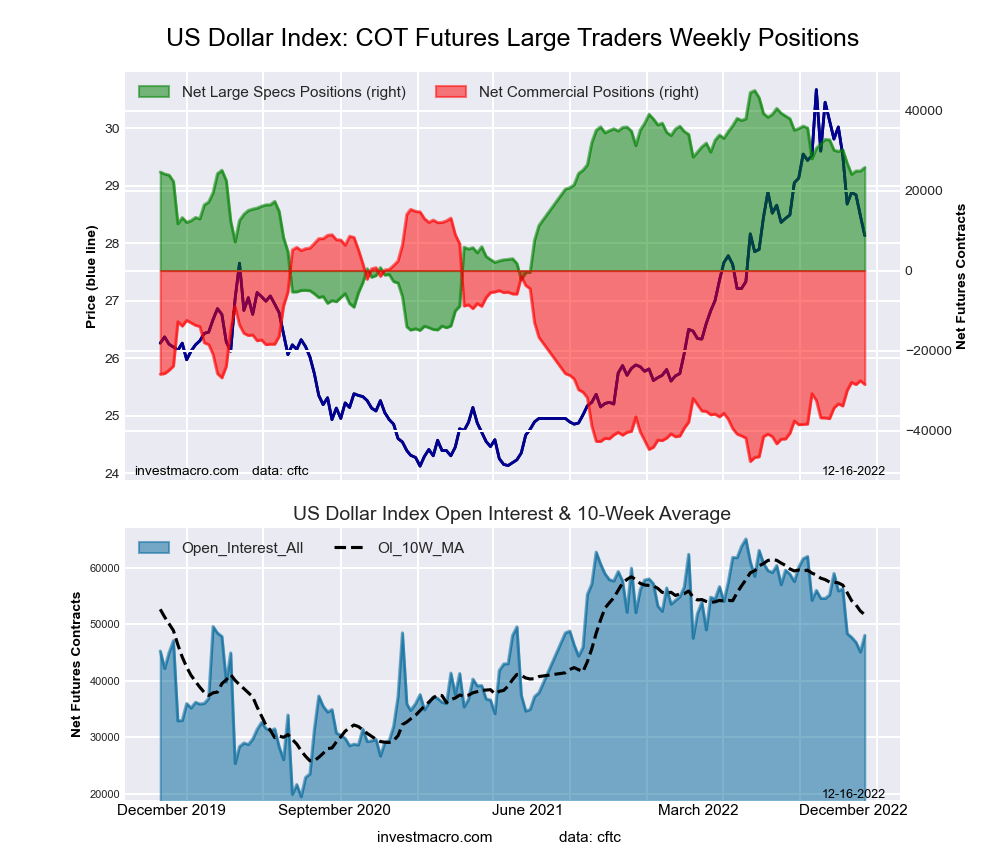 The US Dollar Index large speculator standing this week recorded a net position of 25,778 contracts in the data reported through Tuesday. This was a weekly lift of 892 contracts from the previous week which had a total of 24,886 net contracts.
This week’s current strength score (the trader positioning range over the past three years, measured from 0 to 100) shows the speculators are currently Bullish with a score of 67.9 percent. The commercials are Bearish with a score of 30.5 percent and the small traders (not shown in chart) are Bearish with a score of 46.1 percent.
| US DOLLAR INDEX Statistics | SPECULATORS | COMMERCIALS | SMALL TRADERS |
| – Percent of Open Interest Longs: | 80.6 | 2.6 | 12.0 |
| – Percent of Open Interest Shorts: | 27.0 | 61.8 | 6.4 |
| – Net Position: | 25,778 | -28,482 | 2,704 |
| – Gross Longs: | 38,766 | 1,245 | 5,782 |
| – Gross Shorts: | 12,988 | 29,727 | 3,078 |
| – Long to Short Ratio: | 3.0 to 1 | 0.0 to 1 | 1.9 to 1 |
| NET POSITION TREND: | | | |
| – Strength Index Score (3 Year Range Pct): | 67.9 | 30.5 | 46.1 |
| – Strength Index Reading (3 Year Range): | Bullish | Bearish | Bearish |
| NET POSITION MOVEMENT INDEX: | | | |
| – 6-Week Change in Strength Index: | -6.7 | 7.7 | -9.2 |
Euro Currency Futures:
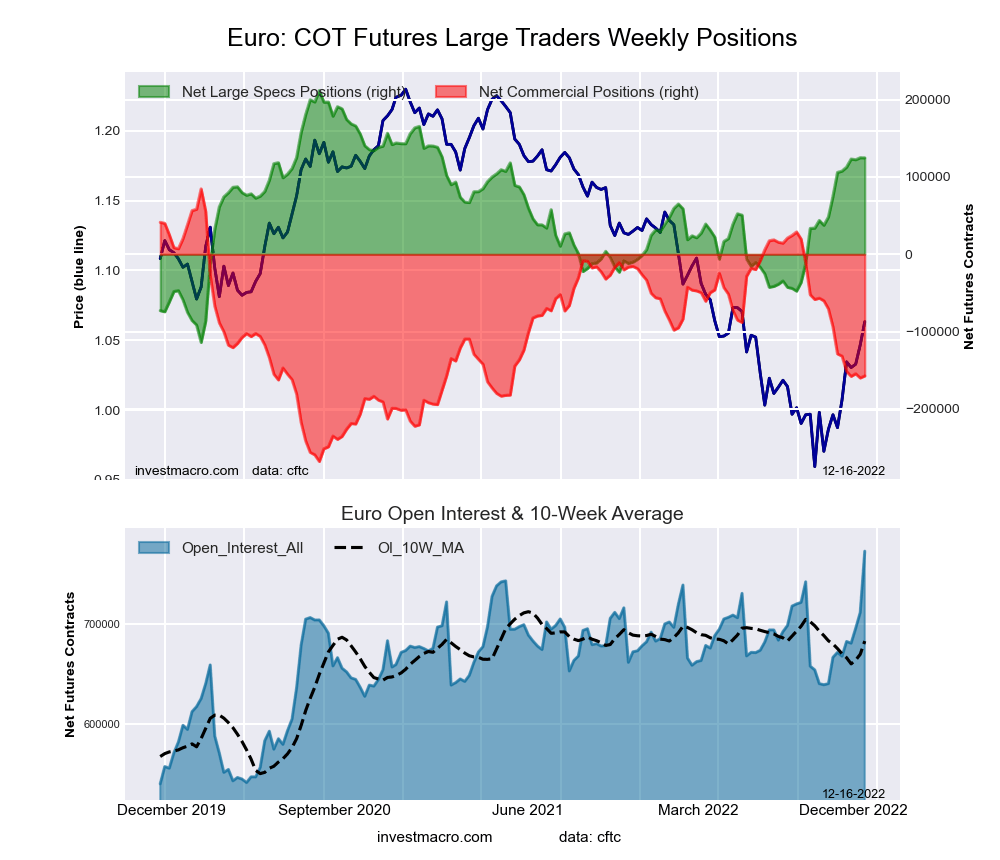 The Euro Currency large speculator standing this week recorded a net position of 124,715 contracts in the data reported through Tuesday. This was a weekly reduction of -168 contracts from the previous week which had a total of 124,883 net contracts.
This week’s current strength score (the trader positioning range over the past three years, measured from 0 to 100) shows the speculators are currently Bullish with a score of 73.3 percent. The commercials are Bearish with a score of 31.4 percent and the small traders (not shown in chart) are Bearish with a score of 31.1 percent.
| EURO Currency Statistics | SPECULATORS | COMMERCIALS | SMALL TRADERS |
| – Percent of Open Interest Longs: | 30.6 | 53.6 | 12.2 |
| – Percent of Open Interest Shorts: | 14.5 | 73.9 | 7.9 |
| – Net Position: | 124,715 | -157,377 | 32,662 |
| – Gross Longs: | 236,415 | 414,090 | 94,033 |
| – Gross Shorts: | 111,700 | 571,467 | 61,371 |
| – Long to Short Ratio: | 2.1 to 1 | 0.7 to 1 | 1.5 to 1 |
| NET POSITION TREND: | | | |
| – Strength Index Score (3 Year Range Pct): | 73.3 | 31.4 | 31.1 |
| – Strength Index Reading (3 Year Range): | Bullish | Bearish | Bearish |
| NET POSITION MOVEMENT INDEX: | | | |
| – 6-Week Change in Strength Index: | 5.8 | -8.1 | 15.4 |
British Pound Sterling Futures:
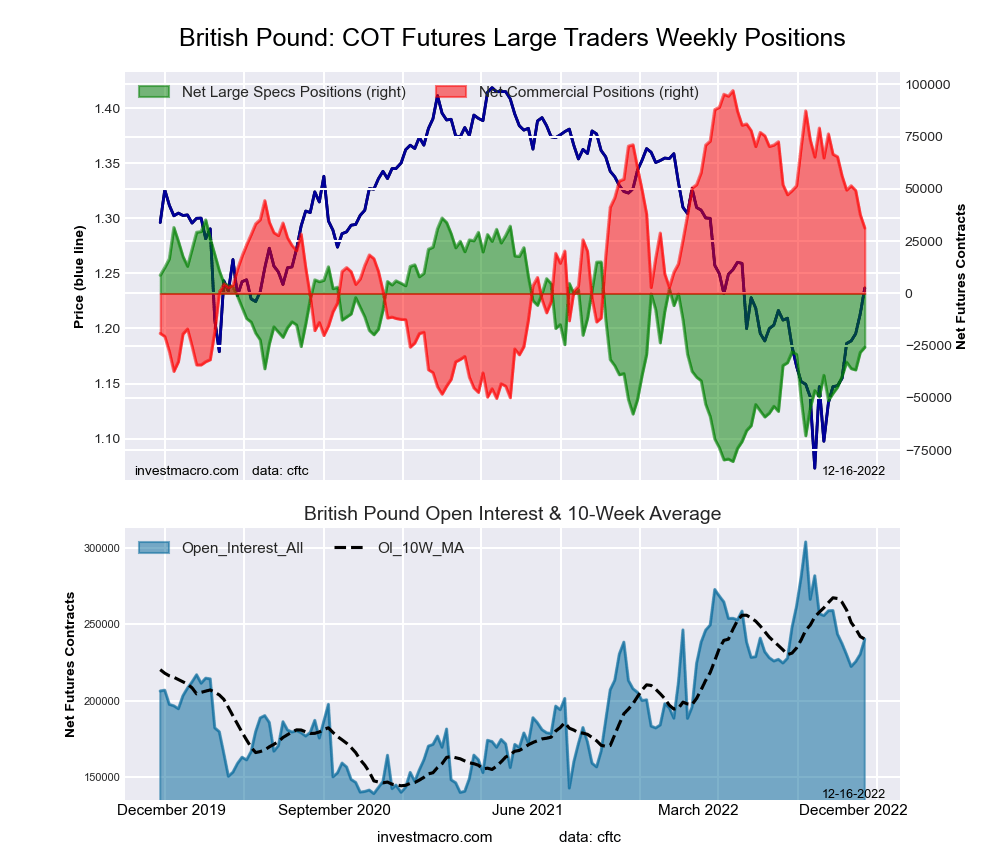 The British Pound Sterling large speculator standing this week recorded a net position of -25,739 contracts in the data reported through Tuesday. This was a weekly rise of 2,454 contracts from the previous week which had a total of -28,193 net contracts.
This week’s current strength score (the trader positioning range over the past three years, measured from 0 to 100) shows the speculators are currently Bearish with a score of 46.9 percent. The commercials are Bullish with a score of 55.3 percent and the small traders (not shown in chart) are Bearish with a score of 47.1 percent.
| BRITISH POUND Statistics | SPECULATORS | COMMERCIALS | SMALL TRADERS |
| – Percent of Open Interest Longs: | 13.3 | 66.0 | 10.6 |
| – Percent of Open Interest Shorts: | 24.0 | 53.0 | 12.9 |
| – Net Position: | -25,739 | 31,288 | -5,549 |
| – Gross Longs: | 32,008 | 158,686 | 25,472 |
| – Gross Shorts: | 57,747 | 127,398 | 31,021 |
| – Long to Short Ratio: | 0.6 to 1 | 1.2 to 1 | 0.8 to 1 |
| NET POSITION TREND: | | | |
| – Strength Index Score (3 Year Range Pct): | 46.9 | 55.3 | 47.1 |
| – Strength Index Reading (3 Year Range): | Bearish | Bullish | Bearish |
| NET POSITION MOVEMENT INDEX: | | | |
| – 6-Week Change in Strength Index: | 16.4 | -23.2 | 29.4 |
Japanese Yen Futures:
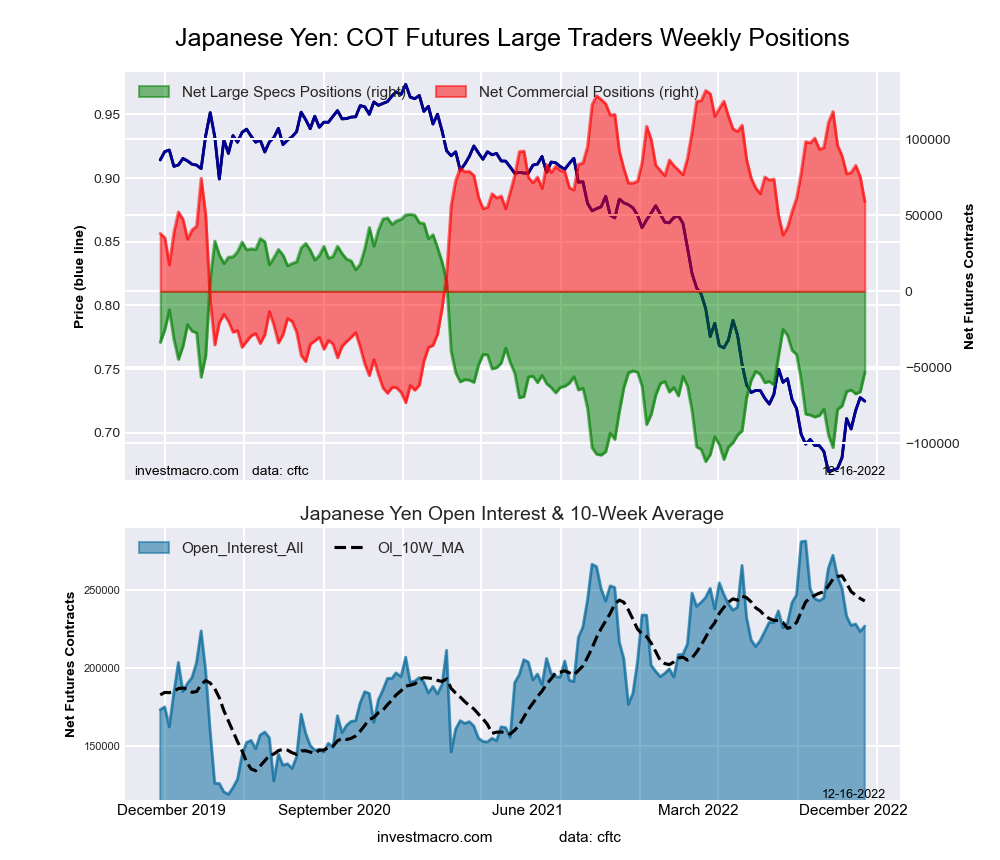 The Japanese Yen large speculator standing this week recorded a net position of -53,188 contracts in the data reported through Tuesday. This was a weekly gain of 12,808 contracts from the previous week which had a total of -65,996 net contracts.
This week’s current strength score (the trader positioning range over the past three years, measured from 0 to 100) shows the speculators are currently Bearish with a score of 36.1 percent. The commercials are Bullish with a score of 64.5 percent and the small traders (not shown in chart) are Bearish with a score of 41.6 percent.
| JAPANESE YEN Statistics | SPECULATORS | COMMERCIALS | SMALL TRADERS |
| – Percent of Open Interest Longs: | 9.8 | 69.2 | 11.7 |
| – Percent of Open Interest Shorts: | 33.3 | 43.2 | 14.3 |
| – Net Position: | -53,188 | 59,029 | -5,841 |
| – Gross Longs: | 22,290 | 157,021 | 26,668 |
| – Gross Shorts: | 75,478 | 97,992 | 32,509 |
| – Long to Short Ratio: | 0.3 to 1 | 1.6 to 1 | 0.8 to 1 |
| NET POSITION TREND: | | | |
| – Strength Index Score (3 Year Range Pct): | 36.1 | 64.5 | 41.6 |
| – Strength Index Reading (3 Year Range): | Bearish | Bullish | Bearish |
| NET POSITION MOVEMENT INDEX: | | | |
| – 6-Week Change in Strength Index: | 15.0 | -17.9 | 25.0 |
Swiss Franc Futures:
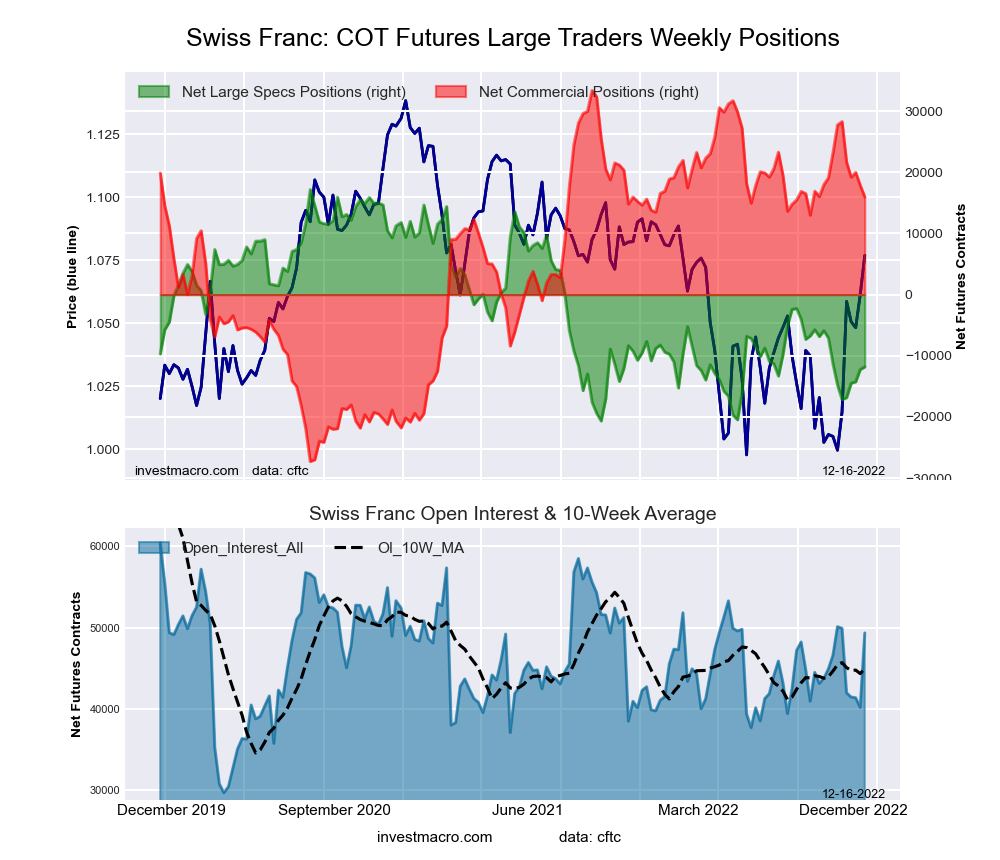 The Swiss Franc large speculator standing this week recorded a net position of -11,811 contracts in the data reported through Tuesday. This was a weekly gain of 419 contracts from the previous week which had a total of -12,230 net contracts.
This week’s current strength score (the trader positioning range over the past three years, measured from 0 to 100) shows the speculators are currently Bearish with a score of 23.4 percent. The commercials are Bullish with a score of 71.3 percent and the small traders (not shown in chart) are Bearish with a score of 43.4 percent.
| SWISS FRANC Statistics | SPECULATORS | COMMERCIALS | SMALL TRADERS |
| – Percent of Open Interest Longs: | 4.2 | 68.9 | 21.5 |
| – Percent of Open Interest Shorts: | 28.2 | 36.6 | 29.9 |
| – Net Position: | -11,811 | 15,972 | -4,161 |
| – Gross Longs: | 2,081 | 34,016 | 10,597 |
| – Gross Shorts: | 13,892 | 18,044 | 14,758 |
| – Long to Short Ratio: | 0.1 to 1 | 1.9 to 1 | 0.7 to 1 |
| NET POSITION TREND: | | | |
| – Strength Index Score (3 Year Range Pct): | 23.4 | 71.3 | 43.4 |
| – Strength Index Reading (3 Year Range): | Bearish | Bullish | Bearish |
| NET POSITION MOVEMENT INDEX: | | | |
| – 6-Week Change in Strength Index: | 7.9 | -19.4 | 29.7 |
Canadian Dollar Futures:
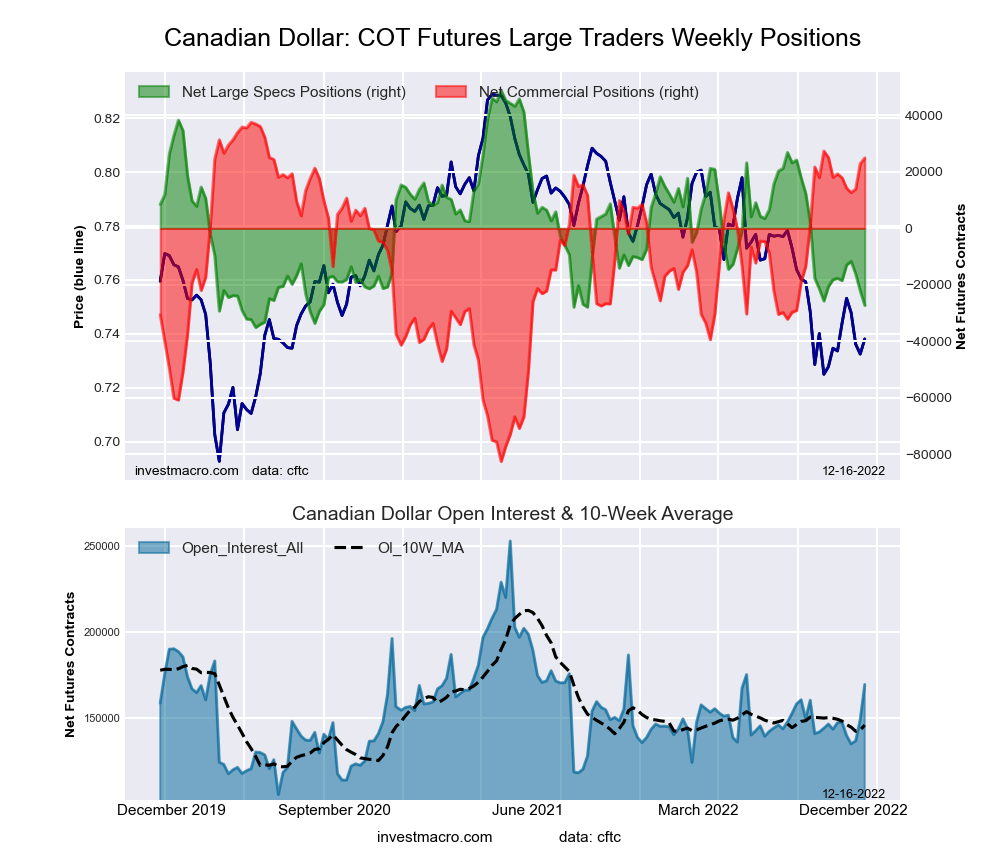 The Canadian Dollar large speculator standing this week recorded a net position of -27,248 contracts in the data reported through Tuesday. This was a weekly lowering of -5,158 contracts from the previous week which had a total of -22,090 net contracts.
This week’s current strength score (the trader positioning range over the past three years, measured from 0 to 100) shows the speculators are currently Bearish-Extreme with a score of 9.3 percent. The commercials are Bullish-Extreme with a score of 89.5 percent and the small traders (not shown in chart) are Bearish with a score of 34.8 percent.
| CANADIAN DOLLAR Statistics | SPECULATORS | COMMERCIALS | SMALL TRADERS |
| – Percent of Open Interest Longs: | 18.7 | 51.6 | 18.9 |
| – Percent of Open Interest Shorts: | 34.8 | 36.9 | 17.6 |
| – Net Position: | -27,248 | 24,924 | 2,324 |
| – Gross Longs: | 31,720 | 87,471 | 32,089 |
| – Gross Shorts: | 58,968 | 62,547 | 29,765 |
| – Long to Short Ratio: | 0.5 to 1 | 1.4 to 1 | 1.1 to 1 |
| NET POSITION TREND: | | | |
| – Strength Index Score (3 Year Range Pct): | 9.3 | 89.5 | 34.8 |
| – Strength Index Reading (3 Year Range): | Bearish-Extreme | Bullish-Extreme | Bearish |
| NET POSITION MOVEMENT INDEX: | | | |
| – 6-Week Change in Strength Index: | -11.5 | 4.7 | 7.9 |
Australian Dollar Futures:
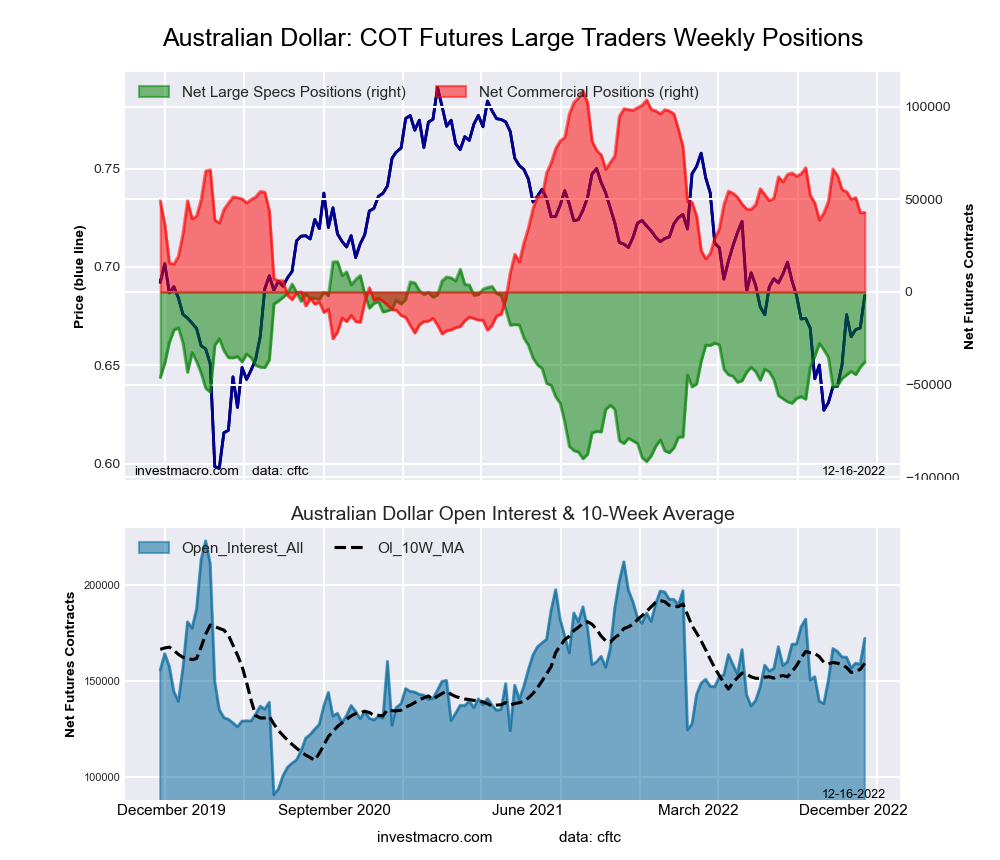 The Australian Dollar large speculator standing this week recorded a net position of -37,837 contracts in the data reported through Tuesday. This was a weekly advance of 2,726 contracts from the previous week which had a total of -40,563 net contracts.
This week’s current strength score (the trader positioning range over the past three years, measured from 0 to 100) shows the speculators are currently Bearish with a score of 49.8 percent. The commercials are Bullish with a score of 50.8 percent and the small traders (not shown in chart) are Bearish with a score of 40.2 percent.
| AUSTRALIAN DOLLAR Statistics | SPECULATORS | COMMERCIALS | SMALL TRADERS |
| – Percent of Open Interest Longs: | 20.8 | 61.2 | 10.1 |
| – Percent of Open Interest Shorts: | 42.8 | 36.4 | 13.0 |
| – Net Position: | -37,837 | 42,845 | -5,008 |
| – Gross Longs: | 35,825 | 105,480 | 17,339 |
| – Gross Shorts: | 73,662 | 62,635 | 22,347 |
| – Long to Short Ratio: | 0.5 to 1 | 1.7 to 1 | 0.8 to 1 |
| NET POSITION TREND: | | | |
| – Strength Index Score (3 Year Range Pct): | 49.8 | 50.8 | 40.2 |
| – Strength Index Reading (3 Year Range): | Bearish | Bullish | Bearish |
| NET POSITION MOVEMENT INDEX: | | | |
| – 6-Week Change in Strength Index: | 11.8 | -14.8 | 17.5 |
New Zealand Dollar Futures:
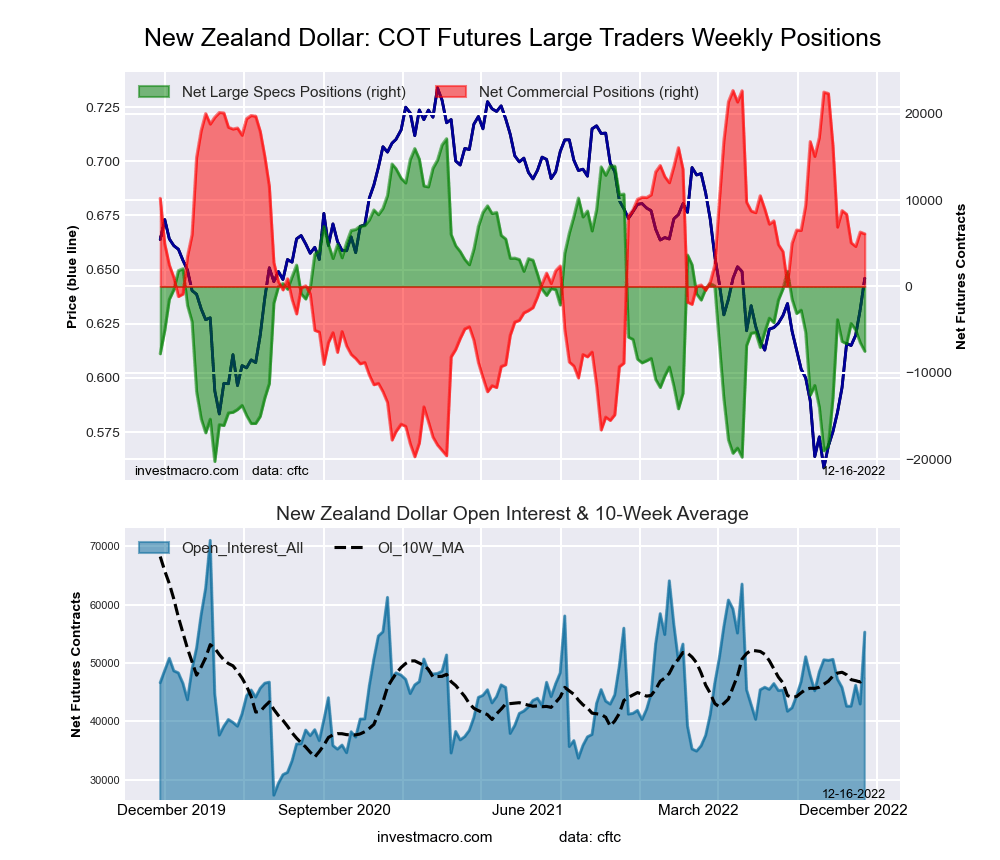 The New Zealand Dollar large speculator standing this week recorded a net position of -7,506 contracts in the data reported through Tuesday. This was a weekly decrease of -1,008 contracts from the previous week which had a total of -6,498 net contracts.
This week’s current strength score (the trader positioning range over the past three years, measured from 0 to 100) shows the speculators are currently Bearish with a score of 34.1 percent. The commercials are Bullish with a score of 60.9 percent and the small traders (not shown in chart) are Bullish with a score of 67.9 percent.
| NEW ZEALAND DOLLAR Statistics | SPECULATORS | COMMERCIALS | SMALL TRADERS |
| – Percent of Open Interest Longs: | 35.6 | 52.1 | 9.6 |
| – Percent of Open Interest Shorts: | 49.2 | 41.0 | 7.0 |
| – Net Position: | -7,506 | 6,096 | 1,410 |
| – Gross Longs: | 19,700 | 28,793 | 5,297 |
| – Gross Shorts: | 27,206 | 22,697 | 3,887 |
| – Long to Short Ratio: | 0.7 to 1 | 1.3 to 1 | 1.4 to 1 |
| NET POSITION TREND: | | | |
| – Strength Index Score (3 Year Range Pct): | 34.1 | 60.9 | 67.9 |
| – Strength Index Reading (3 Year Range): | Bearish | Bullish | Bullish |
| NET POSITION MOVEMENT INDEX: | | | |
| – 6-Week Change in Strength Index: | -9.8 | -1.9 | 51.1 |
Mexican Peso Futures:
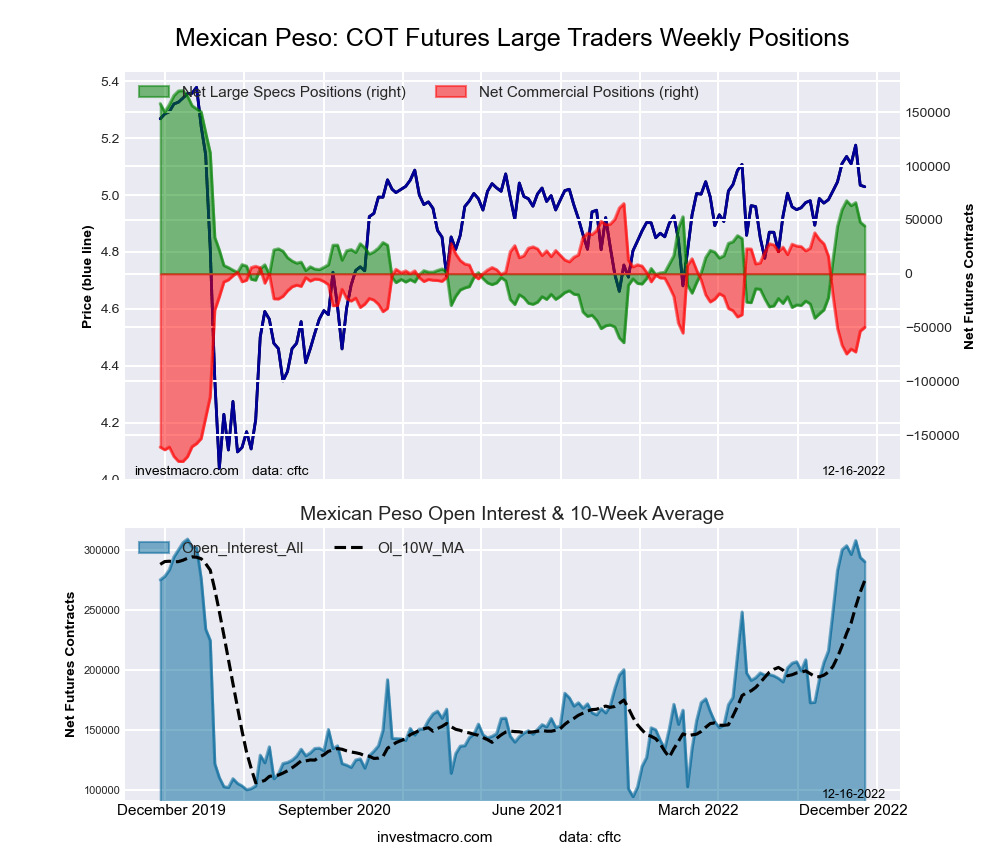 The Mexican Peso large speculator standing this week recorded a net position of 44,364 contracts in the data reported through Tuesday. This was a weekly lowering of -3,588 contracts from the previous week which had a total of 47,952 net contracts.
This week’s current strength score (the trader positioning range over the past three years, measured from 0 to 100) shows the speculators are currently Bearish with a score of 46.3 percent. The commercials are Bullish with a score of 52.0 percent and the small traders (not shown in chart) are Bullish with a score of 66.1 percent.
| MEXICAN PESO Statistics | SPECULATORS | COMMERCIALS | SMALL TRADERS |
| – Percent of Open Interest Longs: | 58.1 | 36.8 | 2.7 |
| – Percent of Open Interest Shorts: | 42.8 | 53.9 | 0.9 |
| – Net Position: | 44,364 | -49,811 | 5,447 |
| – Gross Longs: | 168,481 | 106,698 | 7,935 |
| – Gross Shorts: | 124,117 | 156,509 | 2,488 |
| – Long to Short Ratio: | 1.4 to 1 | 0.7 to 1 | 3.2 to 1 |
| NET POSITION TREND: | | | |
| – Strength Index Score (3 Year Range Pct): | 46.3 | 52.0 | 66.1 |
| – Strength Index Reading (3 Year Range): | Bearish | Bullish | Bullish |
| NET POSITION MOVEMENT INDEX: | | | |
| – 6-Week Change in Strength Index: | 0.1 | 0.3 | -4.3 |
Brazilian Real Futures:
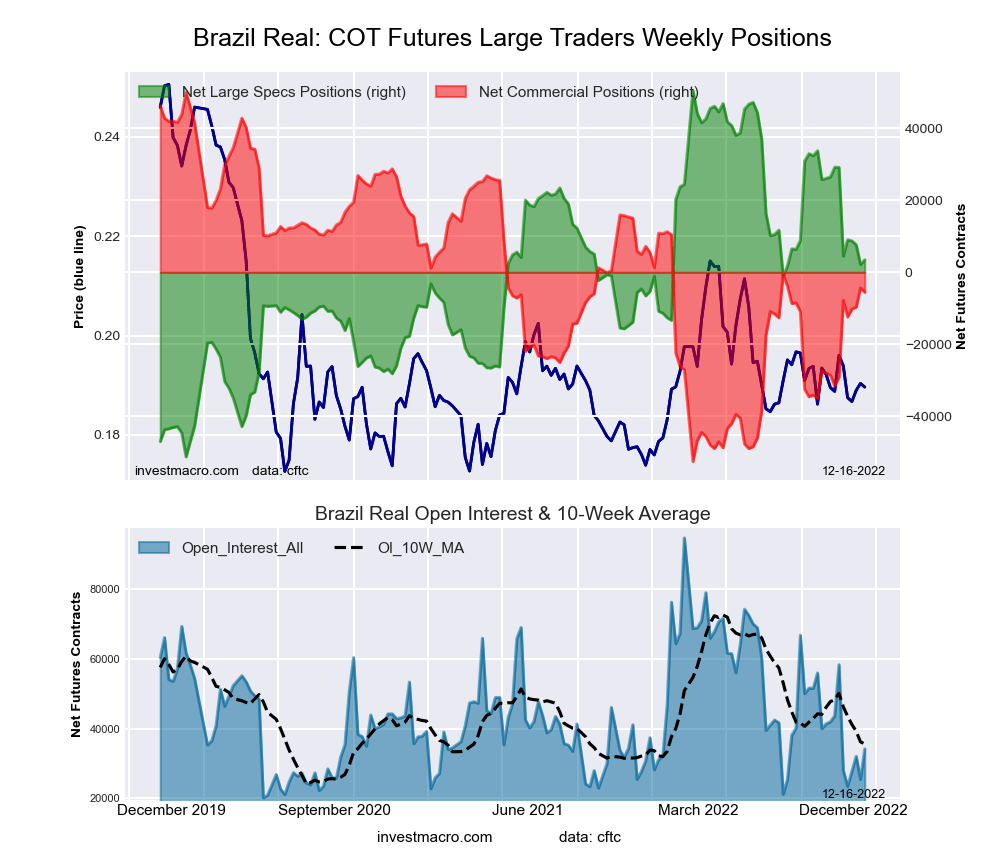 The Brazilian Real large speculator standing this week recorded a net position of 3,459 contracts in the data reported through Tuesday. This was a weekly gain of 1,261 contracts from the previous week which had a total of 2,198 net contracts.
This week’s current strength score (the trader positioning range over the past three years, measured from 0 to 100) shows the speculators are currently Bearish with a score of 49.6 percent. The commercials are Bearish with a score of 49.3 percent and the small traders (not shown in chart) are Bullish-Extreme with a score of 85.6 percent.
| BRAZIL REAL Statistics | SPECULATORS | COMMERCIALS | SMALL TRADERS |
| – Percent of Open Interest Longs: | 67.7 | 22.2 | 10.1 |
| – Percent of Open Interest Shorts: | 57.6 | 38.4 | 4.0 |
| – Net Position: | 3,459 | -5,560 | 2,101 |
| – Gross Longs: | 23,161 | 7,574 | 3,455 |
| – Gross Shorts: | 19,702 | 13,134 | 1,354 |
| – Long to Short Ratio: | 1.2 to 1 | 0.6 to 1 | 2.6 to 1 |
| NET POSITION TREND: | | | |
| – Strength Index Score (3 Year Range Pct): | 49.6 | 49.3 | 85.6 |
| – Strength Index Reading (3 Year Range): | Bearish | Bearish | Bullish-Extreme |
| NET POSITION MOVEMENT INDEX: | | | |
| – 6-Week Change in Strength Index: | -27.5 | 24.7 | 23.8 |
Bitcoin Futures:
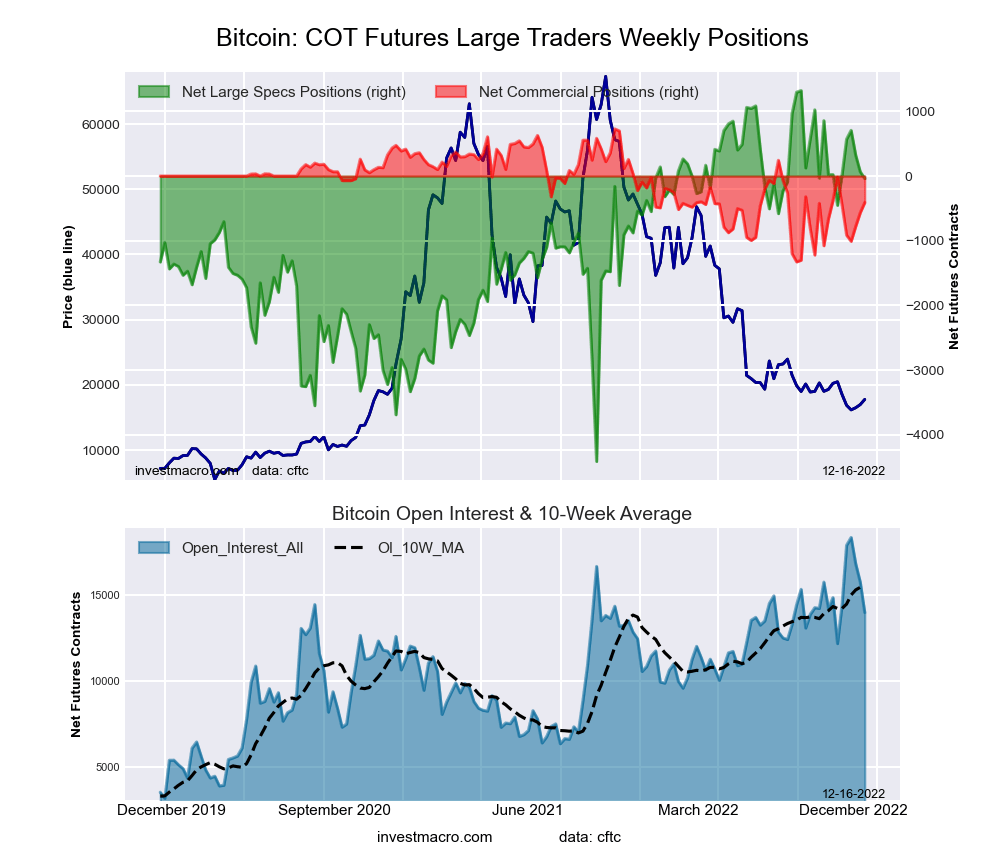 The Bitcoin large speculator standing this week recorded a net position of -40 contracts in the data reported through Tuesday. This was a weekly decline of -107 contracts from the previous week which had a total of 67 net contracts.
This week’s current strength score (the trader positioning range over the past three years, measured from 0 to 100) shows the speculators are currently Bullish with a score of 76.2 percent. The commercials are Bearish with a score of 44.6 percent and the small traders (not shown in chart) are Bearish with a score of 23.1 percent.
| BITCOIN Statistics | SPECULATORS | COMMERCIALS | SMALL TRADERS |
| – Percent of Open Interest Longs: | 76.2 | 2.9 | 9.5 |
| – Percent of Open Interest Shorts: | 76.5 | 5.8 | 6.3 |
| – Net Position: | -40 | -409 | 449 |
| – Gross Longs: | 10,666 | 403 | 1,329 |
| – Gross Shorts: | 10,706 | 812 | 880 |
| – Long to Short Ratio: | 1.0 to 1 | 0.5 to 1 | 1.5 to 1 |
| NET POSITION TREND: | | | |
| – Strength Index Score (3 Year Range Pct): | 76.2 | 44.6 | 23.1 |
| – Strength Index Reading (3 Year Range): | Bullish | Bearish | Bearish |
| NET POSITION MOVEMENT INDEX: | | | |
| – 6-Week Change in Strength Index: | 7.2 | -19.1 | -0.4 |
Article By InvestMacro – Receive our weekly COT Newsletter
*COT Report: The COT data, released weekly to the public each Friday, is updated through the most recent Tuesday (data is 3 days old) and shows a quick view of how large speculators or non-commercials (for-profit traders) were positioned in the futures markets.
The CFTC categorizes trader positions according to commercial hedgers (traders who use futures contracts for hedging as part of the business), non-commercials (large traders who speculate to realize trading profits) and nonreportable traders (usually small traders/speculators) as well as their open interest (contracts open in the market at time of reporting). See CFTC criteria here.


