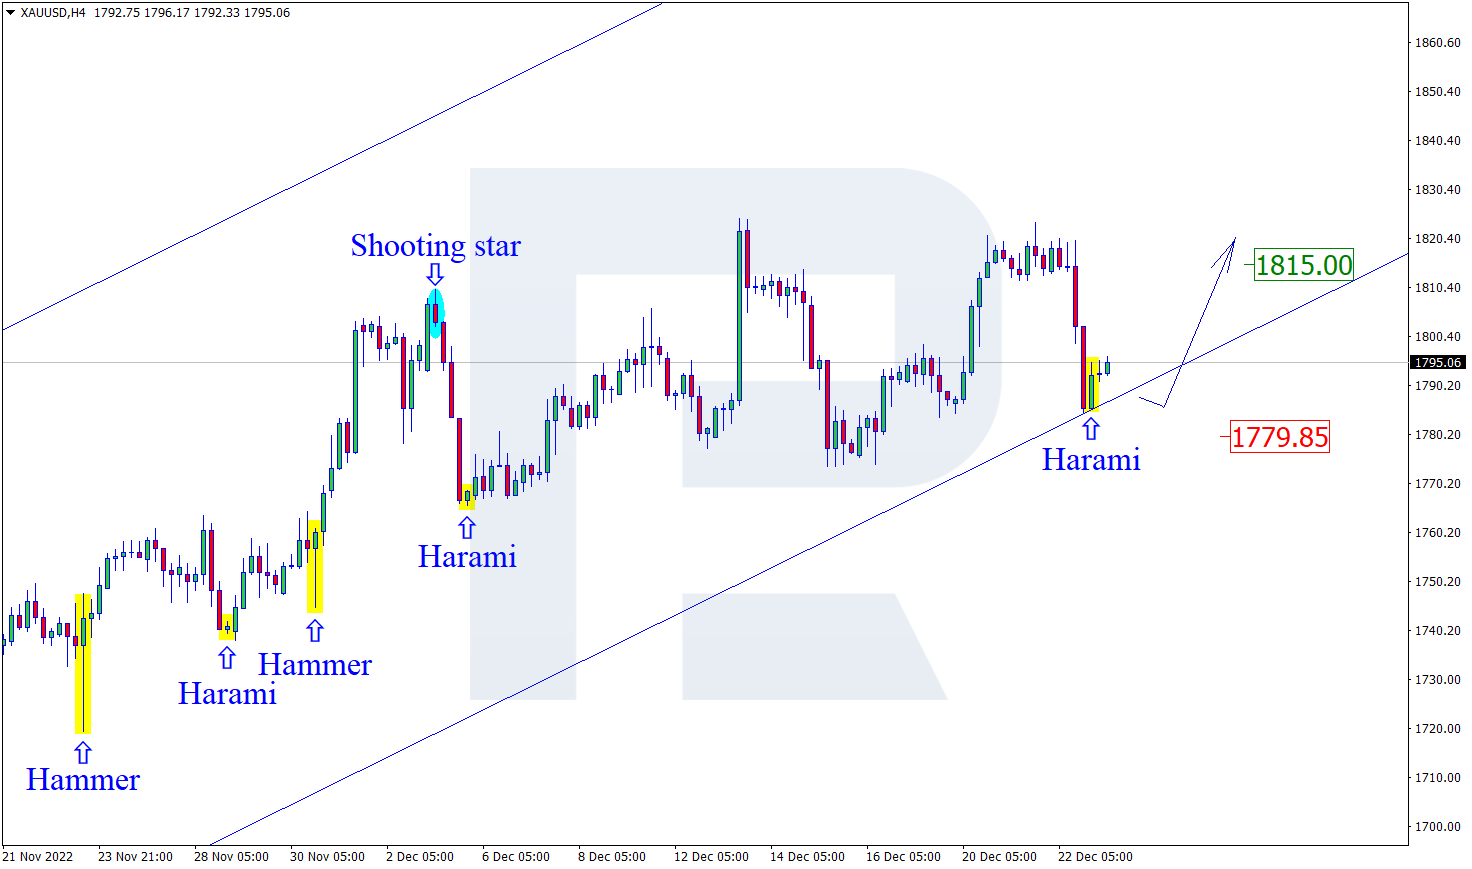
At the support level, gold has formed a Harami reversal pattern. Currently, the pair is going by the pattern in an ascending wave. The goal of the growth might be 1815.00. Upon testing the resistance level, the pair will get the chance to break through it and continue the uptrend. However, the quotes may pull back to 1779.85 before further growth.
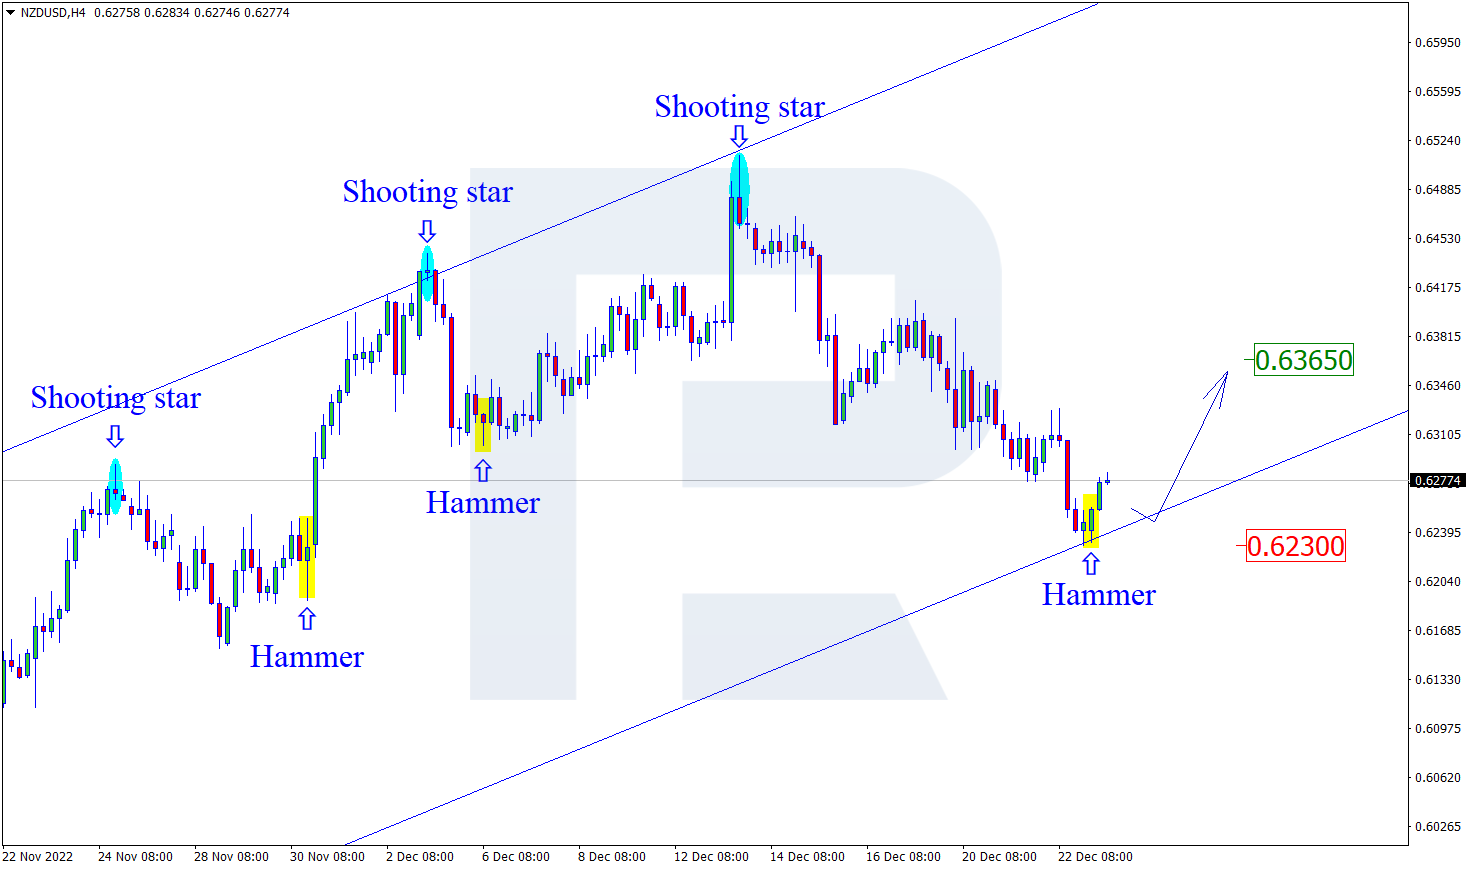
NZDUSD, “New Zealand Dollar vs US Dollar”
On H4, at the support level, the pair has formed a Hammer reversal pattern. Currently, the pair is going by the signal in an ascending wave. The goal of the growth might be 0.6365. After the resistance level is broken away, the quotes will get a chance to continue the downtrend. However, the price may pull back to 0.6230 before continuing growth.
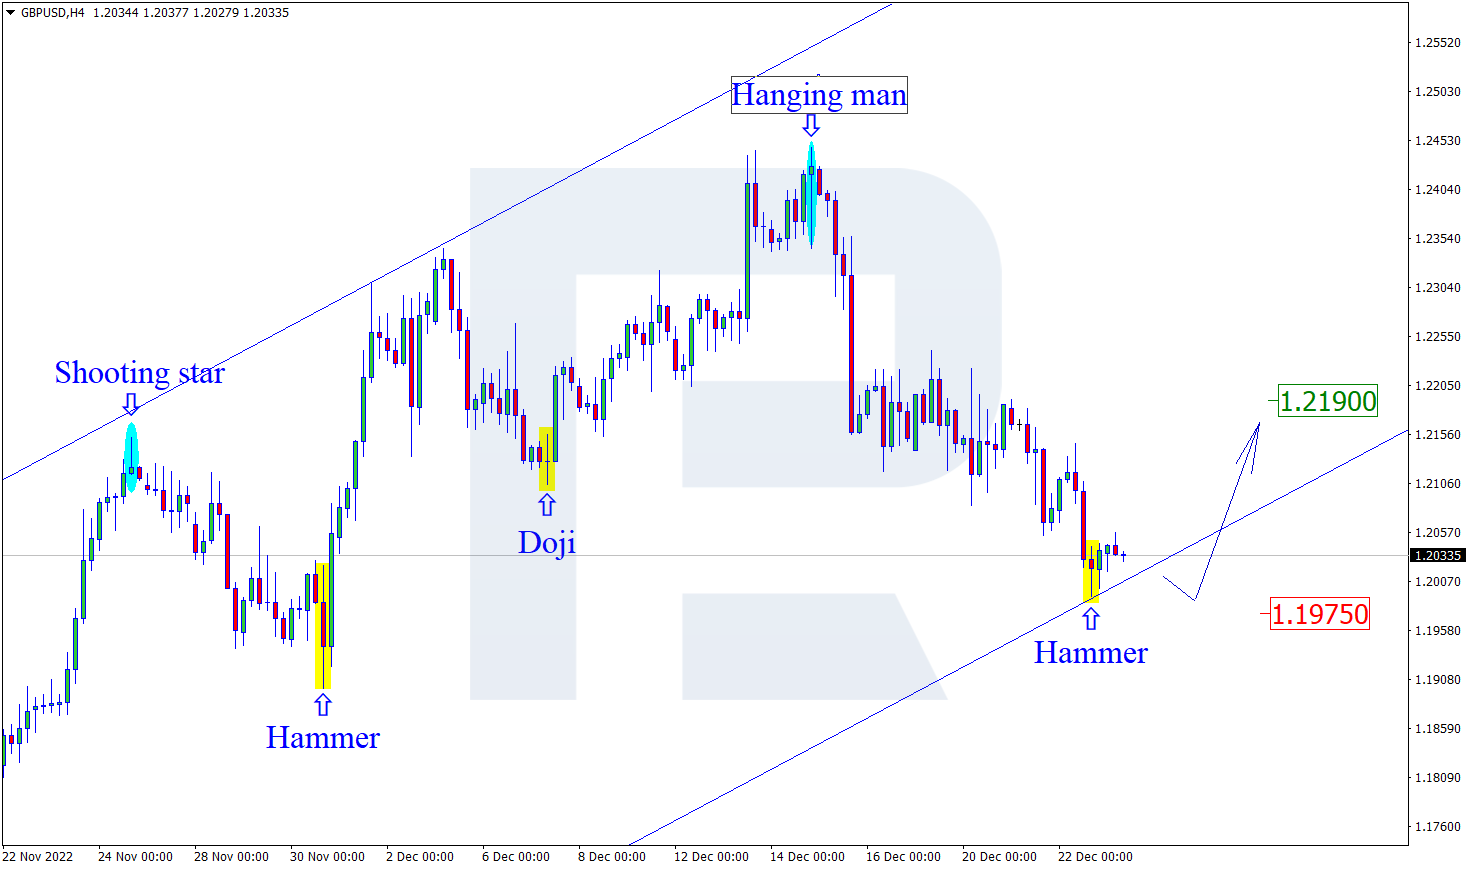
GBPUSD, “Great Britain Pound vs US Dollar”
On H4, at the support level, the pair has formed a Hammer reversal pattern. Currently, the pair is going by the signal in an ascending wave. The goal if the growth might be the resistance level at 1.2190. However, the price may pull back to 1.1975 before continuing with the uptrend.
Attention! Forecasts presented in this section only reflect the author’s private opinion and should not be considered as guidance for trading. RoboForex LP bears no responsibility for trading results based on trading recommendations described in these analytical reviews.
Yesterday, US GDP data showed that the US economy increased by 3.2%, higher than the expected 2.9%. This brought back some investor fears about an interest rate hike. The important indicator today will come from the major PCE prices, where a rise in the numbers could put some hawkish pressure back on the markets, causing the dollar index to rise again (EUR/USD to fall). Low liquidity over the holiday period could lead to stronger moves if economic data is significantly different from estimates.
Trading recommendations
Support levels: : 1.0549, 1.0483, 1.0361, 1.0332, 1.0284, 1.0193
Resistance levels: 1.0632, 1.0647, 1.0695
The trend on the EUR/USD currency pair on the hourly time frame is bullish. The price is forming a price corridor. The MACD indicator has become negative, and sellers’ pressure prevails throughout the day. Under such market conditions, buy trades are best considered from the support level of 1.0549 but with additional confirmation. Sell deals can be considered from the resistance level of 1.0632, but it is better with a confirmation in the form of a reverse initiative or false breakout because the level has already been tested.
Alternative scenario: if the price breaks down through the support level of 1.0446 and fixes below it, the downtrend will likely resume.
News feed for 2022.12.23:
– US Core Durable Goods Orders (m/m) at 15:30 (GMT+2);
– US PCE Price index (m/m) at 15:30 (GMT+2);
– US Michigan Consumer Sentiment (m/m) at 17:00 (GMT+2);
– US New Home Sales (m/m) at 17:00 (GMT+2).
The GBP/USD currency pair
Technical indicators of the currency pair:
Prev Open: 1.2074
Prev Close: 1.2039
% chg. over the last day: -0.29 %
In UK GDP revised downward, the actual value is 0.3%. Most services sub sectors showed a slowdown, but output rose by 0.1% in Q3 2022. With the dollar index rising, GBP/USD quotes have declined, and this trend could continue if PCE data today does not point to a slowdown, which could trigger a drop in the dollar index and a rise in GBP/USD quotes.
From the technical point of view, the trend on the GBP/USD currency pair on the hourly time frame is bullish. Yesterday, the price tested the priority change level but failed to consolidate higher. A false breakdown area was formed. The MACD indicator has become inactive, and the volatility on the threshold of the holidays is low. Under such market conditions, it is better to look for buy trades from the support level at 1.2092 but with a confirmation at the intraday time frames. Sell trades are best sought from the resistance level of 1.2218 but also better with confirmation.
Alternative scenario: if the price breaks down from the 1.2092 support level and fixes below it, the downtrend will likely resume.
There is no news feed for today.
The USD/JPY currency pair
Technical indicators of the currency pair:
Prev Open: 132.40
Prev Close: 132.36
% chg. over the last day: -0.03 %
The Bank of Japan surprised investors this week with a change in its Yield Curve Control Policy (YCC). This caused a moderate sell-off in Japanese bonds: the yield on Japan’s 10-year government bonds (JGBs) rose 15 basis points. And this is still having an effect on financial markets and the Japanese yen in particular. New inflation data showed that consumer prices (excluding food energy prices) rose from 3.6% to 3.7% on an annualized basis, the highest level since 1981.
From the technical point of view, the medium-term trend on the currency pair USD/JPY is bearish. The MACD indicator has become inactive, and a narrow price range in the form of a “wedge” pattern is being formed. During the day, there is a slight buyers’ pressure. Buy trades are best considered on intraday time frames from the support level of 132.16, but only with confirmation. Sell deals can be looked for from the resistance level of 133.53, provided there is a reverse reaction.
Alternative scenario: If the price fixes above 137.00, the uptrend will likely resume.
News feed for 2022.12.23:
– Japan National Core CPI (m/m) at 01:30 (GMT+2);
– Japan Monetary Policy Meeting Minutes at 01:50 (GMT+2).
The USD/CAD currency pair
Technical indicators of the currency pair:
Prev Open: 1.3606
Prev Close: 1.3645
% chg. over the last day: +0.28 %
The Canadian dollar is a commodity currency and is highly dependent not only on the monetary policy of the Bank of Canada but also on oil prices. The oil prices decreased yesterday while the dollar index went up, which eventually led to the growth of the USD/CAD. China reiterated its focus on boosting economic growth in 2023, which helped revise the impact of demand for crude oil upwards. Increased demand for oil with limited supply is helping oil prices and the Canadian dollar to strengthen.
Trading recommendations
Support levels: 1.3590, 1.3521, 1.3438, 1.3386, 1.3360, 1.3281, 1.3212
Resistance levels: 1.3656, 1.3700, 1.3776, 1.3855
From the point of view of technical analysis, the trend on the USD/CAD currency pair has changed to bullish. The MACD indicator is in the positive zone, but inside the day, there is a weakness of the buyers. Yesterday, the price made a false breakout of the level 1.3656 resistance level, which will now serve as a sell zone. Buy trades should be considered from the support of 1.3590 but with a confirmation in the form of a reversal. Sell deals are best to look for on intraday time frames from the resistance level of 1.3656, but with confirmation in the form of a reverse initiative on the lower time frames.
Alternative scenario: if the price breaks down and consolidates below the support level of 1.3386, the downtrend will likely resume.
This article reflects a personal opinion and should not be interpreted as an investment advice, and/or offer, and/or a persistent request for carrying out financial transactions, and/or a guarantee, and/or a forecast of future events.
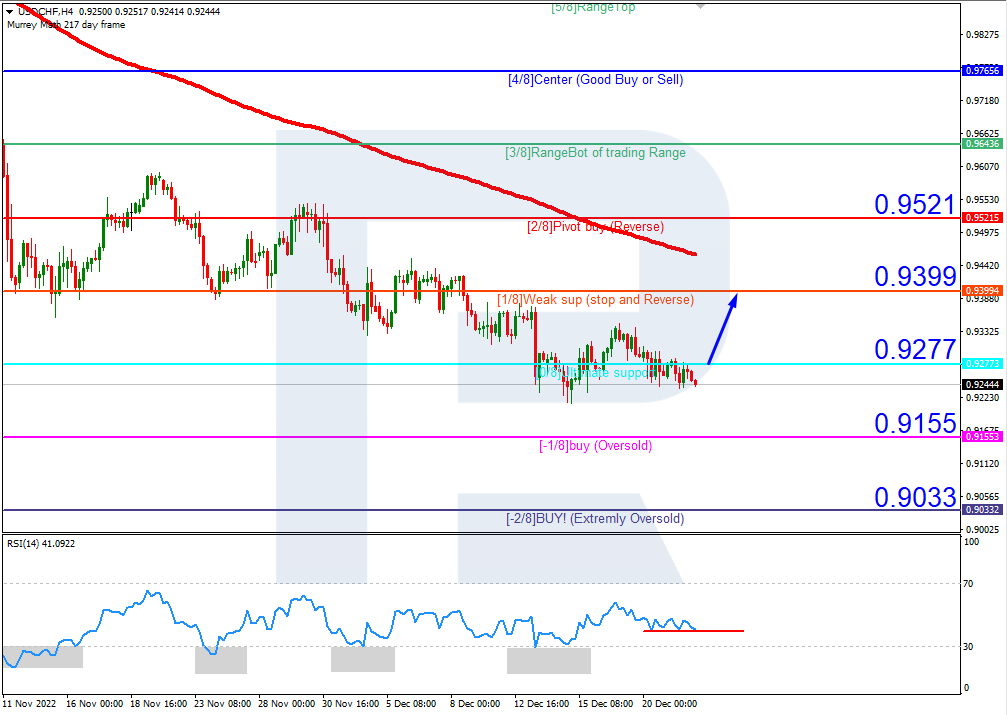
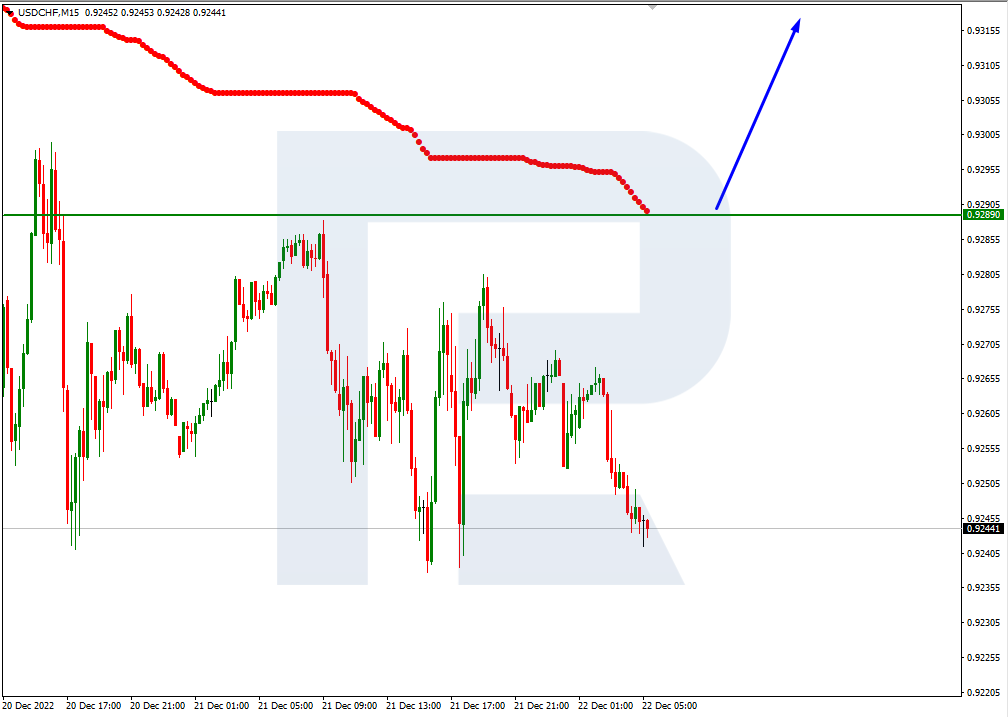
On H4, the quotes are in the oversold area. The RSI is testing the support level. The quotes are expected to break through 0/8 (0.9277) and grow to the resistance level of 1/8 (0.9399). The scenario can be cancelled by a downward breakaway of the support level of -1/8 (0.9155), in which case the pair may drop to -2/8 (0.9033).
On M15, an additional signal confirming the growth will be a breakaway of the upper line of VoltyChannel.
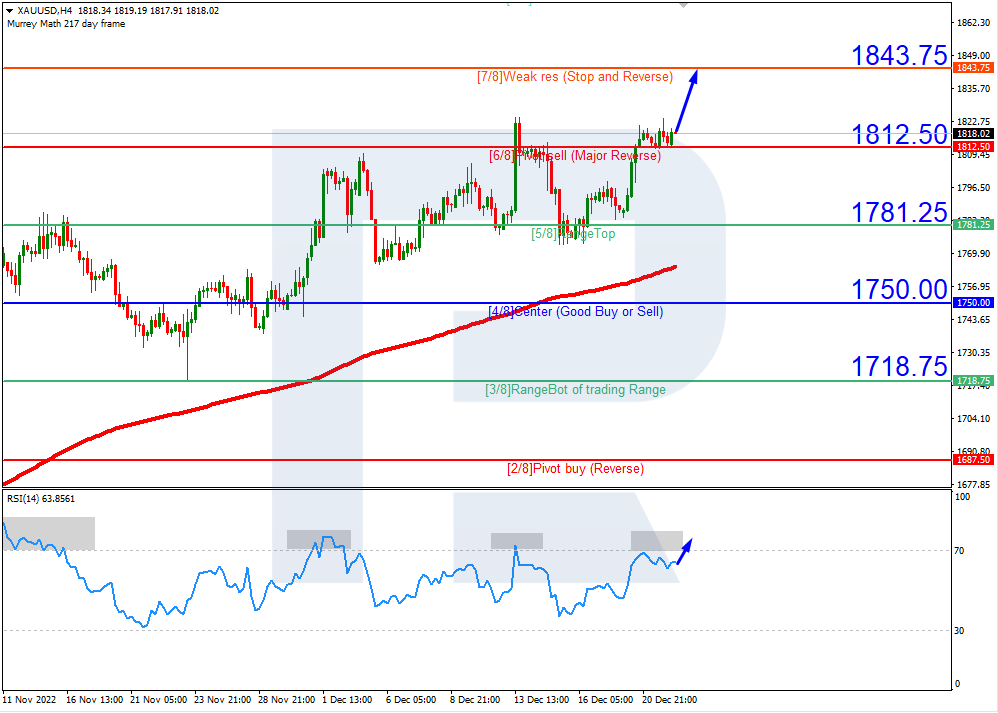
XAUUSD, “Gold vs US Dollar”
On H4, the quotes are above the 200-day Moving Average, which indicates the prevalence of an uptrend. The RSI is nearing the overbought area. As a result, the quotes are expected to growth to the nearest resistance level of 7/8 (1843.75). The scenario can be cancelled by a downward breakaway of the support level of 6/8 (1812.50). This may drive the price down to 5/8 (1781.25).
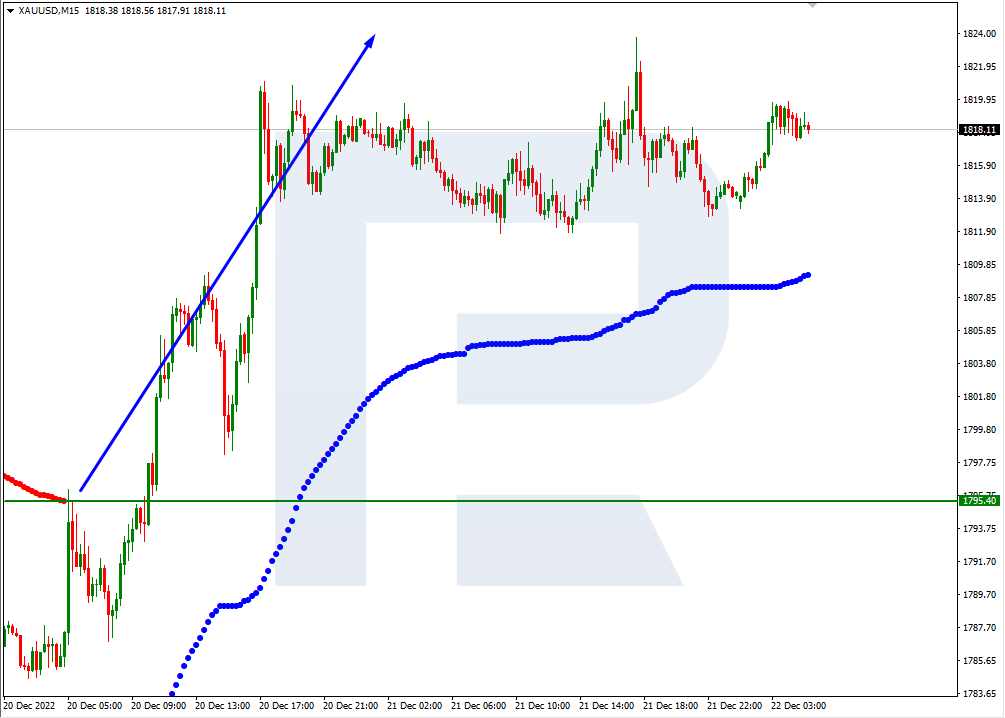
On M15, the upper line of VoltyChannel is broken, which confirms the uptrend and increases the probability of price growth.
Attention! Forecasts presented in this section only reflect the author’s private opinion and should not be considered as guidance for trading. RoboForex LP bears no responsibility for trading results based on trading recommendations described in these analytical reviews.
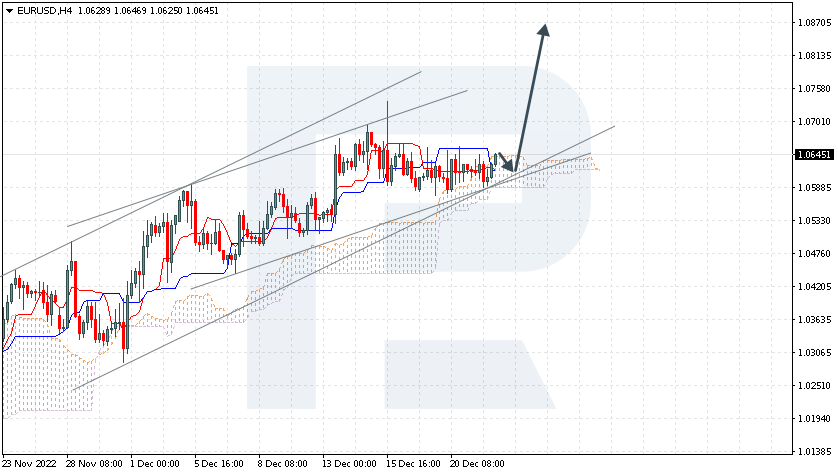
The currency pair is growing inside a bullish channel. The instrument is going above the Ichimoku Cloud, which suggests an uptrend. A test of the lower border of the Cloud at 1.0595 is expected, followed by growth to 1.0870. An additional signal confirming the decline will be a bounce off the lower border of the bullish channel. The scenario can be cancelled by a breakaway of the lower border of the Cloud and securing under 1.0535, which will mean further falling to 1.0445.
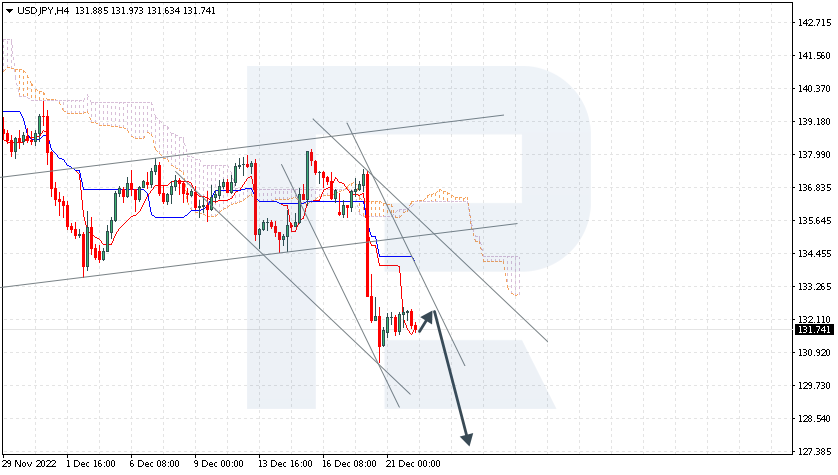
USDJPY, “US Dollar vs Japanese Yen”
The currency pair is testing the signal lines of the indicator. The instrument is going below the Ichimoku Cloud, which suggests a downtrend. A test of the Tenkan-Sen line at 132.15 is expected, followed by falling to 127.45. An additional signal confirming the decline will be a bounce off the upper border of the descending channel. The scenario can be cancelled by a breakaway of the upper border of the Cloud and securing above 135.55, which will mean further growth to 136.45.
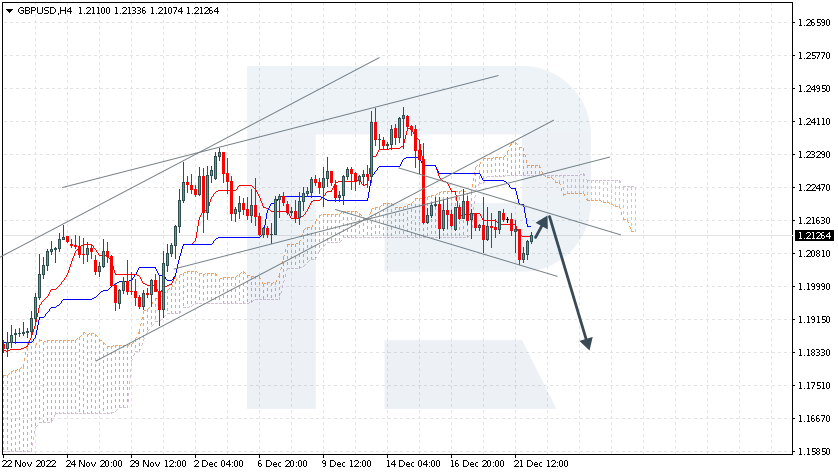
GBPUSD, “Great Britain Pound vs US Dollar”
The pair is pushing off the support line. The instrument is going below the Ichimoku Cloud, which suggests a downtrend. A test of the Kijun-Sen line at 1.2165 is expected, followed by falling to 1.1835. An additional signal confirming the decline will be a bounce off the lower border of the bullish channel. The scenario can be cancelled by a breakaway of the upper border of the Cloud and securing above 1.2335, which will mean further growth to 1.2425.
Attention! Forecasts presented in this section only reflect the author’s private opinion and should not be considered as guidance for trading. RoboForex LP bears no responsibility for trading results based on trading recommendations described in these analytical reviews.
The Conference Board Consumer Confidence Index in the US jumped to 108.3 from 101.4, beating economists’ forecast of 101.0. The rise in consumer sentiment has eased fears of a US recession. Investors are now waiting for US GDP data for the latest quarter and data on the PCE Index, which is among the US Federal Reserve’s monitored inflation indicators. Growing inflationary pressures may bring panic moods back to the market, which will cause EUR/USD quotes to fall against the background of the dollar’s strengthening.
Trading recommendations
Support levels: 1.0549, 1.0483, 1.0361, 1.0332, 1.0284, 1.0193
Resistance levels: 1.0647, 1.0695
The trend on the EUR/USD currency pair on the hourly time frame is bullish. The price is forming a price corridor. The MACD indicator became positive. Inside the day, purchases prevail. Under such market conditions, buy trades are best considered from the moving averages but with additional confirmation. Sell deals can be considered from the resistance level of 1.0647, but it is better with confirmation in the form of a reverse initiative or false breakout because the level has already been tested.
Alternative scenario: if the price breaks down through the support level of 1.0446 and fixes below it, the downtrend will likely resume.
News feed for 2022.12.22:
– US GDP (q/q) at 15:30 (GMT+2);
– US Initial Jobless Claims (w/w) at 15:30 (GMT+2).
The GBP/USD currency pair
Technical indicators of the currency pair:
Prev Open: 1.2171
Prev Close: 1.2082
% chg. over the last day: -0.74 %
Today, the UK will release GDP data for the last quarter of 2022. Analysts are predicting that the economy will contract by 0.2%, which will be the second quarter of decline, which will mean a technical recession. The UK’s economic outlook remains murky: record inflation, the energy crisis, and strikes suggest that economic indicators will decline throughout the winter.
Trading recommendations
Support levels: 1.2091, 1.2177, 1.2024, 1.1964, 1.1684, 1.1476, 1.1418
Resistance levels: 1.2218, 1.2308, 1.2431, 1.2519
From the technical point of view, the trend on the GBP/USD currency pair on the hourly time frame is bullish. Yesterday, the price tested the priority change level but failed to consolidate higher. A false breakdown area was formed. The MACD indicator has become inactive, and the volatility on the threshold of the holidays is low. Under such market conditions, it is better to look for buy trades from the support level at 1.2092 but with a confirmation at the intraday time frames. Sell trades are best sought from the resistance level of 1.2218 but also better with confirmation.
Alternative scenario: if the price breaks down from the 1.2092 support level and fixes below it, the downtrend will likely resume.
News feed for 2022.12.22:
– UK GDP (q/q) at 09:00 (GMT+2).
The USD/JPY currency pair
Technical indicators of the currency pair:
Prev Open: 131.51
Prev Close: 132.45
% chg. over the last day: +0.71 %
Japan is the world’s largest holder of US Treasuries outside the United States, and benchmark 10-year bond yields rose about 13 basis points in two sessions following the Bank of Japan’s decision. Investors are shorting yen positions and selling them in bond markets around the world. According to analysts, the sale of Japanese bonds could trigger a panicked influx of cash back into Japan, but so far, this is not happening. The overall fundamental picture is starting to change and comes down to expectations that the Bank of Japan will join other central banks in tightening monetary policy next year.
From the technical point of view, the medium-term trend on the currency pair USD/JPY is bearish. The MACD indicator has become inactive, forming a narrow price range. It is better to look for buy trades on intraday time frames from the support level of 131.22, but only with confirmation. Sell deals can be looked for from the resistance level of 133.53, provided that there is a reverse reaction.
Alternative scenario: If the price fixes above 137.00, the uptrend will likely resume.
There is no news feed for today.
The USD/CAD currency pair
Technical indicators of the currency pair:
Prev Open: 1.3610
Prev Close: 1.3612
% chg. over the last day: +0.01 %
Yesterday, new inflation data was released in Canada. The report showed that year-over-year consumer prices fell from 6.9% to 6.8%, while core inflation (which excludes food and energy prices) remained at 5.8% y/y. The key point is that the main components of core price pressures have shown an upward trend, and core inflation remains well above the Bank of Canada’s target, keeping the likelihood of a rate hike at the January meeting high.
Trading recommendations
Support levels: 1.3590, 1.3521, 1.3438, 1.3386, 1.3360, 1.3281, 1.3212
Resistance levels: 1.3656, 1.3700, 1.3776, 1.3855
From the point of view of technical analysis, the trend on the USD/CAD currency pair has changed to bullish. But the price is trading below the moving averages, and the MACD indicator is negative, indicating selling pressure inside the day. At the same time, volatility is decreasing in anticipation of the holidays. Buy trades should be considered from the support level of 1.3590, but with a confirmation in the form of a reversal, currently, there is none. Sell deals are best to look for on the intraday time frames from the resistance level of 1.3656, but with a confirmation in the form of a reverse initiative or after a false breakout, since the level has already been tested.
Alternative scenario: if the price breaks down and consolidates below the support level of 1.3386, the downtrend will likely resume.
This article reflects a personal opinion and should not be interpreted as an investment advice, and/or offer, and/or a persistent request for carrying out financial transactions, and/or a guarantee, and/or a forecast of future events.
The Japanese yen against the US dollar remains at its four-month peaks. The current quote is 132.00.
The BoJ decided to gain more control over the bond yield, and this decision will be affecting the market for quite long. It corrected long-term interest rates, giving them more space to grow than previously. This mechanism is meant to smooth out the negative consequences of the ultra-soft credit and monetary policy of the regulator and lengthy monetary stimulation.
At the Japanese government level, it has already been announced that this decision of the BoJ means neither cancelling nor giving up the soft credit and monetary policy.
Today the BoJ has announced an extraordinary purchase of bonds for 200 billion yen. 100 billion yen will be spent on 3 to 5 year bonds and 100 billion yen more – on 5 to 10 year bonds.
Attention! Forecasts presented in this section only reflect the author’s private opinion and should not be considered as guidance for trading. RoboForex LP bears no responsibility for trading results based on trading recommendations described in these analytical reviews.
The market major has been consolidating in a narrow range for several days. The current quote is 1.0620.
As was said earlier, EURUSD investors have already got all the facts they might need. Theoretically, situation there must be stable until Christmas.
The statistics from yesterday was quite curious. For example, new house foundations in the US in November did not change, remaining at 1.43 million while 1.40 million had been expected. This is unusual but positive: Americans keep on building houses even when prices are growing. At the same time, the number of construction permits dropped to 1.34 million from 1.51 million. This is normal due to seasonal changes.
All in all, the US real estate sector looks absolutely confident. Demand has never crashed here, though supply is somewhat decreasing. Consumers show no agitation that could appear if they expected real worsening of the economic conditions.
The CCI in the euro zone in December grew to -22 points from -24 points, as expected.
Attention! Forecasts presented in this section only reflect the author’s private opinion and should not be considered as guidance for trading. RoboForex LP bears no responsibility for trading results based on trading recommendations described in these analytical reviews.
ECB officials earlier this week indicated that a 50 bps rate hike at the next meeting is the best-case scenario and is seen as the main scenario within the monetary policy tightening. It is also should ту noted that the ECB decided at its last meeting to start gradually reducing its balance sheet next year. The tightening of monetary policy is usually accompanied by currency appreciation. But investors should also consider the difference between central banks’ interest rates. As long as the US Fed has a higher rate than the ECB, traders should not expect the Euro to strengthen in the medium term.
Trading recommendations
Support levels: 1.0549, 1.0483, 1.0361, 1.0332, 1.0284, 1.0193
Resistance levels: 1.0648, 1.0695
The trend on the EUR/USD currency pair on the hourly time frame is bullish. The MACD indicator has become inactive, volatility is reduced, and the price forms a price corridor. Under such market conditions, it is best to consider buy trades from the support level of 1.0549 but with additional confirmation. Sell deals can be considered from the resistance level of 1.0648, but it is better with a confirmation in the form of a reverse initiative or a false breakout, as the level has already been tested.
Alternative scenario: if the price breaks down through the support level of 1.0446 and fixes below it, the downtrend will likely resume.
News feed for 2022.12.21:
– US CB Consumer Confidence (m/m) at 17:00 (GMT+2);
– US Existing Home Sales (m/m) at 17:00 (GMT+2).
The GBP/USD currency pair
Technical indicators of the currency pair:
Prev Open: 1.2145
Prev Close: 1.2183
% chg. over the last day: +0.31 %
The British pound remains under pressure due to the interest rate differential between the US Federal Reserve and the Bank of England (BoE). The US Fed is holding the rate at 4.5%, while the Bank of England is at 3.5%. The ECB has become more hawkish, and the Bank of England is expected to end monetary policy tightening ahead of the rest. As early as tomorrow, the UK will release its final GDP data for the quarter, and experts believe the economy will contract by 0.2%, indicating a second consecutive quarter of contraction, which is technically considered the beginning of a recession.
Trading recommendations
Support levels: 1.2092, 1.2177, 1.2024, 1.1964, 1.1684, 1.1476, 1.1418
Resistance levels: 1.2218, 1.2308, 1.2431, 1.2519
From the technical point of view, the trend on the GBP/USD currency pair on the hourly time frame is bullish. The price is trading at the level of the moving averages and is approaching the priority change level. The MACD indicator has become inactive, and volatility on the eve of the holidays is reduced. Under such market conditions, it is better to look for buy trades from the support level of 1.2092 but with confirmation on the intraday time frames. Sell trades are best looked for from the resistance level of 1.2218, but also better with confirmation.
Alternative scenario: if the price breaks down from the 1.2092 support level and fixes below it, the downtrend will likely resume.
There is no news feed for today.
The USD/JPY currency pair
Technical indicators of the currency pair:
Prev Open: 136.88
Prev Close: 131.70
% chg. over the last day: -3.93 %
The Bank of Japan changed its yield curve control policy yesterday, raising the ten-year government bond rate target by 25 bps to 0.5%. Raising the bar is a forced measure of tightening monetary policy due to a lack of demand and liquidity in the country’s debt market and capital outflows from Japan to countries. Analysts think that the JPY has all the signs of continuing its strengthening trend as the Bank of Japan is no longer going to tolerate any devaluation of its currency. At the same time, it needs to shift towards policy normalization in order to maintain liquidity.
From the technical point of view, the medium-term trend on the currency pair USD/JPY is bearish. The MACD indicator is deeply negative, without any signs of reversal, but with a sign of oversold. It is best to look for buy trades on intraday time frames from the support of 131.22, but only with confirmation. Sell deals can be sought from the resistance level of 133.53, provided that there is a reverse reaction.
Alternative scenario: If the price fixes above 137.00, the uptrend will likely resume.
There is no news feed for today.
The USD/CAD currency pair
Technical indicators of the currency pair:
Prev Open: 1.3644
Prev Close: 1.3611
% chg. over the last day: -0.24 %
The Bank of Canada announced an increase in dealer limits for overnight repo transactions. The maximum aggregate cash value limit will increase to $5 billion from the previous limit of $1.5 billion per offering. The Bank is increasing these limits to improve the efficiency of its monetary policy implementation operations. OR operations support the effective implementation of monetary policy through intervention and intraday liquidity injections into the overnight general collateral market to reinforce the Bank’s overnight rate target.
Trading recommendations
Support levels: 1.3601, 1.3521, 1.3438, 1.3386, 1.3360, 1.3281, 1.3212
Resistance levels: 1.3700, 1.3776, 1.3855
From the point of view of technical analysis, the trend on the USD/CAD currency pair has changed to bullish. But the price is trading below the moving averages, and the MACD indicator is negative, indicating selling pressure inside the day. Buy trades should be considered from the support level of 1.3601, but with confirmation. Sells are best to look for on intraday time frames from the resistance level of 1.3700, but with confirmation in the form of a reverse initiative or after a false breakout, since the level has already been tested.
Alternative scenario: if the price breaks down and consolidates below the support level of 1.3386, the downtrend will likely resume.
News feed for 2022.12.21:
– Canada Consumer Price Index (m/m) at 15:30 (GMT+2);
This article reflects a personal opinion and should not be interpreted as an investment advice, and/or offer, and/or a persistent request for carrying out financial transactions, and/or a guarantee, and/or a forecast of future events.
The Japanese yen has grown quite a bit against the US dollar. The current quote is 132.60.
At today’s meeting, the BoJ decided to keep the interest rate without a change at -0.10% a year.
What came as a surprise was the announcement of an unlimited purchase of one to five-year bonds. The sum meant to spent on it from now on is 600 billion yen. On one to three-year bonds, three to five-year bonds, and ten to twenty-five year bonds, 100 billion Japanese yen will be spent, respectively. 300 billion yen more will be spent on five to ten-year bonds. Extra bond purchases are scheduled for 22 December.
The Bank plans to react to each bond issuing, to increase purchases, and expand volumes of operations with fixed-rate securities, when necessary. Moreover, the Bank of Japan will set a fixed rate for auctions with ten-year bonds.
For the yen, everything happening is interventions, either open or hidden.
A peculiar situation has formed: the BoJ decided against changing its ultra-soft policy but brought the debt sector out of balance totally, thus supporting the JPY.
Attention! Forecasts presented in this section only reflect the author’s private opinion and should not be considered as guidance for trading. RoboForex LP bears no responsibility for trading results based on trading recommendations described in these analytical reviews.
European Central Bank Vice President Luis de Guindos said on Monday that the ECB would continue to raise rates in the Eurozone to curb inflation and is not considering revising its own medium-term inflation target of 2%. Germany’s leading Ifo index rose to 88.6 in December from 86.4 in November. The index is now back to levels last seen in the summer. The outlook for Europe’s largest economy is improving despite the energy crisis.
Trading recommendations
Support levels: 1.0549, 1.0483, 1.0361, 1.0332, 1.0284, 1.0193
Resistance levels: 1.0641, 1.0695
The trend on the EUR/USD currency pair on the hourly time frame is bullish. The price is adjusting to the nearest support levels. The MACD indicator has become inactive, and the price is forming a narrow flat. Under such market conditions, buy trades are best considered from the support level of 1.0549 but with additional confirmation. Sell deals can be considered from the resistance level of 1.0641, but it is better with a confirmation in the form of a reverse initiative or false breakout because the level has already been tested.
Alternative scenario: if the price breaks down through the support level of 1.0446 and fixes below it, the downtrend will likely resume.
News feed for 2022.12.20:
– US Building Permits (m/m) at 15:30 (GMT+2).
The GBP/USD currency pair
Technical indicators of the currency pair:
Prev Open: 1.2143
Prev Close: 1.2144
% chg. over the last day: +0.01 %
UK Chancellor Jeremy Hunt instructed the Office for Budget Responsibility (OBR) to “prepare an economic and fiscal outlook to be presented with the Spring Budget on March 15, 2023. There are no significant events on the economic calendar at the start of the week, so GBP/USD is likely to be dependent on the US dollar index until the UK GDP is released on Thursday. A hawkish Fed forecast is supposed to keep the bulls on the dollar index in play, increasing downward pressure on GBP/USD quotes.
Trading recommendations
Support levels: 1.2092, 1.2177, 1.2024, 1.1964, 1.1684, 1.1476, 1.1418
Resistance levels: 1.2218, 1.2308, 1.2431, 1.2519
From the technical point of view, the GBP/USD currency pair trend on the hourly time frame is bullish. But the price is trading below the moving averages and is approaching the priority change level. The MACD indicator is in the negative zone, but there are signs of divergence, which indicates some weakness of the sellers. Under such market conditions, it is better to look for buy trades from the support level of 1.2092 but with confirmation on the intraday time frames. Sell trades are best sought from the resistance level of 1.2218 but also better with confirmation.
Alternative scenario: if the price breaks down of the 1.2092 support level and fixes below it, the downtrend will likely resume.
There is no news feed for today.
The USD/JPY currency pair
Technical indicators of the currency pair:
Prev Open: 135.85
Prev Close: 136.90
% chg. over the last day: +0.77 %
The Bank of Japan shocked the markets by doubling the 10-year bond yield cap, causing the yen to jump and government bonds to fall, which helped pave the way for a possible policy normalization. The Japanese yen strengthened sharply on the back of this news. Kyodo News reported that Japanese Prime Minister Fumio Kishida is considering a more flexible approach to the 2% inflation target. The Central Bank will likely abandon its soft monetary policy when a new governor of the Bank of Japan is appointed in April 2023. A stronger yen could bring some relief to the Japanese economy, which is struggling with high import costs caused by this year’s yen depreciation.
From the technical point of view, the medium-term trend on the currency pair USD/JPY is bearish. The price has fallen sharply on the BoJ meeting. The MACD indicator is deeply negative, with no sign of reversal but with a sign of oversold. Buy trades are best considered on intraday time frames from the support level of 133.12, but only with confirmation. Sell deals can be looked for from the resistance level of 134.73, provided there is a reversal.
Alternative scenario: If the price fixes above 139.00, the uptrend will likely resume.
News feed for 2022.12.20:
– Japan BoJ Interest Rate Decision at 05:00 (GMT+2);
– Japan BoJ Monetary Policy Statement at 05:00 (GMT+2);
– Japan BoJ Press Conference at 05:00 (GMT+2).
The USD/CAD currency pair
Technical indicators of the currency pair:
Prev Open: 1.3677
Prev Close: 1.3650
% chg. over the last day: -0.19 %
Oil prices rose on Monday as optimism over China’s easing COVID-19 restrictions outweighed fears of a global recession affecting energy demand. Oil also received support from the US Department of Energy, which said Friday it would begin buying crude oil for the Strategic Petroleum Reserve. A rise in oil prices is always accompanied by a fall in USD/CAD since the Canadian dollar is a commodity currency.
Trading recommendations
Support levels: 1.3601, 1.3521, 1.3438, 1.3386, 1.3360, 1.3281, 1.3212
Resistance levels: 1.3700, 1.3776, 1.3855
From the point of view of technical analysis, the trend on the USD/CAD currency pair has changed to bullish. The price is trading above the average lines, but the price has hit a strong resistance level at 1.3700. The MACD indicator has become inactive, but the divergence indicates that the buyers are limited in their potential. Buy trades should be considered only after a breakout and a fixation above 1.3700. Sell deals is better to look for on the intraday time frames from 1.3601, but with a confirmation in the form of a reverse initiative or after a false breakdown.
Alternative scenario: if the price breaks down and consolidates below the support level of 1.3386, the downtrend will likely resume.
This article reflects a personal opinion and should not be interpreted as an investment advice, and/or offer, and/or a persistent request for carrying out financial transactions, and/or a guarantee, and/or a forecast of future events.