Archive for Forex and Currency News – Page 85

Week Ahead: Dollar to falter at onset of 2023?

By ForexTime

As we make fresh resolutions (especially those that pertain to trading/investing), here’s a head start on the potential opportunities ahead, starting with these key economic events and data releases in the first week of the new year:
Monday, January 2

  • EUR: Eurozone December manufacturing PMI (final)
  • US, UK markets closed

Tuesday, January 3

  • CNH: China December Caixin manufacturing PMI
  • EUR: Germany December unemployment and inflation (CPI)
  • GBP: UK December manufacturing PMI (final)
  • CAD: Canada December manufacturing PMI
  • USD: US December manufacturing PMI (final)

Wednesday, January 4

  • EUR: Eurozone December services PMI (final)
  • USD: FOMC meeting minutes, US December ISM manufacturing

Thursday, January 5

  • AUD: Australia December composite and services PMIs (final)
  • CNH: China December Caixin services PMI
  • JPY: Japan December consumer confidence
  • EUR: Eurozone November PPI\
  • USD: US weekly initial jobless claims

Friday, January 6

  • EUR: Germany November factory orders
  • EUR: Eurozone December inflation, consumer confidence (final); November retail sales
  • CAD: Canada December employment data, jobless rate
  • USD: US December nonfarm payrolls report


As is the case on the first Friday of every month, markets will be primed to react to the monthly US jobs report.

At the time of writing, markets are forecasting an NFP (nonfarm payrolls) headline figure of 200,000 US jobs added in December, while the unemployment rate stays at 3.7%.

  • If that 200k estimate proves true, that would be the fewest number of jobs added to the US labour market since December 2019.
  • At 3.7%, that would mean that unemployment is still stubbornly around pre-pandemic lows, despite the Fed already having triggered many a supersized rate hike with hopes of incurring some demand destruction to rein in inflationary pressures.


Dollar to react to what US jobs market portends for Fed rate hikes

  • Should the US labour market continue to show signs of resilience, either by way of a higher-than-expected headline NFP figure (>200k) or a lower-than-expected unemployment rate (<3.7%), that may translate into a rebound for the US Dollar.

Relief for dollar bulls would be based on the notion that the Fed has to send its benchmark rates even higher in 2023 to cause more demand destruction and quell US inflation.

  • However, if we are shown signs of widening cracks in the US jobs market, either by way of a lower-than-200k headline NFP figure or a higher-than-3.7% unemployment rate, that may extend the Dollar’s declines from Q4 2022.


Also, pay attention to the latest minutes from the Fed’s December policy meeting, to be released on Thursday.

If there are signs that voting members on the FOMC are losing their collective zeal for sending US interest rates much higher in 2023, then dollar bears (those hoping the US dollar will fall) could pounce on such dovish signals to send the greenback lower.


Notice how this equally-weighted USD Index (as opposed to the benchmark DXY) has been trading around two key Fibonacci levels for all of December.

The longer it consolidates around this region, the more explosive the potential breakout from all that pent-up indecision.


USD Index: Immediate support and resistance levels

  • Support: 1.170 region (23.6% Fibonacci line from the USD Index’s 2022 peak-to-trough retracement)
  • Resistance: 1.190 (200-day simple moving average)
  • Resistance: 1.19467 (50% retracement) – 1.19754 (previous cycle high)


To be fair to dollar bulls, markets are positioned for more US dollar gains against most of its G10 peers, except against the Japanese Yen, over the next one week.


Still, from a fundamental perspective, a dollar rebound may well require further proof that the Federal Reserve can afford to send US interest rates past 5% (from the current 4.5%) as 2023 rolls along, starting with next week’s US jobs report and the incoming FOMC meeting minutes.

Otherwise, markets are likely to continue expecting this Fed pivot: that the Fed is much closer to being done with rate hikes are could actually lower US rates to offset a potential recession later in 2023.

Rising expectations for an eventual “Fed pivot” are then likely to drag the US dollar even lower.


Forex-Time-LogoArticle by ForexTime

ForexTime Ltd (FXTM) is an award winning international online forex broker regulated by CySEC 185/12 www.forextime.com
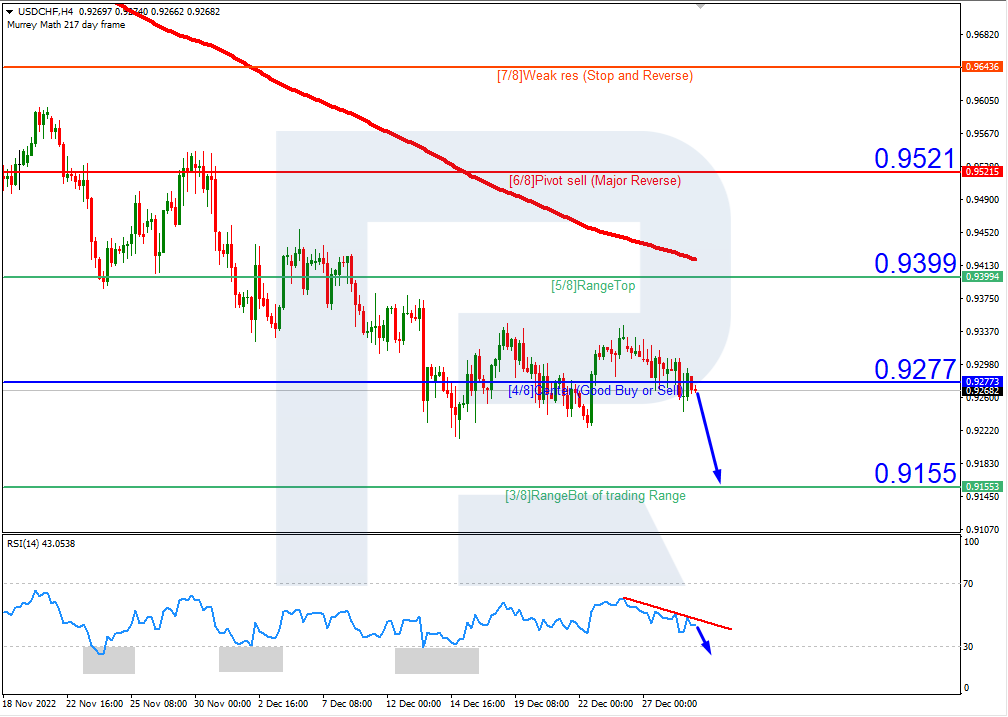

Murrey Math Lines 29.12.2022 (USDCHF, XAUUSD)

By RoboForex.com

USDCHF, “US Dollar vs Swiss Franc”

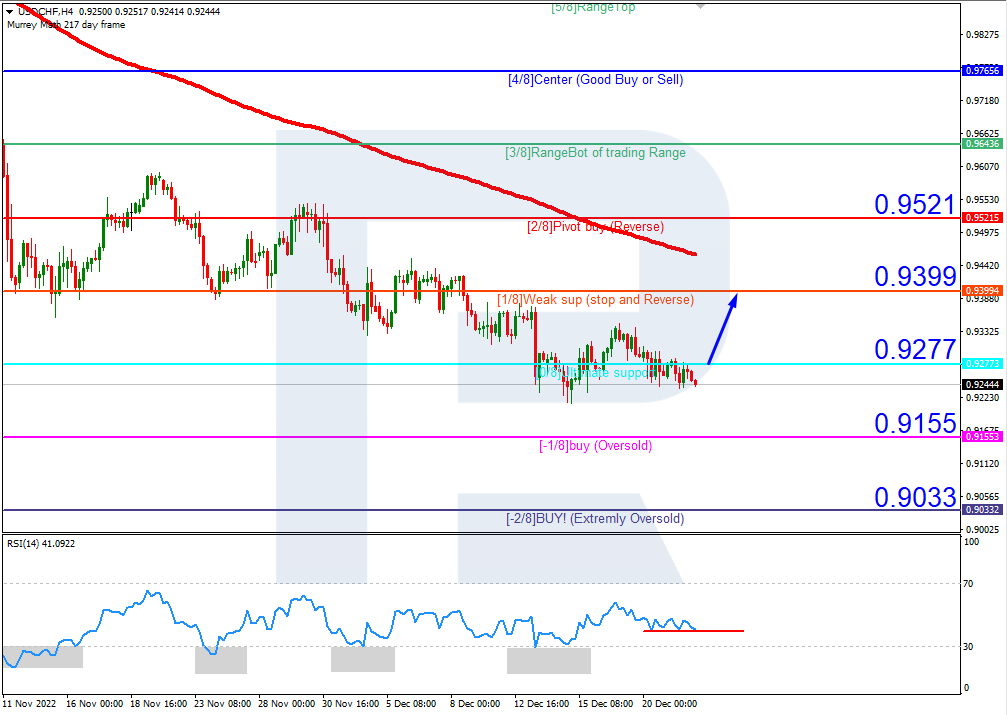
On H4, the quotes are under the 200-day Moving Average, which indicates prevalence of a downtrend. The RSI has bounced off the resistance line. Further falling to the nearest support at 3/8 (0.9155) is expected. The scenario can be cancelled by an upward breakaway of 4/8 (0.9277). In this case, the pair may reach 5/8 (0.9399).

USDCHFH4
Risk Warning: the result of previous trading operations do not guarantee the same results in the future

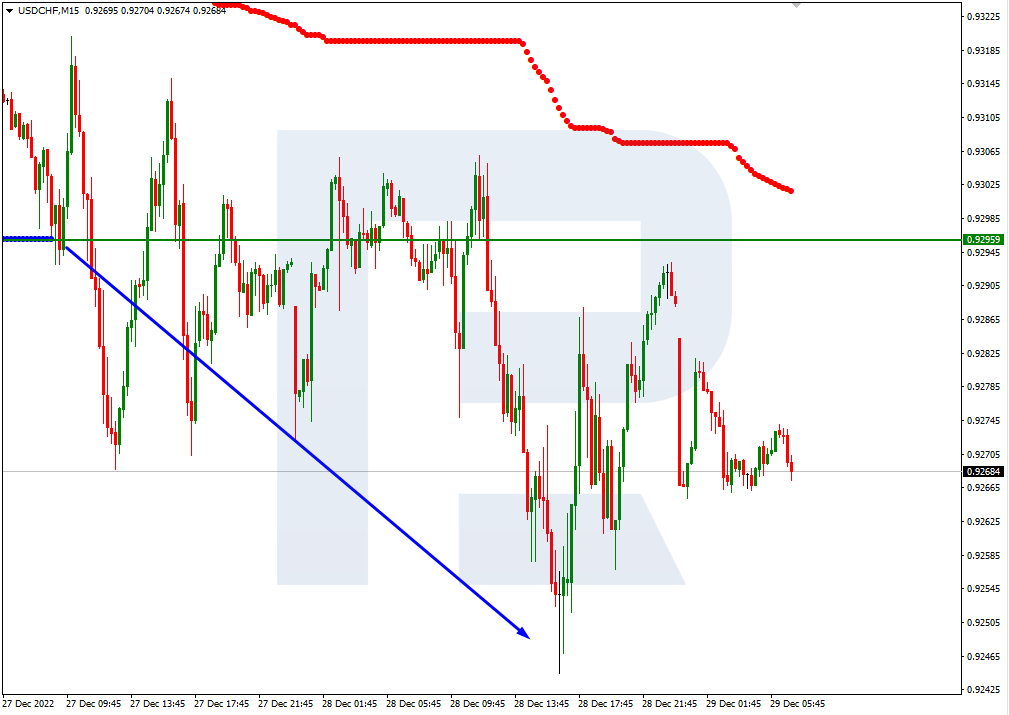
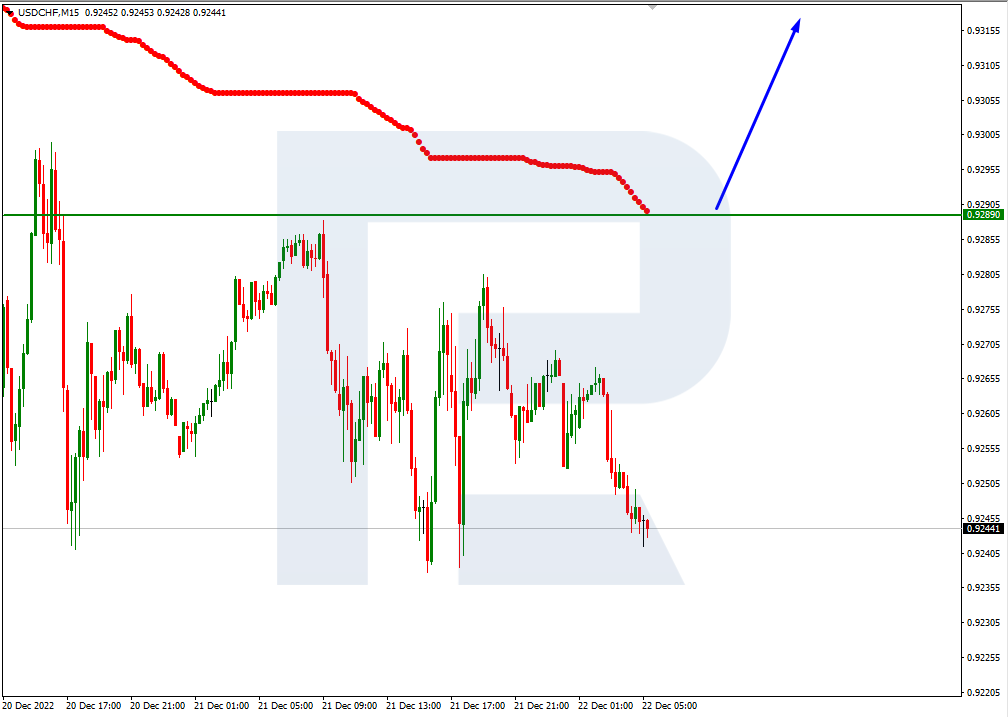
On M15, the lower line of VoltyChannel is broken, which confirms a downtrend and increases the probability of further price falling.

USDCHF_M15
Risk Warning: the result of previous trading operations do not guarantee the same results in the future

XAUUSD, “Gold vs US Dollar”

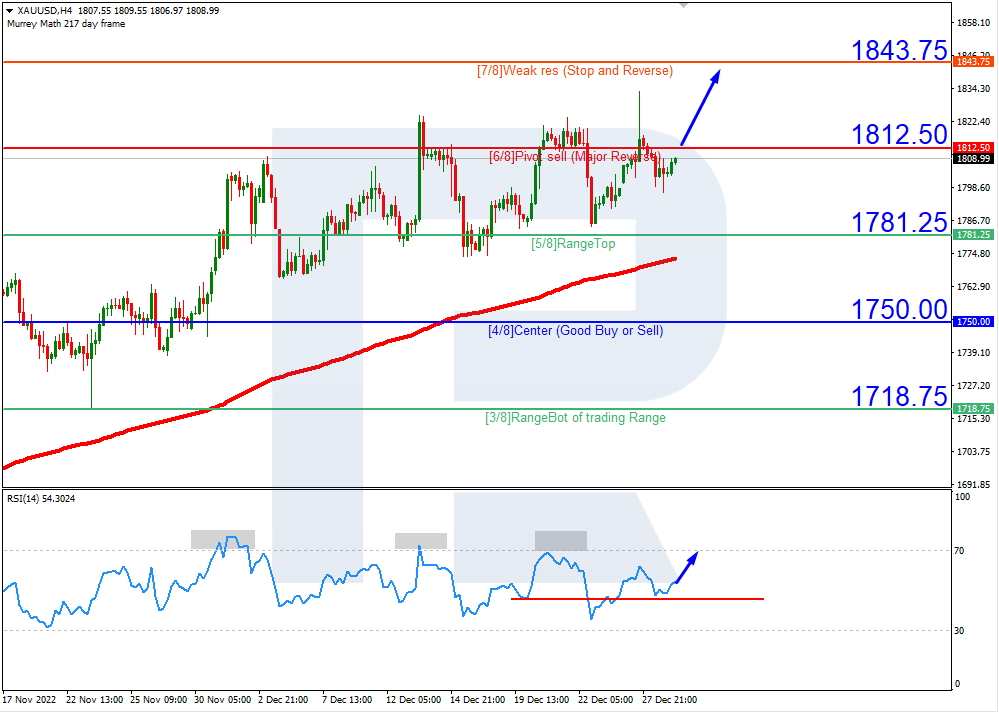
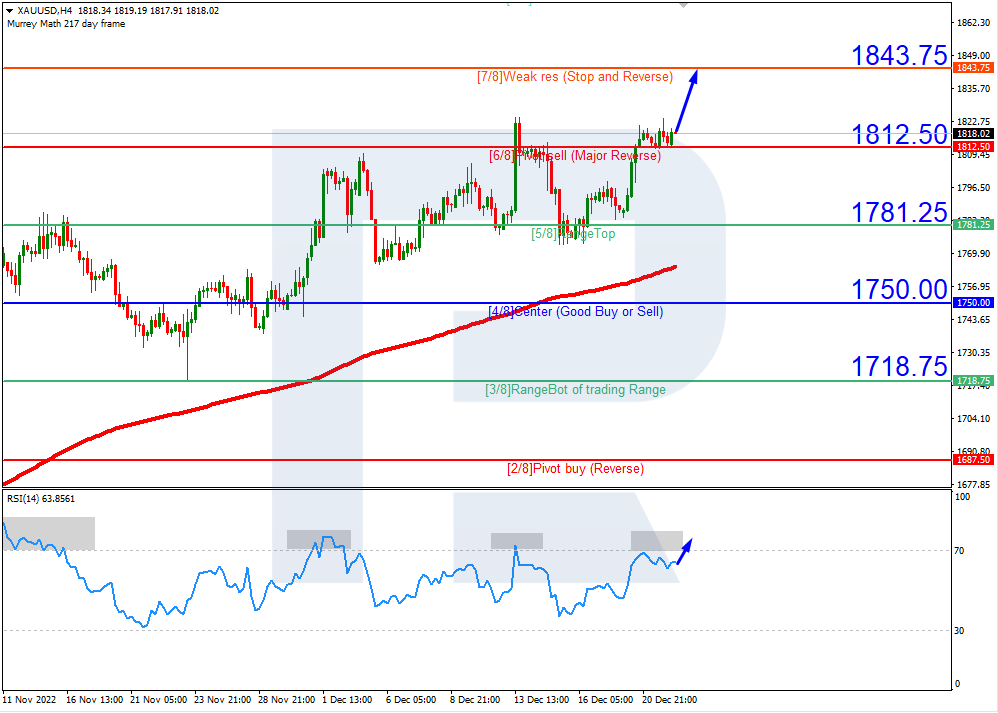
On H4, the quotes are above the 200-day Moving Average, which indicates prevalence of an uptrend. The RSI has bounced off the support line. As a result, the quotes are expected to rise above 6/8 (1812.50) and grow to the resistance level of 7/8 (1843.75). The scenario can be cancelled by a downwards breakaway of the support level of 5/8 (1781.25). This might lead to falling of the price to 4/8 (1750.00).

XAUUSD_H4
Risk Warning: the result of previous trading operations do not guarantee the same results in the future

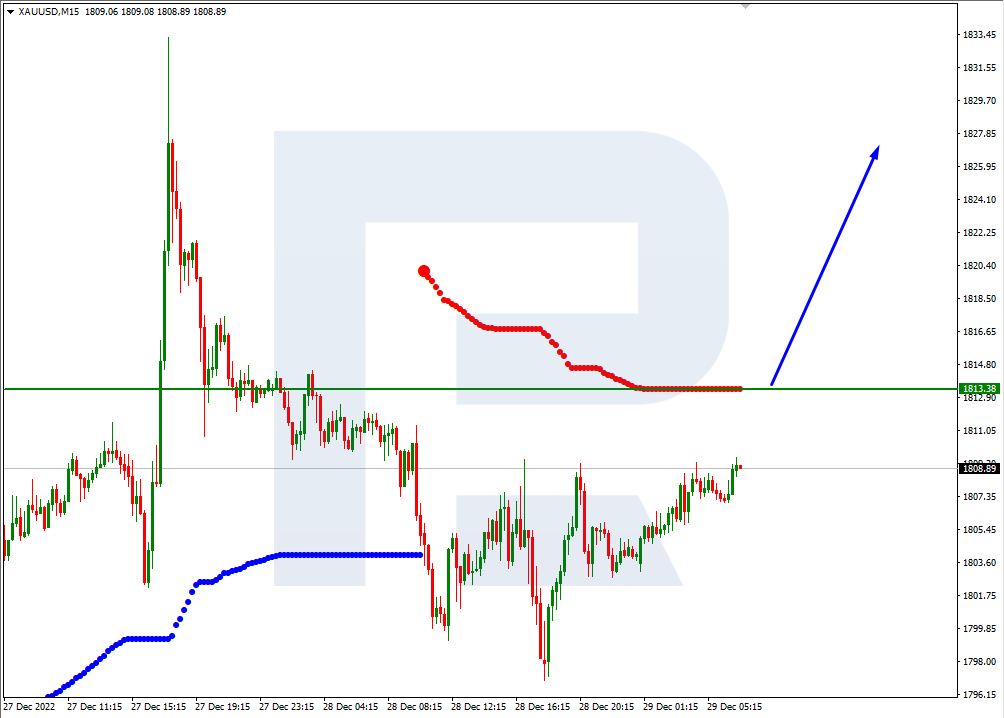
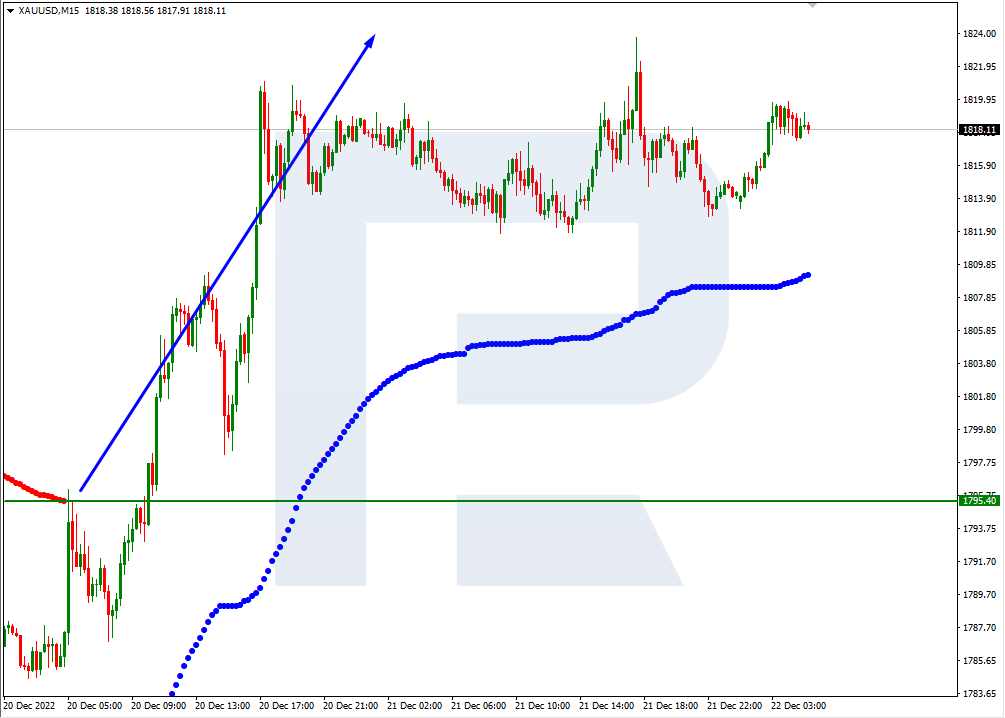
On M15, an additional signal confirming growth will he a breakaway of the upper border of VoltyChannel.

XAUUSD_M15
Risk Warning: the result of previous trading operations do not guarantee the same results in the future

Article By RoboForex.com

Attention!
Forecasts presented in this section only reflect the author’s private opinion and should not be considered as guidance for trading. RoboForex LP bears no responsibility for trading results based on trading recommendations described in these analytical reviews.

The Analytical Overview of the Main Currency Pairs on 2022.12.29

By JustMarkets

The EUR/USD currency pair

Technical indicators of the currency pair:
  • Prev Open: 1.0638
  • Prev Close: 1.0611
  • % chg. over the last day: -0.25 %

Inflation in the Eurozone lags Lithuanian inflation by half a year, which means that its peak is still to come. This is the opinion of the representative of the European Central Bank (ECB) Governing Council, Gediminas Simkus. The main risk comes from the energy crisis amid falling temperatures in winter. If Europe manages to pass this winter without considerable problems in the energy system, it is possible to say with certainty that the inflation peak has already passed this spring.

Trading recommendations
  • Support levels: 1.0586, 1.0483, 1.0361, 1.0332, 1.0284, 1.0193
  • Resistance levels: 1.0654, 1.0667, 1.0695

The trend on the EUR/USD currency pair on the hourly time frame is bullish. The price is forming a price corridor. The price is forming a wide price corridor, and the volatility is reducing in anticipation of the holidays. The MACD indicator has become inactive, but there is a slight selling pressure. Under such market conditions, buy trades are best considered from support levels on intraday time frames, but with additional confirmation. Sell deals can be considered from the resistance level of 1.0654 or 1.0667, but better with a confirmation in the form of a reverse initiative or a false breakout because the level has already been tested.

Alternative scenario: if the price breaks down through the support level of 1.0549 and fixes below it, the downtrend will likely resume.

EUR/USD
News feed for 2022.12.29:
  • – US Initial Jobless Claims (w/w) at 15:30 (GMT+2).

The GBP/USD currency pair

Technical indicators of the currency pair:
  • Prev Open: 1.2024
  • Prev Close: 1.2018
  • % chg. over the last day: -0.05 %

The situation on the GBP/USD currency pair has not changed compared to the previous day. Volatility remains below average in the run-up to the New Year holidays. Fundamental factors for the British pound are extremely weak now, so there are no prerequisites for growth. Traders should not expect significant changes in the price till the end of the year.

Trading recommendations
  • Support levels: 1.1999, 1.1979, 1.1684, 1.1476, 1.1418
  • Resistance levels: 1.2062, 1.2218, 1.2308, 1.2431, 1.2519

From the technical point of view, the trend on the GBP/USD currency pair on the hourly time frame is bearish. The MACD indicator became inactive, and the price formed a narrow price corridor. Under such market conditions, it is better to look for buy deals from the support level of 1.1999 or 1.1979, but with confirmation on intraday time frames. Sell trades are best sought from the resistance level of 1.2062 but also better with confirmation.

Alternative scenario: if the price breaks out through the 1.2308 resistance level and fixes above it, the uptrend will likely resume.

GBP/USD
There is no news feed for today.

The USD/JPY currency pair

Technical indicators of the currency pair:
  • Prev Open: 133.35
  • Prev Close: 134.47
  • % chg. over the last day: +0.83 %

Japan’s industrial production index declined for the third consecutive month. Recent economic data, including exports, retail sales, and industrial production, signal that Japan’s economy is still very fragile and thus supports the Bank of Japan’s view that monetary policy easing should continue. At the moment, JPY does not have any fundamental support, so weak economic data and interest rate differentials between BoJ and FOMC will have a negative impact on JPY.

Trading recommendations
  • Support levels: 133.75, 132.68, 132.27, 131.22
  • Resistance levels: 134.45, 135.88, 137.03, 138.00, 139.09

From the technical point of view, the medium-term trend on the currency pair USD/JPY is bearish. The price is now trading above the moving averages, while the MACD indicator has become inactive. There is some buying pressure inside the day. Buy trades are best considered on intraday time frames from a support level of 133.75 or 132.68, but only with confirmation. Sell deals can be looked for from the resistance level of 134.45, provided there is a reverse reaction.

Alternative scenario: If the price fixes above 137.00, the uptrend will likely resume.

USD/JPY
There is no news feed for today.

The USD/CAD currency pair

Technical indicators of the currency pair:
  • Prev Open: 1.3514
  • Prev Close: 1.3604
  • % chg. over the last day: +0.67 %

No economic events and data about Canada are expected before the end of the year, so the Canadian dollar these days will be completely dependent on the dynamics of the dollar index and oil prices, as Canadian is a commodity currency. Oil prices fell on Wednesday, as well as the likelihood that the easing of pandemic restrictions in China will increase demand for fuel. With the dollar rising, USD/CAD quotes jumped yesterday. The US crude oil inventories will be released today, which will add volatility to the currency pair.

Trading recommendations
  • Support levels: 1.3529, 1.3438, 1.3386, 1.3360, 1.3281, 1.3212
  • Resistance levels: 1.3614, 1.3656, 1.3700, 1.3776, 1.3855

From the point of view of technical analysis, the uptrend trend on the USD/CAD currency pair is still bullish. The price failed to consolidate below the priority level and is trading above the moving averages. The MACD indicator is in the positive zone, and buyers prevail inside the day. Buy trades should be considered from the support level 1.3529, but with confirmation. Sell deals are best to look for on intraday time frames from the resistance level of 1.3614, but with confirmation in the form of reverse initiative on the lower time frames.

Alternative scenario: if the price breaks down and consolidates below the support level of 1.3529, the downtrend will likely resume.

USD/CAD
News feed for 2022.12.29:
  • – US Crude Oil Inventories (w/w) at 18:00 (GMT+2).

By JustMarkets


This article reflects a personal opinion and should not be interpreted as an investment advice, and/or offer, and/or a persistent request for carrying out financial transactions, and/or a guarantee, and/or a forecast of future events.

Japanese Candlesticks Analysis 28.12.2022 (XAUUSD, NZDUSD, GBPUSD)

By RoboForex.com

XAUUSD, “Gold vs US Dollar”

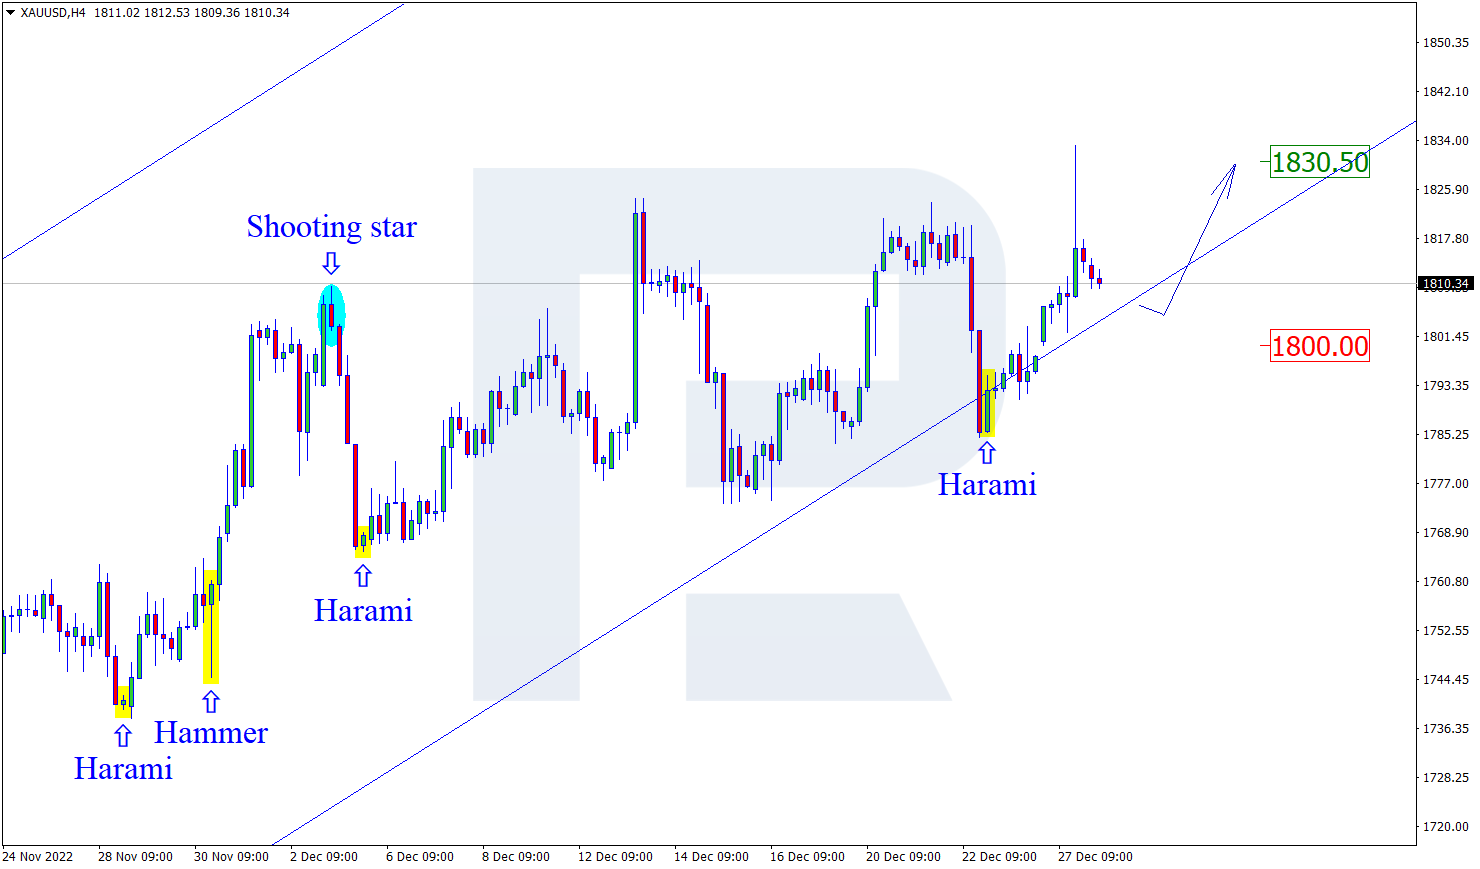
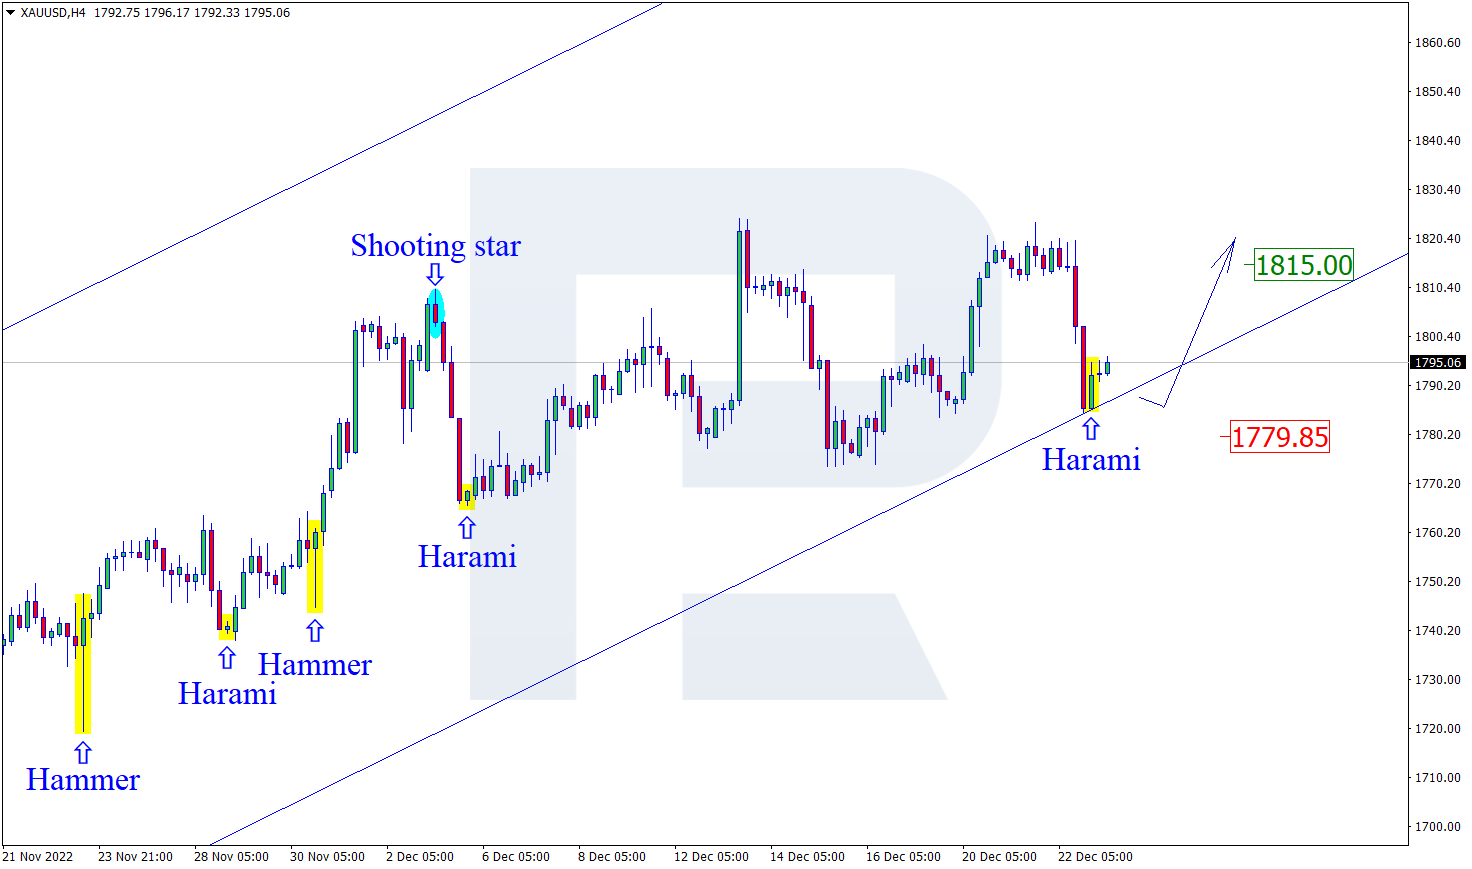
At the support level, gold has formed a Harami reversal pattern. Currently, the pair can go by the pattern in an ascending wave. The goal of the growth might be the resistance level of 1830.50. After the test of the resistance level, the pair can break through it and continue the uptrend. However, the quotes may pull back to 1800.00 before further growth.

XAUUSD
Risk Warning: the result of previous trading operations do not guarantee the same results in the future

NZDUSD, “New Zealand Dollar vs US Dollar”

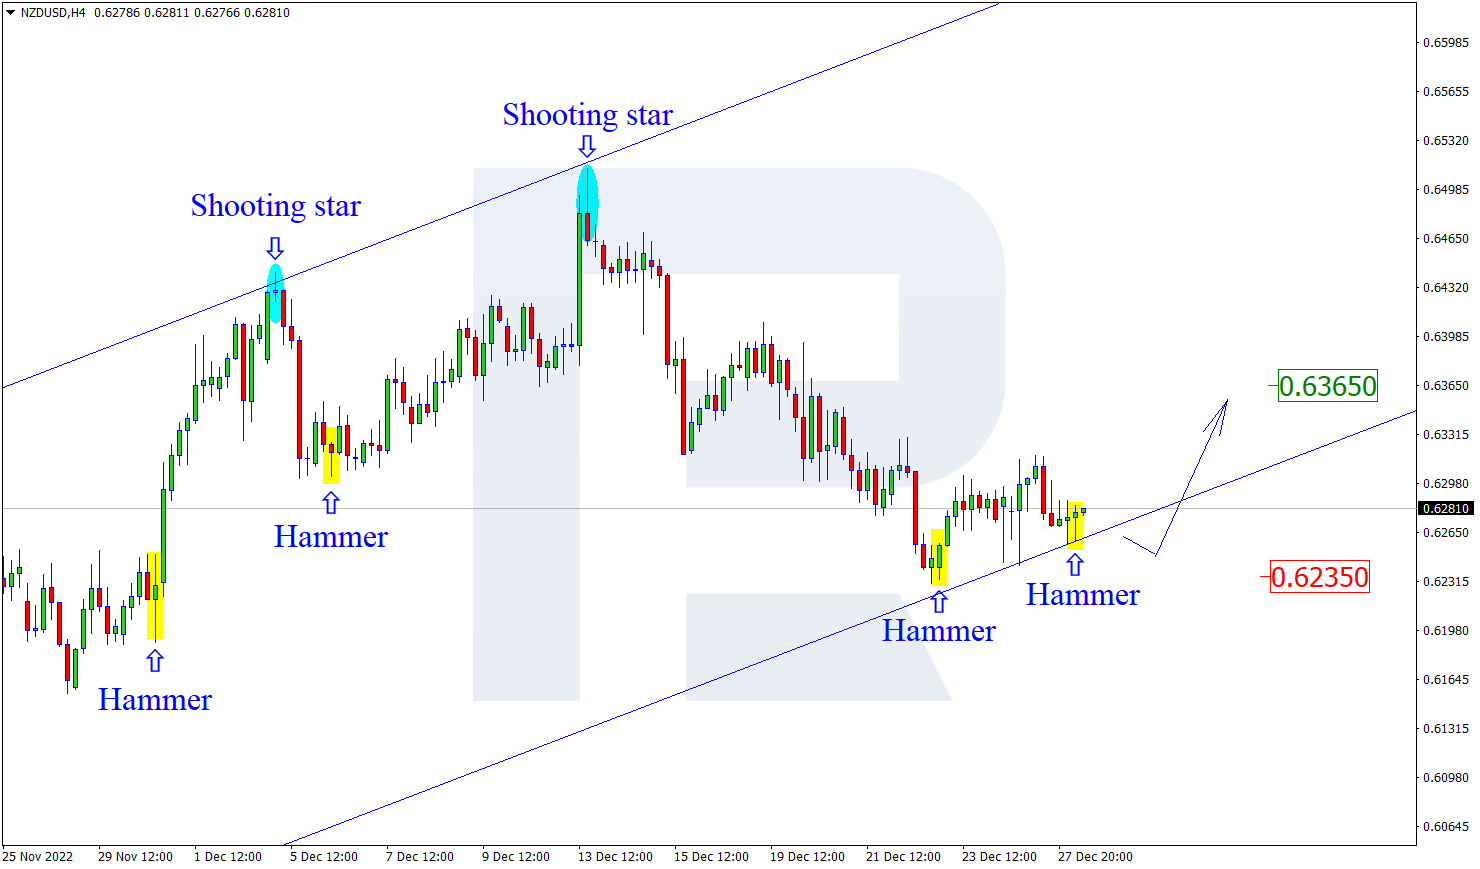
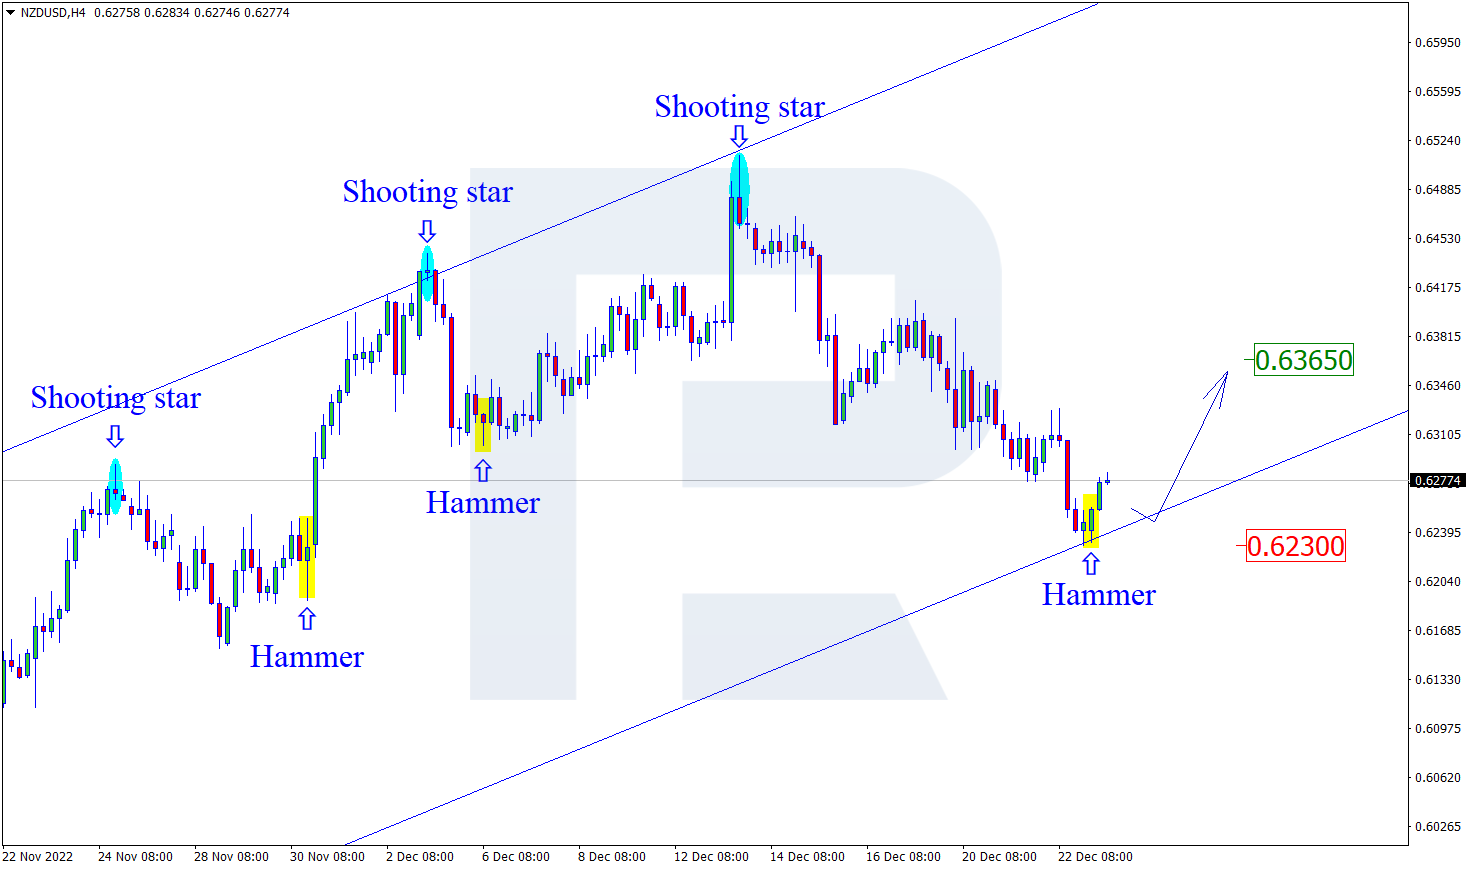
On H4, at the support level, the pair has formed a Hammer reversal pattern. The pair may now go by the signal in an ascending wave. The goal of the growth might be 0.6365. After a breakaway of the resistance, the quotes may get a chance for continuing the uptrend. However, the price may pull back to 0.6235 before further growth.

NZDUSD
Risk Warning: the result of previous trading operations do not guarantee the same results in the future

GBPUSD, “Great Britain Pound vs US Dollar”

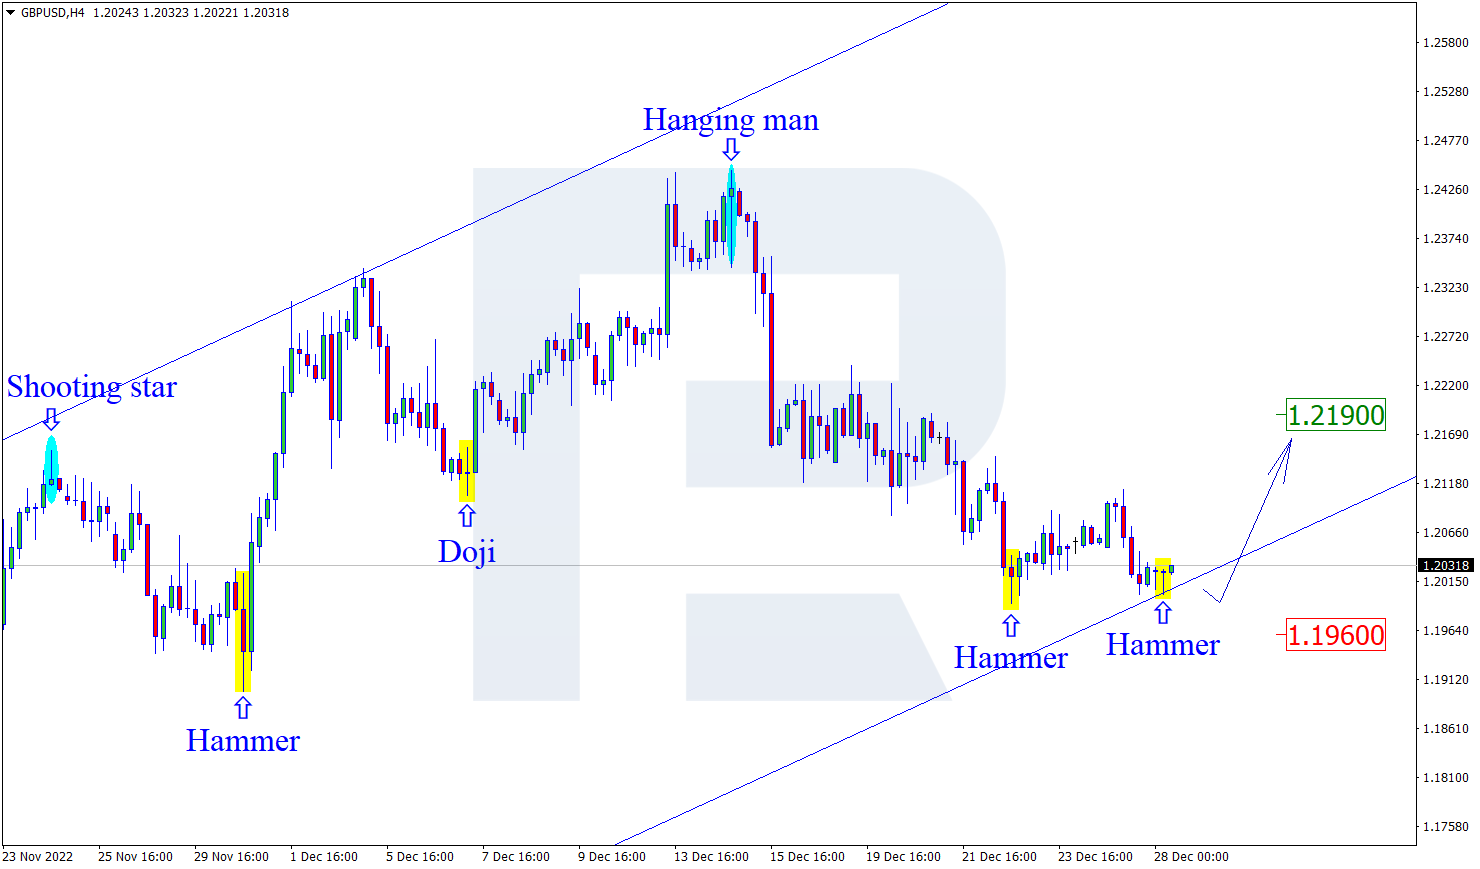
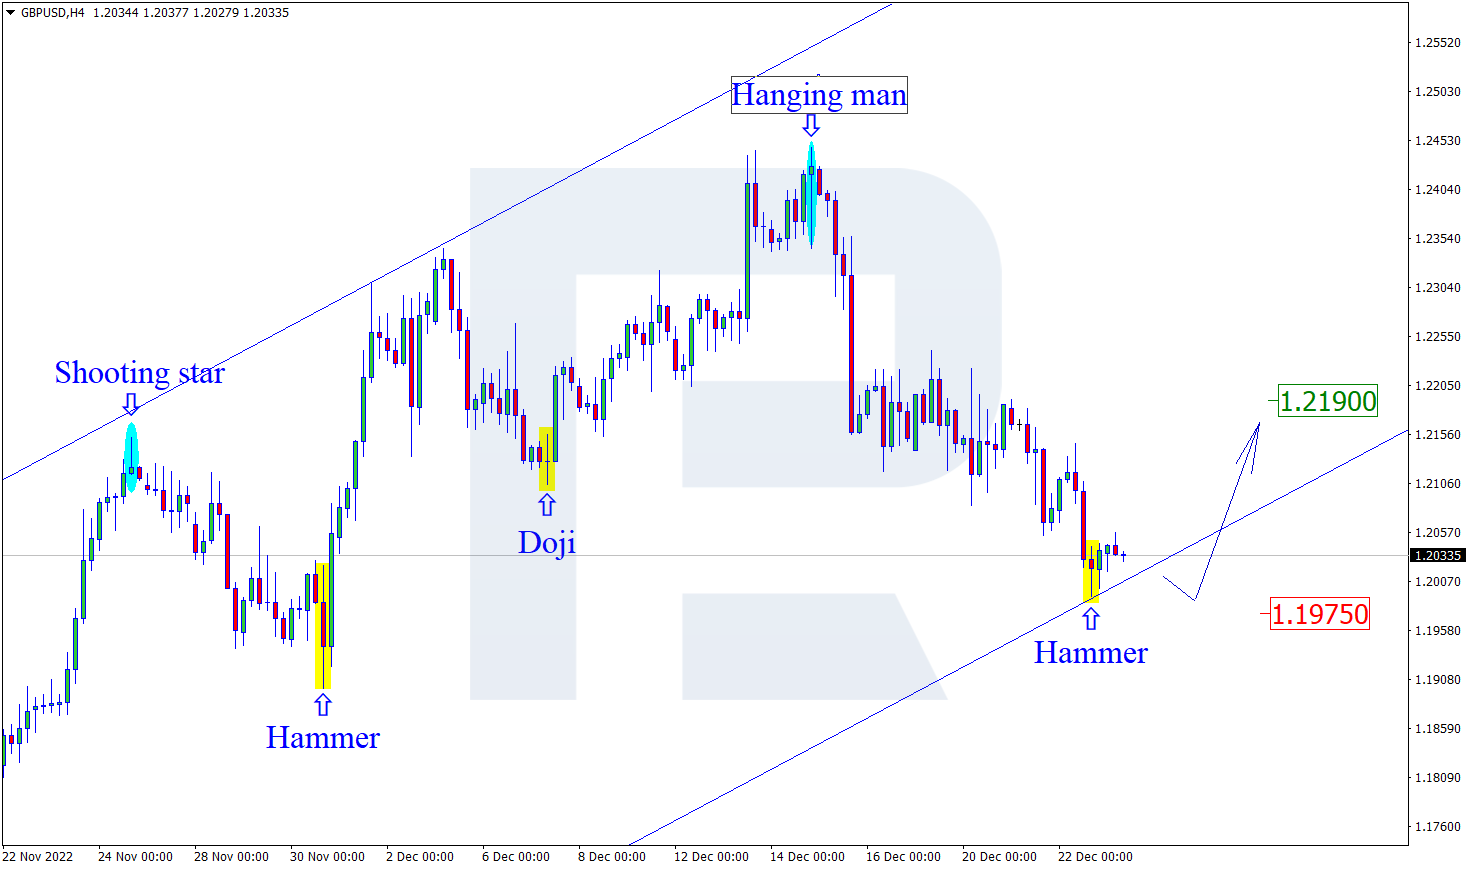
On H4, at the support level, the pair has formed a Hammer reversal pattern. Currently, the pair may go by the signal in an ascending wave. The goal of the growth is still the resistance level of 1.2190. However, the price may pull back to 1.1960 before continuing the uptrend.

GBPUSD

Article By RoboForex.com

Attention!
Forecasts presented in this section only reflect the author’s private opinion and should not be considered as guidance for trading. RoboForex LP bears no responsibility for trading results based on trading recommendations described in these analytical reviews.

The Analytical Overview of the Main Currency Pairs on 2022.12.27

By JustMarkets

The EUR/USD currency pair

Technical indicators of the currency pair:
  • Prev Open: 1.0592
  • Prev Close: 1.0615
  • % chg. over the last day: +0.22 %

This is the last trading week of the year. With many investors closing their books for the year and many traders and managers going on vacation, liquidity will be less than usual. This means the markets may move sharply without any news. The dollar fell against most currencies in trading Friday as recent data signaled that the US Personal Consumption Index (PCE) is slowing, reinforcing expectations for a smaller interest rate hike by the Federal Reserve and improving investors’ appetite for risk. The Fed is expected to raise interest rates by only 25 basis points at its next meeting.

Trading recommendations
  • Support levels: 1.0549, 1.0483, 1.0361, 1.0332, 1.0284, 1.0193
  • Resistance levels: 1.0667, 1.0695

The trend on the EUR/USD currency pair on the hourly time frame is bullish. The price is forming a price corridor. The price is forming a wide price corridor. The MACD indicator has become positive, and buyers are again dominating inside the day. Under such market conditions, buy trades are best considered from support levels on intraday time frames, but with additional confirmation. Sell deals can be considered from the resistance level of 1.0667, but better with a confirmation in the form of a reverse initiative or a false breakout.

Alternative scenario: if the price breaks down through the support level of 1.0549 and fixes below it, the downtrend will likely resume.

EUR/USD
There is no news feed for today.

The GBP/USD currency pair

Technical indicators of the currency pair:
  • Prev Open: 1.2025
  • Prev Close: 1.2046
  • % chg. over the last day: +0.17 %

A turbulent year for the British pound is coming to an end, and there are a few signs that 2023 will be optimistic. Signs of a painful economic downturn in the UK continue to accumulate, making analysts doubt whether the pound can extend or even sustain its recent rebound against the dollar. The options market is also showing skepticism, with traders still bearish on the long-term outlook. Yield spreads between two- and 10-year swaps tied to the overnight rate, an indicator of recession risks, also point to a longer recession in the UK than in other major economies. Analysts at JPMorgan Chase & Co. predict that the pound will return to $1.14 by the end of the first quarter of 2023.

Trading recommendations
  • Support levels: 1.2044, 1.1979, 1.1684, 1.1476, 1.1418
  • Resistance levels: 1.2093, 1.2218, 1.2308, 1.2431, 1.2519

From the technical point of view, the trend on the GBP/USD currency pair on the hourly time frame has changed to bearish. The MACD indicator has become positive, but the buyers’ pressure is quite weak. On the other hand, the price managed to return above the moving averages. Under such market conditions, it is better to look for buy trades from the support at 1.2044, but with confirmation on the intraday time frames. Sell trades are best sought from the resistance level of 1.2093, but also better with confirmation.

Alternative scenario: if the price breaks out through the 1.2308 resistance level and fixes above it, the uptrend will likely resume.

GBP/USD
There is no news feed for today.

The USD/JPY currency pair

Technical indicators of the currency pair:
  • Prev Open: 132.67
  • Prev Close: 132.77
  • % chg. over the last day: +0.07 %

The market is still dominated by news of the Bank of Japan’s upward revision to its yield curve control policy, which has given a significant boost to the yen and brought short yen futures positions to their lowest level since August. But Bank of Japan (BOJ) Governor Haruhiko Kuroda said on Monday that the BOJ’s decision last week to widen the permissible range around its yield target was intended to reinforce the effect of its ultra-soft policy, not a first step toward canceling a massive stimulus program, and the bank would aim for sustained and stable price targets accompanied by wage increases while continuing to ease monetary policy under yield curve control. Such a statement may return the USD/JPY currency pair bullish as the interest rate differential is not in favor of the yen.

Trading recommendations
  • Support levels: 132.27, 131.22
  • Resistance levels: 133.53, 134.73, 135.88, 137.03, 138.00, 139.09

From the technical point of view, the medium-term trend on the currency pair USD/JPY is bearish. The MACD indicator has become inactive, and a narrow price range in the form of a “wedge” pattern is being formed. During the day, there is a slight buyers’ pressure. Buy trades are best considered on intraday time frames from the support level of 132.27, but only with confirmation. Sell deals can be looked for from the resistance level of 133.53, provided there is a reverse reaction.

Alternative scenario: If the price fixes above 137.00, the uptrend will likely resume.

USD/JPY
News feed for 2022.12.27:
  • – Japan Unemployment Rate (m/m) at 01:30 (GMT+2);
  • – Japan Retail Sales (m/m) at 01:30 (GMT+2).

The USD/CAD currency pair

Technical indicators of the currency pair:
  • Prev Open: 1.3651
  • Prev Close: 1.3594
  • % chg. over the last day: -0.42 %

Canada’s GDP grew by 0.1% over the last month. On the one hand, the economy is still on a growth trajectory. On the other hand, there are signs of a slowdown in GDP growth over the last 3 months. It is highly likely that Canada’s Central Bank will continue to raise the cost of borrowing (interest rate) but will become more “dovish” so as not to hurt the economy too much. Analysts expect a 0.25% rate hike at the next meeting, after which the bank is likely to pause for a few months. The strengthening of the Canadian dollar in recent days is due to rising oil prices.

Trading recommendations
  • Support levels: : 1.3521, 1.3438, 1.3386, 1.3360, 1.3281, 1.3212
  • Resistance levels: : 1.3590, 1.3656, 1.3700, 1.3776, 1.3855

From the point of view of technical analysis, the trend on the USD/CAD currency pair has changed to bullish. But the MACD indicator is in the negative zone, and sellers dominate within the day. Yesterday, the price consolidated below the moving averages, which increases the probability of a change in the trend. Buy trades should be considered from the support at 1.3522, but with a confirmation in the form of a reverse initiative. Sells are best to look for on intraday time frames from the resistance level of 1.3590, but with confirmation in the form of a reverse initiative on the lower time frames.

Alternative scenario: if the price breaks down and consolidates below the support level of 1.3386, the downtrend will likely resume.

USD/CAD
There is no news feed for today.

By JustMarkets


This article reflects a personal opinion and should not be interpreted as an investment advice, and/or offer, and/or a persistent request for carrying out financial transactions, and/or a guarantee, and/or a forecast of future events.

Japanese Candlesticks Analysis 23.12.2022 (XAUUSD, NZDUSD, GBPUSD)

By RoboForex.com

XAUUSD, “Gold vs US Dollar”

At the support level, gold has formed a Harami reversal pattern. Currently, the pair is going by the pattern in an ascending wave. The goal of the growth might be 1815.00. Upon testing the resistance level, the pair will get the chance to break through it and continue the uptrend. However, the quotes may pull back to 1779.85 before further growth.

XAUUSD
Risk Warning: the result of previous trading operations do not guarantee the same results in the future

NZDUSD, “New Zealand Dollar vs US Dollar”

On H4, at the support level, the pair has formed a Hammer reversal pattern. Currently, the pair is going by the signal in an ascending wave. The goal of the growth might be 0.6365. After the resistance level is broken away, the quotes will get a chance to continue the downtrend. However, the price may pull back to 0.6230 before continuing growth.

NZDUSD
Risk Warning: the result of previous trading operations do not guarantee the same results in the future

GBPUSD, “Great Britain Pound vs US Dollar”

On H4, at the support level, the pair has formed a Hammer reversal pattern. Currently, the pair is going by the signal in an ascending wave. The goal if the growth might be the resistance level at 1.2190. However, the price may pull back to 1.1975 before continuing with the uptrend.

GBPUSD

Article By RoboForex.com

Attention!
Forecasts presented in this section only reflect the author’s private opinion and should not be considered as guidance for trading. RoboForex LP bears no responsibility for trading results based on trading recommendations described in these analytical reviews.

The Analytical Overview of the Main Currency Pairs on 2022.12.23

By JustMarkets

The EUR/USD currency pair

Technical indicators of the currency pair:
  • Prev Open: 1.0604
  • Prev Close: 1.0597
  • % chg. over the last day: -0.07 %

Yesterday, US GDP data showed that the US economy increased by 3.2%, higher than the expected 2.9%. This brought back some investor fears about an interest rate hike. The important indicator today will come from the major PCE prices, where a rise in the numbers could put some hawkish pressure back on the markets, causing the dollar index to rise again (EUR/USD to fall). Low liquidity over the holiday period could lead to stronger moves if economic data is significantly different from estimates.

Trading recommendations
  • Support levels: : 1.0549, 1.0483, 1.0361, 1.0332, 1.0284, 1.0193
  • Resistance levels: 1.0632, 1.0647, 1.0695

The trend on the EUR/USD currency pair on the hourly time frame is bullish. The price is forming a price corridor. The MACD indicator has become negative, and sellers’ pressure prevails throughout the day. Under such market conditions, buy trades are best considered from the support level of 1.0549 but with additional confirmation. Sell deals can be considered from the resistance level of 1.0632, but it is better with a confirmation in the form of a reverse initiative or false breakout because the level has already been tested.

Alternative scenario: if the price breaks down through the support level of 1.0446 and fixes below it, the downtrend will likely resume.

EUR/USD
News feed for 2022.12.23:
  • – US Core Durable Goods Orders (m/m) at 15:30 (GMT+2);
  • – US PCE Price index (m/m) at 15:30 (GMT+2);
  • – US Michigan Consumer Sentiment (m/m) at 17:00 (GMT+2);
  • – US New Home Sales (m/m) at 17:00 (GMT+2).

The GBP/USD currency pair

Technical indicators of the currency pair:
  • Prev Open: 1.2074
  • Prev Close: 1.2039
  • % chg. over the last day: -0.29 %

In UK GDP revised downward, the actual value is 0.3%. Most services sub sectors showed a slowdown, but output rose by 0.1% in Q3 2022. With the dollar index rising, GBP/USD quotes have declined, and this trend could continue if PCE data today does not point to a slowdown, which could trigger a drop in the dollar index and a rise in GBP/USD quotes.

Trading recommendations
  • Support levels: 1.1979, 1.1684, 1.1476, 1.1418
  • Resistance levels: 1.2091, 1.2218, 1.2308, 1.2431, 1.2519

From the technical point of view, the trend on the GBP/USD currency pair on the hourly time frame is bullish. Yesterday, the price tested the priority change level but failed to consolidate higher. A false breakdown area was formed. The MACD indicator has become inactive, and the volatility on the threshold of the holidays is low. Under such market conditions, it is better to look for buy trades from the support level at 1.2092 but with a confirmation at the intraday time frames. Sell trades are best sought from the resistance level of 1.2218 but also better with confirmation.

Alternative scenario: if the price breaks down from the 1.2092 support level and fixes below it, the downtrend will likely resume.

GBP/USD
There is no news feed for today.

The USD/JPY currency pair

Technical indicators of the currency pair:
  • Prev Open: 132.40
  • Prev Close: 132.36
  • % chg. over the last day: -0.03 %

The Bank of Japan surprised investors this week with a change in its Yield Curve Control Policy (YCC). This caused a moderate sell-off in Japanese bonds: the yield on Japan’s 10-year government bonds (JGBs) rose 15 basis points. And this is still having an effect on financial markets and the Japanese yen in particular. New inflation data showed that consumer prices (excluding food energy prices) rose from 3.6% to 3.7% on an annualized basis, the highest level since 1981.

Trading recommendations
  • Support levels: 132.16, 131.22
  • Resistance levels: 133.53, 134.73, 135.88, 137.03, 138.00, 139.09

From the technical point of view, the medium-term trend on the currency pair USD/JPY is bearish. The MACD indicator has become inactive, and a narrow price range in the form of a “wedge” pattern is being formed. During the day, there is a slight buyers’ pressure. Buy trades are best considered on intraday time frames from the support level of 132.16, but only with confirmation. Sell deals can be looked for from the resistance level of 133.53, provided there is a reverse reaction.

Alternative scenario: If the price fixes above 137.00, the uptrend will likely resume.

USD/JPY
News feed for 2022.12.23:
  • – Japan National Core CPI (m/m) at 01:30 (GMT+2);
  • – Japan Monetary Policy Meeting Minutes at 01:50 (GMT+2).

The USD/CAD currency pair

Technical indicators of the currency pair:
  • Prev Open: 1.3606
  • Prev Close: 1.3645
  • % chg. over the last day: +0.28 %

The Canadian dollar is a commodity currency and is highly dependent not only on the monetary policy of the Bank of Canada but also on oil prices. The oil prices decreased yesterday while the dollar index went up, which eventually led to the growth of the USD/CAD. China reiterated its focus on boosting economic growth in 2023, which helped revise the impact of demand for crude oil upwards. Increased demand for oil with limited supply is helping oil prices and the Canadian dollar to strengthen.

Trading recommendations
  • Support levels: 1.3590, 1.3521, 1.3438, 1.3386, 1.3360, 1.3281, 1.3212
  • Resistance levels: 1.3656, 1.3700, 1.3776, 1.3855

From the point of view of technical analysis, the trend on the USD/CAD currency pair has changed to bullish. The MACD indicator is in the positive zone, but inside the day, there is a weakness of the buyers. Yesterday, the price made a false breakout of the level 1.3656 resistance level, which will now serve as a sell zone. Buy trades should be considered from the support of 1.3590 but with a confirmation in the form of a reversal. Sell deals are best to look for on intraday time frames from the resistance level of 1.3656, but with confirmation in the form of a reverse initiative on the lower time frames.

Alternative scenario: if the price breaks down and consolidates below the support level of 1.3386, the downtrend will likely resume.

USD/CAD
News feed for 2022.12.23:
  • – Canada GDP (m/m) at 15:30 (GMT+2).

By JustMarkets


This article reflects a personal opinion and should not be interpreted as an investment advice, and/or offer, and/or a persistent request for carrying out financial transactions, and/or a guarantee, and/or a forecast of future events.

Murrey Math Lines 22.12.2022 (USDCHF, XAUUSD)

By RoboForex.com

USDCHF, “US Dollar vs Swiss Franc”

On H4, the quotes are in the oversold area. The RSI is testing the support level. The quotes are expected to break through 0/8 (0.9277) and grow to the resistance level of 1/8 (0.9399). The scenario can be cancelled by a downward breakaway of the support level of -1/8 (0.9155), in which case the pair may drop to -2/8 (0.9033).

USDCHFH4
Risk Warning: the result of previous trading operations do not guarantee the same results in the future

On M15, an additional signal confirming the growth will be a breakaway of the upper line of VoltyChannel.

USDCHF_M15
Risk Warning: the result of previous trading operations do not guarantee the same results in the future

XAUUSD, “Gold vs US Dollar”

On H4, the quotes are above the 200-day Moving Average, which indicates the prevalence of an uptrend. The RSI is nearing the overbought area. As a result, the quotes are expected to growth to the nearest resistance level of 7/8 (1843.75). The scenario can be cancelled by a downward breakaway of the support level of 6/8 (1812.50). This may drive the price down to 5/8 (1781.25).

USDCAD_H4
Risk Warning: the result of previous trading operations do not guarantee the same results in the future

On M15, the upper line of VoltyChannel is broken, which confirms the uptrend and increases the probability of price growth.

USDCAD_M15

Article By RoboForex.com

Attention!
Forecasts presented in this section only reflect the author’s private opinion and should not be considered as guidance for trading. RoboForex LP bears no responsibility for trading results based on trading recommendations described in these analytical reviews.

Ichimoku Cloud Analysis 22.12.2022 (EURUSD, USDJPY, GBPUSD)

By RoboForex.com

EURUSD, “Euro vs US Dollar”

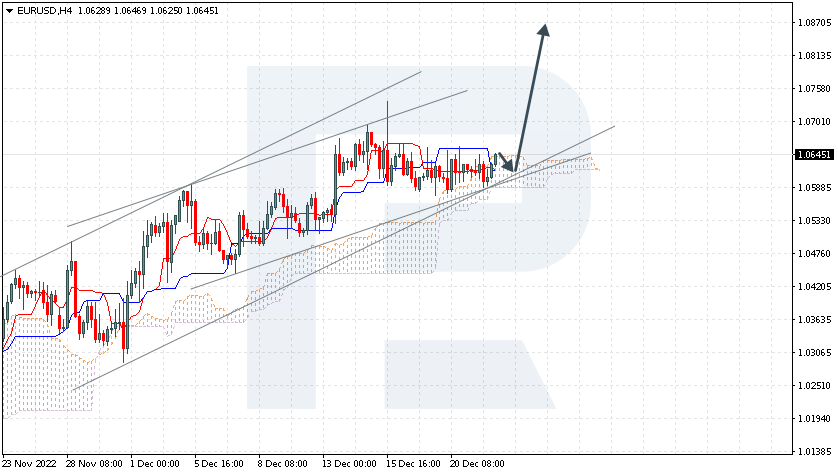
The currency pair is growing inside a bullish channel. The instrument is going above the Ichimoku Cloud, which suggests an uptrend. A test of the lower border of the Cloud at 1.0595 is expected, followed by growth to 1.0870. An additional signal confirming the decline will be a bounce off the lower border of the bullish channel. The scenario can be cancelled by a breakaway of the lower border of the Cloud and securing under 1.0535, which will mean further falling to 1.0445.

EURUSD
Risk Warning: the result of previous trading operations do not guarantee the same results in the future

USDJPY, “US Dollar vs Japanese Yen”

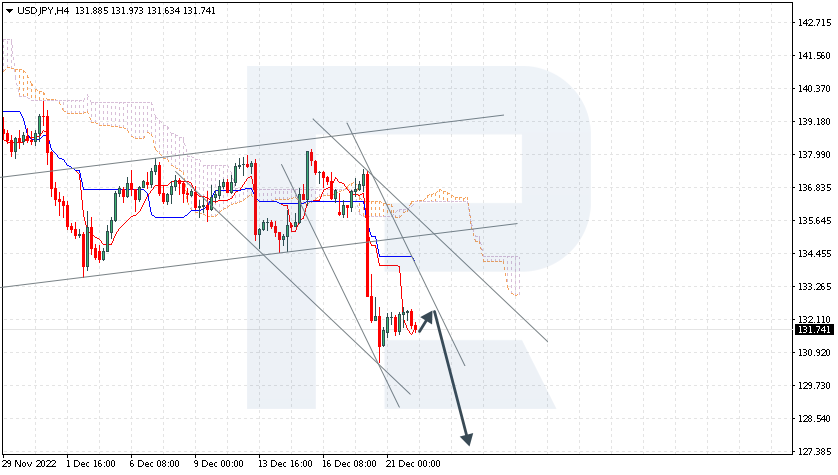
The currency pair is testing the signal lines of the indicator. The instrument is going below the Ichimoku Cloud, which suggests a downtrend. A test of the Tenkan-Sen line at 132.15 is expected, followed by falling to 127.45. An additional signal confirming the decline will be a bounce off the upper border of the descending channel. The scenario can be cancelled by a breakaway of the upper border of the Cloud and securing above 135.55, which will mean further growth to 136.45.

USDJPY
Risk Warning: the result of previous trading operations do not guarantee the same results in the future

GBPUSD, “Great Britain Pound vs US Dollar”

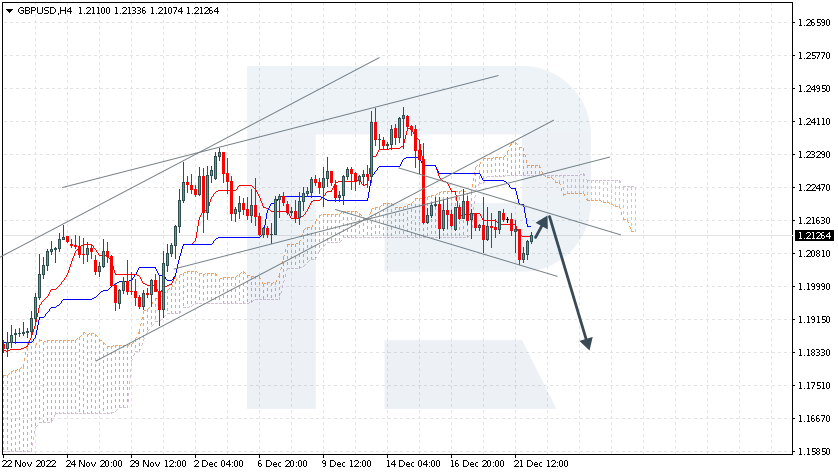
The pair is pushing off the support line. The instrument is going below the Ichimoku Cloud, which suggests a downtrend. A test of the Kijun-Sen line at 1.2165 is expected, followed by falling to 1.1835. An additional signal confirming the decline will be a bounce off the lower border of the bullish channel. The scenario can be cancelled by a breakaway of the upper border of the Cloud and securing above 1.2335, which will mean further growth to 1.2425.

GBPUSD

Article By RoboForex.com

Attention!
Forecasts presented in this section only reflect the author’s private opinion and should not be considered as guidance for trading. RoboForex LP bears no responsibility for trading results based on trading recommendations described in these analytical reviews.

The Analytical Overview of the Main Currency Pairs on 2022.12.22

By JustMarkets

The EUR/USD currency pair

Technical indicators of the currency pair:
  • Prev Open: 1.0624
  • Prev Close: 1.0603
  • % chg. over the last day: -0.19 %

The Conference Board Consumer Confidence Index in the US jumped to 108.3 from 101.4, beating economists’ forecast of 101.0. The rise in consumer sentiment has eased fears of a US recession. Investors are now waiting for US GDP data for the latest quarter and data on the PCE Index, which is among the US Federal Reserve’s monitored inflation indicators. Growing inflationary pressures may bring panic moods back to the market, which will cause EUR/USD quotes to fall against the background of the dollar’s strengthening.

Trading recommendations
  • Support levels: 1.0549, 1.0483, 1.0361, 1.0332, 1.0284, 1.0193
  • Resistance levels: 1.0647, 1.0695

The trend on the EUR/USD currency pair on the hourly time frame is bullish. The price is forming a price corridor. The MACD indicator became positive. Inside the day, purchases prevail. Under such market conditions, buy trades are best considered from the moving averages but with additional confirmation. Sell deals can be considered from the resistance level of 1.0647, but it is better with confirmation in the form of a reverse initiative or false breakout because the level has already been tested.

Alternative scenario: if the price breaks down through the support level of 1.0446 and fixes below it, the downtrend will likely resume.

EUR/USD
News feed for 2022.12.22:
  • – US GDP (q/q) at 15:30 (GMT+2);
  • – US Initial Jobless Claims (w/w) at 15:30 (GMT+2).

The GBP/USD currency pair

Technical indicators of the currency pair:
  • Prev Open: 1.2171
  • Prev Close: 1.2082
  • % chg. over the last day: -0.74 %

Today, the UK will release GDP data for the last quarter of 2022. Analysts are predicting that the economy will contract by 0.2%, which will be the second quarter of decline, which will mean a technical recession. The UK’s economic outlook remains murky: record inflation, the energy crisis, and strikes suggest that economic indicators will decline throughout the winter.

Trading recommendations
  • Support levels: 1.2091, 1.2177, 1.2024, 1.1964, 1.1684, 1.1476, 1.1418
  • Resistance levels: 1.2218, 1.2308, 1.2431, 1.2519

From the technical point of view, the trend on the GBP/USD currency pair on the hourly time frame is bullish. Yesterday, the price tested the priority change level but failed to consolidate higher. A false breakdown area was formed. The MACD indicator has become inactive, and the volatility on the threshold of the holidays is low. Under such market conditions, it is better to look for buy trades from the support level at 1.2092 but with a confirmation at the intraday time frames. Sell trades are best sought from the resistance level of 1.2218 but also better with confirmation.

Alternative scenario: if the price breaks down from the 1.2092 support level and fixes below it, the downtrend will likely resume.

GBP/USD
News feed for 2022.12.22:
  • – UK GDP (q/q) at 09:00 (GMT+2).

The USD/JPY currency pair

Technical indicators of the currency pair:
  • Prev Open: 131.51
  • Prev Close: 132.45
  • % chg. over the last day: +0.71 %

Japan is the world’s largest holder of US Treasuries outside the United States, and benchmark 10-year bond yields rose about 13 basis points in two sessions following the Bank of Japan’s decision. Investors are shorting yen positions and selling them in bond markets around the world. According to analysts, the sale of Japanese bonds could trigger a panicked influx of cash back into Japan, but so far, this is not happening. The overall fundamental picture is starting to change and comes down to expectations that the Bank of Japan will join other central banks in tightening monetary policy next year.

Trading recommendations
  • Support levels: 131.22
  • Resistance levels: 133.53, 134.73, 135.88, 137.03, 138.00, 139.09

From the technical point of view, the medium-term trend on the currency pair USD/JPY is bearish. The MACD indicator has become inactive, forming a narrow price range. It is better to look for buy trades on intraday time frames from the support level of 131.22, but only with confirmation. Sell deals can be looked for from the resistance level of 133.53, provided that there is a reverse reaction.

Alternative scenario: If the price fixes above 137.00, the uptrend will likely resume.

USD/JPY
There is no news feed for today.

The USD/CAD currency pair

Technical indicators of the currency pair:
  • Prev Open: 1.3610
  • Prev Close: 1.3612
  • % chg. over the last day: +0.01 %

Yesterday, new inflation data was released in Canada. The report showed that year-over-year consumer prices fell from 6.9% to 6.8%, while core inflation (which excludes food and energy prices) remained at 5.8% y/y. The key point is that the main components of core price pressures have shown an upward trend, and core inflation remains well above the Bank of Canada’s target, keeping the likelihood of a rate hike at the January meeting high.

Trading recommendations
  • Support levels: 1.3590, 1.3521, 1.3438, 1.3386, 1.3360, 1.3281, 1.3212
  • Resistance levels: 1.3656, 1.3700, 1.3776, 1.3855

From the point of view of technical analysis, the trend on the USD/CAD currency pair has changed to bullish. But the price is trading below the moving averages, and the MACD indicator is negative, indicating selling pressure inside the day. At the same time, volatility is decreasing in anticipation of the holidays. Buy trades should be considered from the support level of 1.3590, but with a confirmation in the form of a reversal, currently, there is none. Sell deals are best to look for on the intraday time frames from the resistance level of 1.3656, but with a confirmation in the form of a reverse initiative or after a false breakout, since the level has already been tested.

Alternative scenario: if the price breaks down and consolidates below the support level of 1.3386, the downtrend will likely resume.

USD/CAD
There is no news feed for today.

By JustMarkets


This article reflects a personal opinion and should not be interpreted as an investment advice, and/or offer, and/or a persistent request for carrying out financial transactions, and/or a guarantee, and/or a forecast of future events.