The GBPUSD on the D1 time frame was in a prolonged uptrend until 14 December when a last higher top was recorded at 1.24454.
A closer look at the Momentum Oscillator reveals a negative divergence between points “a” and “b” when comparing the tops at 1.23435 and 1.24454. This could have warned technical traders that the bullish trend was losing momentum.
After the higher top at 1.24454, the price dropped through the 15 and 34 Simple Moving Averages and the Momentum Oscillator followed suit by moving into bearish terrain. This confirmed that the bears are making their presence felt.
A possible critical support level formed when a lower bottom was recorded on 3 January at 1.18998. The bulls are currently trying to press the price higher but a resistance level that formed on 28 December at 1.21254 might exert its influence on the market.
If the price of GBPUSD breaks through the critical support level at 1.18998, then three possible price targets may be projected from there. Attaching the Fibonacci tool to the lower bottom at 1.18998, and dragging it to the resistance level at 1.21254, the following targets may be anticipated. The first target can be estimated at 1.17604 (161.8%). The second price target may be calculated at 1.15348 (261.8%) and the third and final target can be expected at 1.11698 (423.6%).
If the resistance level at 1.21254 is broken, the above scenario is no longer valid and must be reassessed.
As long as sellers maintain their negative sentiment and supply continues overcoming demand, the outlook for the GBPUSD currency pair will remain bearish.
Preliminary data showed that inflation in Germany slowed to an annualized rate of 8.6% in December from 10% as one-time government payments came into effect to help consumers pay their heating and gas bills. In recent months, many German unions have successfully advocated above-average wage increases to offset the impact of inflation. Meanwhile, unemployment rates in Europe’s largest economy rose slightly in December to 2.45 million, or 5.5%.
Trading recommendations
Support levels: 1.0528, 1.0483, 1.0361, 1.0332, 1.0284, 1.0193
Resistance levels: 1.0612, 1.0664, 1.0695
The EUR/USD currency pair trend on the hourly time frame is still bullish. The price is still trading in a wide price corridor. The MACD indicator has become negative. Volatility remains low. Under such market conditions, buy trades are best considered from the support level of 1.0638 on intraday time frames. Sell deals can be considered from the resistance level of 1.0689, but better with confirmation in the form of a reverse initiative or a false breakout since the level has already been tested.
Alternative scenario: if the price breaks down through the support level of 1.0549 and fixes below it, the downtrend will likely resume.
News feed for 2023.01.04:
– French Consumer Price index (m/m) at 09:45 (GMT+2);
– Spanish Services PMI (m/m) at 10:00 (GMT+2);
– Italian Services PMI (m/m) at 10:45 (GMT+2);
– French Services PMI (m/m) at 10:50 (GMT+2);
– Germany Services PMI (m/m) at 10:55 (GMT+2);
– Eurozone Services PMI (m/m) at 11:00 (GMT+2);
– US ISM Manufacturing PMI (m/m) at 17:00 (GMT+2);
– US JOLTs Job Openings (m/m) at 17:00 (GMT+2);
– US FOMC minutes at 21:00 (GMT+2).
The GBP/USD currency pair
Technical indicators of the currency pair:
Prev Open: 1.2042
Prev Close: 1.1966
% chg. over the last day: -0.64 %
The UK manufacturing sector ended 2022 on a weak footing, with output, new orders, and employment declining faster. Domestic and foreign demand remained lackluster as customers faced rising costs, increased market volatility, and Brexit-related complications. The seasonally adjusted Purchasing Managers’ Index for the UK manufacturing sector fell to a 31-month low of 45.3 in December, down from 46.5 in November. The PMI has remained below the neutral 50.0 mark for five months in a row. All five PMI sub-indices point to a weakening operating environment for the UK manufacturing economy.
From the technical point of view, the trend on the GBP/USD currency pair on the hourly time frame is bearish. The MACD indicator is in the negative zone, but there is a divergence on several timeframes, indicating a limited further decline. Under such market conditions, buy trades are better to look for on intraday time frames from the support level of 1.1893, but with confirmation. Sell trades are best sought from the resistance level of 1.2056 but also better with confirmation.
Alternative scenario: if the price breaks out through the 1.2100 resistance level and fixes above it, the uptrend will likely resume.
There is no news feed for today.
The USD/JPY currency pair
Technical indicators of the currency pair:
Prev Open: 130.77
Prev Close: 130.97
% chg. over the last day: +0.16 %
The Japanese yen rose to a seven-month high against the US dollar on Tuesday, crossing the 130 mark. The strengthening of the yen was triggered by the Bank of Japan’s (BOJ) decision to loosen control over the yield curve and allow holders of certain government bonds to move within a wider range. The US Federal Reserve and other central banks are seeking to slow the pace of interest rate hikes, while the BOJ will only begin to move toward policy normalization this year. Analysts believe the first half of 2023 may pass under the strengthening of the Japanese yen.
From the technical point of view, the medium-term trend on the currency pair USD/JPY is bearish. The price is now trading at the level of the moving averages, while the MACD indicator has become inactive, but the divergence on several time frames indicates that further decline is limited. Buy trades are best considered on intraday time frames from the support level of 129.65, but only with confirmation. Sell deals be looked at from the resistance level of 132.92, provided there is a reversal.
Alternative scenario: If the price fixes above 133.58, the uptrend will likely resume.
News feed for 2023.01.04:
– Japan Manufacturing PMI (m/m) at 02:30 (GMT+2).
The USD/CAD currency pair
Technical indicators of the currency pair:
Prev Open: 1.3569
Prev Close: 1.3668
% chg. over the last day: +0.72 %
Canada’s manufacturing economy remains in a moderate contraction zone, characterized by further declines in production, new orders, and buying activity. The seasonally adjusted Manufacturing PMI registered 49.2 in December, down from 49.6 in November and below the 50.0 mark for the fifth consecutive month. This is the longest decline since August 2015. The main reason for the decline is a drop in new orders due to continuing high inflation and uncertainty in sales.
Trading recommendations
Support levels: 1.3627, 1.3570, 1.3530, 1.3437, 1.3386, 1.3360, 1.3281, 1.3212
Resistance levels: 1.3700, 1.3776, 1.3855
From the point of view of technical analysis, the trend on the USD/CAD currency pair is bullish. The price is trading above the moving averages and forming provocation zones along the move, which do not allow the price to go down. The MACD indicator is in the positive zone. Within the day, buying prevails. Buy trades should be considered from the support at 1.3570, but with confirmation. Sell deals are better to look for on the intraday time frames from the resistance level of 1.3700, but with a confirmation in the form of a reverse initiative on the lower time frames or a false breakout, since the level has already been tested.
Alternative scenario: if the price breaks down and consolidates below the support level of 1.3529, the downtrend will likely resume.
This article reflects a personal opinion and should not be interpreted as an investment advice, and/or offer, and/or a persistent request for carrying out financial transactions, and/or a guarantee, and/or a forecast of future events.
The ECB is expected to go against the trend of most other major central banks early this year and continue its aggressive pace of rate hikes, even though inflationary pressures across Europe are forecast to ease this week. The ECB was the last of the big central banks to start raising rates, which means Europe’s Central Bank has more “room” to continue tightening. Moreover, the index of business activity in the manufacturing sector indicates that the European industry has already adapted to high prices, the recession in manufacturing activity in the euro area is probably over, and supply chains are recovering.
Trading recommendations
Support levels: 1.0638, 1.0589, 1.0483, 1.0361, 1.0332, 1.0284, 1.0193
Resistance levels: 1.0689
The EUR/USD currency pair trend on the hourly time frame is still bullish. The price is still trading in a wide price corridor. The MACD indicator has become negative. Volatility remains low. Under such market conditions, buy trades are best considered from the support level of 1.0638 on intraday time frames. Sell deals can be considered from the resistance level of 1.0689, but better with confirmation in the form of a reverse initiative or a false breakout since the level has already been tested.
Alternative scenario: if the price breaks down through the support level of 1.0549 and fixes below it, the downtrend will likely resume.
News feed for 2023.01.02:
– German Unemployment Rate (m/m) at 10:55 (GMT+2);
– German Consumer Price index (m/m) at 15:00 (GMT+2);
– US Manufacturing PMI (m/m) at 16:45 (GMT+2).
The GBP/USD currency pair
Technical indicators of the currency pair:
Prev Open: 1.2061
Prev Close: 1.2044
% chg. over the last day: -0.14 %
The Bank of England is expected to start slowing the pace of rate hikes as inflation declines, as UK economic indicators point to a recessionary scenario. The Resolution Foundation has warned that the cost-of-living crisis, which has led to a sharp drop in living standards, will continue into the new year. Income is expected to fall another 3.8%, and households will continue to struggle with soaring energy prices and tax increases.
Trading recommendations
Support levels: 1.2057, 1.1999, 1.1979, 1.1684, 1.1476, 1.1418
From the technical point of view, the trend on the GBP/USD currency pair on the hourly time frame is bearish. The MACD indicator has become inactive, and the price is trading in a narrow price corridor, but there are signs of buying strength inside the day. Under such market conditions, it is better to look for buy trades on intraday time frames from the support level of 1.2057, but with confirmation. Sell trades are best sought from the resistance level of 1.2167 but also better with confirmation.
Alternative scenario: if the price breaks out through the 1.2308 resistance level and fixes above it, the uptrend will likely resume.
News feed for 2023.01.03:
– UK Manufacturing PMI (m/m) at 11:30 (GMT+2).
The USD/JPY currency pair
Technical indicators of the currency pair:
Prev Open: 130.91
Prev Close: 130.61
% chg. over the last day: -0.23 %
The Japanese yen has strengthened by about 16% from its October low amid Bank of Japan intervention, as well as hopes of a slowdown in US interest rate hikes and speculation about possible Bank of Japan policy changes this year. The Bank of Japan’s unexpected December decision to change the parameters for managing the yield curve is still seen by many as a sign that ultra-easy monetary policy may soon come to an end. But traders should not expect any changes before the spring of 2023.
From the technical point of view, the medium-term trend on the currency pair USD/JPY is bearish. The price is now trading below the moving averages, while the MACD indicator is in the negative zone, but there is a divergence. There is selling pressure inside the day. Buy trades are best considered on intraday time frames from support at 129.65, but only with confirmation. Sell deals can be sought from the resistance level of 131.22, provided there is a reversal.
Alternative scenario: If the price fixes above 133.58, the uptrend will likely resume.
There is no news feed for today.
The USD/CAD currency pair
Technical indicators of the currency pair:
Prev Open: 1.3550
Prev Close: 1.3570
% chg. over the last day: +0.14 %
The USD/CAD currency pair gained 7% over 2022 primarily due to the US Federal Reserve’s tightening of monetary policy, which led to a 7.61% rise in the dollar index. WTI crude oil price rose by 4.57% over the year, which helped keep the Canadian dollar from plummeting. It should also be noted that the Bank of Canada was one of the first to begin tightening monetary policy but did it less aggressively than the US Fed, so now the US Fed rate (4.5%) is slightly higher than the Bank of Canada rate (4.25%). The Bank of Canada is projected to schedule another 0.25% rate hike in January and then keep rates at 4.5% through the end of 2023. With the US Fed starting to slow the rate hikes and Canada’s economic outlook now more optimistic, this could play for the Canadian currency’s strength in the first half of 2023.
Trading recommendations
Support levels: 1.3437, 1.3386, 1.3360, 1.3281, 1.3212
From the point of view of technical analysis, the trend on the USD/CAD currency pair is still bullish. The price forms a wide price corridor. The MACD indicator is in the positive zone, but sales prevail during the day. Buy trades should be considered from the support level of 1.3537, but with confirmation. Sell deals are best to look for on intraday time frames from the resistance level of 1.3583, but with confirmation in the form of reverse initiative on the lower time frames.
Alternative scenario: if the price breaks down and consolidates below the support level of 1.3529, the downtrend will likely resume.
News feed for 2023.01.03:
– OPEC+ Meeting (m/m) at 12:00 (GMT+2);
– Canada Manufacturing PMI (m/m) at 16:30 (GMT+2).
This article reflects a personal opinion and should not be interpreted as an investment advice, and/or offer, and/or a persistent request for carrying out financial transactions, and/or a guarantee, and/or a forecast of future events.
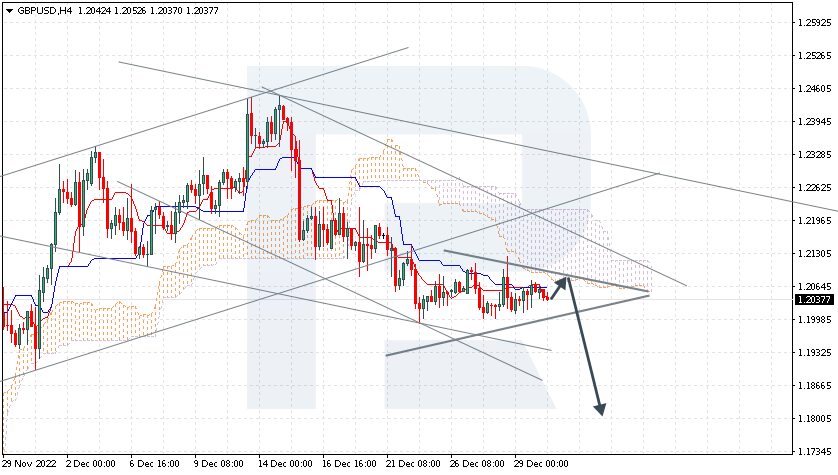
The currency pair is correcting by a Triangle pattern. The pair is going under the Ichimoku Cloud, which indicates prevalence of a downtrend. A test of the lower border of the Cloud is expected at 1.2065, followed by falling to 1.1805. An additional signal confirming the decline will be a bounce off the upper border of the Triangle pattern. The scenario can be cancelled by a breakaway of the upper border of the Cloud and securing above 1.2265, which will mean further growth to 1.2355. The decline can be confirmed by a breakaway of the lower border of the Triangle pattern and securing under 1.1975.
XAUUSD, “Gold vs US Dollar”
Gold is testing the resistance level. The instrument is going above the Ichimoku Cloud, which indicates an uptrend. A test of the lower border of the Cloud is expected at 1805, followed by growth to 1860. An additional signal confirming the growth will be a bounce off the lower border of the bullish channel. The scenario can be cancelled by a breakaway of the lower border of the Cloud and securing under 1790, which will mean further falling to 1755.
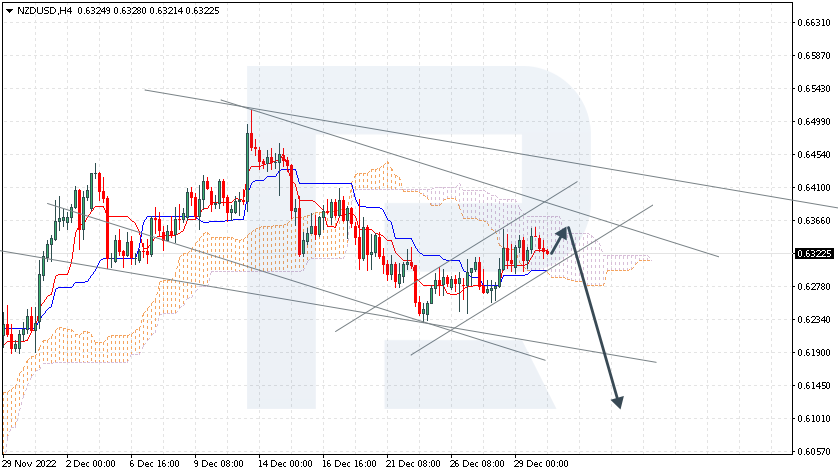
NZDUSD, “New Zealand Dollar vs US Dollar”
The currency pair is declining in a bullish correction channel. The instrument is going inside the Ichimoku Cloud, which means a flat. A test of the upper border of the Cloud at 0.6355 is expected, followed by falling to 0.6105. An signal confirming the decline will be a bounce off the upper border of the descending channel. The scenario can be cancelled by a breakaway of the upper border of the Cloud and securing above 0.6405, which will mean further growth to 0.6505. The decline can be confirmed by a breakaway of the lower border of the bullish channel and securing under 0.6270.
Attention! Forecasts presented in this section only reflect the author’s private opinion and should not be considered as guidance for trading. RoboForex LP bears no responsibility for trading results based on trading recommendations described in these analytical reviews.
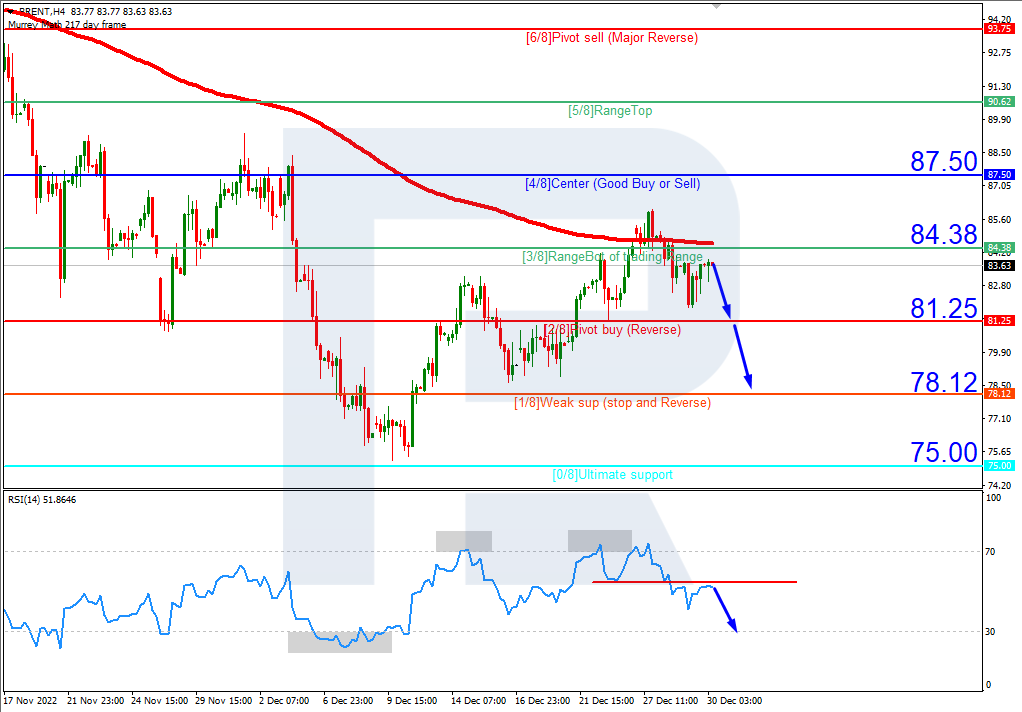
On H4, Brent quotes are under the 200-day Moving Average, which indicates prevalence of a downtrend. The RSI is testing the resistance line. A test of 2/8 (81.25) should be expected, followed by a breakaway and falling to the support level of 1/8 (78.12). The scenario can be cancelled by rising over the resistance level of 3/8 (84.38), which might lead to a trend reversal and growth of the quotes to the resistance level of 4/8 (87.50).
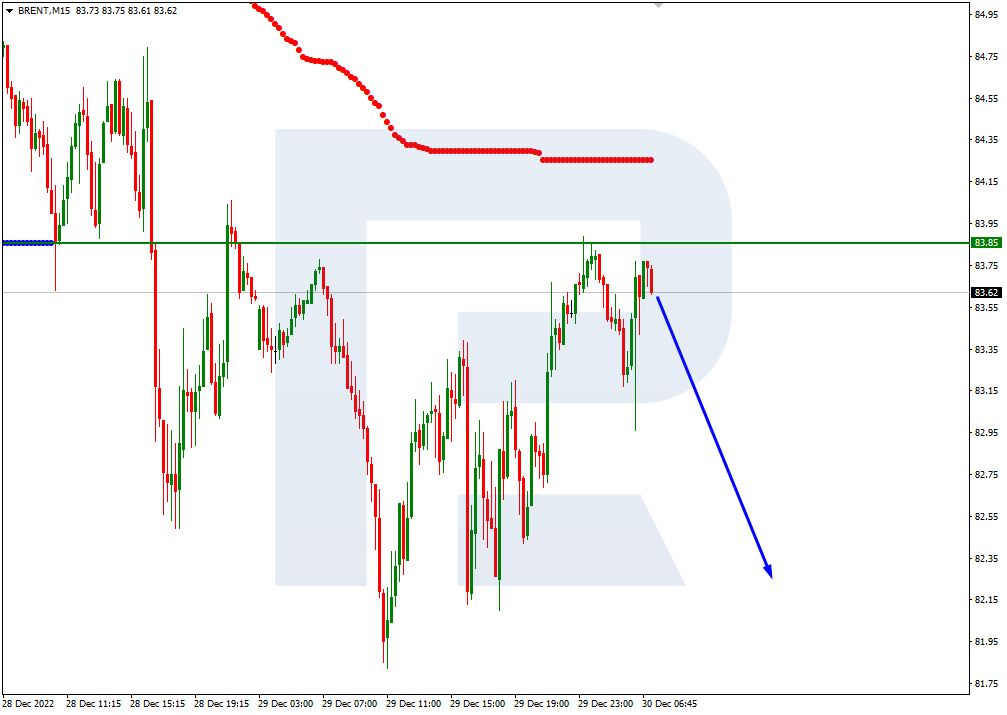
On M15, the lower line of VoltyChannel is broken away, which confirms the downtrend and increases the probability of further falling.
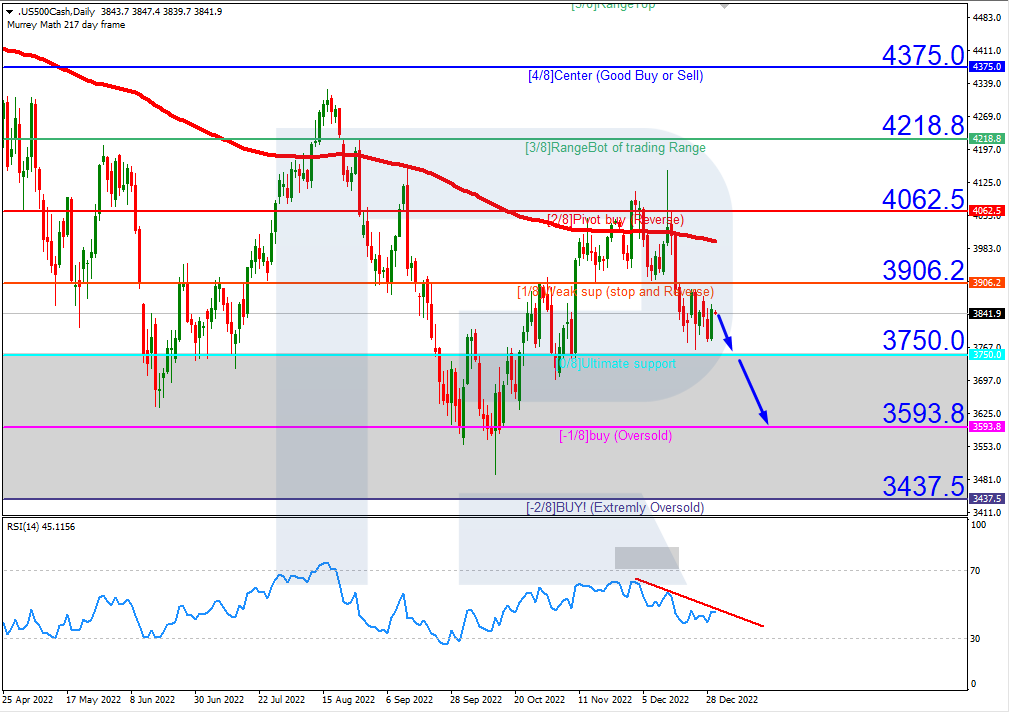
S&P 500
On H4, the quotes are under the 200-day Moving Average, which indicates prevalence of a downtrend. The RSI is testing the descending trendline that acts as a resistance level for the price. As a result, a breakaway of 0/8 (3750.0) is expected, followed by falling to the support level of -1/8 (3593.8). The scenario can be cancelled by rising over the resistance level of 1/8 (3906.2). In this case, the S&P 500 index may rise to 2/8 (4062.5).
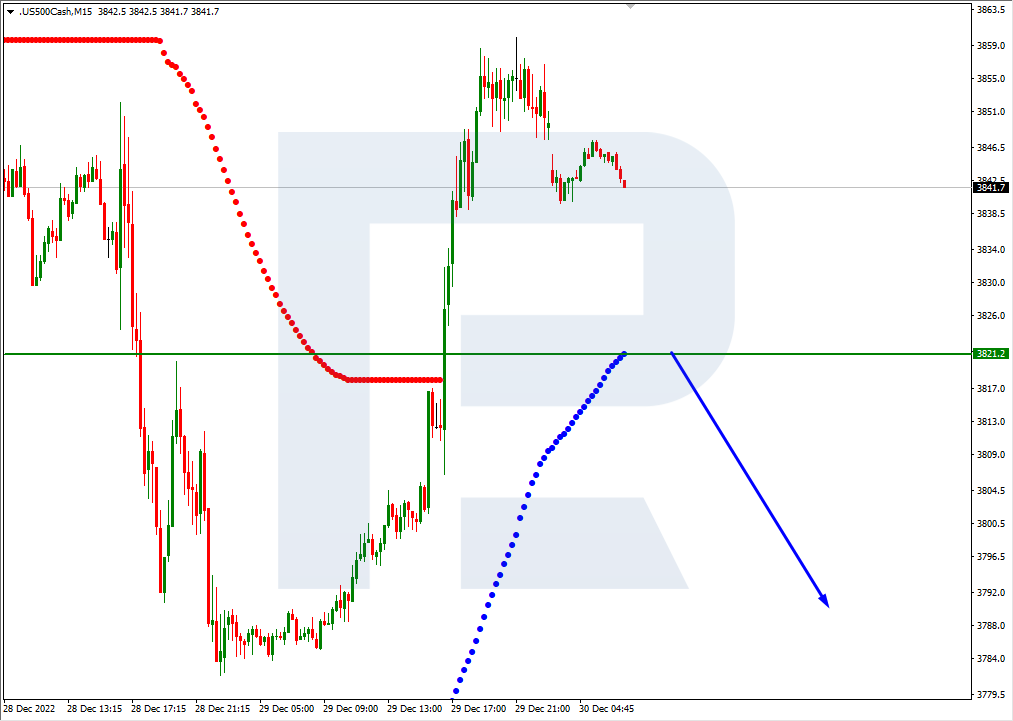
On M15, an additional signal confirming the decline will be a breakaway of the lower line of VoltyChannel.
Attention! Forecasts presented in this section only reflect the author’s private opinion and should not be considered as guidance for trading. RoboForex LP bears no responsibility for trading results based on trading recommendations described in these analytical reviews.
As we make fresh resolutions (especially those that pertain to trading/investing), here’s a head start on the potential opportunities ahead, starting with these key economic events and data releases in the first week of the new year: Monday, January 2
EUR: Eurozone December manufacturing PMI (final)
US, UK markets closed
Tuesday, January 3
CNH: China December Caixin manufacturing PMI
EUR: Germany December unemployment and inflation (CPI)
GBP: UK December manufacturing PMI (final)
CAD: Canada December manufacturing PMI
USD: US December manufacturing PMI (final)
Wednesday, January 4
EUR: Eurozone December services PMI (final)
USD: FOMC meeting minutes, US December ISM manufacturing
Thursday, January 5
AUD: Australia December composite and services PMIs (final)
CNH: China December Caixin services PMI
JPY: Japan December consumer confidence
EUR: Eurozone November PPI\
USD: US weekly initial jobless claims
Friday, January 6
EUR: Germany November factory orders
EUR: Eurozone December inflation, consumer confidence (final); November retail sales
CAD: Canada December employment data, jobless rate
USD: US December nonfarm payrolls report
As is the case on the first Friday of every month, markets will be primed to react to the monthly US jobs report.
At the time of writing, markets are forecasting an NFP (nonfarm payrolls) headline figure of 200,000 US jobs added in December, while the unemployment rate stays at 3.7%.
If that 200k estimate proves true, that would be the fewest number of jobs added to the US labour market since December 2019.
At 3.7%, that would mean that unemployment is still stubbornly around pre-pandemic lows, despite the Fed already having triggered many a supersized rate hike with hopes of incurring some demand destruction to rein in inflationary pressures.
Dollar to react to what US jobs market portends for Fed rate hikes
Should the US labour market continue to show signs of resilience, either by way of a higher-than-expected headline NFP figure (>200k) or a lower-than-expected unemployment rate (<3.7%), that may translate into a rebound for the US Dollar.
Relief for dollar bulls would be based on the notion that the Fed has to send its benchmark rates even higher in 2023 to cause more demand destruction and quell US inflation.
However, if we are shown signs of widening cracks in the US jobs market, either by way of a lower-than-200k headline NFP figure or a higher-than-3.7% unemployment rate, that may extend the Dollar’s declines from Q4 2022.
Also, pay attention to the latest minutes from the Fed’s December policy meeting, to be released on Thursday.
If there are signs that voting members on the FOMC are losing their collective zeal for sending US interest rates much higher in 2023, then dollar bears (those hoping the US dollar will fall) could pounce on such dovish signals to send the greenback lower.
Notice how this equally-weighted USD Index (as opposed to the benchmark DXY) has been trading around two key Fibonacci levels for all of December.
The longer it consolidates around this region, the more explosive the potential breakout from all that pent-up indecision.
USD Index: Immediate support and resistance levels
Support: 1.170 region (23.6% Fibonacci line from the USD Index’s 2022 peak-to-trough retracement)
To be fair to dollar bulls, markets are positioned for more US dollar gains against most of its G10 peers, except against the Japanese Yen, over the next one week.
Still, from a fundamental perspective, a dollar rebound may well require further proof that the Federal Reserve can afford to send US interest rates past 5% (from the current 4.5%) as 2023 rolls along, starting with next week’s US jobs report and the incoming FOMC meeting minutes.
Otherwise, markets are likely to continue expecting this Fed pivot: that the Fed is much closer to being done with rate hikes are could actually lower US rates to offset a potential recession later in 2023.
Rising expectations for an eventual “Fed pivot” are then likely to drag the US dollar even lower.
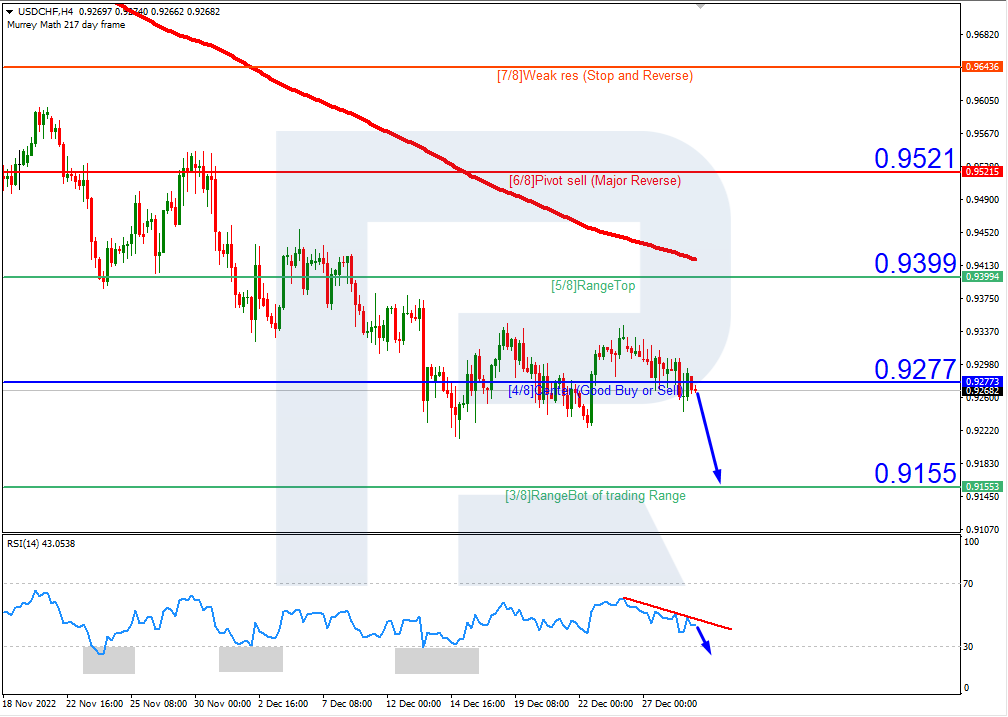
On H4, the quotes are under the 200-day Moving Average, which indicates prevalence of a downtrend. The RSI has bounced off the resistance line. Further falling to the nearest support at 3/8 (0.9155) is expected. The scenario can be cancelled by an upward breakaway of 4/8 (0.9277). In this case, the pair may reach 5/8 (0.9399).
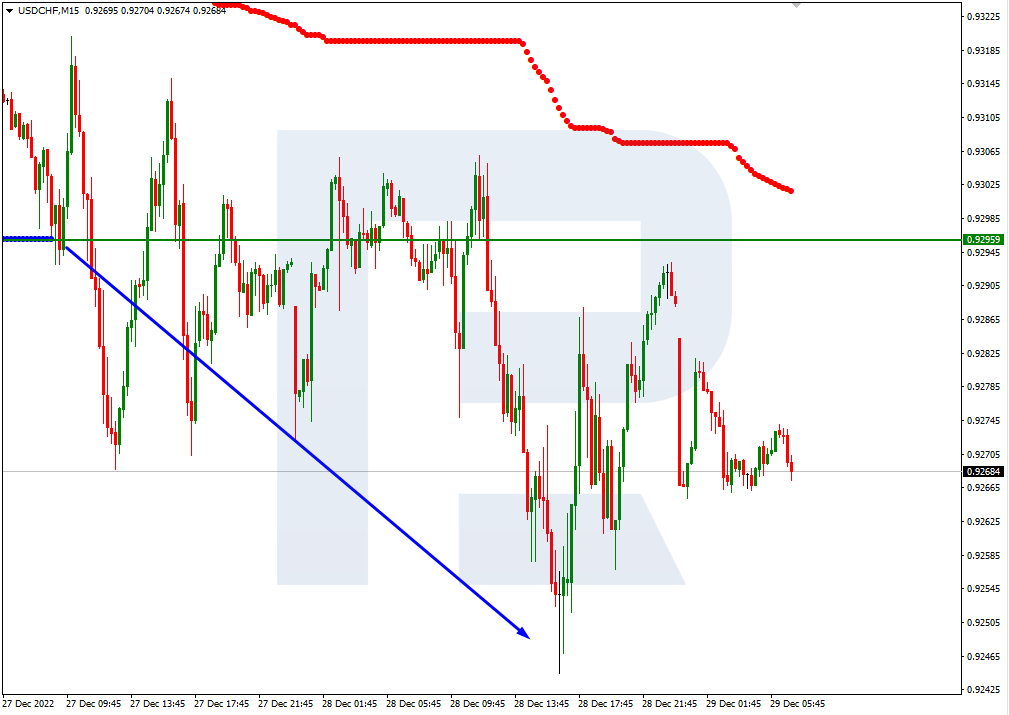
On M15, the lower line of VoltyChannel is broken, which confirms a downtrend and increases the probability of further price falling.
XAUUSD, “Gold vs US Dollar”
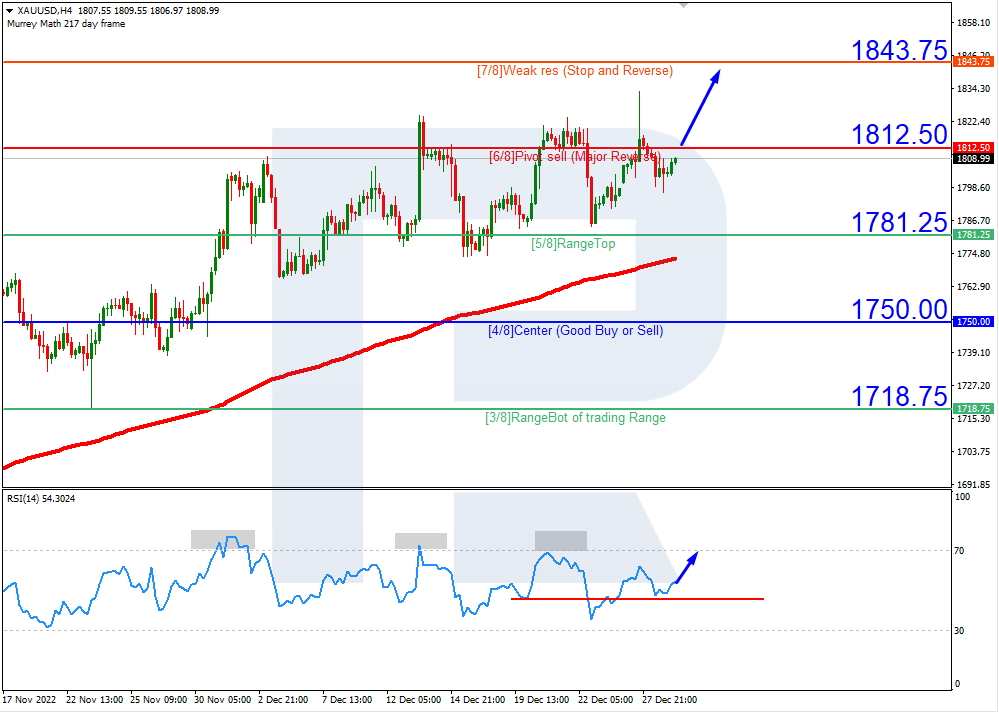
On H4, the quotes are above the 200-day Moving Average, which indicates prevalence of an uptrend. The RSI has bounced off the support line. As a result, the quotes are expected to rise above 6/8 (1812.50) and grow to the resistance level of 7/8 (1843.75). The scenario can be cancelled by a downwards breakaway of the support level of 5/8 (1781.25). This might lead to falling of the price to 4/8 (1750.00).
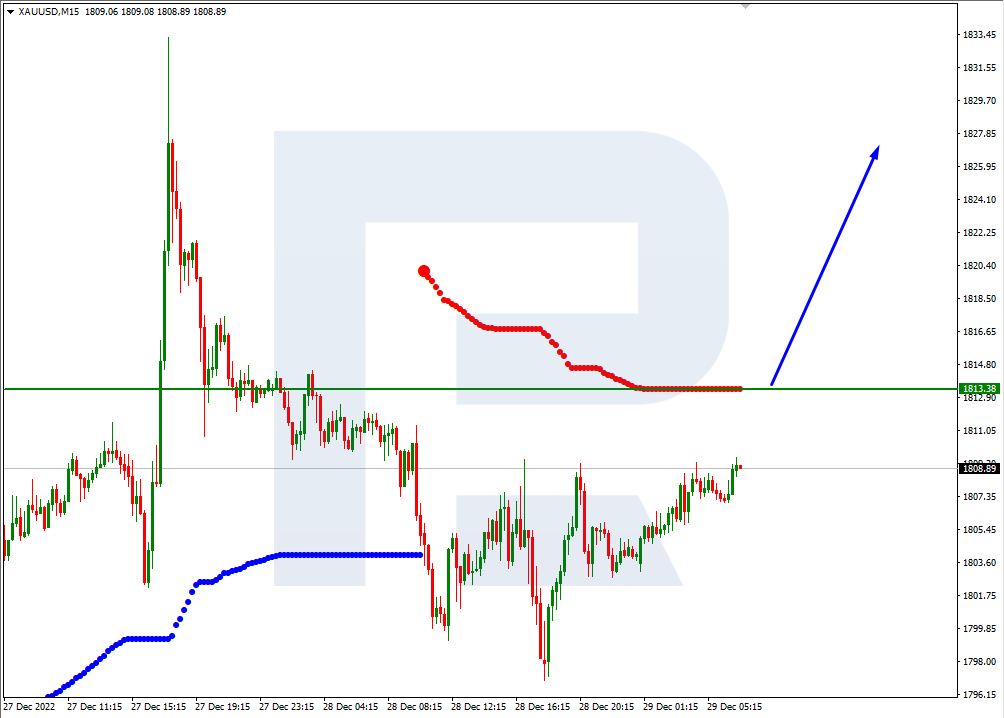
On M15, an additional signal confirming growth will he a breakaway of the upper border of VoltyChannel.
Attention! Forecasts presented in this section only reflect the author’s private opinion and should not be considered as guidance for trading. RoboForex LP bears no responsibility for trading results based on trading recommendations described in these analytical reviews.
Inflation in the Eurozone lags Lithuanian inflation by half a year, which means that its peak is still to come. This is the opinion of the representative of the European Central Bank (ECB) Governing Council, Gediminas Simkus. The main risk comes from the energy crisis amid falling temperatures in winter. If Europe manages to pass this winter without considerable problems in the energy system, it is possible to say with certainty that the inflation peak has already passed this spring.
Trading recommendations
Support levels: 1.0586, 1.0483, 1.0361, 1.0332, 1.0284, 1.0193
Resistance levels: 1.0654, 1.0667, 1.0695
The trend on the EUR/USD currency pair on the hourly time frame is bullish. The price is forming a price corridor. The price is forming a wide price corridor, and the volatility is reducing in anticipation of the holidays. The MACD indicator has become inactive, but there is a slight selling pressure. Under such market conditions, buy trades are best considered from support levels on intraday time frames, but with additional confirmation. Sell deals can be considered from the resistance level of 1.0654 or 1.0667, but better with a confirmation in the form of a reverse initiative or a false breakout because the level has already been tested.
Alternative scenario: if the price breaks down through the support level of 1.0549 and fixes below it, the downtrend will likely resume.
News feed for 2022.12.29:
– US Initial Jobless Claims (w/w) at 15:30 (GMT+2).
The GBP/USD currency pair
Technical indicators of the currency pair:
Prev Open: 1.2024
Prev Close: 1.2018
% chg. over the last day: -0.05 %
The situation on the GBP/USD currency pair has not changed compared to the previous day. Volatility remains below average in the run-up to the New Year holidays. Fundamental factors for the British pound are extremely weak now, so there are no prerequisites for growth. Traders should not expect significant changes in the price till the end of the year.
Trading recommendations
Support levels: 1.1999, 1.1979, 1.1684, 1.1476, 1.1418
From the technical point of view, the trend on the GBP/USD currency pair on the hourly time frame is bearish. The MACD indicator became inactive, and the price formed a narrow price corridor. Under such market conditions, it is better to look for buy deals from the support level of 1.1999 or 1.1979, but with confirmation on intraday time frames. Sell trades are best sought from the resistance level of 1.2062 but also better with confirmation.
Alternative scenario: if the price breaks out through the 1.2308 resistance level and fixes above it, the uptrend will likely resume.
There is no news feed for today.
The USD/JPY currency pair
Technical indicators of the currency pair:
Prev Open: 133.35
Prev Close: 134.47
% chg. over the last day: +0.83 %
Japan’s industrial production index declined for the third consecutive month. Recent economic data, including exports, retail sales, and industrial production, signal that Japan’s economy is still very fragile and thus supports the Bank of Japan’s view that monetary policy easing should continue. At the moment, JPY does not have any fundamental support, so weak economic data and interest rate differentials between BoJ and FOMC will have a negative impact on JPY.
From the technical point of view, the medium-term trend on the currency pair USD/JPY is bearish. The price is now trading above the moving averages, while the MACD indicator has become inactive. There is some buying pressure inside the day. Buy trades are best considered on intraday time frames from a support level of 133.75 or 132.68, but only with confirmation. Sell deals can be looked for from the resistance level of 134.45, provided there is a reverse reaction.
Alternative scenario: If the price fixes above 137.00, the uptrend will likely resume.
There is no news feed for today.
The USD/CAD currency pair
Technical indicators of the currency pair:
Prev Open: 1.3514
Prev Close: 1.3604
% chg. over the last day: +0.67 %
No economic events and data about Canada are expected before the end of the year, so the Canadian dollar these days will be completely dependent on the dynamics of the dollar index and oil prices, as Canadian is a commodity currency. Oil prices fell on Wednesday, as well as the likelihood that the easing of pandemic restrictions in China will increase demand for fuel. With the dollar rising, USD/CAD quotes jumped yesterday. The US crude oil inventories will be released today, which will add volatility to the currency pair.
Trading recommendations
Support levels: 1.3529, 1.3438, 1.3386, 1.3360, 1.3281, 1.3212
From the point of view of technical analysis, the uptrend trend on the USD/CAD currency pair is still bullish. The price failed to consolidate below the priority level and is trading above the moving averages. The MACD indicator is in the positive zone, and buyers prevail inside the day. Buy trades should be considered from the support level 1.3529, but with confirmation. Sell deals are best to look for on intraday time frames from the resistance level of 1.3614, but with confirmation in the form of reverse initiative on the lower time frames.
Alternative scenario: if the price breaks down and consolidates below the support level of 1.3529, the downtrend will likely resume.
News feed for 2022.12.29:
– US Crude Oil Inventories (w/w) at 18:00 (GMT+2).
This article reflects a personal opinion and should not be interpreted as an investment advice, and/or offer, and/or a persistent request for carrying out financial transactions, and/or a guarantee, and/or a forecast of future events.
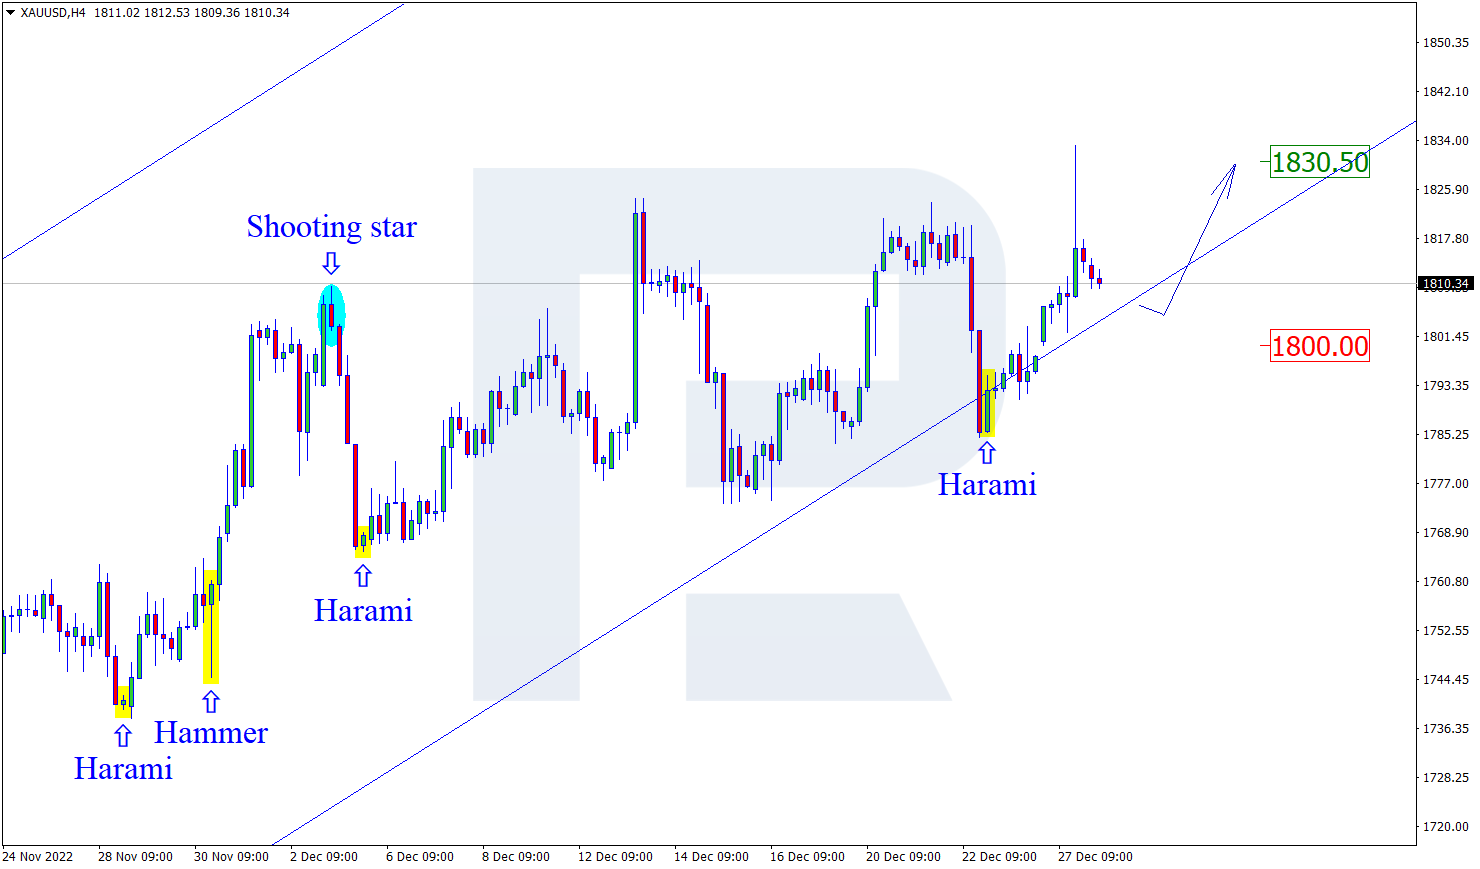
At the support level, gold has formed a Harami reversal pattern. Currently, the pair can go by the pattern in an ascending wave. The goal of the growth might be the resistance level of 1830.50. After the test of the resistance level, the pair can break through it and continue the uptrend. However, the quotes may pull back to 1800.00 before further growth.
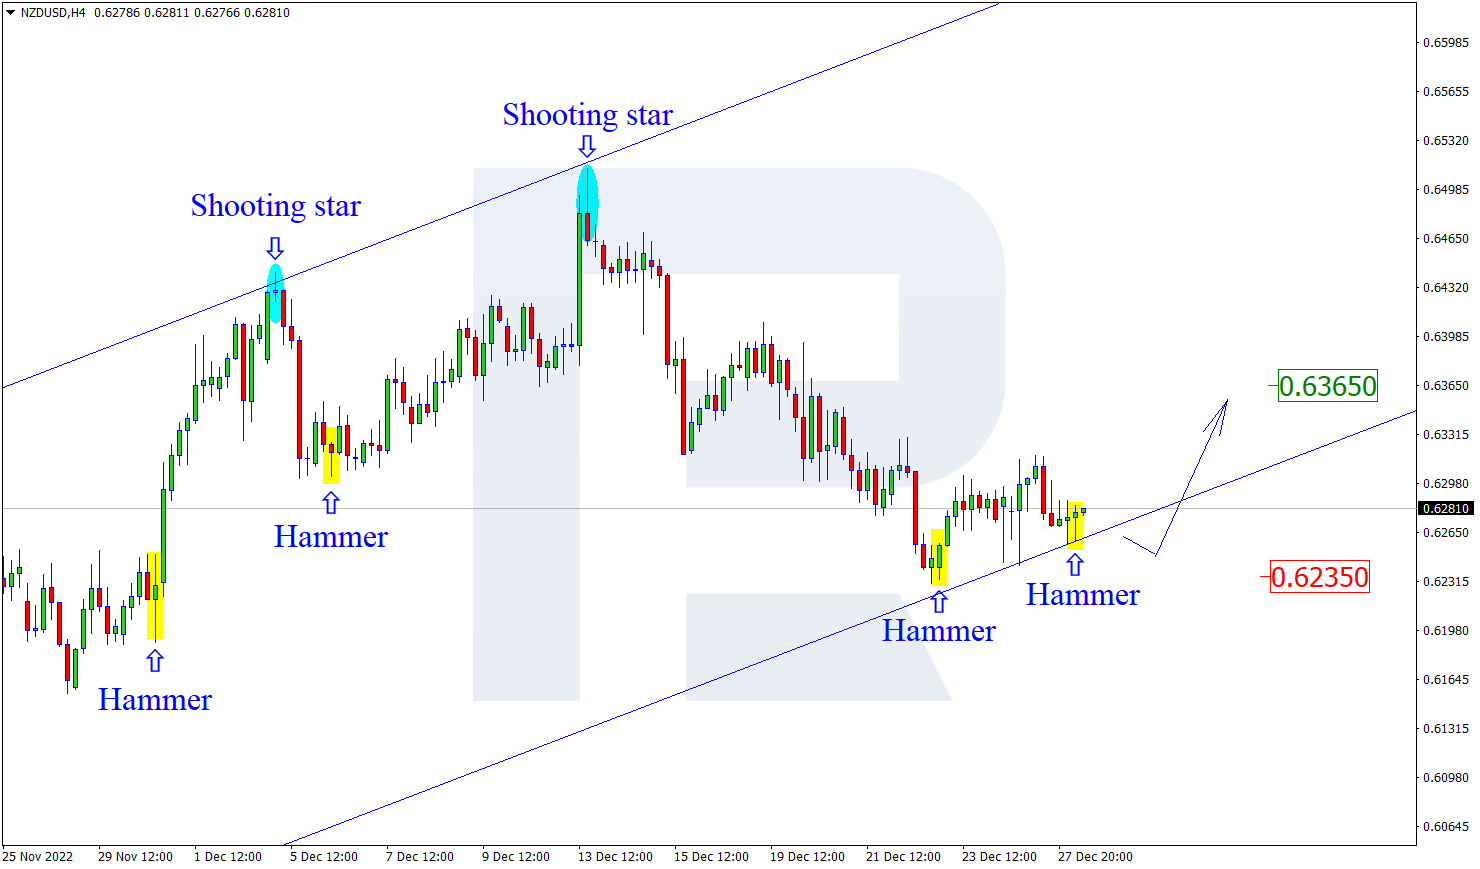
NZDUSD, “New Zealand Dollar vs US Dollar”
On H4, at the support level, the pair has formed a Hammer reversal pattern. The pair may now go by the signal in an ascending wave. The goal of the growth might be 0.6365. After a breakaway of the resistance, the quotes may get a chance for continuing the uptrend. However, the price may pull back to 0.6235 before further growth.
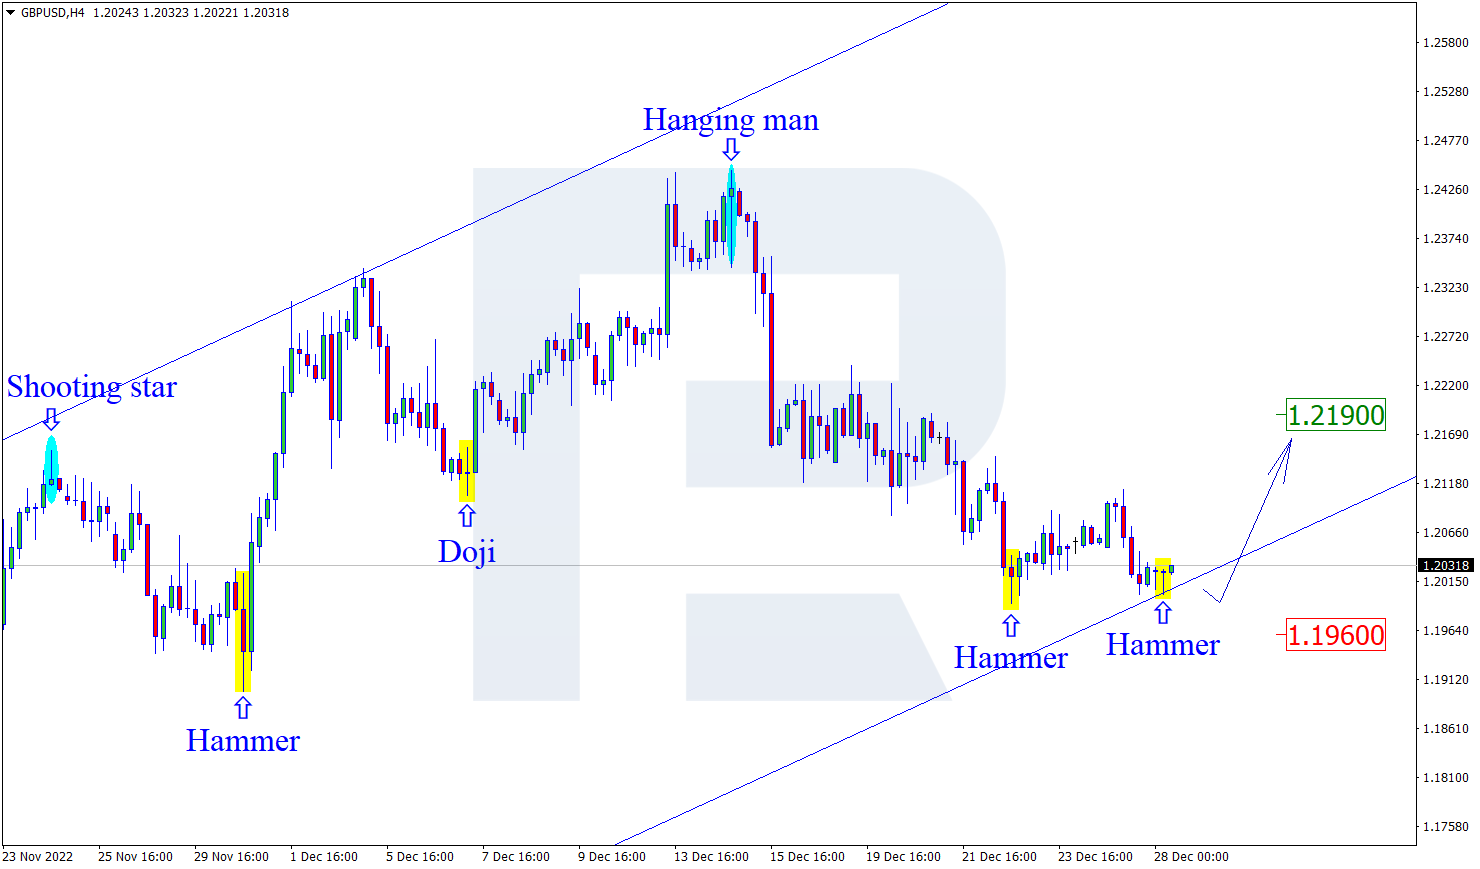
GBPUSD, “Great Britain Pound vs US Dollar”
On H4, at the support level, the pair has formed a Hammer reversal pattern. Currently, the pair may go by the signal in an ascending wave. The goal of the growth is still the resistance level of 1.2190. However, the price may pull back to 1.1960 before continuing the uptrend.
Attention! Forecasts presented in this section only reflect the author’s private opinion and should not be considered as guidance for trading. RoboForex LP bears no responsibility for trading results based on trading recommendations described in these analytical reviews.
This is the last trading week of the year. With many investors closing their books for the year and many traders and managers going on vacation, liquidity will be less than usual. This means the markets may move sharply without any news. The dollar fell against most currencies in trading Friday as recent data signaled that the US Personal Consumption Index (PCE) is slowing, reinforcing expectations for a smaller interest rate hike by the Federal Reserve and improving investors’ appetite for risk. The Fed is expected to raise interest rates by only 25 basis points at its next meeting.
Trading recommendations
Support levels: 1.0549, 1.0483, 1.0361, 1.0332, 1.0284, 1.0193
Resistance levels: 1.0667, 1.0695
The trend on the EUR/USD currency pair on the hourly time frame is bullish. The price is forming a price corridor. The price is forming a wide price corridor. The MACD indicator has become positive, and buyers are again dominating inside the day. Under such market conditions, buy trades are best considered from support levels on intraday time frames, but with additional confirmation. Sell deals can be considered from the resistance level of 1.0667, but better with a confirmation in the form of a reverse initiative or a false breakout.
Alternative scenario: if the price breaks down through the support level of 1.0549 and fixes below it, the downtrend will likely resume.
There is no news feed for today.
The GBP/USD currency pair
Technical indicators of the currency pair:
Prev Open: 1.2025
Prev Close: 1.2046
% chg. over the last day: +0.17 %
A turbulent year for the British pound is coming to an end, and there are a few signs that 2023 will be optimistic. Signs of a painful economic downturn in the UK continue to accumulate, making analysts doubt whether the pound can extend or even sustain its recent rebound against the dollar. The options market is also showing skepticism, with traders still bearish on the long-term outlook. Yield spreads between two- and 10-year swaps tied to the overnight rate, an indicator of recession risks, also point to a longer recession in the UK than in other major economies. Analysts at JPMorgan Chase & Co. predict that the pound will return to $1.14 by the end of the first quarter of 2023.
Trading recommendations
Support levels: 1.2044, 1.1979, 1.1684, 1.1476, 1.1418
From the technical point of view, the trend on the GBP/USD currency pair on the hourly time frame has changed to bearish. The MACD indicator has become positive, but the buyers’ pressure is quite weak. On the other hand, the price managed to return above the moving averages. Under such market conditions, it is better to look for buy trades from the support at 1.2044, but with confirmation on the intraday time frames. Sell trades are best sought from the resistance level of 1.2093, but also better with confirmation.
Alternative scenario: if the price breaks out through the 1.2308 resistance level and fixes above it, the uptrend will likely resume.
There is no news feed for today.
The USD/JPY currency pair
Technical indicators of the currency pair:
Prev Open: 132.67
Prev Close: 132.77
% chg. over the last day: +0.07 %
The market is still dominated by news of the Bank of Japan’s upward revision to its yield curve control policy, which has given a significant boost to the yen and brought short yen futures positions to their lowest level since August. But Bank of Japan (BOJ) Governor Haruhiko Kuroda said on Monday that the BOJ’s decision last week to widen the permissible range around its yield target was intended to reinforce the effect of its ultra-soft policy, not a first step toward canceling a massive stimulus program, and the bank would aim for sustained and stable price targets accompanied by wage increases while continuing to ease monetary policy under yield curve control. Such a statement may return the USD/JPY currency pair bullish as the interest rate differential is not in favor of the yen.
From the technical point of view, the medium-term trend on the currency pair USD/JPY is bearish. The MACD indicator has become inactive, and a narrow price range in the form of a “wedge” pattern is being formed. During the day, there is a slight buyers’ pressure. Buy trades are best considered on intraday time frames from the support level of 132.27, but only with confirmation. Sell deals can be looked for from the resistance level of 133.53, provided there is a reverse reaction.
Alternative scenario: If the price fixes above 137.00, the uptrend will likely resume.
News feed for 2022.12.27:
– Japan Unemployment Rate (m/m) at 01:30 (GMT+2);
– Japan Retail Sales (m/m) at 01:30 (GMT+2).
The USD/CAD currency pair
Technical indicators of the currency pair:
Prev Open: 1.3651
Prev Close: 1.3594
% chg. over the last day: -0.42 %
Canada’s GDP grew by 0.1% over the last month. On the one hand, the economy is still on a growth trajectory. On the other hand, there are signs of a slowdown in GDP growth over the last 3 months. It is highly likely that Canada’s Central Bank will continue to raise the cost of borrowing (interest rate) but will become more “dovish” so as not to hurt the economy too much. Analysts expect a 0.25% rate hike at the next meeting, after which the bank is likely to pause for a few months. The strengthening of the Canadian dollar in recent days is due to rising oil prices.
Trading recommendations
Support levels: : 1.3521, 1.3438, 1.3386, 1.3360, 1.3281, 1.3212
From the point of view of technical analysis, the trend on the USD/CAD currency pair has changed to bullish. But the MACD indicator is in the negative zone, and sellers dominate within the day. Yesterday, the price consolidated below the moving averages, which increases the probability of a change in the trend. Buy trades should be considered from the support at 1.3522, but with a confirmation in the form of a reverse initiative. Sells are best to look for on intraday time frames from the resistance level of 1.3590, but with confirmation in the form of a reverse initiative on the lower time frames.
Alternative scenario: if the price breaks down and consolidates below the support level of 1.3386, the downtrend will likely resume.
This article reflects a personal opinion and should not be interpreted as an investment advice, and/or offer, and/or a persistent request for carrying out financial transactions, and/or a guarantee, and/or a forecast of future events.