Archive for Forex and Currency News – Page 48

Currency Speculators raise Euro & US Dollar bets into positive levels

By InvestMacro

Here are the latest charts and statistics for the Commitment of Traders (COT) data published by the Commodities Futures Trading Commission (CFTC).

The latest COT data is updated through Tuesday May 14th and shows a quick view of how large market participants (for-profit speculators and commercial traders) were positioned in the futures markets. All currency positions are in direct relation to the US dollar where, for example, a bet for the euro is a bet that the euro will rise versus the dollar while a bet against the euro will be a bet that the euro will decline versus the dollar.

Weekly Speculator Changes led by Euro & Japanese Yen
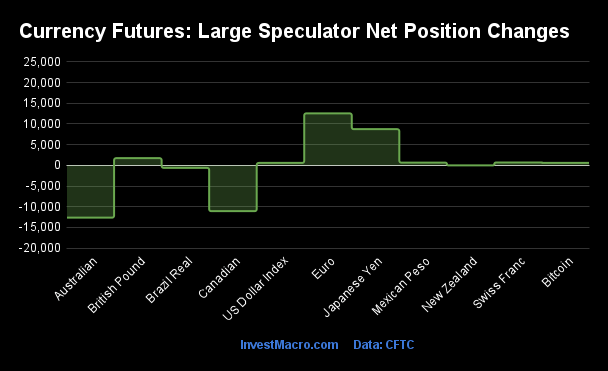
The COT currency market speculator bets were higher this week as seven out of the eleven currency markets we cover had higher positioning while the other four markets had lower speculator contracts.

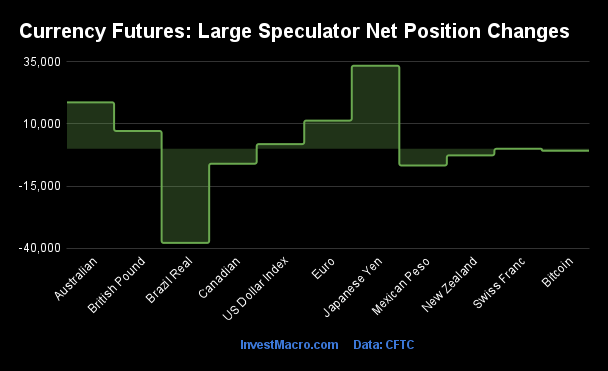
Leading the gains for the currency markets was the EuroFX (12,565 contracts) with the Japanese Yen (8,740 contracts), the British Pound (1,738 contracts), the Swiss Franc (680 contracts), the Mexican Peso (649 contracts), Bitcoin (606 contracts) and the US Dollar Index (582 contracts) also having positive weeks.

The currencies seeing declines in speculator bets on the week were the Australian Dollar (-12,655 contracts), the Canadian Dollar (-11,082 contracts), the Brazilian Real (-616 contracts) and the New Zealand Dollar (-9 contracts) also registering lower bets on the week.

Currency Speculators raise Euro & US Dollar bets into positive levels

This week’s COT currency’s data saw a continued improvement in many currencies (EUR, USDIndex, GBP, JPY) that had seen their positions weakening significantly over the past few months. Overall, most of the currency positions remain in weak levels versus the US dollar as only the Mexican peso, the Euro and the USD Index currently have positive bullish speculator positions.

Here is this week’s COT currency roundup:

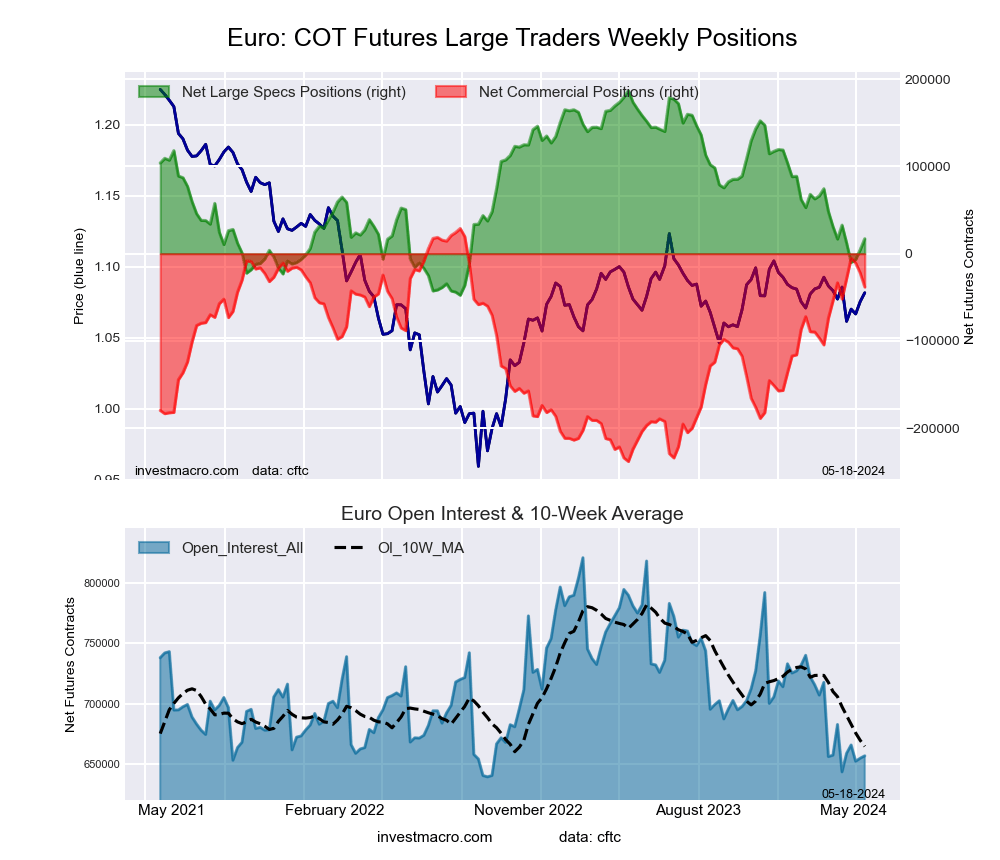
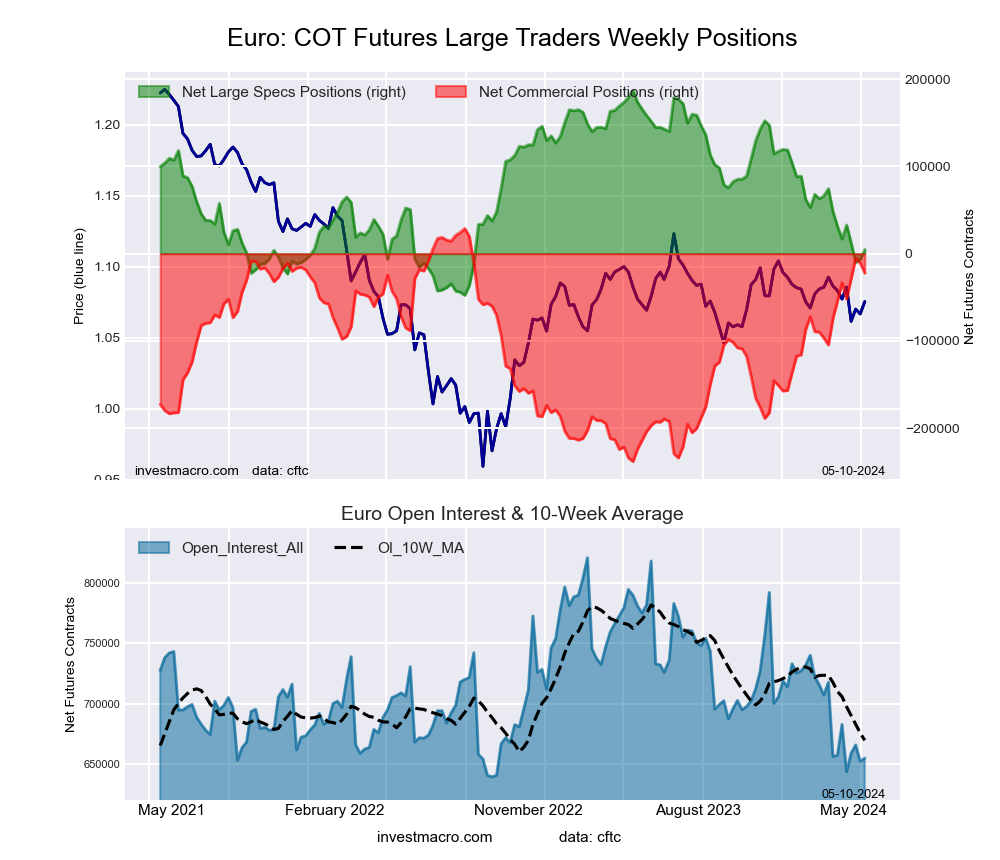
The Euro positions continue to rebound after a deeply negative stretch in March and April that took -84,396 contracts off the speculator position and dropped the Euro contracts into a bearish position for the first time since September of 2022. This week the Euro bets rose by +12,565 contracts following last week’s +11,367 contract gain and has brought the speculator standing to a current level of +17,155 contracts. The Euro exchange rate has been on a 5-week winning streak as well and closed this week at the 1.0889 level against the US dollar.

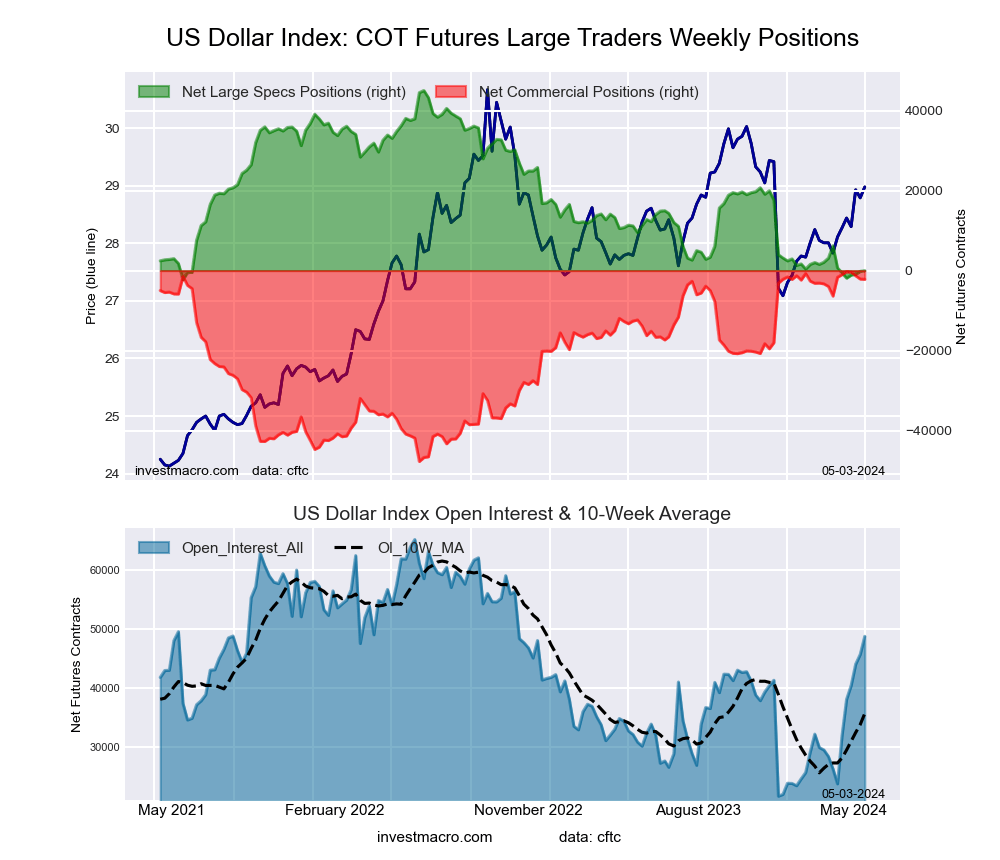
The US dollar index positions rose modestly again this week and have now been higher for six consecutive weeks. This recent bullishness has taken the speculator standing back into bullish territory after the position dipped into negative or bearish levels in March for the first time since 2021.

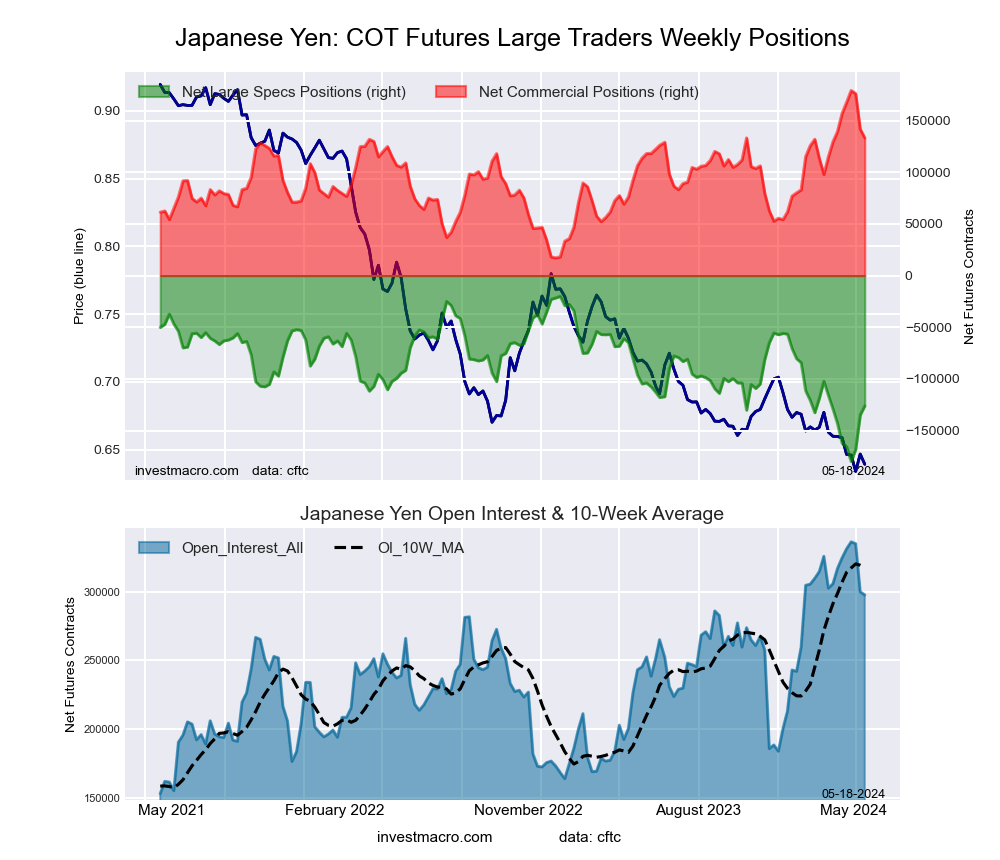
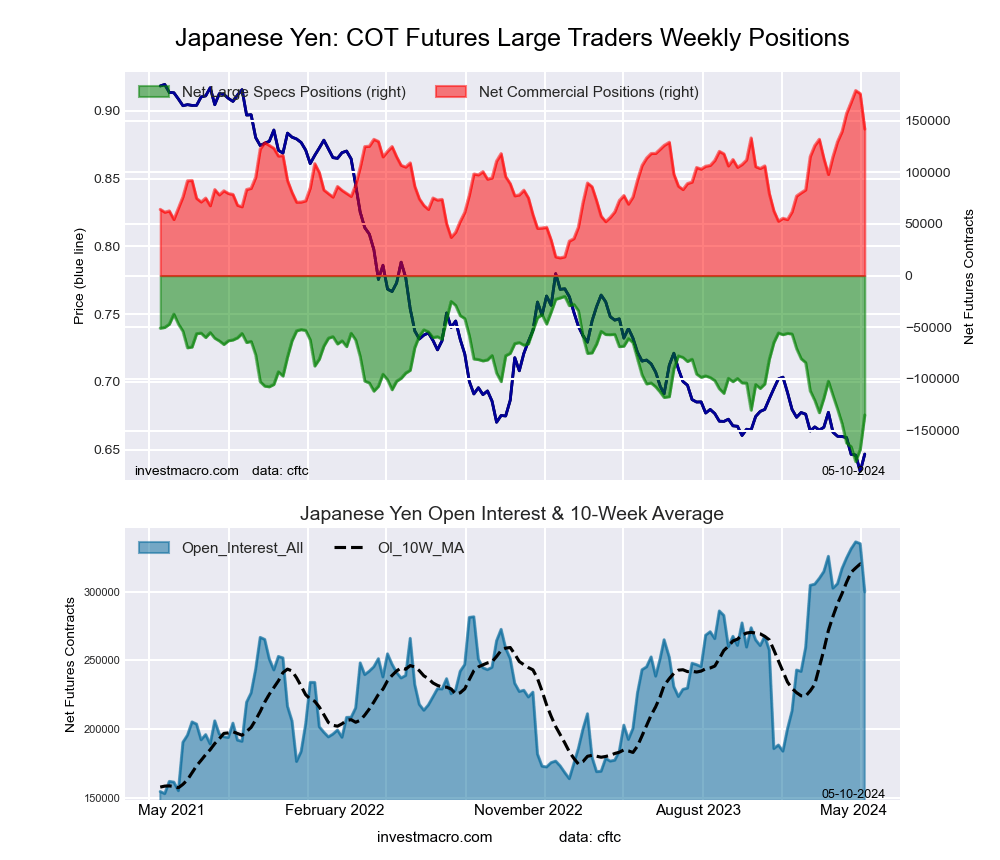
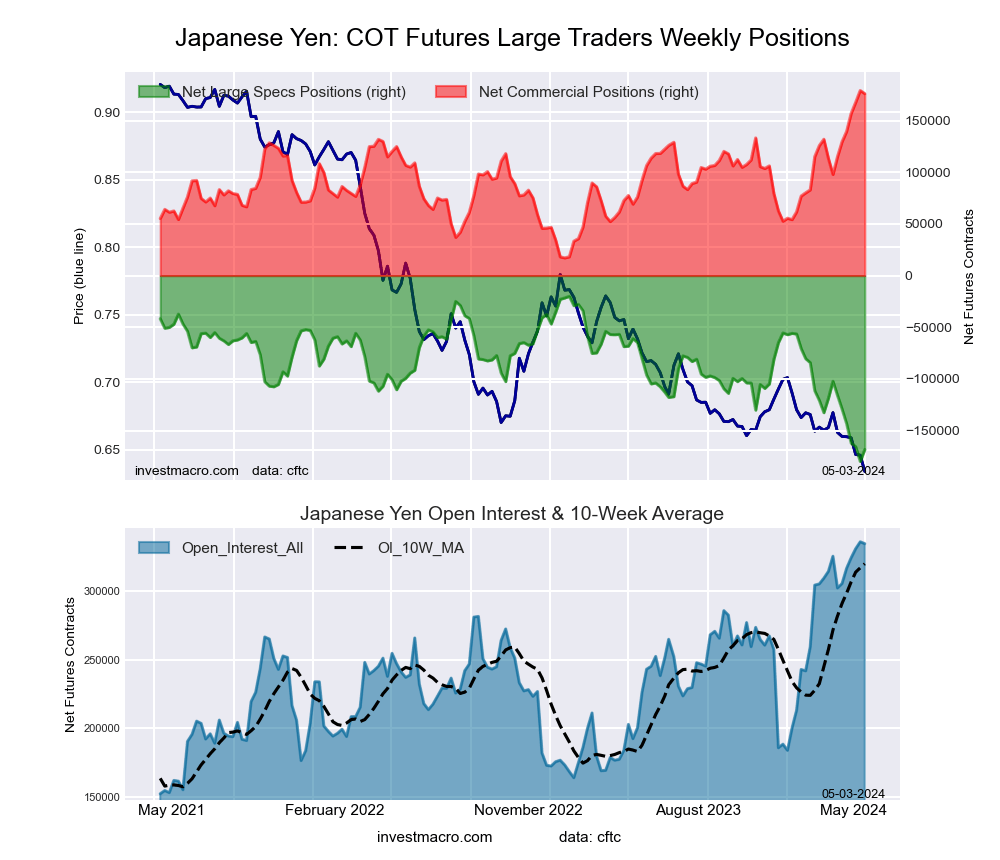
Japanese yen speculator bets continued to improve for a third straight week after falling to a multi-year low of -179,919 contracts on April 23rd. The three-week improvement has totaled +53,737 contracts and coincided with a reported intervention in the currency markets by the Japanese government to stop a sharp slide in the yen. Despite the intervention, the yen’s exchange rate versus the dollar continues to be historically weak with the USDJPY currency pair closing the week right around the 155.60 level.

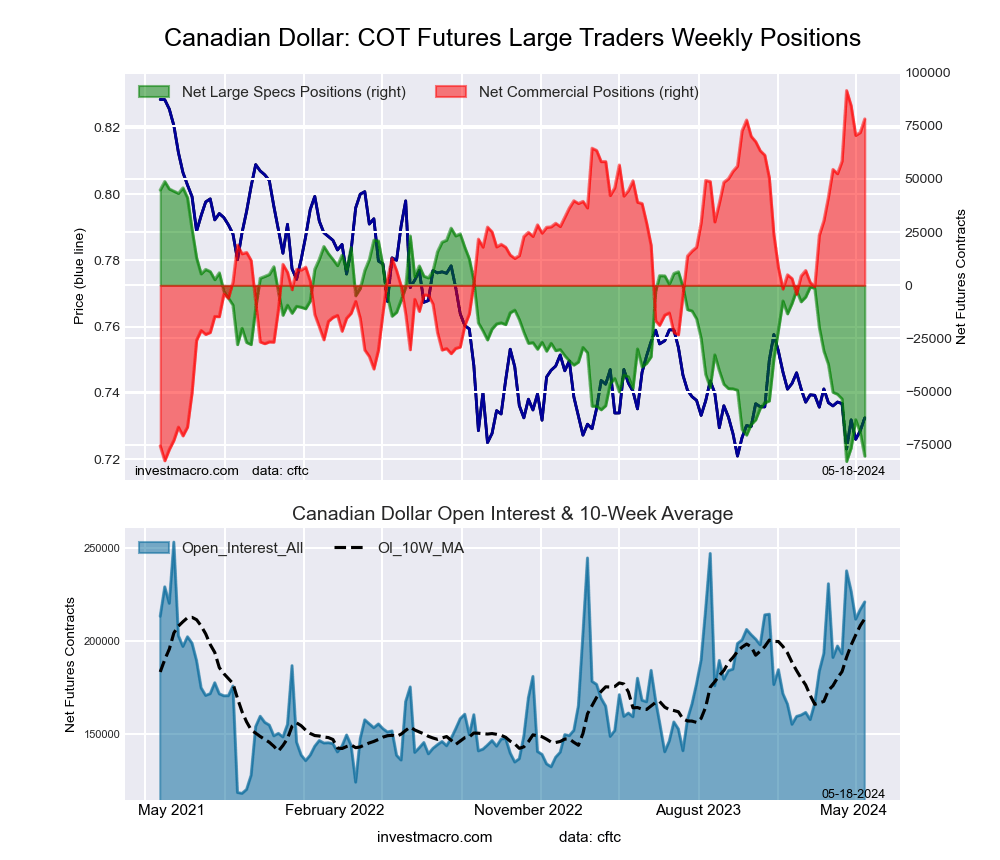
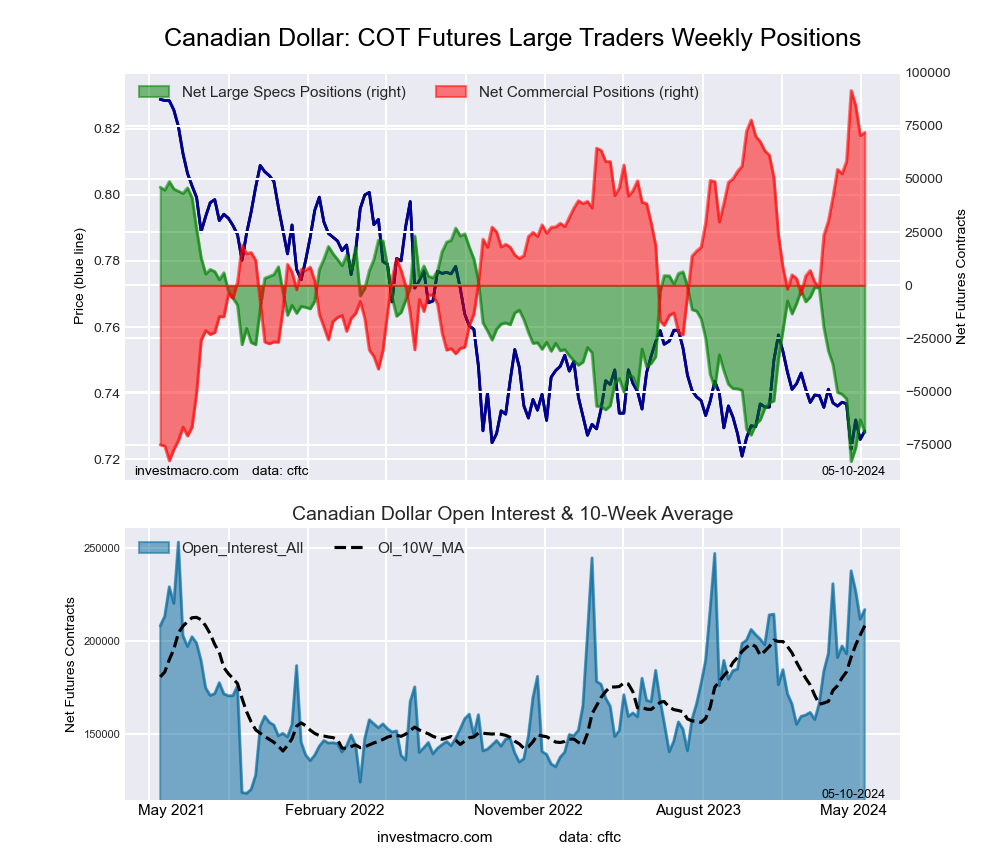
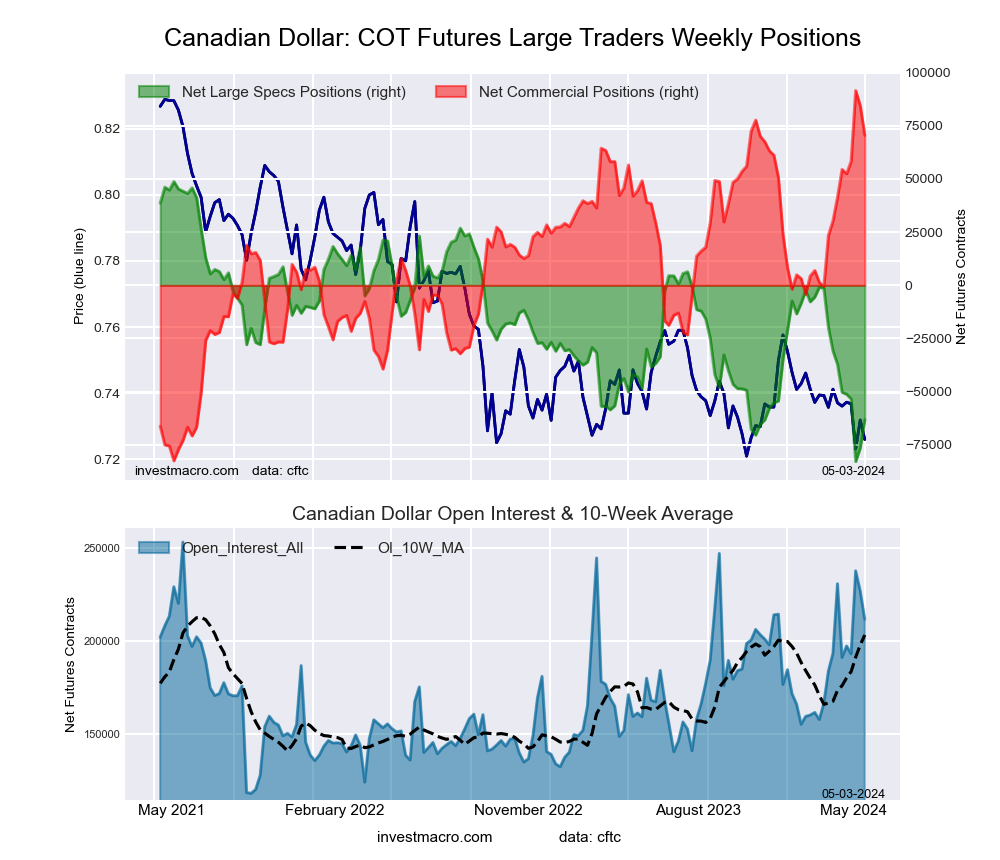
The Canadian dollar speculative position dropped for a second straight week this week and the current -80,303 contract level is the most bearish standing in a month for the CAD bets. The renewed bearishness for speculators has brought the CAD into extreme bearishness versus its range over the past three years with a 1.9 percent strength score. The Canadian dollar exchange rate remains in a down-trending channel versus the US dollar with our weekly trend model also considering the CAD to be in a downtrend at the moment. However, the CADUSD currency pair has recently bounced off a base of support around the 0.7250 level for the fourth time since 2022.

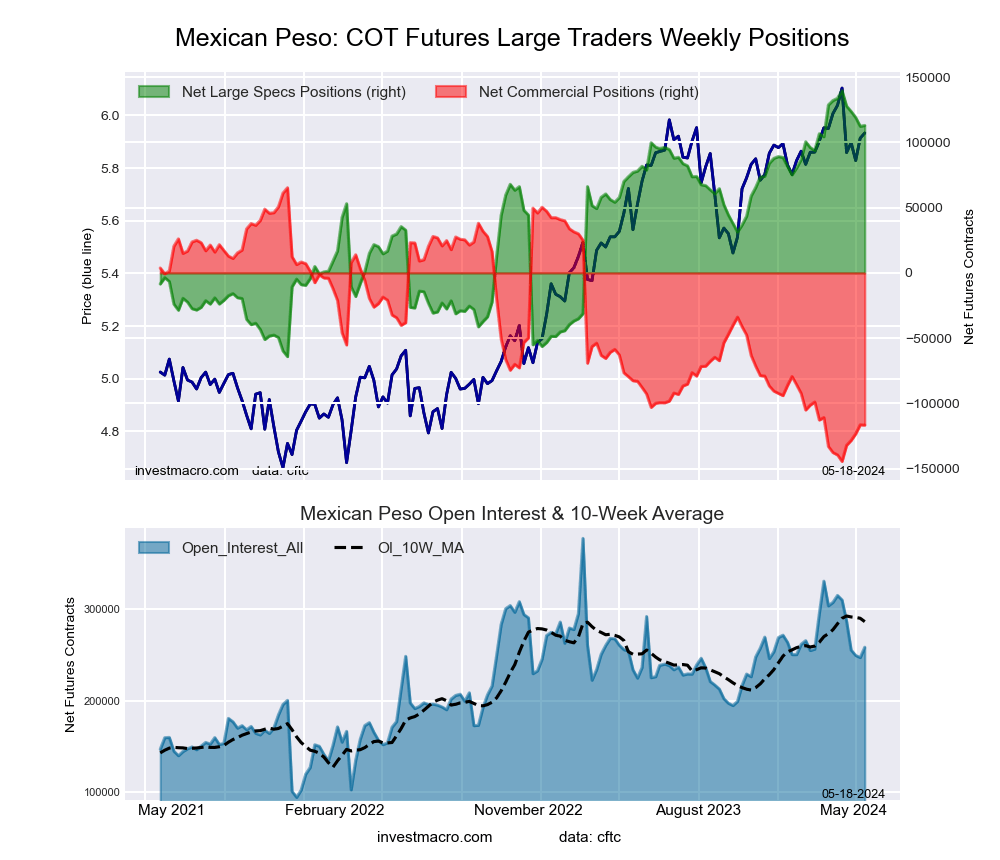
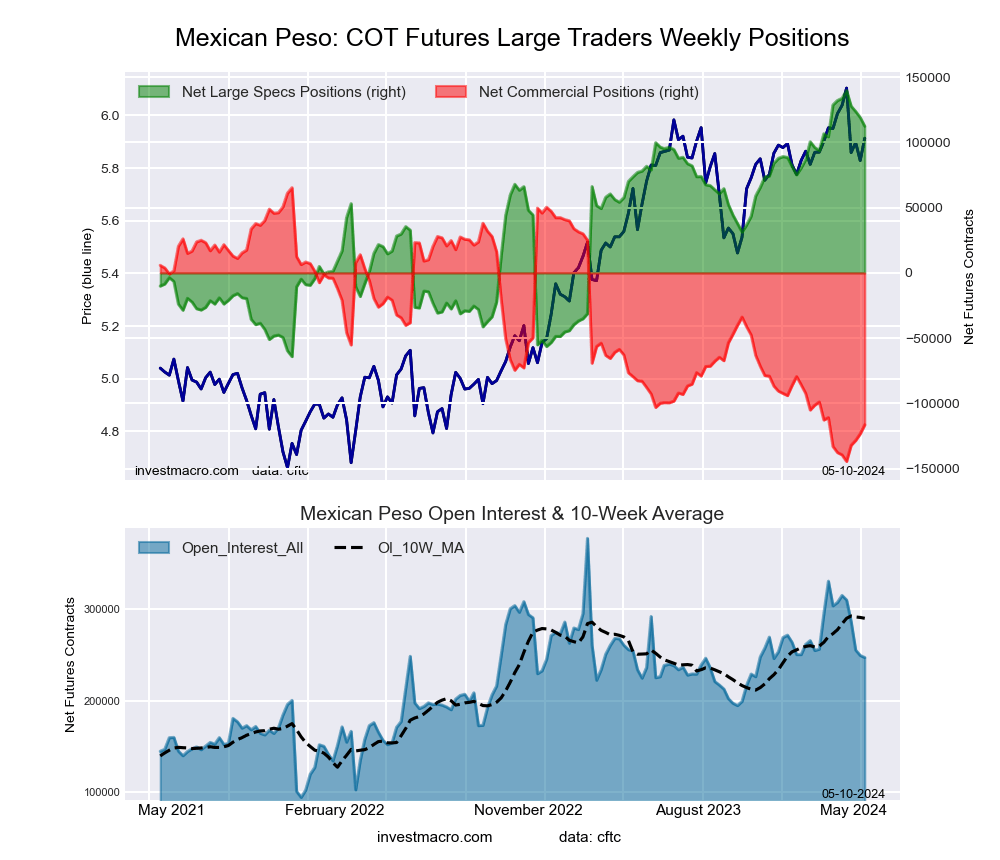
The Mexican Peso saw a small weekly gain by just 649 contracts but this broke a four-week losing streak that saw a total of -27,379 contracts subtracted from the overall bullish position. Despite the recent weakness in positions, the MXN speculative position has remained the most bullish currency versus the US dollar and has maintained a speculator position above the +100,000 contract level for eleven consecutive weeks. This is the best +100,000 contract streak since late-2019 into early-2020. The MXN exchange rate versus the USD has been trending strongly higher over the past three weeks with a gain of approximately 4 percent in these three weeks and has now brought the exchange rate into positive territory year-to-date.


Currencies Net Speculators Leaderboard
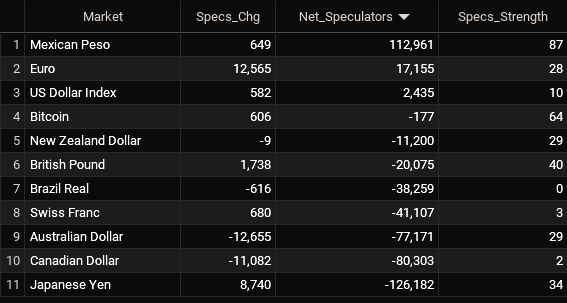
Legend: Weekly Speculators Change | Speculators Current Net Position | Speculators Strength Score compared to last 3-Years (0-100 range)


Strength Scores led by the Mexican Peso
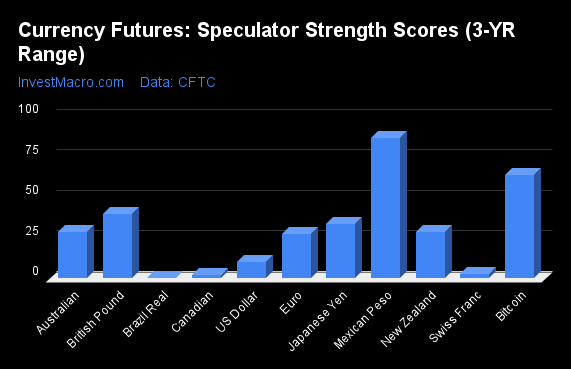
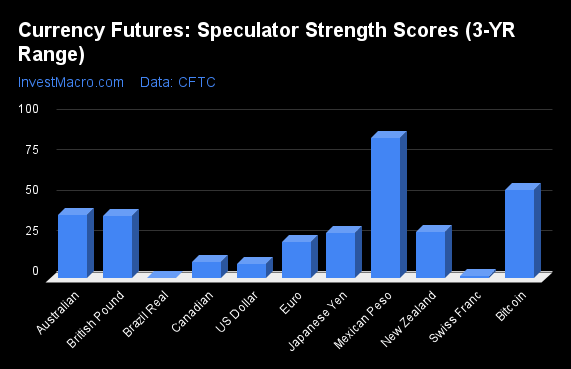
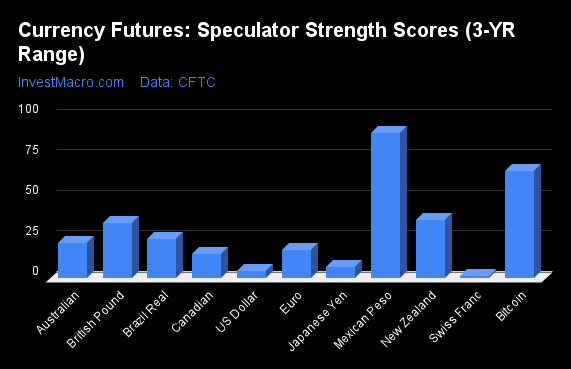
COT Strength Scores (a normalized measure of Speculator positions over a 3-Year range, from 0 to 100 where above 80 is Extreme-Bullish and below 20 is Extreme-Bearish) showed that the Mexican Peso (87 percent) leads the currency markets this week. Bitcoin (64 percent) comes in as the next highest in the weekly strength scores.

On the downside, the Brazilian Real (0 percent), the Canadian Dollar (2 percent), the Swiss Franc (3 percent) and the US Dollar Index (10 percent) come in at the lowest strength levels currently and are in Extreme-Bearish territory (below 20 percent).

Strength Statistics:
US Dollar Index (10.0 percent) vs US Dollar Index previous week (8.8 percent)
EuroFX (27.6 percent) vs EuroFX previous week (22.3 percent)
British Pound Sterling (40.0 percent) vs British Pound Sterling previous week (38.8 percent)
Japanese Yen (33.6 percent) vs Japanese Yen previous week (28.1 percent)
Swiss Franc (2.6 percent) vs Swiss Franc previous week (1.4 percent)
Canadian Dollar (1.9 percent) vs Canadian Dollar previous week (10.3 percent)
Australian Dollar (28.5 percent) vs Australian Dollar previous week (40.3 percent)
New Zealand Dollar (28.6 percent) vs New Zealand Dollar previous week (28.6 percent)
Mexican Peso (86.9 percent) vs Mexican Peso previous week (86.6 percent)
Brazilian Real (0.0 percent) vs Brazilian Real previous week (0.7 percent)
Bitcoin (63.7 percent) vs Bitcoin previous week (54.6 percent)


Australian Dollar & Japanese Yen top the 6-Week Strength Trends
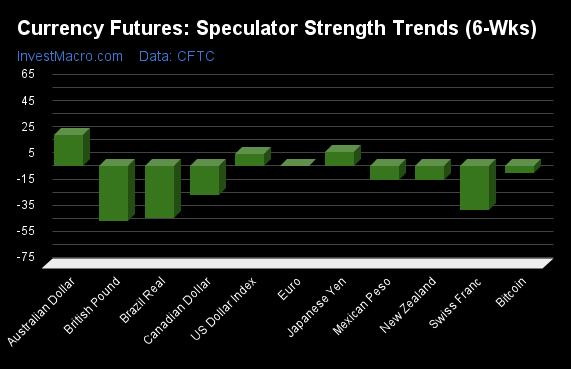
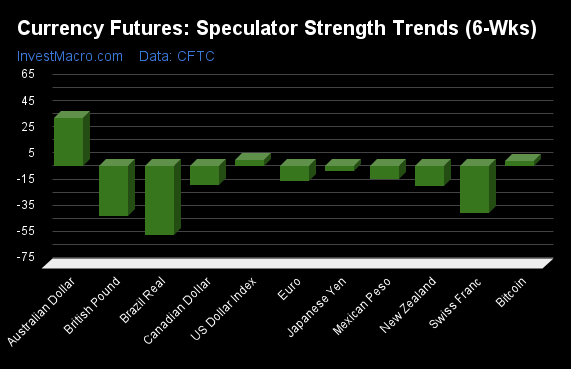
COT Strength Score Trends (or move index, calculates the 6-week changes in strength scores) showed that the Australian Dollar (24 percent) and the Japanese Yen (11 percent) lead the past six weeks trends for the currencies. The US Dollar Index (9 percent) is the next highest positive mover in the latest trends data.

The British Pound (-42 percent) leads the downside trend scores currently with the Brazilian Real (-39 percent), Swiss Franc (-33 percent) and the Canadian Dollar (-22 percent) following next with lower trend scores.

Strength Trend Statistics:
US Dollar Index (9.2 percent) vs US Dollar Index previous week (5.2 percent)
EuroFX (0.2 percent) vs EuroFX previous week (-11.3 percent)
British Pound Sterling (-42.1 percent) vs British Pound Sterling previous week (-37.8 percent)
Japanese Yen (10.7 percent) vs Japanese Yen previous week (-3.6 percent)
Swiss Franc (-33.4 percent) vs Swiss Franc previous week (-35.3 percent)
Canadian Dollar (-22.1 percent) vs Canadian Dollar previous week (-14.4 percent)
Australian Dollar (23.9 percent) vs Australian Dollar previous week (38.4 percent)
New Zealand Dollar (-10.4 percent) vs New Zealand Dollar previous week (-14.7 percent)
Mexican Peso (-10.2 percent) vs Mexican Peso previous week (-9.7 percent)
Brazilian Real (-39.4 percent) vs Brazilian Real previous week (-52.2 percent)
Bitcoin (-5.1 percent) vs Bitcoin previous week (4.4 percent)


Individual COT Forex Markets:

US Dollar Index Futures:
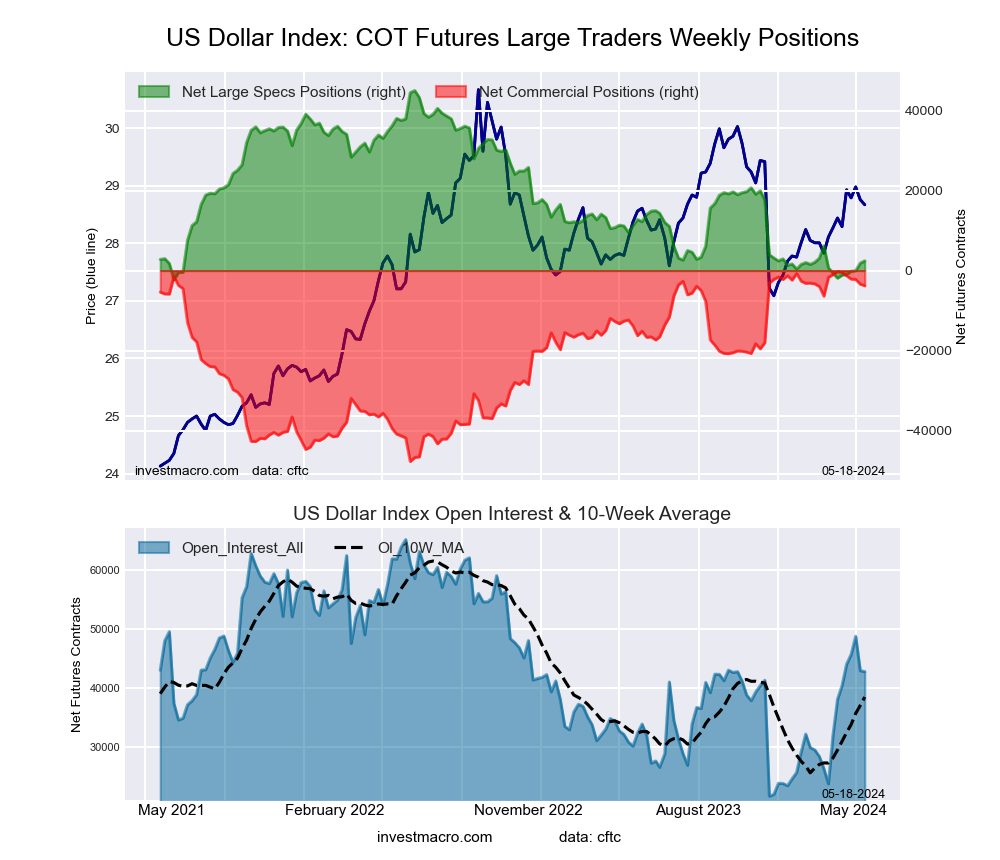
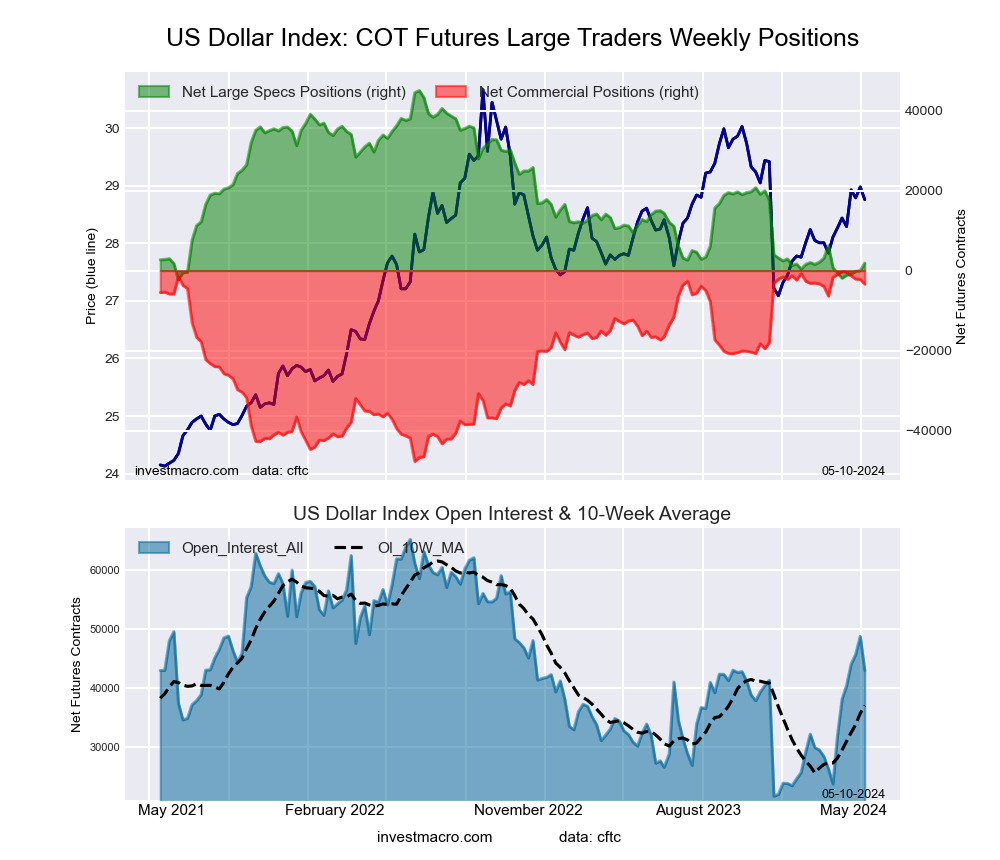
US Dollar Index Forex Futures COT ChartThe US Dollar Index large speculator standing this week was a net position of 2,435 contracts in the data reported through Tuesday. This was a weekly boost of 582 contracts from the previous week which had a total of 1,853 net contracts.

This week’s current strength score (the trader positioning range over the past three years, measured from 0 to 100) shows the speculators are currently Bearish-Extreme with a score of 10.0 percent. The commercials are Bullish-Extreme with a score of 92.7 percent and the small traders (not shown in chart) are Bearish with a score of 26.9 percent.

Price Trend-Following Model: Uptrend

Our weekly trend-following model classifies the current market price position as: Uptrend. The current action for the model is considered to be: Hold – Maintain Long Position.

US DOLLAR INDEX StatisticsSPECULATORSCOMMERCIALSSMALL TRADERS
– Percent of Open Interest Longs:69.319.88.3
– Percent of Open Interest Shorts:63.628.65.1
– Net Position:2,435-3,7901,355
– Gross Longs:29,6828,4723,535
– Gross Shorts:27,24712,2622,180
– Long to Short Ratio:1.1 to 10.7 to 11.6 to 1
NET POSITION TREND:
– Strength Index Score (3 Year Range Pct):10.092.726.9
– Strength Index Reading (3 Year Range):Bearish-ExtremeBullish-ExtremeBearish
NET POSITION MOVEMENT INDEX:
– 6-Week Change in Strength Index:9.2-7.3-9.8


Euro Currency Futures:

Euro Currency Futures COT ChartThe Euro Currency large speculator standing this week was a net position of 17,155 contracts in the data reported through Tuesday. This was a weekly boost of 12,565 contracts from the previous week which had a total of 4,590 net contracts.

This week’s current strength score (the trader positioning range over the past three years, measured from 0 to 100) shows the speculators are currently Bearish with a score of 27.6 percent. The commercials are Bullish with a score of 74.9 percent and the small traders (not shown in chart) are Bearish-Extreme with a score of 12.7 percent.

Price Trend-Following Model: Weak Downtrend

Our weekly trend-following model classifies the current market price position as: Weak Downtrend. The current action for the model is considered to be: Hold – Maintain Short Position.

EURO Currency StatisticsSPECULATORSCOMMERCIALSSMALL TRADERS
– Percent of Open Interest Longs:27.259.011.6
– Percent of Open Interest Shorts:24.564.98.4
– Net Position:17,155-38,28221,127
– Gross Longs:178,398387,81276,472
– Gross Shorts:161,243426,09455,345
– Long to Short Ratio:1.1 to 10.9 to 11.4 to 1
NET POSITION TREND:
– Strength Index Score (3 Year Range Pct):27.674.912.7
– Strength Index Reading (3 Year Range):BearishBullishBearish-Extreme
NET POSITION MOVEMENT INDEX:
– 6-Week Change in Strength Index:0.2-1.87.2


British Pound Sterling Futures:

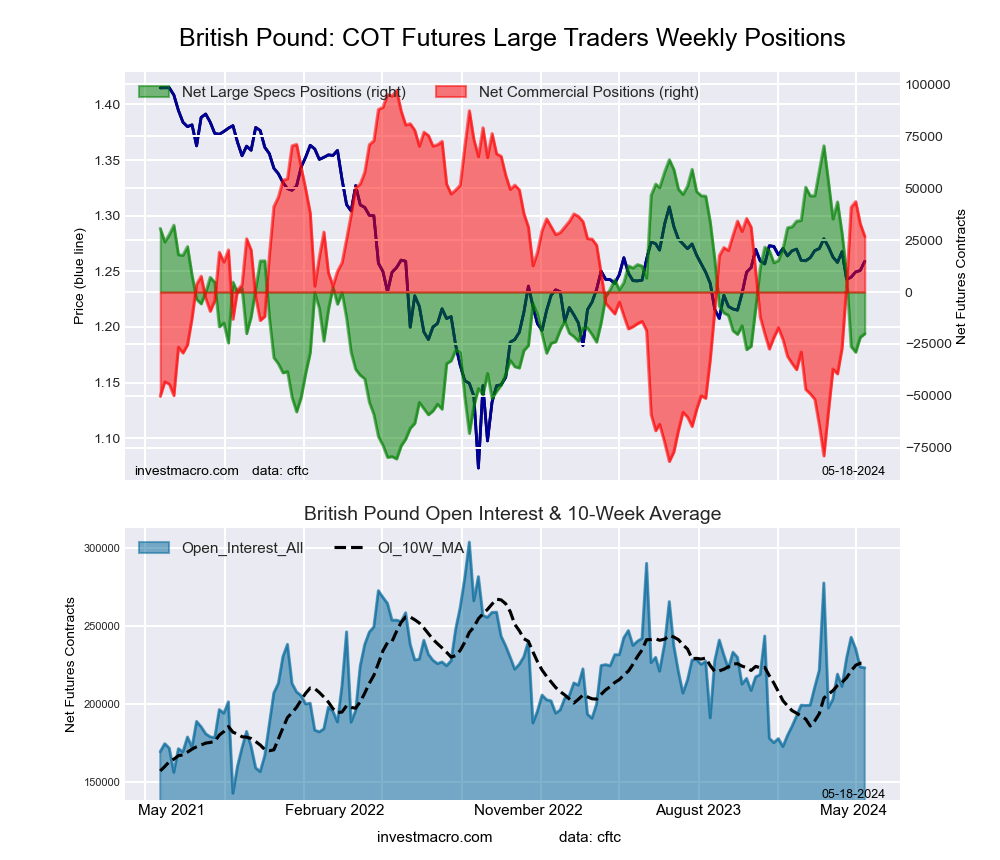
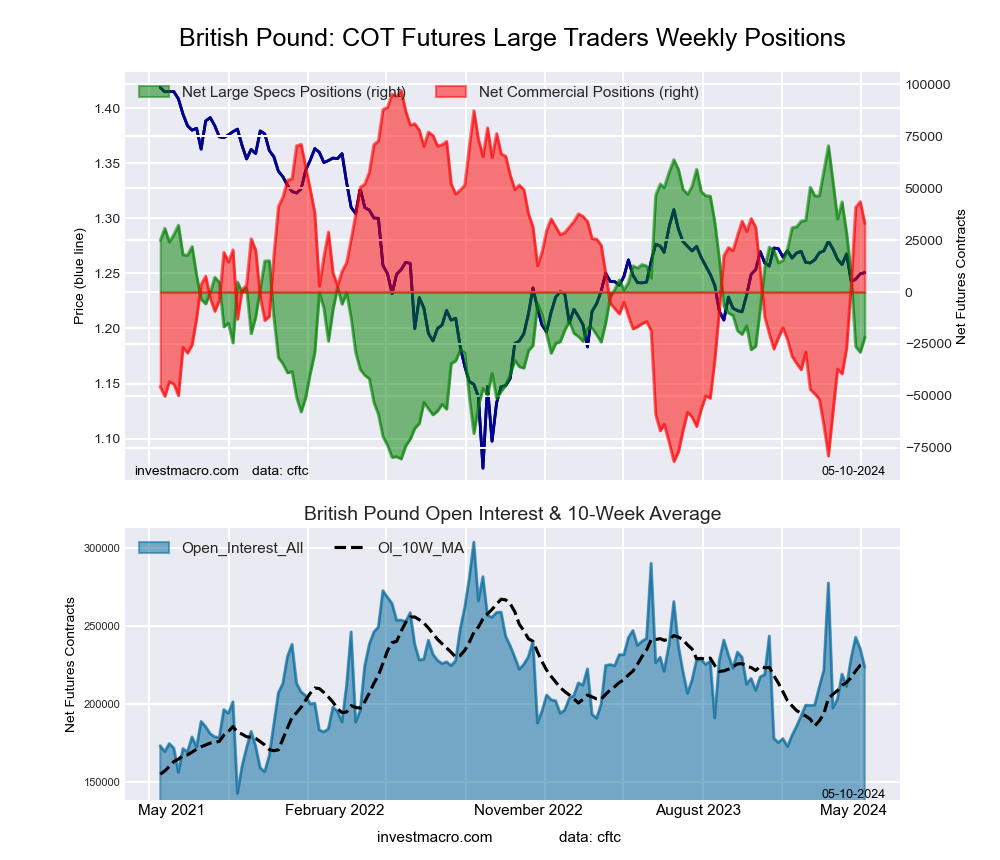
British Pound Sterling Futures COT ChartThe British Pound Sterling large speculator standing this week was a net position of -20,075 contracts in the data reported through Tuesday. This was a weekly lift of 1,738 contracts from the previous week which had a total of -21,813 net contracts.

This week’s current strength score (the trader positioning range over the past three years, measured from 0 to 100) shows the speculators are currently Bearish with a score of 40.0 percent. The commercials are Bullish with a score of 60.7 percent and the small traders (not shown in chart) are Bearish with a score of 46.5 percent.

Price Trend-Following Model: Weak Downtrend

Our weekly trend-following model classifies the current market price position as: Weak Downtrend. The current action for the model is considered to be: Hold – Maintain Short Position.

BRITISH POUND StatisticsSPECULATORSCOMMERCIALSSMALL TRADERS
– Percent of Open Interest Longs:21.861.811.6
– Percent of Open Interest Shorts:30.849.814.6
– Net Position:-20,07526,795-6,720
– Gross Longs:48,674137,91725,869
– Gross Shorts:68,749111,12232,589
– Long to Short Ratio:0.7 to 11.2 to 10.8 to 1
NET POSITION TREND:
– Strength Index Score (3 Year Range Pct):40.060.746.5
– Strength Index Reading (3 Year Range):BearishBullishBearish
NET POSITION MOVEMENT INDEX:
– 6-Week Change in Strength Index:-42.137.1-5.5


Japanese Yen Futures:

Japanese Yen Forex Futures COT ChartThe Japanese Yen large speculator standing this week was a net position of -126,182 contracts in the data reported through Tuesday. This was a weekly rise of 8,740 contracts from the previous week which had a total of -134,922 net contracts.

This week’s current strength score (the trader positioning range over the past three years, measured from 0 to 100) shows the speculators are currently Bearish with a score of 33.6 percent. The commercials are Bullish with a score of 71.7 percent and the small traders (not shown in chart) are Bullish with a score of 60.3 percent.

Price Trend-Following Model: Downtrend

Our weekly trend-following model classifies the current market price position as: Downtrend. The current action for the model is considered to be: Hold – Maintain Short Position.

JAPANESE YEN StatisticsSPECULATORSCOMMERCIALSSMALL TRADERS
– Percent of Open Interest Longs:11.972.713.3
– Percent of Open Interest Shorts:54.327.915.6
– Net Position:-126,182133,294-7,112
– Gross Longs:35,303216,44239,446
– Gross Shorts:161,48583,14846,558
– Long to Short Ratio:0.2 to 12.6 to 10.8 to 1
NET POSITION TREND:
– Strength Index Score (3 Year Range Pct):33.671.760.3
– Strength Index Reading (3 Year Range):BearishBullishBullish
NET POSITION MOVEMENT INDEX:
– 6-Week Change in Strength Index:10.7-3.8-34.1


Swiss Franc Futures:

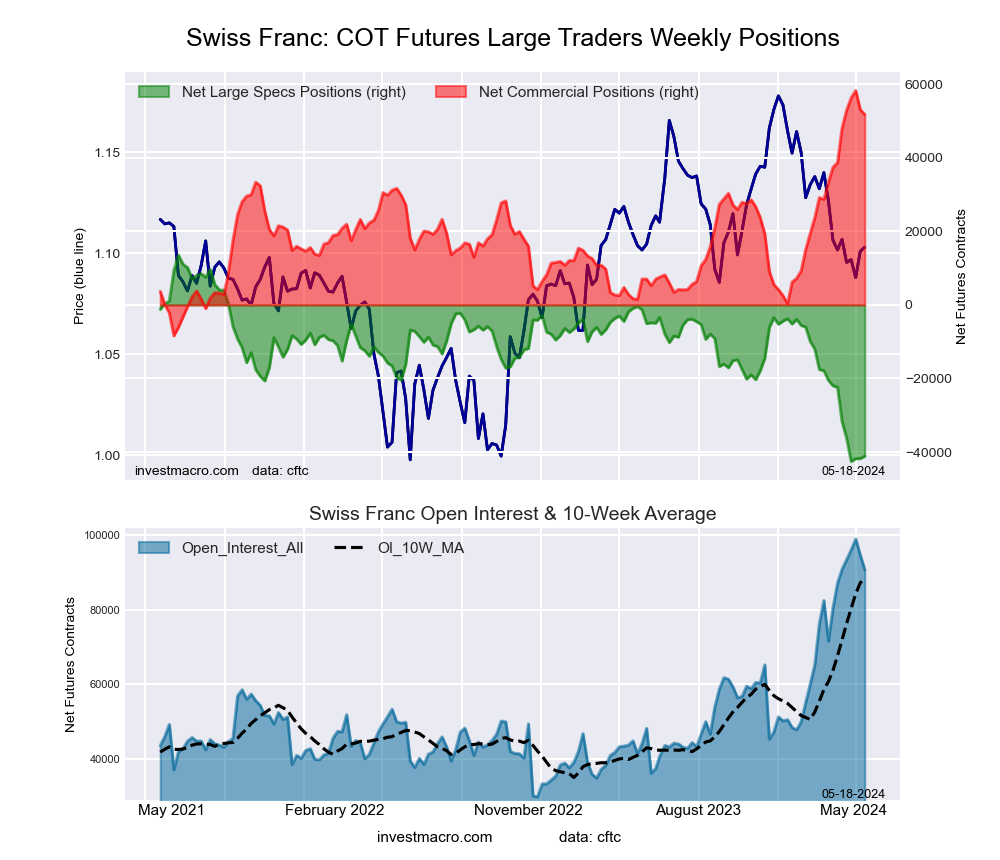
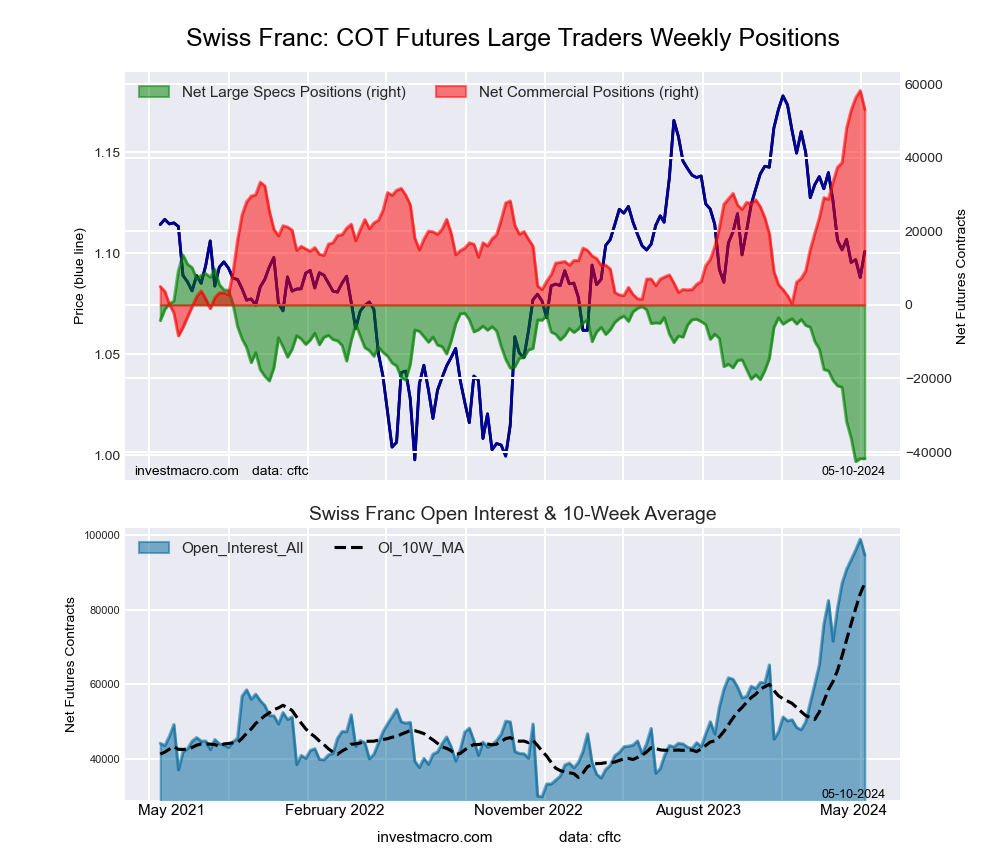
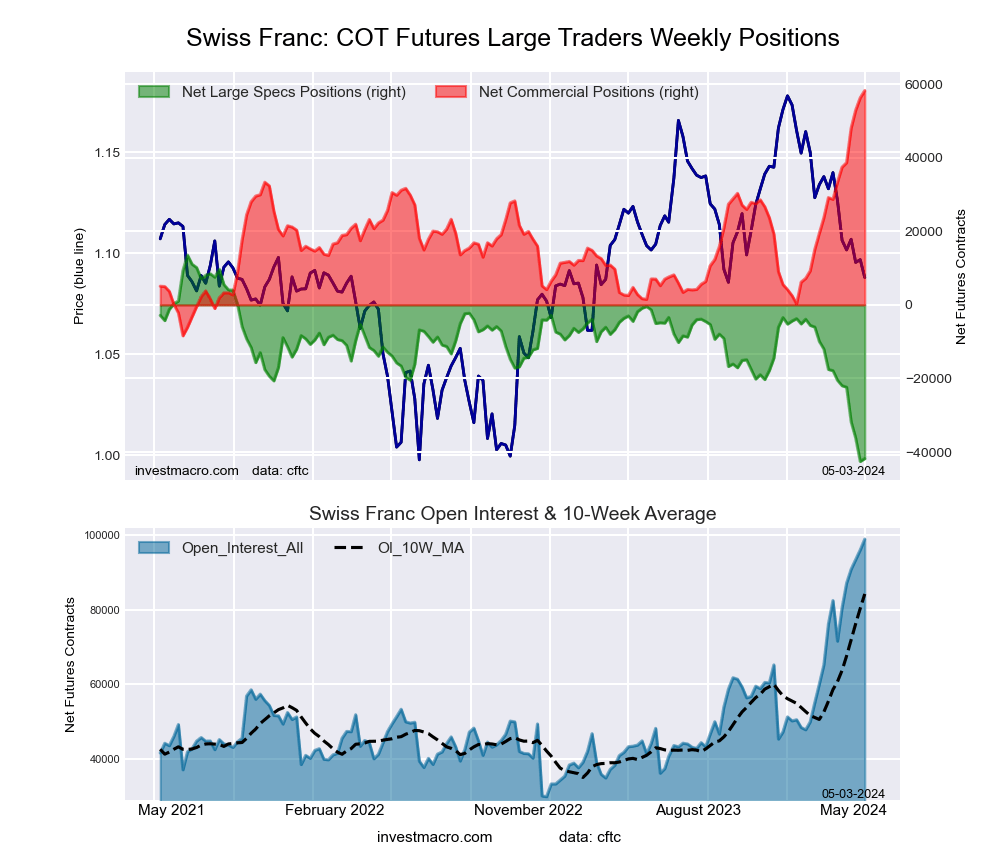
Swiss Franc Forex Futures COT ChartThe Swiss Franc large speculator standing this week was a net position of -41,107 contracts in the data reported through Tuesday. This was a small weekly advance of 680 contracts from the previous week which had a total of -41,787 net contracts.

This week’s current strength score (the trader positioning range over the past three years, measured from 0 to 100) shows the speculators are currently Bearish-Extreme with a score of 2.6 percent. The commercials are Bullish-Extreme with a score of 90.2 percent and the small traders (not shown in chart) are Bearish with a score of 28.8 percent.

Price Trend-Following Model: Downtrend

Our weekly trend-following model classifies the current market price position as: Downtrend. The current action for the model is considered to be: Hold – Maintain Short Position.

SWISS FRANC StatisticsSPECULATORSCOMMERCIALSSMALL TRADERS
– Percent of Open Interest Longs:7.379.112.3
– Percent of Open Interest Shorts:52.622.024.0
– Net Position:-41,10751,769-10,662
– Gross Longs:6,64671,74511,121
– Gross Shorts:47,75319,97621,783
– Long to Short Ratio:0.1 to 13.6 to 10.5 to 1
NET POSITION TREND:
– Strength Index Score (3 Year Range Pct):2.690.228.8
– Strength Index Reading (3 Year Range):Bearish-ExtremeBullish-ExtremeBearish
NET POSITION MOVEMENT INDEX:
– 6-Week Change in Strength Index:-33.419.625.7


Canadian Dollar Futures:

Canadian Dollar Forex Futures COT ChartThe Canadian Dollar large speculator standing this week was a net position of -80,303 contracts in the data reported through Tuesday. This was a weekly decrease of -11,082 contracts from the previous week which had a total of -69,221 net contracts.

This week’s current strength score (the trader positioning range over the past three years, measured from 0 to 100) shows the speculators are currently Bearish-Extreme with a score of 1.9 percent. The commercials are Bullish-Extreme with a score of 92.3 percent and the small traders (not shown in chart) are Bearish with a score of 28.1 percent.

Price Trend-Following Model: Downtrend

Our weekly trend-following model classifies the current market price position as: Downtrend. The current action for the model is considered to be: Hold – Maintain Short Position.

CANADIAN DOLLAR StatisticsSPECULATORSCOMMERCIALSSMALL TRADERS
– Percent of Open Interest Longs:15.566.814.7
– Percent of Open Interest Shorts:51.931.413.8
– Net Position:-80,30378,2202,083
– Gross Longs:34,286147,62632,492
– Gross Shorts:114,58969,40630,409
– Long to Short Ratio:0.3 to 12.1 to 11.1 to 1
NET POSITION TREND:
– Strength Index Score (3 Year Range Pct):1.992.328.1
– Strength Index Reading (3 Year Range):Bearish-ExtremeBullish-ExtremeBearish
NET POSITION MOVEMENT INDEX:
– 6-Week Change in Strength Index:-22.114.87.6


Australian Dollar Futures:

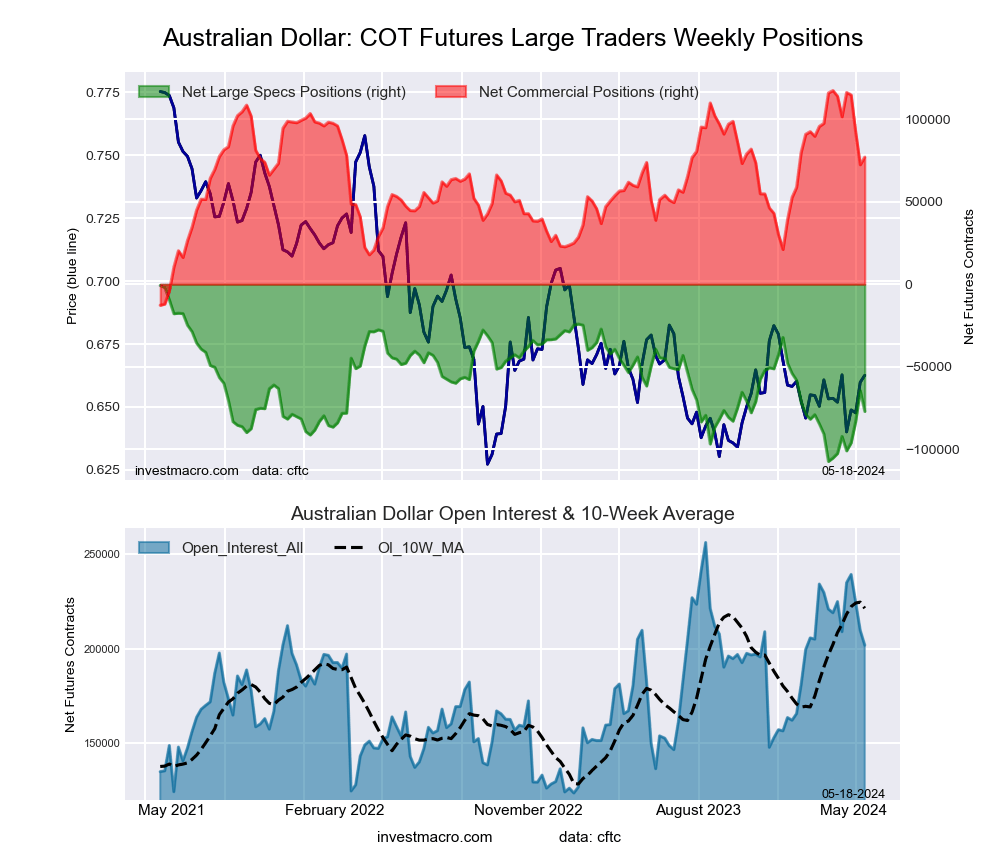
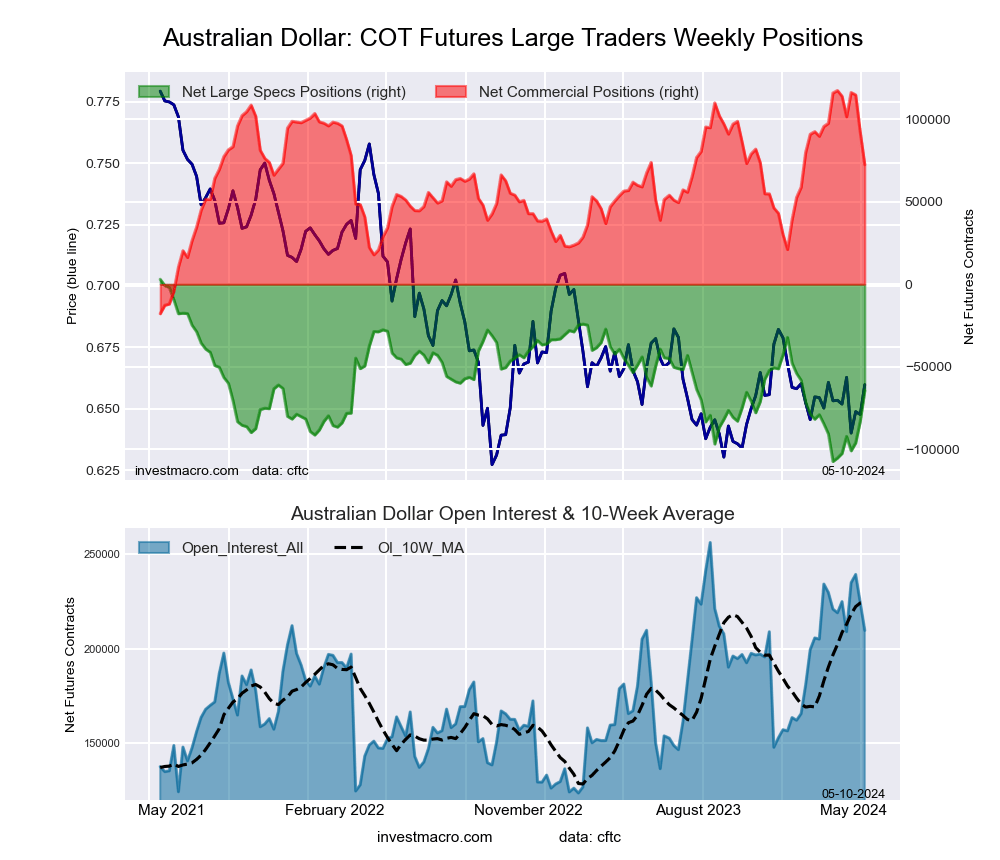
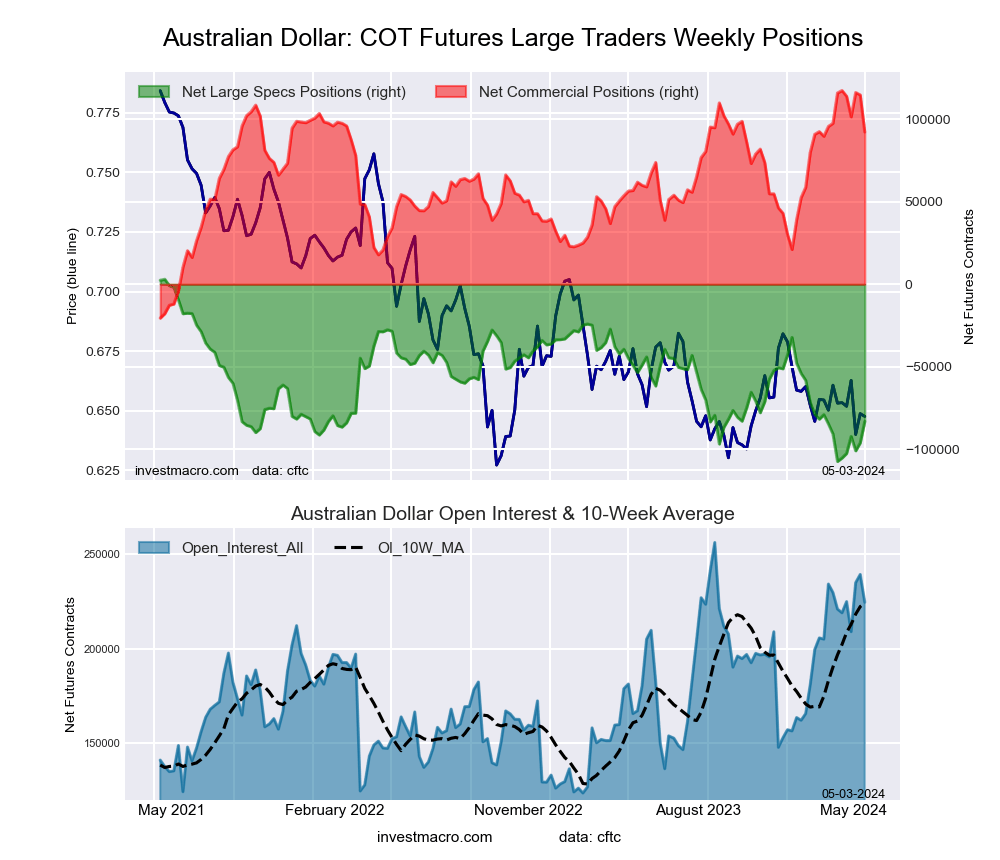
Australian Dollar Forex Futures COT ChartThe Australian Dollar large speculator standing this week was a net position of -77,171 contracts in the data reported through Tuesday. This was a weekly drop of -12,655 contracts from the previous week which had a total of -64,516 net contracts.

This week’s current strength score (the trader positioning range over the past three years, measured from 0 to 100) shows the speculators are currently Bearish with a score of 28.5 percent. The commercials are Bullish with a score of 69.0 percent and the small traders (not shown in chart) are Bullish with a score of 58.7 percent.

Price Trend-Following Model: Weak Downtrend

Our weekly trend-following model classifies the current market price position as: Weak Downtrend. The current action for the model is considered to be: Hold – Maintain Short Position.

AUSTRALIAN DOLLAR StatisticsSPECULATORSCOMMERCIALSSMALL TRADERS
– Percent of Open Interest Longs:19.965.212.8
– Percent of Open Interest Shorts:58.127.012.8
– Net Position:-77,17177,14229
– Gross Longs:40,059131,59625,881
– Gross Shorts:117,23054,45425,852
– Long to Short Ratio:0.3 to 12.4 to 11.0 to 1
NET POSITION TREND:
– Strength Index Score (3 Year Range Pct):28.569.058.7
– Strength Index Reading (3 Year Range):BearishBullishBullish
NET POSITION MOVEMENT INDEX:
– 6-Week Change in Strength Index:23.9-28.331.2


New Zealand Dollar Futures:

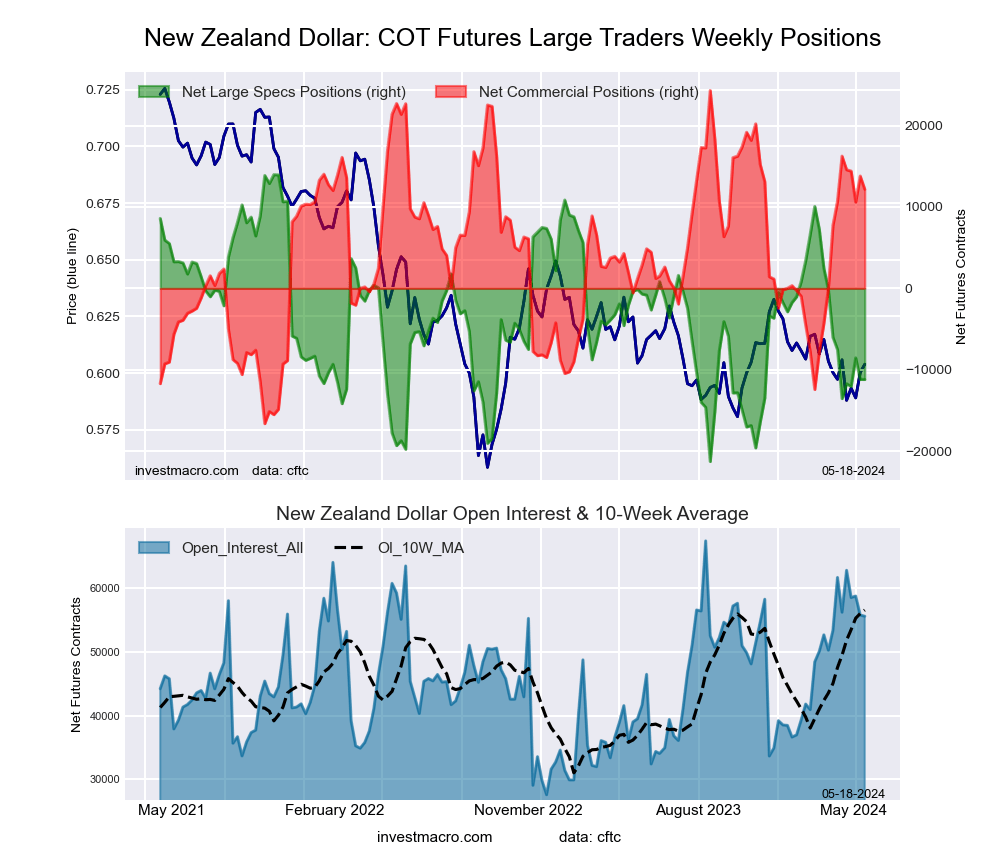
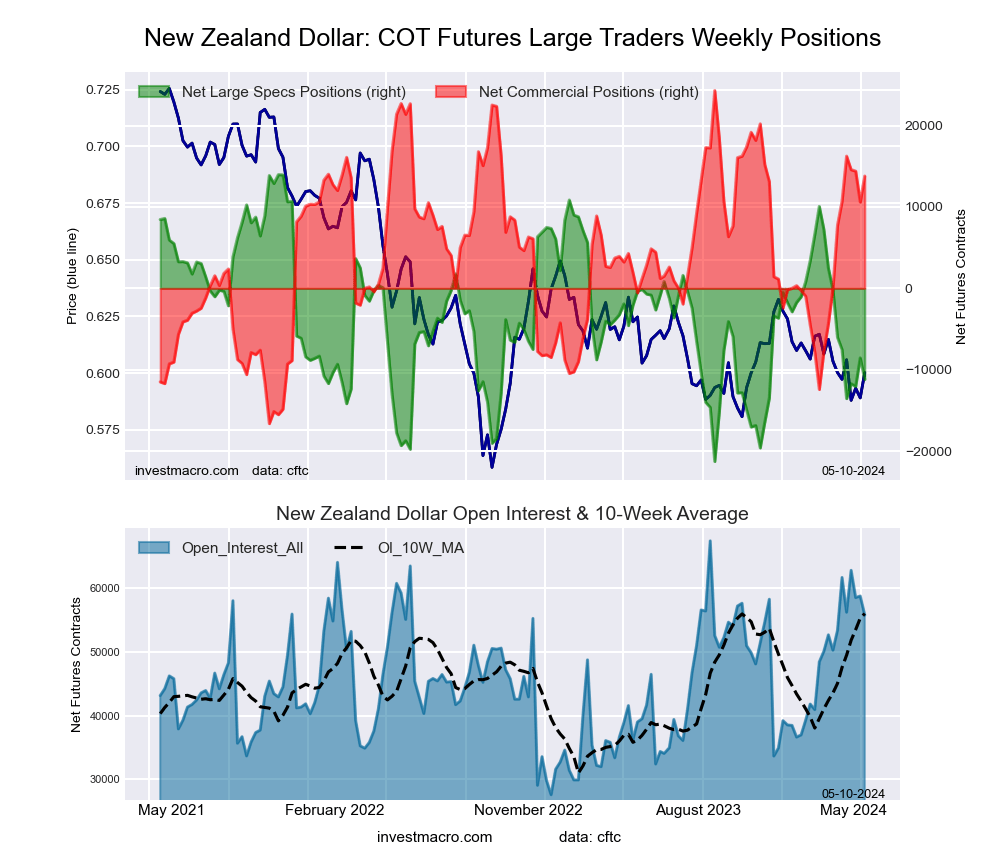
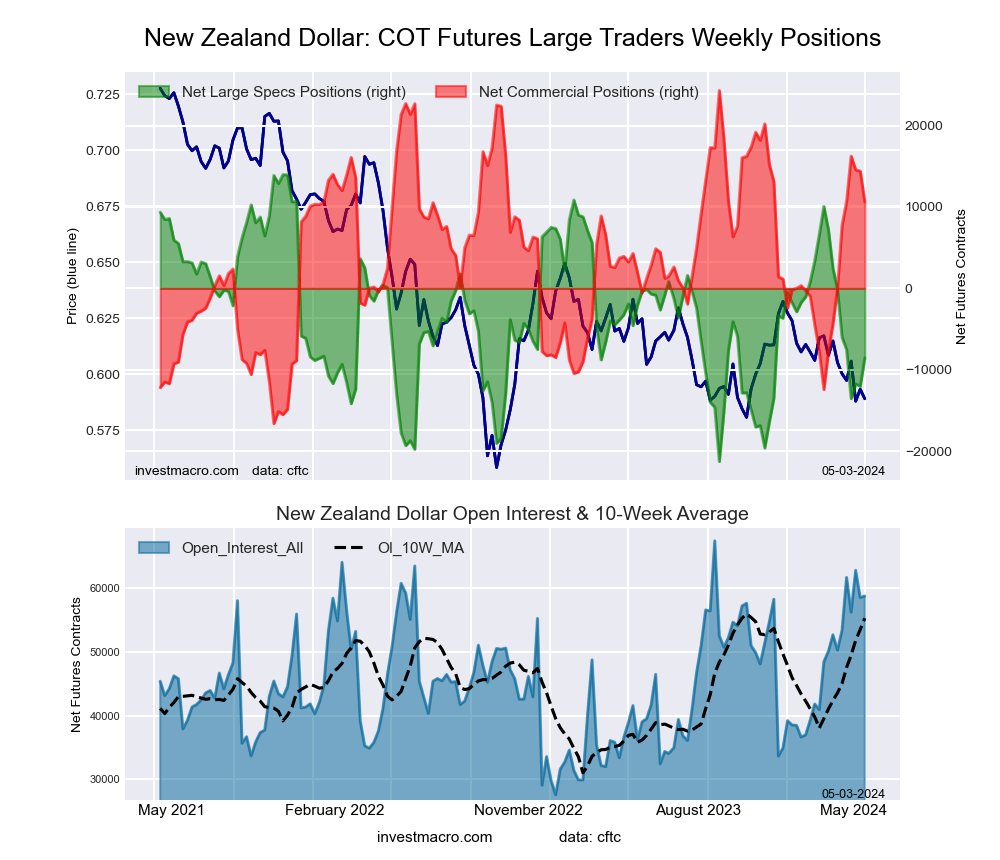
New Zealand Dollar Forex Futures COT ChartThe New Zealand Dollar large speculator standing this week was a net position of -11,200 contracts in the data reported through Tuesday. This was a weekly dip of just -9 contracts from the previous week which had a total of -11,191 net contracts.

This week’s current strength score (the trader positioning range over the past three years, measured from 0 to 100) shows the speculators are currently Bearish with a score of 28.6 percent. The commercials are Bullish with a score of 70.3 percent and the small traders (not shown in chart) are Bearish with a score of 41.8 percent.

Price Trend-Following Model: Weak Downtrend

Our weekly trend-following model classifies the current market price position as: Weak Downtrend. The current action for the model is considered to be: Hold – Maintain Short Position.

NEW ZEALAND DOLLAR StatisticsSPECULATORSCOMMERCIALSSMALL TRADERS
– Percent of Open Interest Longs:34.758.36.6
– Percent of Open Interest Shorts:54.836.58.3
– Net Position:-11,20012,162-962
– Gross Longs:19,28432,4513,683
– Gross Shorts:30,48420,2894,645
– Long to Short Ratio:0.6 to 11.6 to 10.8 to 1
NET POSITION TREND:
– Strength Index Score (3 Year Range Pct):28.670.341.8
– Strength Index Reading (3 Year Range):BearishBullishBearish
NET POSITION MOVEMENT INDEX:
– 6-Week Change in Strength Index:-10.43.628.4


Mexican Peso Futures:

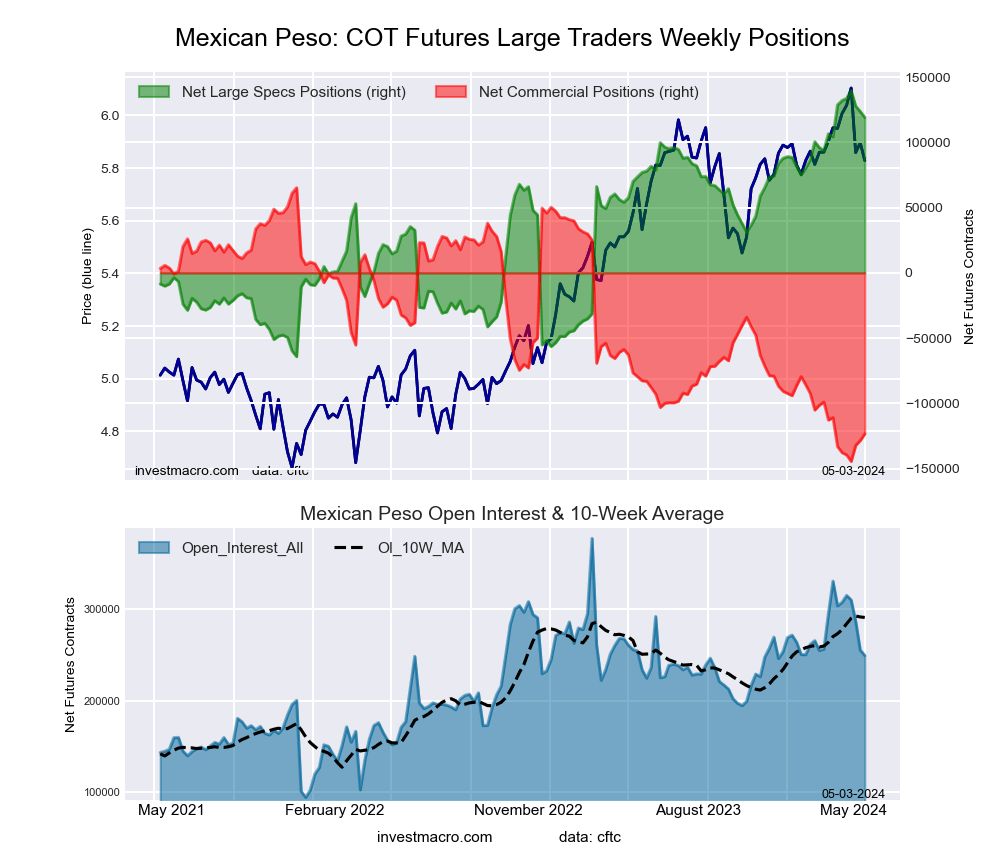
Mexican Peso Futures COT ChartThe Mexican Peso large speculator standing this week was a net position of 112,961 contracts in the data reported through Tuesday. This was a weekly advance of 649 contracts from the previous week which had a total of 112,312 net contracts.

This week’s current strength score (the trader positioning range over the past three years, measured from 0 to 100) shows the speculators are currently Bullish-Extreme with a score of 86.9 percent. The commercials are Bearish-Extreme with a score of 13.3 percent and the small traders (not shown in chart) are Bearish with a score of 34.4 percent.

Price Trend-Following Model: Strong Uptrend

Our weekly trend-following model classifies the current market price position as: Strong Uptrend. The current action for the model is considered to be: Hold – Maintain Long Position.

MEXICAN PESO StatisticsSPECULATORSCOMMERCIALSSMALL TRADERS
– Percent of Open Interest Longs:55.941.02.7
– Percent of Open Interest Shorts:12.186.21.3
– Net Position:112,961-116,6013,640
– Gross Longs:144,307105,8406,997
– Gross Shorts:31,346222,4413,357
– Long to Short Ratio:4.6 to 10.5 to 12.1 to 1
NET POSITION TREND:
– Strength Index Score (3 Year Range Pct):86.913.334.4
– Strength Index Reading (3 Year Range):Bullish-ExtremeBearish-ExtremeBearish
NET POSITION MOVEMENT INDEX:
– 6-Week Change in Strength Index:-10.210.9-13.2


Brazilian Real Futures:

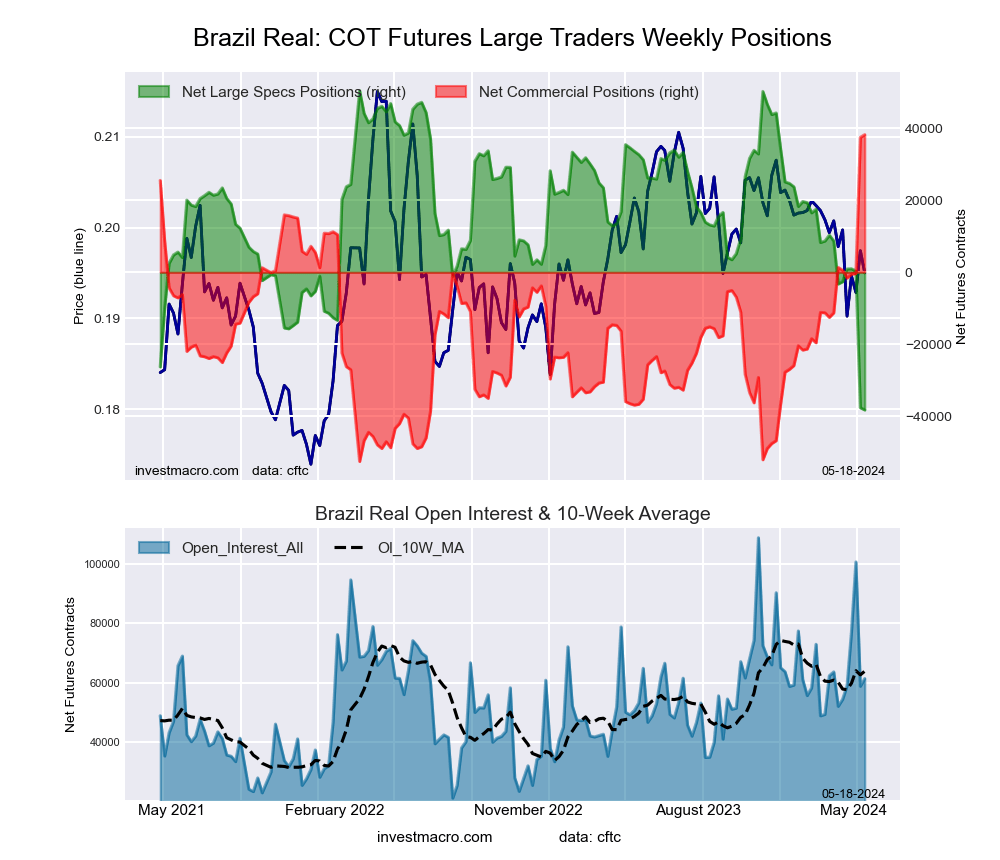
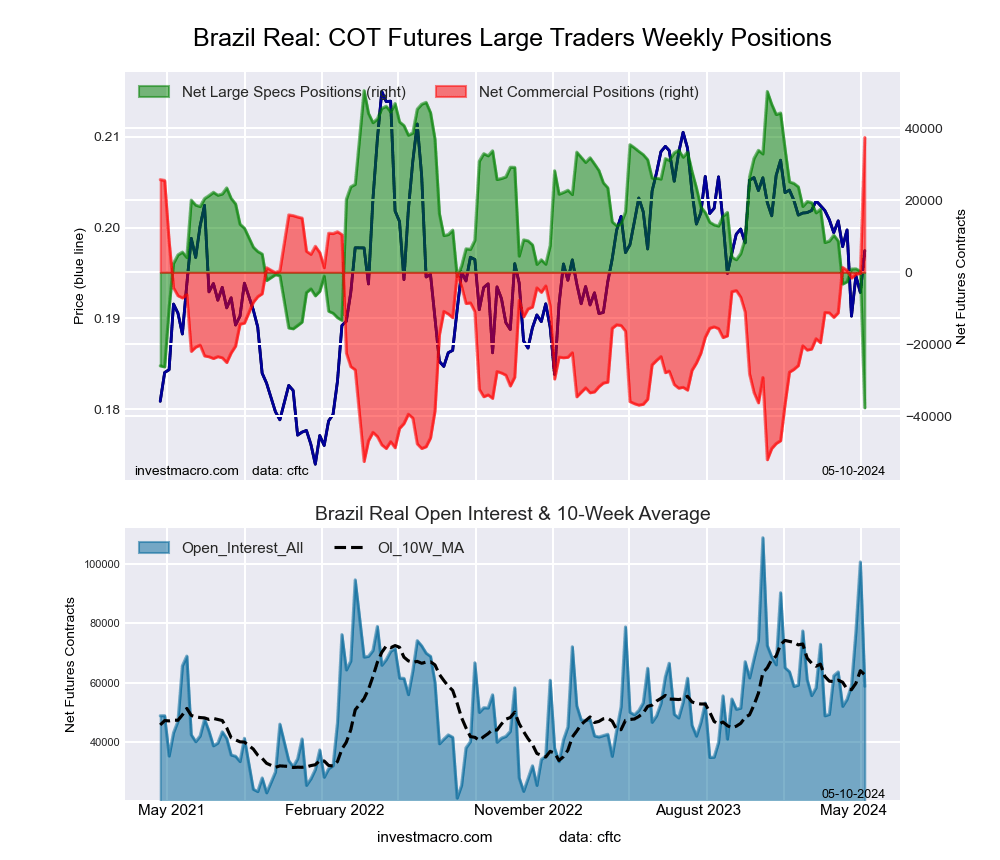
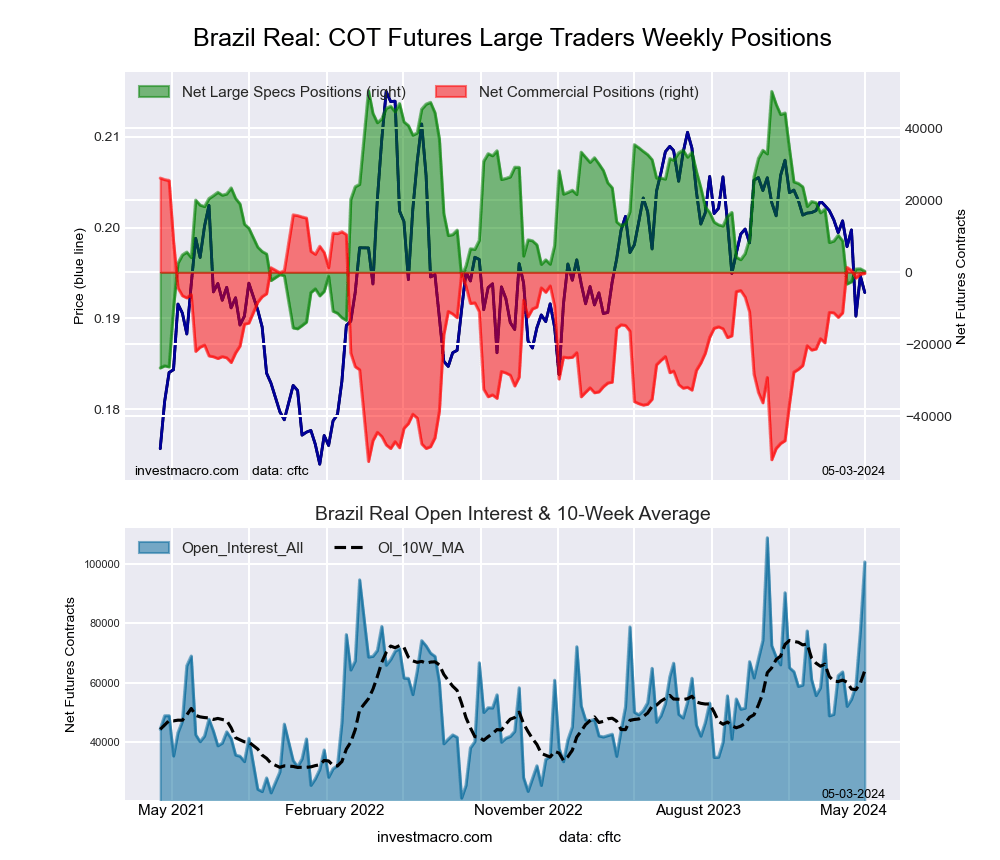
Brazil Real Futures COT ChartThe Brazilian Real large speculator standing this week was a net position of -38,259 contracts in the data reported through Tuesday. This was a weekly reduction of -616 contracts from the previous week which had a total of -37,643 net contracts.

This week’s current strength score (the trader positioning range over the past three years, measured from 0 to 100) shows the speculators are currently Bearish-Extreme with a score of 0.0 percent. The commercials are Bullish-Extreme with a score of 100.0 percent and the small traders (not shown in chart) are Bearish with a score of 34.5 percent.

Price Trend-Following Model: Downtrend

Our weekly trend-following model classifies the current market price position as: Downtrend. The current action for the model is considered to be: Hold – Maintain Short Position.

BRAZIL REAL StatisticsSPECULATORSCOMMERCIALSSMALL TRADERS
– Percent of Open Interest Longs:18.378.23.4
– Percent of Open Interest Shorts:80.715.93.4
– Net Position:-38,25938,24910
– Gross Longs:11,25747,9832,105
– Gross Shorts:49,5169,7342,095
– Long to Short Ratio:0.2 to 14.9 to 11.0 to 1
NET POSITION TREND:
– Strength Index Score (3 Year Range Pct):0.0100.034.5
– Strength Index Reading (3 Year Range):Bearish-ExtremeBullish-ExtremeBearish
NET POSITION MOVEMENT INDEX:
– 6-Week Change in Strength Index:-39.440.6-17.6


Bitcoin Futures:

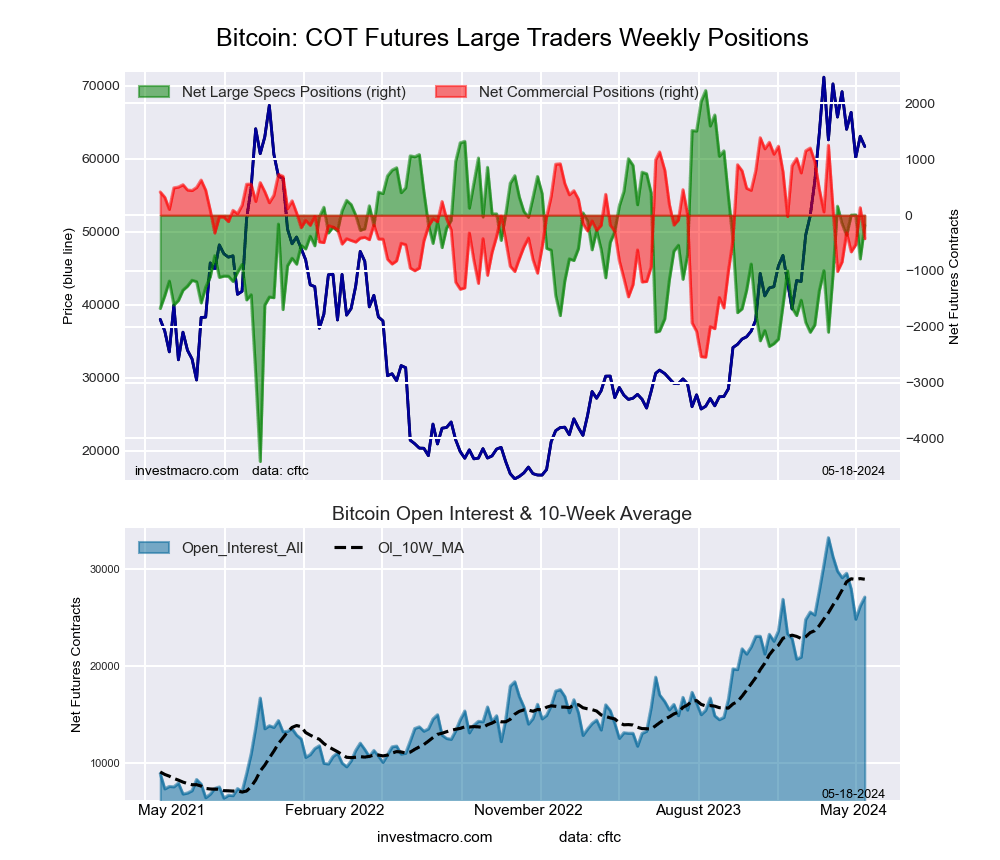
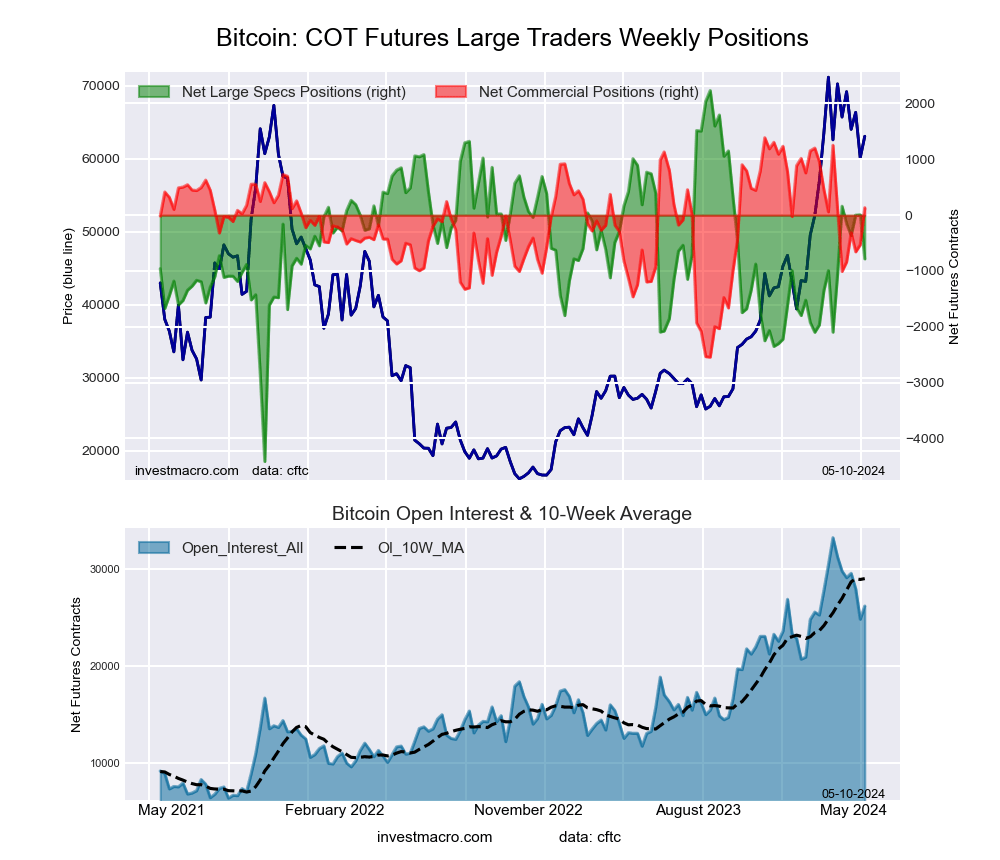
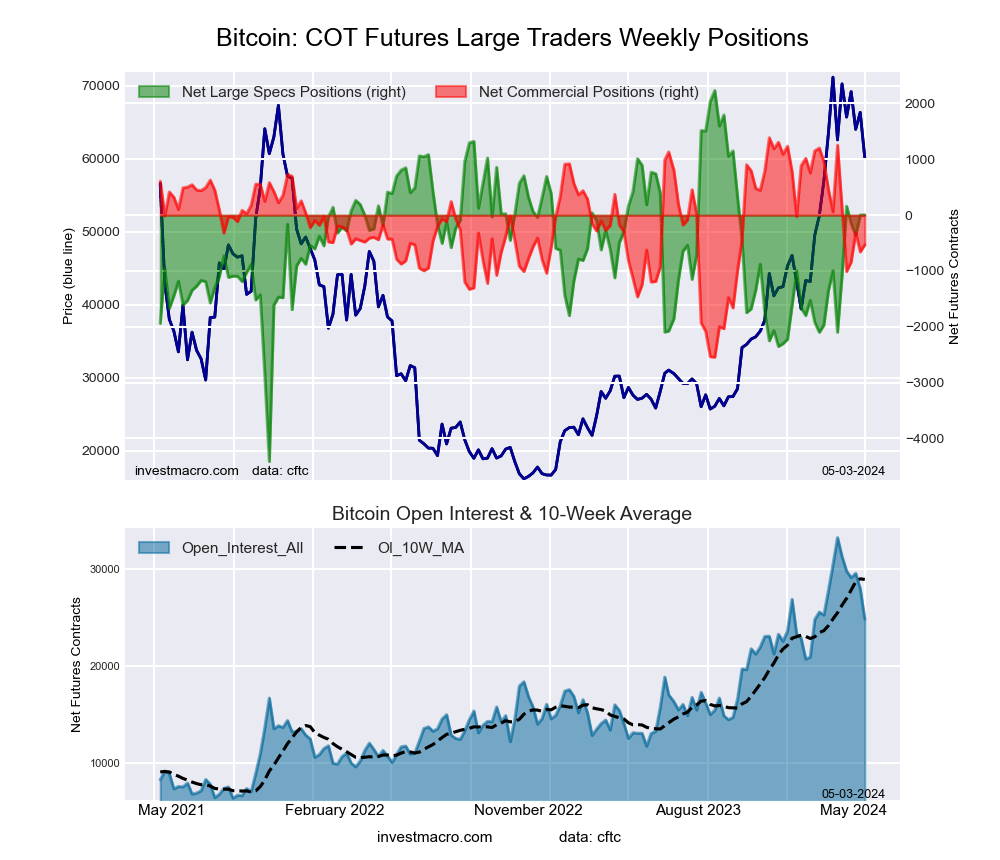
Bitcoin Crypto Futures COT ChartThe Bitcoin large speculator standing this week was a net position of -177 contracts in the data reported through Tuesday. This was a weekly rise of 606 contracts from the previous week which had a total of -783 net contracts.

This week’s current strength score (the trader positioning range over the past three years, measured from 0 to 100) shows the speculators are currently Bullish with a score of 63.7 percent. The commercials are Bullish with a score of 54.0 percent and the small traders (not shown in chart) are Bearish with a score of 26.5 percent.

Price Trend-Following Model: Uptrend

Our weekly trend-following model classifies the current market price position as: Uptrend. The current action for the model is considered to be: Hold – Maintain Long Position.

BITCOIN StatisticsSPECULATORSCOMMERCIALSSMALL TRADERS
– Percent of Open Interest Longs:77.84.15.6
– Percent of Open Interest Shorts:78.55.63.4
– Net Position:-177-421598
– Gross Longs:21,0781,0991,519
– Gross Shorts:21,2551,520921
– Long to Short Ratio:1.0 to 10.7 to 11.6 to 1
NET POSITION TREND:
– Strength Index Score (3 Year Range Pct):63.754.026.5
– Strength Index Reading (3 Year Range):BullishBullishBearish
NET POSITION MOVEMENT INDEX:
– 6-Week Change in Strength Index:-5.114.9-5.7


Article By InvestMacroReceive our weekly COT Newsletter

*COT Report: The COT data, released weekly to the public each Friday, is updated through the most recent Tuesday (data is 3 days old) and shows a quick view of how large speculators or non-commercials (for-profit traders) were positioned in the futures markets.

The CFTC categorizes trader positions according to commercial hedgers (traders who use futures contracts for hedging as part of the business), non-commercials (large traders who speculate to realize trading profits) and nonreportable traders (usually small traders/speculators) as well as their open interest (contracts open in the market at time of reporting). See CFTC criteria here.

Week Ahead: GBPNZD braces for double risk cocktail

By ForexTime 

  • RBNZ decision & UK CPI in focus
  • NZD best performing G10 currency MTD
  • GBPNZD trapped in 1500 pip range
  • Prices bearish on D1 charts
  • Bloomberg FX model: 76% GBPNZD – (2.0510 – 2.0924)

High impact events ranging from central bank decisions, key inflation data and speeches by policymakers may present fresh trading opportunities in the week ahead:

Sunday, 19th May

  • USDInd: Fed Chair Jerome Powell speech

Monday, 20th May

  • CN50: China loan prime rates
  • HK50: Hong Kong jobless rates
  • JPY: Japan tertiary industry index
  • TWN: Taiwan export orders
  • SEK: Riksbank Governor Erik Thedeen speech
  • US500: Fed speeches

Tuesday, 21st May

  • AU200: Australia consumer confidence, RBA minutes
  • CAD: Canada CPI
  • NGN: Nigeria rate decision
  • US30: Fed speeches

Wednesday, 22nd May

  • JP225: Japan core machinery orders, trade
  • NZD: RBNZ rate decision
  • ZAR: South Africa CPI
  • TWN: Taiwan jobless rate
  • GBP: UK April CPI
  • USDInd: FOMC minutes
  • NAS100: Nvidia earnings

Thursday, 23rd May

  • EU50: Eurozone PMI’s, consumer confidence
  • GER40: Germany manufacturing PMI
  • HK50: Hong Kong CPI
  • SG20: Singapore CPI, GDP
  • TWN: Taiwan industrial production
  • UK100: UK Manufacturing PMI

Friday, 24th May

  • CAD: Canada retail sales
  • GER40: Germany GDP
  • JP225: Japan CPI
  • NGN: Nigeria GDP
  • CHF: SNB President Thomas Jordan speech
  • SG20: Singapore industrial production
  • USDInd: US University of Michigan consumer sentiment

Our attention falls on the GBPNZD which has been trapped within a 1500-pip monthly range since August 2023.

Note: GBPNZD is a minor currency pair – one that does not include the USD but has at least one of the world’s majors.

However, prices have trended lower over the past few weeks. This could be based on shifting expectations over the Bank of England (BoE) and Reserve Bank of New Zealand’s (RBNZ) next policy move.

Interestingly, Sterling is down against most G10 currencies month-to-date.

But the New Zealand dollar is flexing its muscles across the board.

Keep all the above in mind, here are 3 factors that could rock the GBPNZD.

    1) New Zealand rate decision

The Reserve Bank of New Zealand (RBNZ) is expected to leave rates unchanged at 5.5% next week.

So, investors will direct their attention toward the policy statement and media conference for clues on future policy moves. It is noteworthy that first-quarter inflation printed hotter than expected, injecting RBNZ hawks with fresh inspiration. Any more hawkish hints during the meeting may further push back bets around when the central bank will start cutting rates.

Traders currently see a 50% probability of a 25-basis point RBNZ cut by August with this jumping to roughly 95% by October.  

  • The GBPNZD could sink lower if the RBNZ strikes a hawkish note and suggests that rates will remain higher for longer.
  • If the central bank signals lower rates down the road, this could push the GBPNZD higher.


    2) UK April CPI report

The incoming UK April inflation report will likely impact bets around when the Bank of England will start cutting interest rates.

Markets are forecasting:

  • CPI year-on-year (April 2023 vs. April 2024) to cool 2.1% from 3.2% in the prior month.
  • Core CPI year-on-year to cool to 3.6% to 4.2%.
  • CPI month-on-month (April 2024 vs March 2024) to cool 0.2% from 0.6%.

Headline inflation is expected to cool significantly with core inflation figures tagging along. A drop in household energy prices over the past year is expected to be the main driver behind this. Should the CPI report match or even print lower than these expectations, it may encourage the BoE to cut rates sooner than expected.

Traders see a 62% probability of a 25-basis point BoE cut by June with a move in August fully priced in.

  • A soft UK inflation report could send the GBPNZD lower as sterling weakens.
  • Should the CPI report print above market forecasts, the GBPNZD may push higher.


    3) Technical forces 

Prices are under pressure on the weekly charts, currently testing the 50-week SMA and bullish channel. A solid breakdown below the 2.0700 could signal further downside.

Zooming into the daily, there have been consistently lower lows and lower highs. Prices are trading below the 50, 100 and 200-day SMA while the MACD trades below zero.

  • Sustained weakness below 2.0775 may open a path back towards 2.0500.
  • Should prices push back above the 200-day SMA, this could open a path back to 2.0900.

Bloomberg FX model now forecasts a 76% chance that GBPNZD will trade within the 2.0510 – 2.0924 range through next week.


Forex-Time-LogoArticle by ForexTime

ForexTime Ltd (FXTM) is an award winning international online forex broker regulated by CySEC 185/12 www.forextime.com

JPY has sharply strengthened

By RoboForex Analytical Department

The yen’s exchange rate rose to the US dollar on Thursday in response to improving prospects for the Federal Reserve interest rate. The USDJPY pair has declined to 153.88.

After the US released up-to-date data on April inflation, the likelihood of a reduction in the cost of borrowing in the country increased markedly. Both the overall and the core consumer price index slowed in April, while retail sales stagnated. Hypothetically, an interest rate cut from the Federal Reserve means a narrower gap between the Federal Reserve and the Bank of Japan’s monetary approaches, which is a positive signal for the yen.

Japan’s GDP statistics were weaker than expected, with Japan’s economy contracting by 2.0% y/y in Q1 2024 compared to the expected decline of 1.5%. The primary driver is weak private consumption, which has been declining for four consecutive quarters.

Such a report considerably complicates the operations of the Bank of Japan. The regulator needs to take actions to keep a balance between supporting the economy and fighting the consequences of the weak yen.

USD/JPY Technical Analysis

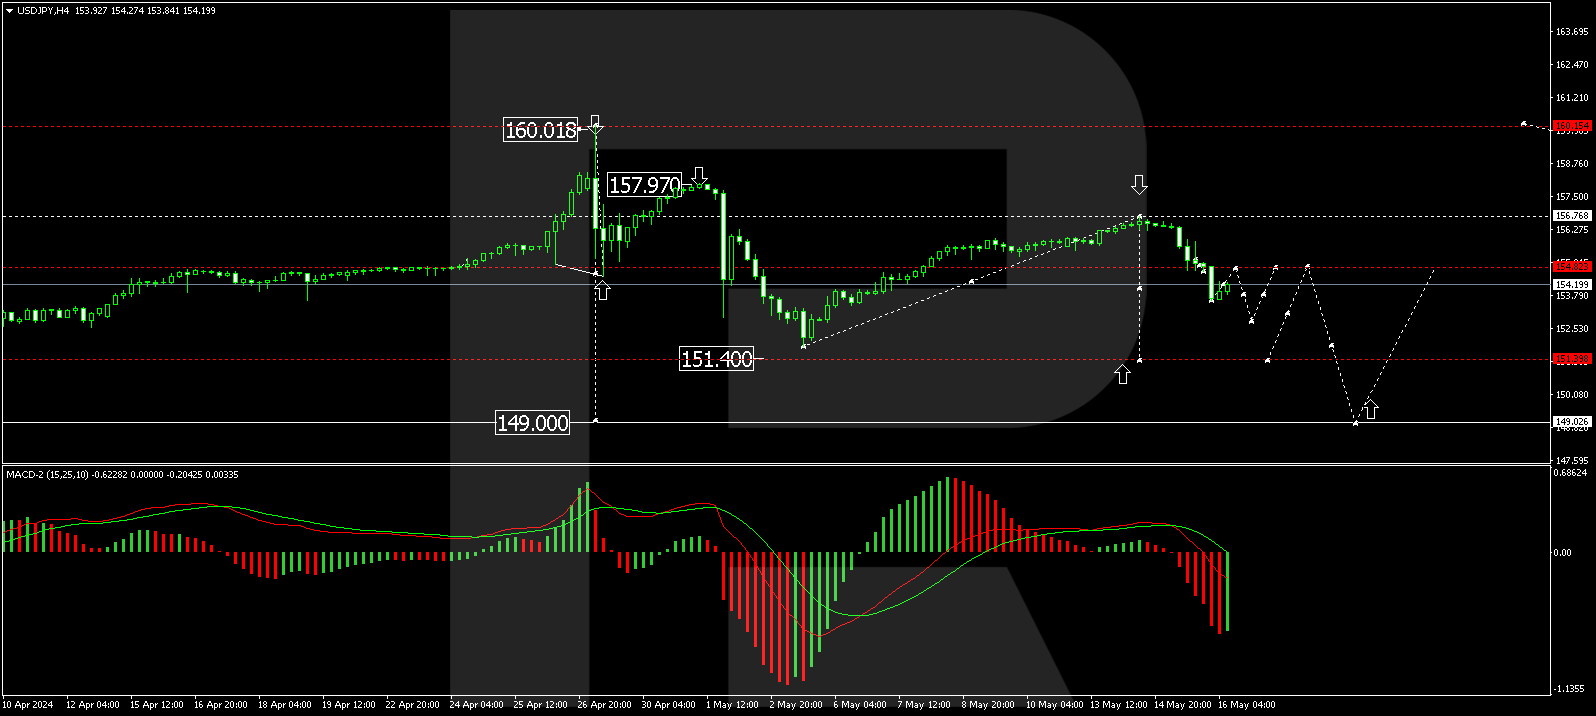
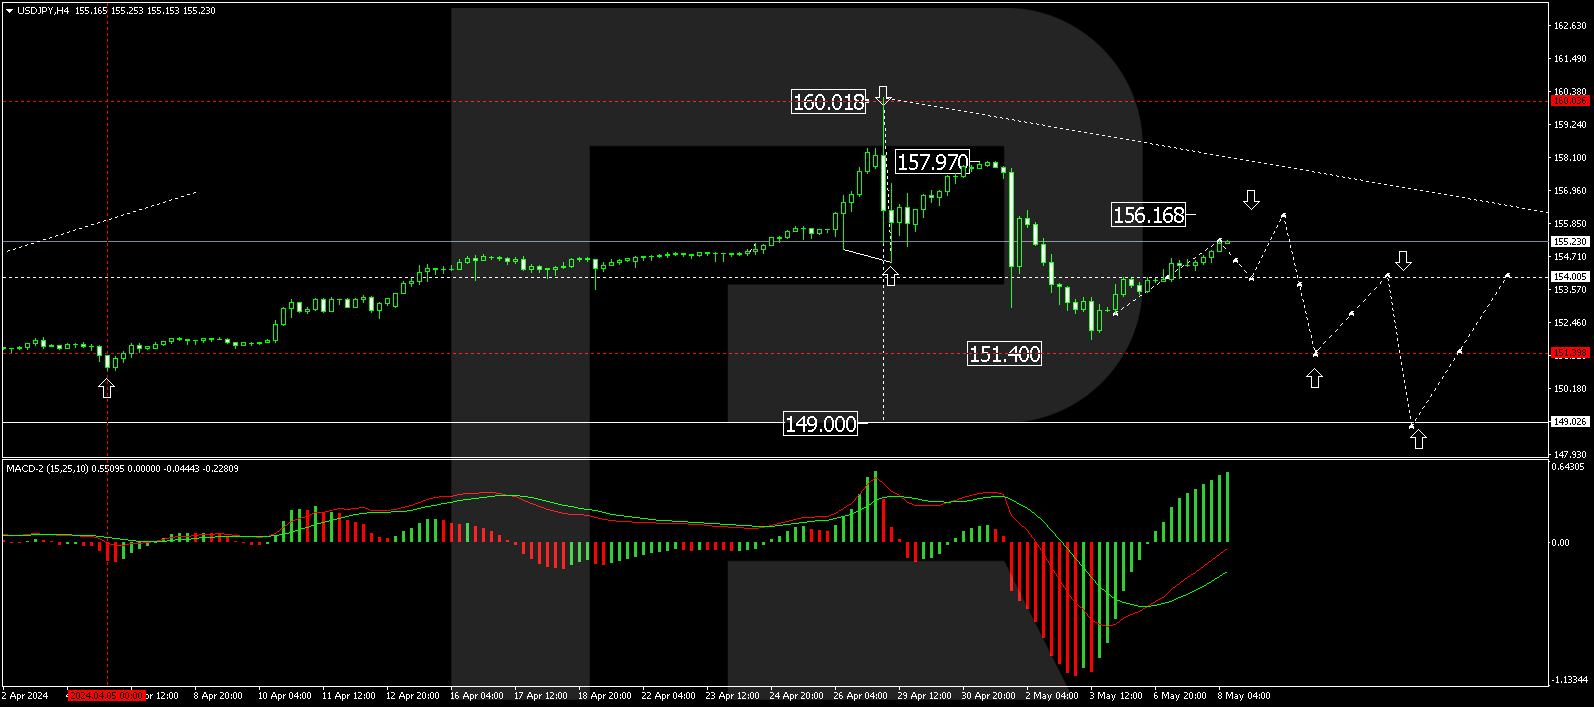
On the H4 chart, USDJPY has completed a corrective wave, reaching 156.76. Today, another decline towards 151.40 is forming. After the price reaches this level, a correction could start, aiming for 154.80 (testing from below). Subsequently, the trend might continue to 149.00 representing the first target of the decline wave. This scenario is technically confirmed by the MACD oscillator, with its signal line below the zero level, directed strictly downwards.

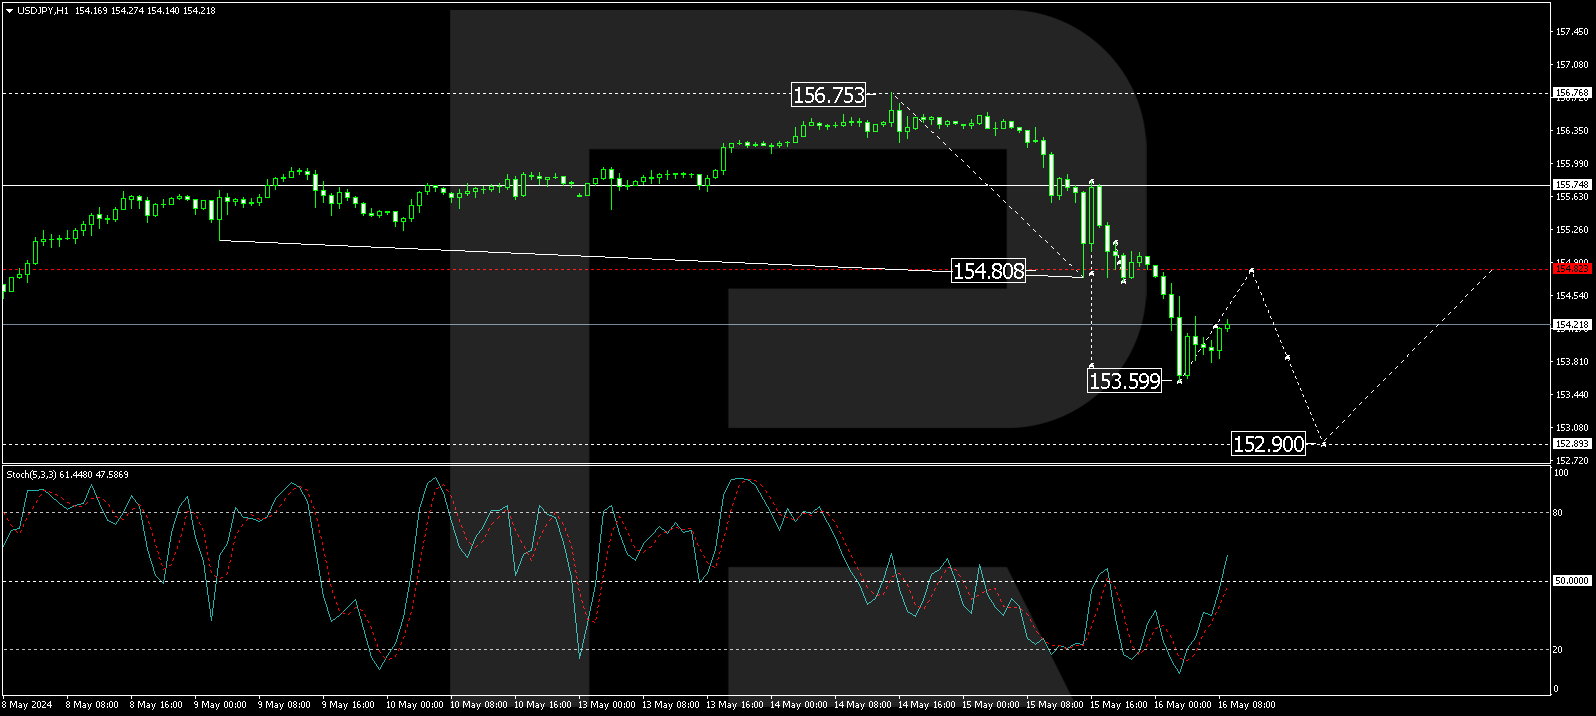
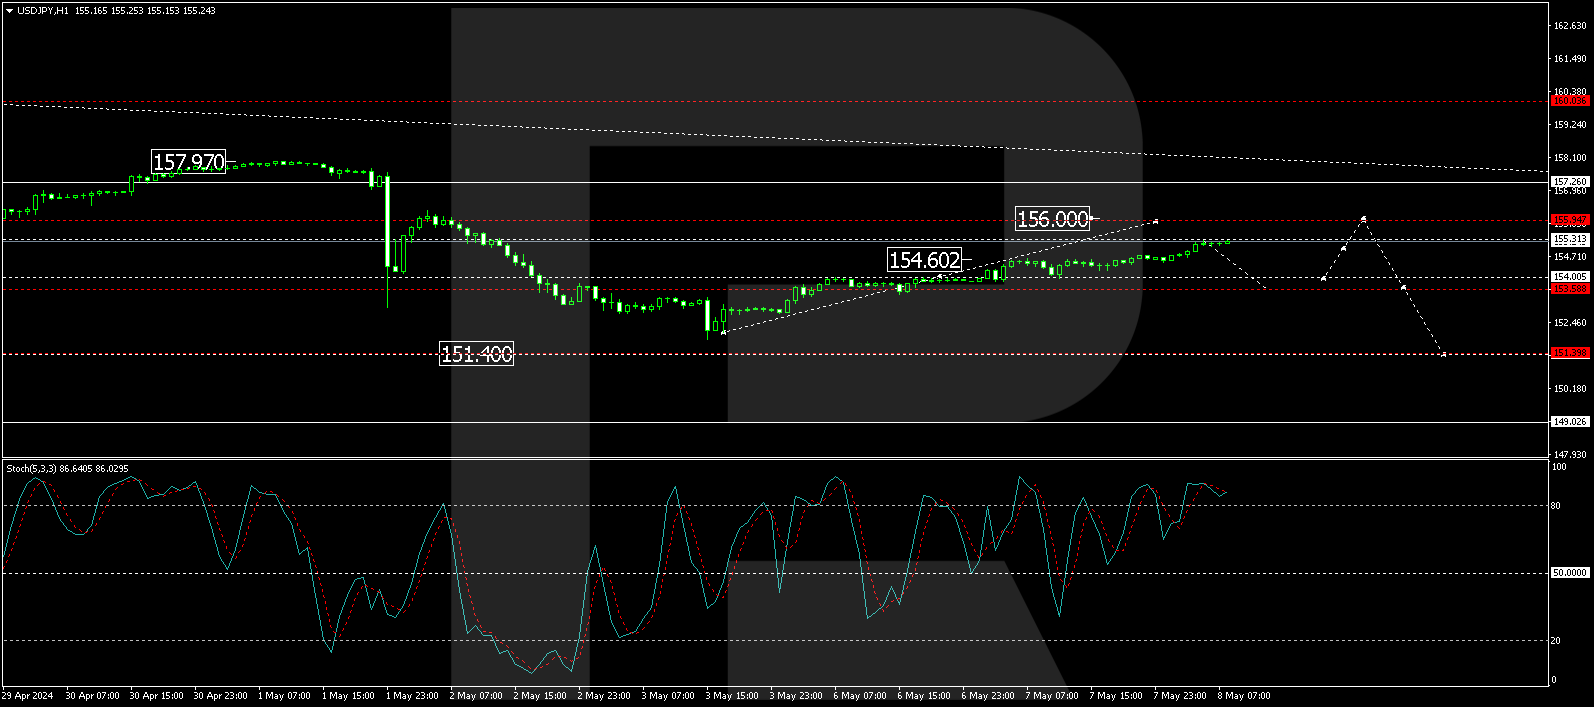
On the H1 chart, USDJPY has completed an impulse structure, reaching 154.80. A narrow consolidation range has formed around this level. Today, with a downward breakout, the price has reached the local target of 153.60. Next, a rise to 154.80 (testing from below) is expected, followed by another possible decline wave, aiming for 152.90 and potentially continuing to 151.40. Technically, this scenario is confirmed by the Stochastic oscillator, with its signal line above 20, poised to rise to the 80 mark.

Disclaimer

Any forecasts contained herein are based on the author’s particular opinion. This analysis may not be treated as trading advice. RoboForex bears no responsibility for trading results based on trading recommendations and reviews contained herein.

Euro climbs to five-week high ahead of US CPI data

By RoboForex Analytical Department

The EUR/USD pair reached a five-week high at 1.0822, buoyed by positive market sentiment ahead of today’s crucial US Consumer Price Index (CPI) data release. The report is expected to show a 0.3% month-on-month increase in inflation for April, a slight decrease from the 0.4% rise in March.

Federal Reserve Chair Jerome Powell recently provided a confident assessment of the US economy, predicting above-trend GDP growth and a decline in inflation. Despite some recent data that has slightly challenged this optimism, Powell’s outlook remains resilient. This year’s unexpected surge in US consumer prices has led to a revision in the Fed’s interest rate cut forecasts, with the market now anticipating a 45-basis point reduction by the end of 2024.

Investor expectations have significantly shifted throughout the year. They anticipated six rate cuts at the beginning of 2024, but now they only foresee a maximum of one by May. The Fed’s future decisions depend heavily on ongoing price trends and inflation forecasts.

EUR/USD technical analysis

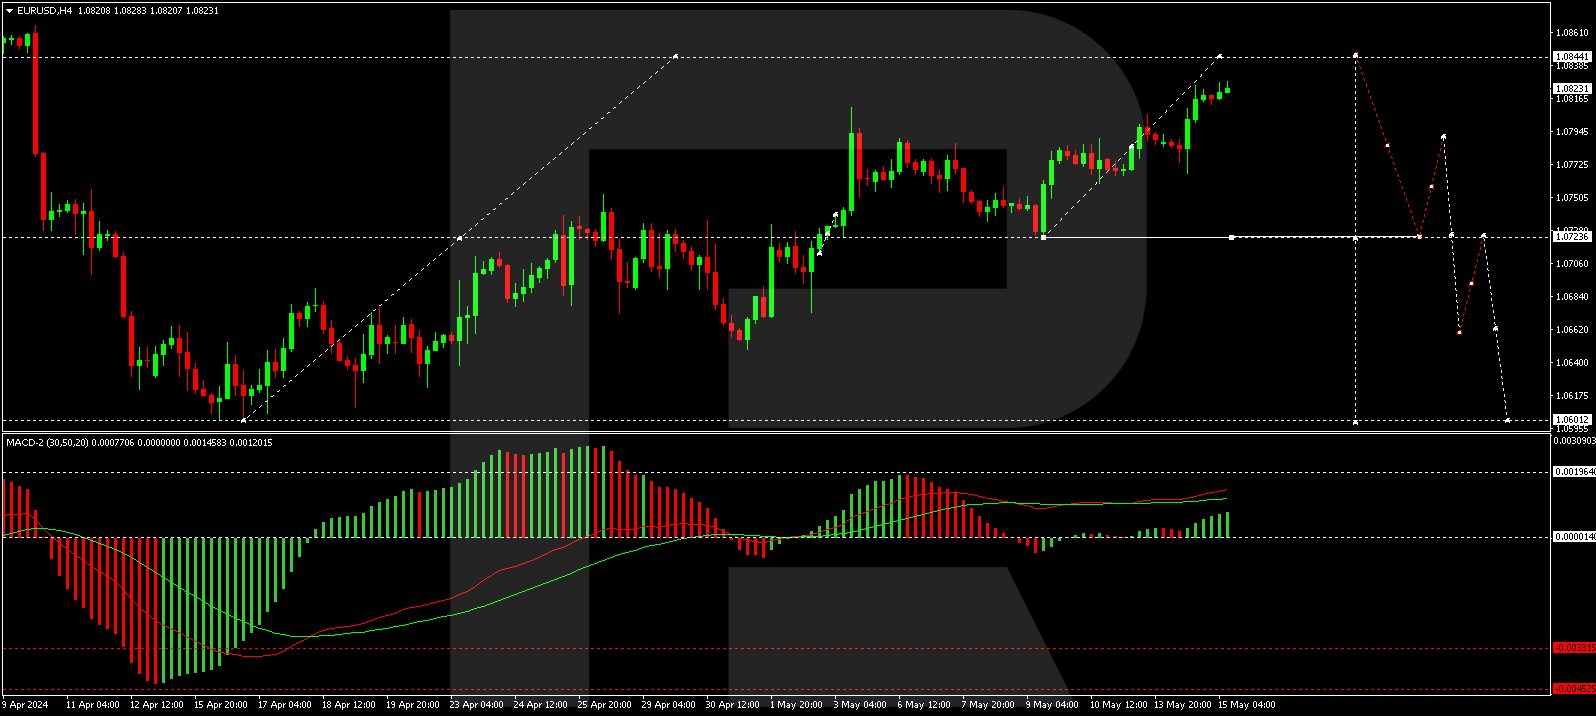
On the H4 chart, the EUR/USD has formed a consolidation range around 1.0785. With an upward exit from this range, a continuation of the correction is expected. The growth to 1.0827 has already been achieved, and a retraction to 1.0805 (testing from above) is anticipated today. Subsequent developments may lead to an increase towards 1.0844. This growth pattern from the level of 1.0601 is viewed as a correction to the last decline wave. Following its completion, a new wave of decline to 1.0600 is expected. This scenario is technically supported by the MACD indicator, with its signal line above zero and directed upwards, although histograms are at maximums and preparing for a decline.

On the H1 chart, after reaching 1.0805, a consolidation range was established above this level. Following an upward breakout, the price moved to 1.0827. Once this level is tested, a potential decline to 1.0805 (testing from above) could occur, leading to further growth towards 1.0844. The Stochastic oscillator confirms this technical outlook, with its signal line currently above 80. A decline to 50 followed by a rebound to 80 is expected, then a potential drop to 20, indicating upcoming fluctuations.


Disclaimer

Any forecasts contained herein are based on the author’s particular opinion. This analysis may not be treated as trading advice. RoboForex bears no responsibility for trading results based on trading recommendations and reviews contained herein.

JPY declines again

By RoboForex Analytical Department

The Japanese yen is declining against the US dollar for the seventh consecutive session. The USD/JPY pair is approaching the 156.40 mark.

Japan’s government is poised for close cooperation with the Bank of Japan on currency market issues. This is needed to avoid disagreements on the goals of the policies they pursue, stated Shunichi Suzuki, the minister of finance, today. He noted that the Ministry of Finance is closely monitoring the currency and taking all possible measures. It is important to the authorities that the yen’s exchange rate remains stable and reflects fundamental indicators.

However, Suzuki did not communicate any specific exchange rate values. He also hardly said anything about financial interventions conducted in late April and early May to support the yen.

After falling earlier to 160.00 per US dollar, the yen has steadily risen. However, it expectedly came under pressure again now. Currency interventions have an intermittent impact and cannot create conditions for a fundamental change in the currency market environment.

The Japanese authorities are also concerned about the interest rate issue. Although no significant changes in the monetary policy structure are expected now, the market closely monitors this issue.

USD/JPY Technical Analysis

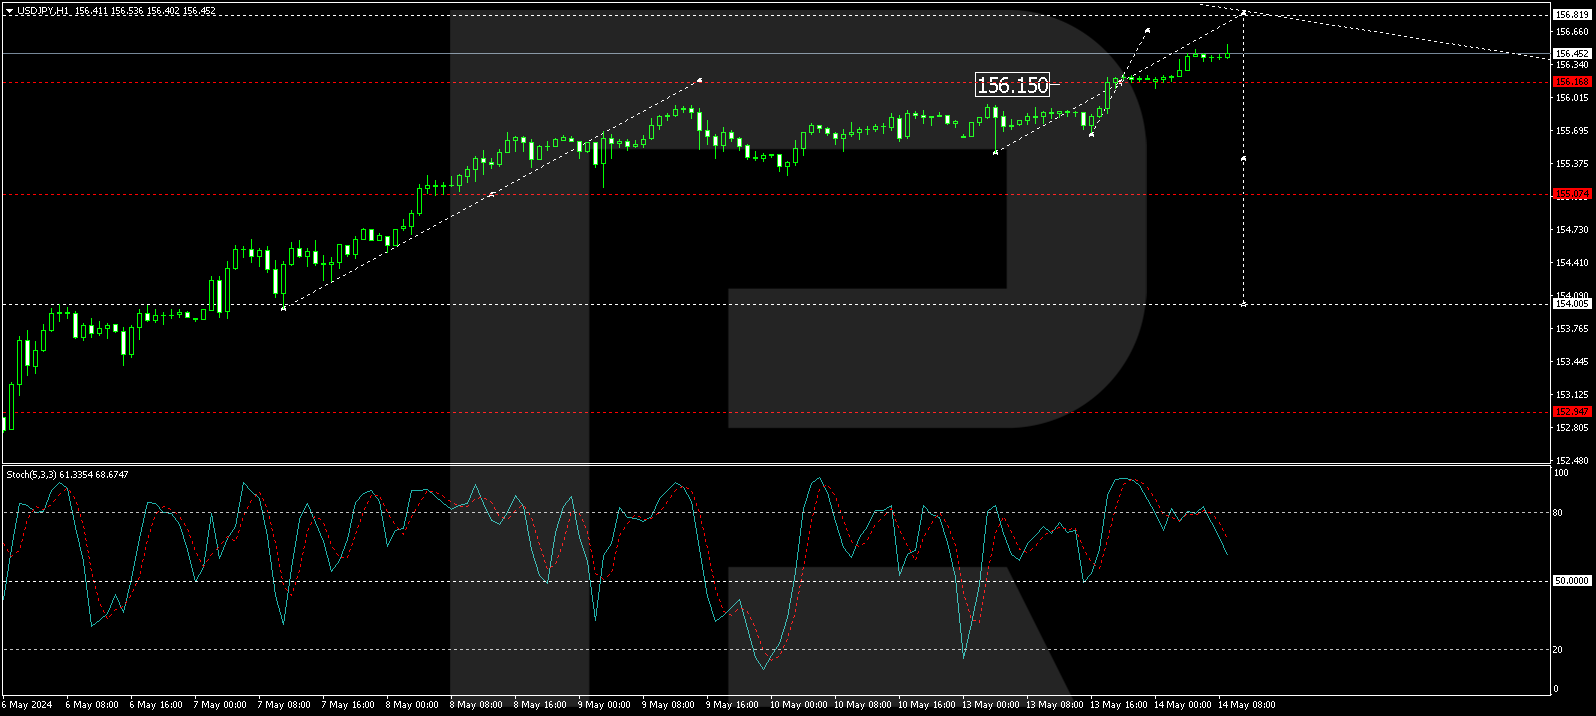
The USD/JPY pair has completed a corrective wave on the H4 chart, reaching 156.16. Today, a consolidation range is forming around this level. The price is expected to break below it and continue the third decline wave, aiming for 151.40. After the price reaches this level, a correction towards 154.00 could start, followed by a decline to 149.00. Technically, this scenario is confirmed by the MACD oscillator, with its signal line above the zero level, poised to decline to new lows.

On the H1 chart, the USD/JPY pair has completed a growth wave at 156.16, with a narrow consolidation range formed around this level. Today, the price attempts to break above it, aiming for 156.66. The range extension towards 156.81 is not ruled out. It is worth noting that all growth structures are only perceived as the extension of this wave, with the market able to continue a downtrend at any moment. Technically, this scenario is confirmed by the Stochastic oscillator, with its signal line above 80, poised to move to new lows.

Disclaimer

Any forecasts contained herein are based on the author’s particular opinion. This analysis may not be treated as trading advice. RoboForex bears no responsibility for trading results based on trading recommendations and reviews contained herein.

Speculators boost Yen bets, bring Euro & USD Index out of bearish levels

By InvestMacro

Here are the latest charts and statistics for the Commitment of Traders (COT) data published by the Commodities Futures Trading Commission (CFTC).

The latest COT data is updated through Tuesday May 7th and shows a quick view of how large market participants (for-profit speculators and commercial traders) were positioned in the futures markets. All currency positions are in direct relation to the US dollar where, for example, a bet for the euro is a bet that the euro will rise versus the dollar while a bet against the euro will be a bet that the euro will decline versus the dollar.

Weekly Speculator Changes led by Japanese Yen & Australian Dollar

The COT currency market speculator bets were slightly lower this week as five out of the eleven currency markets we cover had higher positioning while the other six markets had lower speculator contracts.

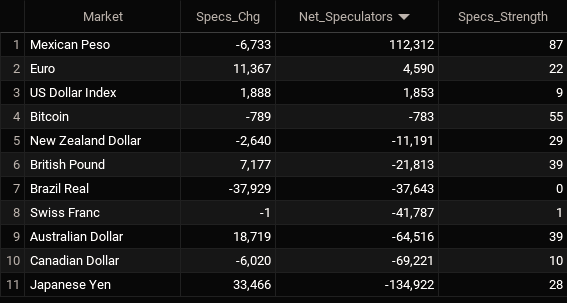
Leading the gains for the currency markets was the Japanese Yen (33,466 contracts) with the Australian Dollar (18,719 contracts), the EuroFX (11,367 contracts), the British Pound (7,177 contracts) and the US Dollar Index (1,888 contracts) also showing a positive week.

The currencies with declines in speculator bets on the week were the Brazilian Real (-37,929 contracts), the Mexican Peso (-6,733 contracts), the Canadian Dollar (-6,020 contracts), the New Zealand Dollar (-2,640 contracts), Bitcoin (-789 contracts) and the Swiss Franc (-1 contract) also registering lower bets on the week.

Speculators boost Yen bets, bring Euro, USD Index out of bearish levels

Highlighting the COT currency’s data this week is that both the Euro and the US dollar index speculator positions were modestly boosted out of their bearish levels into small positive positions. Also, the Japanese yen and Australian dollar positions were well bid through Tuesday.

Here is this week’s COT currency roundup:

The Japanese yen contracts jumped this week by over +33,000 contracts which marked the highest one-week amount since 2020. The yen speculator position has now gained for two weeks in a row amid rumored currency intervention by the Japanese authorities that are trying to arrest deep declines in the yen. The USDJPY currency pair still trades over 155.00 which is close to over thirty-year highs for the US dollar against the yen.

The Australian dollar speculator position rose strongly this week by over +18,000 contracts following a boost by +13,004 contracts on April 30th. The AUD speculator bets have now gained for three straight weeks and for six out of the past seven weeks. Recently, the speculator position for the Aussie had dropped to an all-time record low on March 19th at a total of -107,538 contracts. Since then, speculator bets have improved significantly and are currently at -64,516 contracts.

The Euro bounced back again this week with a gain of +11,367 contracts and a follows up a small rise last week. The improvement in the overall net position has brought the speculative standing back into bullish territory following two straight weeks in bearish territory. That was the first time the Euro contracts had been in bearish territory since September of 2022.

The US dollar index bets also came out of bearish territory this week for the first time in seven weeks. The USD Index bets rose by 1,888 contracts and gained for the fifth straight week. The contracts had been in bullish territory for a total of 142 straight weeks before dropping into a bearish position on March 26th.

The Mexican Peso speculative position decreased this week for a fourth straight week but did so modestly (-6,733 contracts) and remains in a strong bullish level. The MXN speculator’s current standing (+112,312 contracts) remains above +100,000 contract level for 1oth consecutive week. The MXN peso exchange rate has bounced back with gains in the past two weeks after a steep pullback in the middle of April.

The Swiss franc position was virtually unchanged this week (-1 contract) but continues to remain near the lowest levels since 2019 at a total of -41,787 contracts. The franc is one of the most extremely bearish markets in the COT data we follow. The franc’s exchange rate against the US dollar has been on the decline with an approximate drop by over 8 percent since December 2023. The CHFUSD currently trades around the major levels near 1.1050 – 1.1100.


Currencies Net Speculators Leaderboard

Legend: Weekly Speculators Change | Speculators Current Net Position | Speculators Strength Score compared to last 3-Years (0-100 range)


Strength Scores led by Mexican Peso & Bitcoin

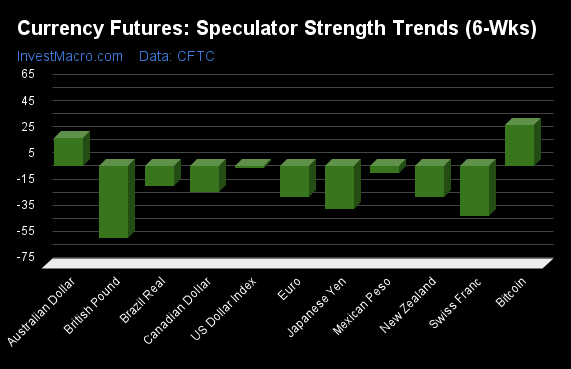
COT Strength Scores (a normalized measure of Speculator positions over a 3-Year range, from 0 to 100 where above 80 is Extreme-Bullish and below 20 is Extreme-Bearish) showed that the Mexican Peso (87 percent) and the Bitcoin (55 percent) lead the currency markets this week. The British Pound (39 percent), Australian Dollar (39 percent) and the New Zealand Dollar (29 percent) come in as the next highest in the weekly strength scores.

On the downside, the Brazilian Real (0 percent) and the Swiss Franc (1 percent) come in at the lowest strength levels currently and are in Extreme-Bearish territory (below 20 percent). The next lowest strength scores are the US Dollar Index (9 percent) and the Canadian Dollar (10 percent).

Strength Statistics:
US Dollar Index (8.8 percent) vs US Dollar Index previous week (4.8 percent)
EuroFX (22.3 percent) vs EuroFX previous week (17.4 percent)
British Pound Sterling (38.8 percent) vs British Pound Sterling previous week (34.1 percent)
Japanese Yen (28.1 percent) vs Japanese Yen previous week (7.2 percent)
Swiss Franc (1.4 percent) vs Swiss Franc previous week (1.4 percent)
Canadian Dollar (10.3 percent) vs Canadian Dollar previous week (14.9 percent)
Australian Dollar (38.9 percent) vs Australian Dollar previous week (22.0 percent)
New Zealand Dollar (28.6 percent) vs New Zealand Dollar previous week (36.1 percent)
Mexican Peso (86.6 percent) vs Mexican Peso previous week (89.9 percent)
Brazilian Real (0.0 percent) vs Brazilian Real previous week (43.0 percent)
Bitcoin (54.6 percent) vs Bitcoin previous week (66.5 percent)


Australian Dollar & US Dollar Index top the 6-Week Strength Trends

COT Strength Score Trends (or move index, calculates the 6-week changes in strength scores) showed that the Australian Dollar (37 percent) and the US Dollar Index (5 percent) lead the past six weeks trends for the currencies. The Bitcoin (4 percent), the Japanese Yen (-4 percent) and the Mexican Peso (-10 percent) are the next highest positive movers in the latest trends data.

The Brazilian Real (-53 percent) leads the downside trend scores currently with the British Pound (-38 percent), Swiss Franc (-35 percent) and the New Zealand Dollar (-15 percent) following next with lower trend scores.

Strength Trend Statistics:
US Dollar Index (5.2 percent) vs US Dollar Index previous week (-1.5 percent)
EuroFX (-11.3 percent) vs EuroFX previous week (-23.5 percent)
British Pound Sterling (-37.8 percent) vs British Pound Sterling previous week (-54.5 percent)
Japanese Yen (-3.6 percent) vs Japanese Yen previous week (-32.8 percent)
Swiss Franc (-35.3 percent) vs Swiss Franc previous week (-37.9 percent)
Canadian Dollar (-14.4 percent) vs Canadian Dollar previous week (-19.8 percent)
Australian Dollar (37.0 percent) vs Australian Dollar previous week (22.0 percent)
New Zealand Dollar (-14.7 percent) vs New Zealand Dollar previous week (-23.7 percent)
Mexican Peso (-9.7 percent) vs Mexican Peso previous week (-4.7 percent)
Brazilian Real (-52.6 percent) vs Brazilian Real previous week (-11.4 percent)
Bitcoin (4.4 percent) vs Bitcoin previous week (31.6 percent)


Individual COT Forex Markets:

US Dollar Index Futures:

US Dollar Index Forex Futures COT ChartThe US Dollar Index large speculator standing this week reached a net position of 1,853 contracts in the data reported through Tuesday. This was a weekly increase of 1,888 contracts from the previous week which had a total of -35 net contracts.

This week’s current strength score (the trader positioning range over the past three years, measured from 0 to 100) shows the speculators are currently Bearish-Extreme with a score of 8.8 percent. The commercials are Bullish-Extreme with a score of 93.5 percent and the small traders (not shown in chart) are Bearish with a score of 29.1 percent.

Price Trend-Following Model: Uptrend

Our weekly trend-following model classifies the current market price position as: Uptrend. The current action for the model is considered to be: Hold – Maintain Long Position.

US DOLLAR INDEX StatisticsSPECULATORSCOMMERCIALSSMALL TRADERS
– Percent of Open Interest Longs:67.221.68.7
– Percent of Open Interest Shorts:62.929.45.2
– Net Position:1,853-3,3921,539
– Gross Longs:28,8819,2603,753
– Gross Shorts:27,02812,6522,214
– Long to Short Ratio:1.1 to 10.7 to 11.7 to 1
NET POSITION TREND:
– Strength Index Score (3 Year Range Pct):8.893.529.1
– Strength Index Reading (3 Year Range):Bearish-ExtremeBullish-ExtremeBearish
NET POSITION MOVEMENT INDEX:
– 6-Week Change in Strength Index:5.2-5.0-1.2


Euro Currency Futures:

Euro Currency Futures COT ChartThe Euro Currency large speculator standing this week reached a net position of 4,590 contracts in the data reported through Tuesday. This was a weekly gain of 11,367 contracts from the previous week which had a total of -6,777 net contracts.

This week’s current strength score (the trader positioning range over the past three years, measured from 0 to 100) shows the speculators are currently Bearish with a score of 22.3 percent. The commercials are Bullish-Extreme with a score of 80.9 percent and the small traders (not shown in chart) are Bearish-Extreme with a score of 7.2 percent.

Price Trend-Following Model: Downtrend

Our weekly trend-following model classifies the current market price position as: Downtrend. The current action for the model is considered to be: Hold – Maintain Short Position.

EURO Currency StatisticsSPECULATORSCOMMERCIALSSMALL TRADERS
– Percent of Open Interest Longs:26.160.111.5
– Percent of Open Interest Shorts:25.463.58.8
– Net Position:4,590-22,27917,689
– Gross Longs:170,594393,84575,156
– Gross Shorts:166,004416,12457,467
– Long to Short Ratio:1.0 to 10.9 to 11.3 to 1
NET POSITION TREND:
– Strength Index Score (3 Year Range Pct):22.380.97.2
– Strength Index Reading (3 Year Range):BearishBullish-ExtremeBearish-Extreme
NET POSITION MOVEMENT INDEX:
– 6-Week Change in Strength Index:-11.311.9-8.4


British Pound Sterling Futures:

British Pound Sterling Futures COT ChartThe British Pound Sterling large speculator standing this week reached a net position of -21,813 contracts in the data reported through Tuesday. This was a weekly advance of 7,177 contracts from the previous week which had a total of -28,990 net contracts.

This week’s current strength score (the trader positioning range over the past three years, measured from 0 to 100) shows the speculators are currently Bearish with a score of 38.8 percent. The commercials are Bullish with a score of 64.1 percent and the small traders (not shown in chart) are Bearish with a score of 36.6 percent.

Price Trend-Following Model: Downtrend

Our weekly trend-following model classifies the current market price position as: Downtrend. The current action for the model is considered to be: Hold – Maintain Short Position.

BRITISH POUND StatisticsSPECULATORSCOMMERCIALSSMALL TRADERS
– Percent of Open Interest Longs:23.163.49.6
– Percent of Open Interest Shorts:32.948.714.6
– Net Position:-21,81332,970-11,157
– Gross Longs:51,777141,83521,445
– Gross Shorts:73,590108,86532,602
– Long to Short Ratio:0.7 to 11.3 to 10.7 to 1
NET POSITION TREND:
– Strength Index Score (3 Year Range Pct):38.864.136.6
– Strength Index Reading (3 Year Range):BearishBullishBearish
NET POSITION MOVEMENT INDEX:
– 6-Week Change in Strength Index:-37.839.2-26.0


Japanese Yen Futures:

Japanese Yen Forex Futures COT ChartThe Japanese Yen large speculator standing this week reached a net position of -134,922 contracts in the data reported through Tuesday. This was a weekly advance of 33,466 contracts from the previous week which had a total of -168,388 net contracts.

This week’s current strength score (the trader positioning range over the past three years, measured from 0 to 100) shows the speculators are currently Bearish with a score of 28.1 percent. The commercials are Bullish with a score of 76.9 percent and the small traders (not shown in chart) are Bullish with a score of 61.1 percent.

Price Trend-Following Model: Downtrend

Our weekly trend-following model classifies the current market price position as: Downtrend. The current action for the model is considered to be: Hold – Maintain Short Position.

JAPANESE YEN StatisticsSPECULATORSCOMMERCIALSSMALL TRADERS
– Percent of Open Interest Longs:11.773.112.5
– Percent of Open Interest Shorts:56.725.914.7
– Net Position:-134,922141,773-6,851
– Gross Longs:34,990219,30537,333
– Gross Shorts:169,91277,53244,184
– Long to Short Ratio:0.2 to 12.8 to 10.8 to 1
NET POSITION TREND:
– Strength Index Score (3 Year Range Pct):28.176.961.1
– Strength Index Reading (3 Year Range):BearishBullishBullish
NET POSITION MOVEMENT INDEX:
– 6-Week Change in Strength Index:-3.67.5-20.0


Swiss Franc Futures:

Swiss Franc Forex Futures COT ChartThe Swiss Franc large speculator standing this week reached a net position of -41,787 contracts in the data reported through Tuesday. This was a weekly lowering of -1 contracts from the previous week which had a total of -41,786 net contracts.

This week’s current strength score (the trader positioning range over the past three years, measured from 0 to 100) shows the speculators are currently Bearish-Extreme with a score of 1.4 percent. The commercials are Bullish-Extreme with a score of 92.2 percent and the small traders (not shown in chart) are Bearish with a score of 25.8 percent.

Price Trend-Following Model: Downtrend

Our weekly trend-following model classifies the current market price position as: Downtrend. The current action for the model is considered to be: Hold – Maintain Short Position.

SWISS FRANC StatisticsSPECULATORSCOMMERCIALSSMALL TRADERS
– Percent of Open Interest Longs:9.877.911.2
– Percent of Open Interest Shorts:53.921.723.1
– Net Position:-41,78753,109-11,322
– Gross Longs:9,23773,68410,557
– Gross Shorts:51,02420,57521,879
– Long to Short Ratio:0.2 to 13.6 to 10.5 to 1
NET POSITION TREND:
– Strength Index Score (3 Year Range Pct):1.492.225.8
– Strength Index Reading (3 Year Range):Bearish-ExtremeBullish-ExtremeBearish
NET POSITION MOVEMENT INDEX:
– 6-Week Change in Strength Index:-35.323.518.9


Canadian Dollar Futures:

Canadian Dollar Forex Futures COT ChartThe Canadian Dollar large speculator standing this week reached a net position of -69,221 contracts in the data reported through Tuesday. This was a weekly fall of -6,020 contracts from the previous week which had a total of -63,201 net contracts.

This week’s current strength score (the trader positioning range over the past three years, measured from 0 to 100) shows the speculators are currently Bearish-Extreme with a score of 10.3 percent. The commercials are Bullish-Extreme with a score of 88.7 percent and the small traders (not shown in chart) are Bearish-Extreme with a score of 17.4 percent.

Price Trend-Following Model: Downtrend

Our weekly trend-following model classifies the current market price position as: Downtrend. The current action for the model is considered to be: Hold – Maintain Short Position.

CANADIAN DOLLAR StatisticsSPECULATORSCOMMERCIALSSMALL TRADERS
– Percent of Open Interest Longs:15.268.513.7
– Percent of Open Interest Shorts:47.135.314.9
– Net Position:-69,22171,845-2,624
– Gross Longs:32,945148,39029,719
– Gross Shorts:102,16676,54532,343
– Long to Short Ratio:0.3 to 11.9 to 10.9 to 1
NET POSITION TREND:
– Strength Index Score (3 Year Range Pct):10.388.717.4
– Strength Index Reading (3 Year Range):Bearish-ExtremeBullish-ExtremeBearish-Extreme
NET POSITION MOVEMENT INDEX:
– 6-Week Change in Strength Index:-14.410.03.6


Australian Dollar Futures:

Australian Dollar Forex Futures COT ChartThe Australian Dollar large speculator standing this week reached a net position of -64,516 contracts in the data reported through Tuesday. This was a weekly rise of 18,719 contracts from the previous week which had a total of -83,235 net contracts.

This week’s current strength score (the trader positioning range over the past three years, measured from 0 to 100) shows the speculators are currently Bearish with a score of 38.9 percent. The commercials are Bullish with a score of 66.8 percent and the small traders (not shown in chart) are Bearish with a score of 36.8 percent.

Price Trend-Following Model: Weak Downtrend

Our weekly trend-following model classifies the current market price position as: Weak Downtrend. The current action for the model is considered to be: Hold – Maintain Short Position.

AUSTRALIAN DOLLAR StatisticsSPECULATORSCOMMERCIALSSMALL TRADERS
– Percent of Open Interest Longs:23.664.49.5
– Percent of Open Interest Shorts:54.429.813.3
– Net Position:-64,51672,522-8,006
– Gross Longs:49,480135,02319,859
– Gross Shorts:113,99662,50127,865
– Long to Short Ratio:0.4 to 12.2 to 10.7 to 1
NET POSITION TREND:
– Strength Index Score (3 Year Range Pct):38.966.836.8
– Strength Index Reading (3 Year Range):BearishBullishBearish
NET POSITION MOVEMENT INDEX:
– 6-Week Change in Strength Index:37.0-33.211.1


New Zealand Dollar Futures:

New Zealand Dollar Forex Futures COT ChartThe New Zealand Dollar large speculator standing this week reached a net position of -11,191 contracts in the data reported through Tuesday. This was a weekly fall of -2,640 contracts from the previous week which had a total of -8,551 net contracts.

This week’s current strength score (the trader positioning range over the past three years, measured from 0 to 100) shows the speculators are currently Bearish with a score of 28.6 percent. The commercials are Bullish with a score of 74.3 percent and the small traders (not shown in chart) are Bearish with a score of 20.6 percent.

Price Trend-Following Model: Downtrend

Our weekly trend-following model classifies the current market price position as: Downtrend. The current action for the model is considered to be: Hold – Maintain Short Position.

NEW ZEALAND DOLLAR StatisticsSPECULATORSCOMMERCIALSSMALL TRADERS
– Percent of Open Interest Longs:34.160.15.6
– Percent of Open Interest Shorts:54.235.410.3
– Net Position:-11,19113,792-2,601
– Gross Longs:19,06033,5313,124
– Gross Shorts:30,25119,7395,725
– Long to Short Ratio:0.6 to 11.7 to 10.5 to 1
NET POSITION TREND:
– Strength Index Score (3 Year Range Pct):28.674.320.6
– Strength Index Reading (3 Year Range):BearishBullishBearish
NET POSITION MOVEMENT INDEX:
– 6-Week Change in Strength Index:-14.714.8-11.5


Mexican Peso Futures:

Mexican Peso Futures COT ChartThe Mexican Peso large speculator standing this week reached a net position of 112,312 contracts in the data reported through Tuesday. This was a weekly fall of -6,733 contracts from the previous week which had a total of 119,045 net contracts.

This week’s current strength score (the trader positioning range over the past three years, measured from 0 to 100) shows the speculators are currently Bullish-Extreme with a score of 86.6 percent. The commercials are Bearish-Extreme with a score of 13.4 percent and the small traders (not shown in chart) are Bearish with a score of 37.1 percent.

Price Trend-Following Model: Strong Uptrend

Our weekly trend-following model classifies the current market price position as: Strong Uptrend. The current action for the model is considered to be: Hold – Maintain Long Position.

MEXICAN PESO StatisticsSPECULATORSCOMMERCIALSSMALL TRADERS
– Percent of Open Interest Longs:55.740.92.8
– Percent of Open Interest Shorts:10.288.11.1
– Net Position:112,312-116,3744,062
– Gross Longs:137,564101,0756,829
– Gross Shorts:25,252217,4492,767
– Long to Short Ratio:5.4 to 10.5 to 12.5 to 1
NET POSITION TREND:
– Strength Index Score (3 Year Range Pct):86.613.437.1
– Strength Index Reading (3 Year Range):Bullish-ExtremeBearish-ExtremeBearish
NET POSITION MOVEMENT INDEX:
– 6-Week Change in Strength Index:-9.710.2-9.8


Brazilian Real Futures:

Brazil Real Futures COT ChartThe Brazilian Real large speculator standing this week reached a net position of -37,643 contracts in the data reported through Tuesday. This was a weekly lowering of -37,929 contracts from the previous week which had a total of 286 net contracts.

This week’s current strength score (the trader positioning range over the past three years, measured from 0 to 100) shows the speculators are currently Bearish-Extreme with a score of 0.0 percent. The commercials are Bullish-Extreme with a score of 100.0 percent and the small traders (not shown in chart) are Bearish with a score of 36.1 percent.

Price Trend-Following Model: Strong Downtrend

Our weekly trend-following model classifies the current market price position as: Strong Downtrend. The current action for the model is considered to be: Hold – Maintain Short Position.

BRAZIL REAL StatisticsSPECULATORSCOMMERCIALSSMALL TRADERS
– Percent of Open Interest Longs:16.279.93.8
– Percent of Open Interest Shorts:80.316.23.5
– Net Position:-37,64337,468175
– Gross Longs:9,54646,9662,236
– Gross Shorts:47,1899,4982,061
– Long to Short Ratio:0.2 to 14.9 to 11.1 to 1
NET POSITION TREND:
– Strength Index Score (3 Year Range Pct):0.0100.036.1
– Strength Index Reading (3 Year Range):Bearish-ExtremeBullish-ExtremeBearish
NET POSITION MOVEMENT INDEX:
– 6-Week Change in Strength Index:-52.654.1-22.4


Bitcoin Futures:

Bitcoin Crypto Futures COT ChartThe Bitcoin large speculator standing this week reached a net position of -783 contracts in the data reported through Tuesday. This was a weekly reduction of -789 contracts from the previous week which had a total of 6 net contracts.

This week’s current strength score (the trader positioning range over the past three years, measured from 0 to 100) shows the speculators are currently Bullish with a score of 54.6 percent. The commercials are Bullish with a score of 68.1 percent and the small traders (not shown in chart) are Bearish with a score of 27.7 percent.

Price Trend-Following Model: Uptrend

Our weekly trend-following model classifies the current market price position as: Uptrend. The current action for the model is considered to be: Hold – Maintain Long Position.

BITCOIN StatisticsSPECULATORSCOMMERCIALSSMALL TRADERS
– Percent of Open Interest Longs:79.44.56.1
– Percent of Open Interest Shorts:82.44.03.6
– Net Position:-783134649
– Gross Longs:20,7701,1811,588
– Gross Shorts:21,5531,047939
– Long to Short Ratio:1.0 to 11.1 to 11.7 to 1
NET POSITION TREND:
– Strength Index Score (3 Year Range Pct):54.668.127.7
– Strength Index Reading (3 Year Range):BullishBullishBearish
NET POSITION MOVEMENT INDEX:
– 6-Week Change in Strength Index:4.40.6-7.2


Article By InvestMacroReceive our weekly COT Newsletter

*COT Report: The COT data, released weekly to the public each Friday, is updated through the most recent Tuesday (data is 3 days old) and shows a quick view of how large speculators or non-commercials (for-profit traders) were positioned in the futures markets.

The CFTC categorizes trader positions according to commercial hedgers (traders who use futures contracts for hedging as part of the business), non-commercials (large traders who speculate to realize trading profits) and nonreportable traders (usually small traders/speculators) as well as their open interest (contracts open in the market at time of reporting). See CFTC criteria here.

Week Ahead: USDInd set for volatile week?

By ForexTime 

  • USDInd ↑ almost 4% year-to-date
  • Key US CPI report under spotlight
  • Watch out for Fed speeches
  • Trading within range on D1 charts
  • Levels of interest – 106.50, 105.60 & 105.00

The week ahead is jampacked with top-tier data and speeches by numerous policymakers.

But the spotlight shines on the incoming US inflation data which may rock FXTM’s USDInd:

Saturday, 11th May

  • CN50: China CPI, PPI

Monday, 13th May

  • AU200: Australia business confidence
  • NZD: New Zealand food prices, inflation expectations
  • USDInd: Fed speech
  • CHF: SNB President Thomas Jordan speech

Tuesday, 14th May

  • JP225: Japan PPI
  • GER40: Germany CPI, ZEW survey expectations
  • UK100: UK jobless claims, unemployment, BoE Economist Huw Pill speech
  • USDInd: US PPI, Fed Chair Jerome Powell speech

Wednesday, 15th May

  • CAD: Canada housing starts, existing home sales
  • CN50: China rate decision
  • EU50: Eurozone industrial production, GDP
  • USDInd: US CPI, retail sales, empire manufacturing, Fed speech

Thursday, 16th May

  • AU200: Australia unemployment
  • JP225: Japan GDP, industrial production
  • EUR: ECB publishes financial stability review
  • USDInd: Initial jobless claims, industrial production, Fed speech

Friday, 17th May

  • CN50: China property prices, retail sales, industrial production
  • HK50: Hong Kong GDP
  • EU50: Eurozone CPI
  • SG20: Singapore trade

The USDInd has been trapped within a range since mid-April with major resistance at 106.50 and support around 105.00.

Note: FXTM’s USDInd tracks how the dollar is performing against a basket of six different G10 currencies, including the Euro, British Pound, Japanese Yen, and Canadian dollar.

Digger deeper, the dollar has appreciated against every single G10 currency year-to-date.

Dollar bulls have been supported by cooling Fed cut bets in the face of sticky inflation and strong data.

With all the above said, here are 3 reasons why the USDInd could see significant moves:

    1) US April CPI report

The April Consumer Price Index (CPI) published on Wednesday may influence expectations around what the Fed does in the second half of 2024.  

Markets are forecasting:

  • CPI year-on-year (April 2023 vs. April 2024) to cool 3.4% from 3.5% in the prior month.
  • Core CPI year-on-year to cool to 3.6% to 3.8%.
  • CPI month-on-month (April 2024 vs March 2024) to remain unchanged at 0.4%.
  • Core CPI month-on-month to cool to 0.3% to 0.4%.

Headline inflation and the annual core inflation figures are expected to have ticked lower in April. But this is still some distance away from the Fed’s 2% target.

Nevertheless, further evidence of cooling prices may stimulate expectations around the Fed cutting interest rates in the second half of the year.

Traders are currently pricing in a 36% probability of a 25-basis point Fed cut by July with this jumping to 90% by September.

  • A softer-than-expected US CPI report could send the USDInd lower as Fed cut bets jump.
  • Should the inflation report print above market forecasts, this could boost the USDInd.


    2) Fed speeches + US data

A string of speeches from numerous Fed officials including Jerome Powell could pump the USDInd with fresh volatility. Given the recent mixed signals from US policymakers on the path of rates, the incoming speeches may provide investors with fresh clarity on what to expect from the Fed.

Much attention will also be directed towards the latest US retail sales, Producer Prices Index (PPI), and initial jobless claims to gauge the health of the US economy.

  • The USDInd could push higher if Fed officials strike a hawkish note and overall data supports the “higher for longer” narrative for rates.
  • If economic data disappoints and Fed officials sound more dovish, the USDInd may trade lower.


    3) Technical forces 

The USDInd is trading within a range on the daily charts with prices hovering near the 105.00 level. Still, the candlesticks are trading above the 50, 100, and 200-day SMA while the MACD trades above zero.

  • A solid breakdown and daily close below 105.00 could encourage a decline toward the 50-day SMA and 200-day SMA.
  • Should 105.00 prove to be reliable support, this could trigger a rebound to 105.60 and 106.50.


Forex-Time-LogoArticle by ForexTime

ForexTime Ltd (FXTM) is an award winning international online forex broker regulated by CySEC 185/12 www.forextime.com

USDSEK: Golden cross on the horizon?

By ForexTime 

  • USDSEK jumps on Riksbank cut
  • Currency pair in megaphone pattern
  • Key point of reference at golden 161.8 Fib level
  • Potential golden cross on horizon
  • Other key levels at 11.0678 and 10.8333

The USDSEK punched above 10.9 on Wednesday after Sweden’s central bank cut rates for the first time in eight years!

In an expected move, the Riksbank trimmed its policy rate by 25 basis points to 3.75% and signalled two more cuts in the second half of 2024. This makes Sweden’s Riksbank the second major one after the Swiss National Bank to cut interest rates.

As of writing, traders see a 67% probability of another 25 basis point Riksbank cut by June with this fully priced in by August.

The Riksbank dovish stance contrasts with the US Federal Reserve which has struggled to cut rates in the face of sticky inflation.

Incoming data from the US this week is likely to influence bets around when the Fed will join the rate cut club.

At 12:30, GMT, the Unemployment claims data out of the US is expected to show 212,00 individuals filed for unemployment for the first time during the past week. If so, this will signal a relatively healthy labor market and continue to weaken bets of near-term rate cuts.

Technically speaking,

USDSEK is in a broadening pattern, also known as a megaphone.

In a broadening pattern, price peaks and valleys, are bounded by two diverging trendlines.

USDSEK is in a 3-day rally (coming off the support of the megaphone) and may be heading for the upper trendline of the pattern at 11.0678.

Golden cross on the horizon?

Interestingly, the 50-day SMA is close to crossing above the 200-day SMA.

This price phenomenon is called a “golden cross” and is used as an early “warning” sign to show that price could rally further.

When we add the Fibonacci retracement tool, drawn from November 30th 2023 high (10.5387) to December 27th 2023 low (9.9043), we see 10.9309 at the golden fib (161.8%)  ratio acting as resistance and a point of reference.

A strong close above this level may open the floodgates for USDSEK bulls (those looking to see the minor pair rally).

However, USDSEK bears (those looking to see a decline in the pair) will have their eyes set on the following levels.

  • 10.8333: the 21-day SMA

  • 10.7079: the lower trendline of the broadening pattern

Finally, the Relative Strength Index, – an indicator that shows overbought and over-sold zones- is above the 50-point mid-way line and pointing upwards towards the overbought zone, signaling a bullish sentiment in the asset.


Forex-Time-LogoArticle by ForexTime

ForexTime Ltd (FXTM) is an award winning international online forex broker regulated by CySEC 185/12 www.forextime.com
Japanese yen weakens despite government warnings

By RoboForex Analytical Department

The USD/JPY pair is on the rise again this Wednesday, recovering more than half of its previous losses despite ongoing warnings from Japanese authorities about sharp fluctuations in the yen. Finance Minister Shunichi Suzuki reiterated today that the government is prepared to act against excessive currency volatility. Additionally, Bank of Japan Governor Kazuo Ueda noted that the BoJ is assessing the impact of yen movements on inflation to inform future decisions better.

Last week, the yen strengthened by 5.2%, a move that the market largely attributes to financial interventions. While there has been no official confirmation of these measures, the market’s interpretation is bolstered by data from the Bank of Japan, which indicates approximately 60 billion USD in expenditures. These actions are likely aimed at stabilising the national currency’s value
However, these interventions only provided a brief respite for the authorities. The yen’s decline remains primarily influenced by the significant interest rate differential between the US Federal Reserve and the Bank of Japan. With rates at 5.5% and 0%, respectively, this disparity continues to exert downward pressure on the yen, and as long as it persists, the currency is likely to remain weak.

USD/JPY technical analysis

On the H4 chart, USD/JPY is currently forming a wave of decline towards 151.40. The local target of 151.86 has already been reached. The market is now correcting from the previous wave of decline and is expected to reach at least 156.00. After this correction, a new phase of decline towards 151.40 may begin. This scenario is technically supported by the MACD oscillator, whose signal line is below zero but directed upwards.

On the H1 chart, USD/JPY has formed a consolidation range around the 154.00 level, with an anticipated upward breakout leading to a correction towards 156.00. Currently, a growth link to 155.88 is forming. Following this, a potential decline back to 154.00 (testing from above) may occur before possibly rising again to 156.00. The Stochastic oscillator confirms this technical outlook, with its signal line above 80 and poised for a decline.


Disclaimer

Any forecasts contained herein are based on the author’s particular opinion. This analysis may not be treated as trading advice. RoboForex bears no responsibility for trading results based on trading recommendations and reviews contained herein.

FX Speculators reduce bearish bets for Yen, Canadian & Australian Dollars

By InvestMacro

Here are the latest charts and statistics for the Commitment of Traders (COT) data published by the Commodities Futures Trading Commission (CFTC).

The latest COT data is updated through Tuesday April 30th and shows a quick view of how large market participants (for-profit speculators and commercial traders) were positioned in the futures markets. All currency positions are in direct relation to the US dollar where, for example, a bet for the euro is a bet that the euro will rise versus the dollar while a bet against the euro will be a bet that the euro will decline versus the dollar.

Weekly Speculator Changes led by Canadian & Australian Dollars

The COT currency market speculator bets were higher this week as eight out of the eleven currency markets we cover had higher positioning while the other three markets had lower speculator contracts.

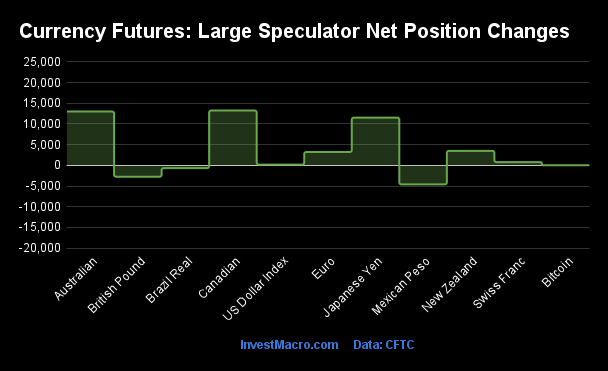
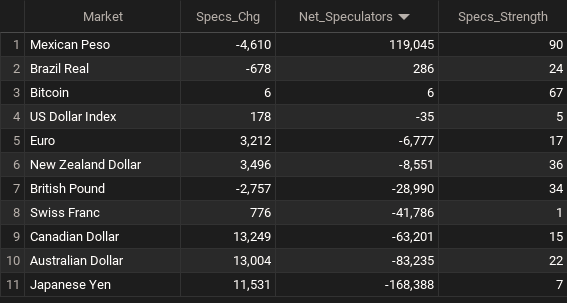
Leading the gains for the currency markets was the Canadian Dollar (13,249 contracts) with the Australian Dollar (13,004 contracts), the Japanese Yen (11,531 contracts), the New Zealand Dollar (3,496 contracts), EuroFX (3,212 contracts), the Swiss Franc (776 contracts), the US Dollar Index (178 contracts) and Bitcoin (6 contracts) also showing positive weeks.

The currencies seeing declines in speculator bets on the week were the Mexican Peso (-4,610 contracts), the British Pound (-2,757 contracts) and the Brazilian Real (-678 contracts).

Speculators reduce bearish bets for Yen, Canadian & Australian Dollars

This week’s COT currency’s data was mixed in the overall big picture and saw a pause in some of the major trends. There were many extremely weak currency positions (JPY, AUD, CAD, CHF, EUR) that saw a little turnaround for the week in their speculator bets while the extremely strong Mexican peso saw a little slide in its bullishness. The US dollar continues to remain in a strong speculative position overall versus just about all of the major currencies except the peso.

Here is this week’s COT currency roundup:

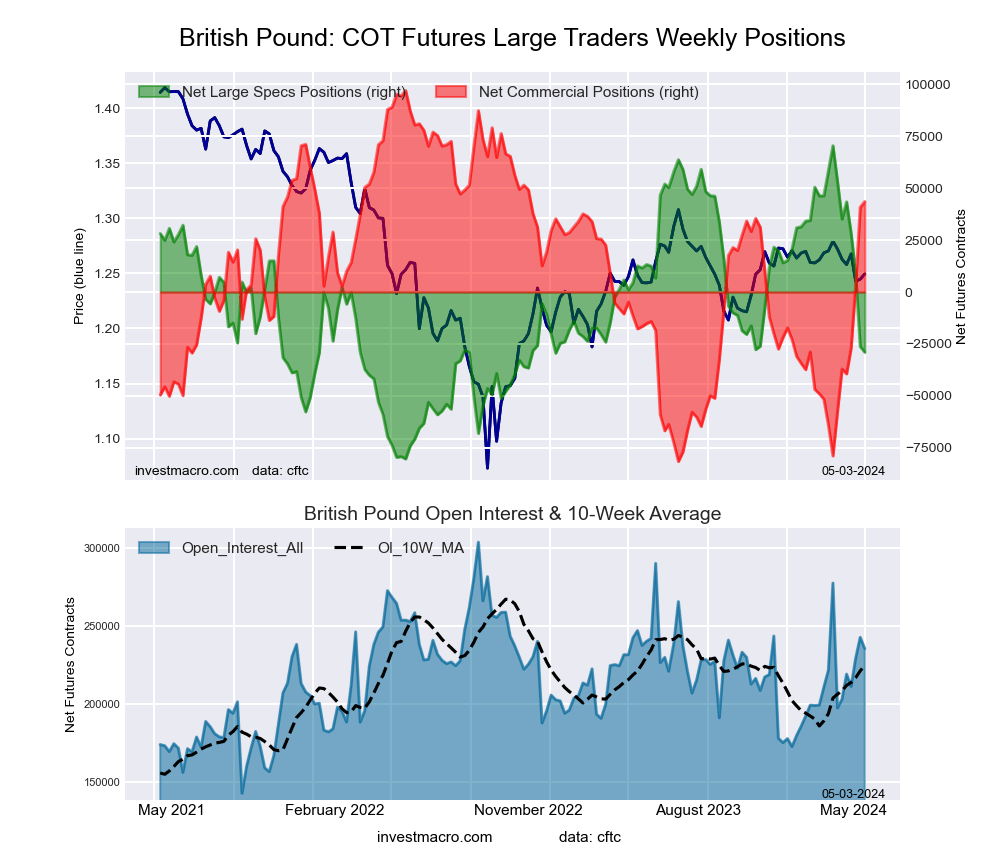
The British pound sterling speculator was one of the currencies that saw a weaker position on the week and contracts have now fallen for two consecutive weeks. The GBP bets have also dropped in six out of the last 7 weeks for a total 7-week change of -99,441 contracts — illuminating the deteriorating sentiment for the GBP. This has dropped the current speculator contract level to a new lowpoint since January 2023.

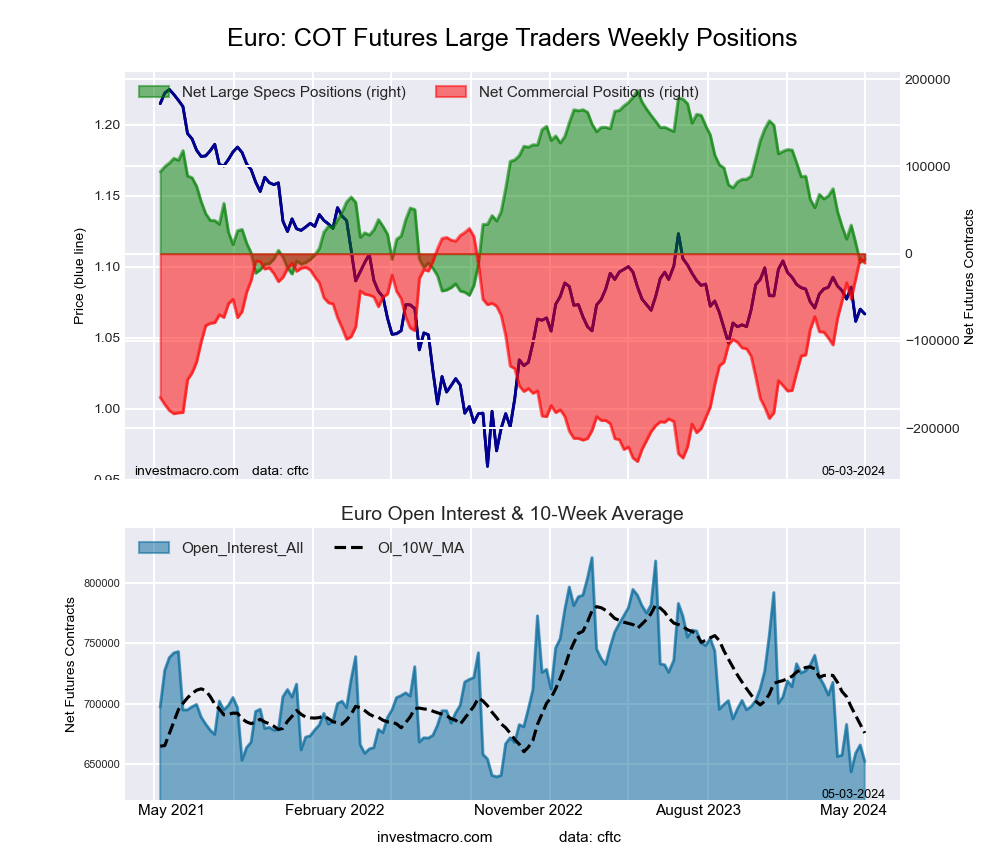
The Euro bounced back very slightly this week with a gain of +3,212 contracts. The overall net position, however, is now in bearish territory for a second straight week. This is the first time the Euro contracts have been bearish since September of 2022.

The Canadian dollar speculative position has bounced back with two weeks of gains following eight straight weeks of declines. The overall net position (currently at -63,201 contracts) remains extremely bearish with the current strength level at 15 percent of the past three-years range of positions.

Swiss franc speculator positions remain extremely bearish (1 percent strength score) and the overall net speculator position is greater than -40,000 contracts for a second consecutive week. The franc spec positioning is at the lowest levels since 2019.

The Japanese yen contracts got a little relief this week from the continued downtrend with a rise of +11,531 contracts. Previously, the JPY contracts had dropped in 13 out of 15 weeks for a -123,970 contract decline over those 15 weeks. The current speculative sentiment remains near the lowest standing since 2007. The Japanese authorities likely intervened in the currency markets earlier this week in order to pause the steep decline in the yen and the yen managed to end the week higher by approximately 3 percent vs the USD.

The Australian dollar speculator position saw improvement for a second straight week this week with a gain of +13,004 contracts through Tuesday. The Aussie spec position and sentiment have been historically bearish over the past few months with an all-time record low position reached on March 19th at a total of -107,538 contracts. The current positioning level sits at -83,235 contracts.

The Mexican Peso remains the one strong currency in the mix against the US dollar. The MXN speculative position has fallen for three straight weeks but remains in a very strong position with a current total of +119,045 contracts. The MXN speculator level has remained above the +100,000 level for nine consecutive weeks which is the first time that type of streak has taken place since late-2019 into early-2020. The MXN exchange rate versus the USD has experienced a pullback over the past month but remains slightly higher for 2024 so far and closed this week higher by over 1 percent.


Currencies Net Speculators Leaderboard

Legend: Weekly Speculators Change | Speculators Current Net Position | Speculators Strength Score compared to last 3-Years (0-100 range)


Strength Scores led by Mexican Peso & Bitcoin

COT Strength Scores (a normalized measure of Speculator positions over a 3-Year range, from 0 to 100 where above 80 is Extreme-Bullish and below 20 is Extreme-Bearish) showed that the Mexican Peso (90 percent) and Bitcoin (66 percent) lead the currency markets this week.

On the downside, the Swiss Franc (1 percent), the US Dollar Index (5 percent), the Japanese Yen (7 percent), the Canadian Dollar (15 percent) and the EuroFX (17 percent) come in at the lowest strength levels currently and are in Extreme-Bearish territory (below 20 percent).

Strength Statistics:
US Dollar Index (4.8 percent) vs US Dollar Index previous week (4.4 percent)
EuroFX (17.4 percent) vs EuroFX previous week (16.1 percent)
British Pound Sterling (34.1 percent) vs British Pound Sterling previous week (35.9 percent)
Japanese Yen (7.2 percent) vs Japanese Yen previous week (0.0 percent)
Swiss Franc (1.4 percent) vs Swiss Franc previous week (0.0 percent)
Canadian Dollar (14.9 percent) vs Canadian Dollar previous week (4.8 percent)
Australian Dollar (22.0 percent) vs Australian Dollar previous week (10.2 percent)
New Zealand Dollar (36.1 percent) vs New Zealand Dollar previous week (26.2 percent)
Mexican Peso (89.9 percent) vs Mexican Peso previous week (92.1 percent)
Brazilian Real (24.1 percent) vs Brazilian Real previous week (25.2 percent)
Bitcoin (66.5 percent) vs Bitcoin previous week (66.4 percent)


Bitcoin & Australian Dollar top the 6-Week Strength Trends

COT Strength Score Trends (or move index, calculates the 6-week changes in strength scores) showed that the Bitcoin (32 percent) and the Australian Dollar (22 percent) lead the past six weeks trends and are the only positive movers for the currencies.

The British Pound (-54 percent) leads the downside trend scores currently with the Swiss Franc (-38 percent), Japanese Yen (-33 percent) and the New Zealand Dollar (-24 percent) following next with lower trend scores.

Strength Trend Statistics:
US Dollar Index (-1.5 percent) vs US Dollar Index previous week (-13.5 percent)
EuroFX (-23.5 percent) vs EuroFX previous week (-35.9 percent)
British Pound Sterling (-54.5 percent) vs British Pound Sterling previous week (-64.1 percent)
Japanese Yen (-32.8 percent) vs Japanese Yen previous week (-48.5 percent)
Swiss Franc (-37.9 percent) vs Swiss Franc previous week (-44.0 percent)
Canadian Dollar (-19.8 percent) vs Canadian Dollar previous week (-34.6 percent)
Australian Dollar (22.0 percent) vs Australian Dollar previous week (-4.9 percent)
New Zealand Dollar (-23.7 percent) vs New Zealand Dollar previous week (-41.2 percent)
Mexican Peso (-4.7 percent) vs Mexican Peso previous week (9.5 percent)
Brazilian Real (-15.1 percent) vs Brazilian Real previous week (-11.7 percent)
Bitcoin (31.6 percent) vs Bitcoin previous week (15.0 percent)


Individual COT Forex Markets:

US Dollar Index Futures:

US Dollar Index Forex Futures COT ChartThe US Dollar Index large speculator standing this week totaled a net position of -35 contracts in the data reported through Tuesday. This was a weekly increase of 178 contracts from the previous week which had a total of -213 net contracts.

This week’s current strength score (the trader positioning range over the past three years, measured from 0 to 100) shows the speculators are currently Bearish-Extreme with a score of 4.8 percent. The commercials are Bullish-Extreme with a score of 96.0 percent and the small traders (not shown in chart) are Bearish with a score of 37.1 percent.

Price Trend-Following Model: Uptrend

Our weekly trend-following model classifies the current market price position as: Uptrend. The current action for the model is considered to be: Hold – Maintain Long Position.

US DOLLAR INDEX StatisticsSPECULATORSCOMMERCIALSSMALL TRADERS
– Percent of Open Interest Longs:68.920.39.0
– Percent of Open Interest Shorts:68.924.84.5
– Net Position:-35-2,1892,224
– Gross Longs:33,5939,8944,410
– Gross Shorts:33,62812,0832,186
– Long to Short Ratio:1.0 to 10.8 to 12.0 to 1
NET POSITION TREND:
– Strength Index Score (3 Year Range Pct):4.896.037.1
– Strength Index Reading (3 Year Range):Bearish-ExtremeBullish-ExtremeBearish
NET POSITION MOVEMENT INDEX:
– 6-Week Change in Strength Index:-1.5-1.014.1


Euro Currency Futures:

Euro Currency Futures COT ChartThe Euro Currency large speculator standing this week totaled a net position of -6,777 contracts in the data reported through Tuesday. This was a weekly advance of 3,212 contracts from the previous week which had a total of -9,989 net contracts.

This week’s current strength score (the trader positioning range over the past three years, measured from 0 to 100) shows the speculators are currently Bearish-Extreme with a score of 17.4 percent. The commercials are Bullish-Extreme with a score of 85.2 percent and the small traders (not shown in chart) are Bearish-Extreme with a score of 6.9 percent.

Price Trend-Following Model: Downtrend

Our weekly trend-following model classifies the current market price position as: Downtrend. The current action for the model is considered to be: Hold – Maintain Short Position.

EURO Currency StatisticsSPECULATORSCOMMERCIALSSMALL TRADERS
– Percent of Open Interest Longs:25.661.211.2
– Percent of Open Interest Shorts:26.762.88.5
– Net Position:-6,777-10,73717,514
– Gross Longs:167,185399,16373,035
– Gross Shorts:173,962409,90055,521
– Long to Short Ratio:1.0 to 11.0 to 11.3 to 1
NET POSITION TREND:
– Strength Index Score (3 Year Range Pct):17.485.26.9
– Strength Index Reading (3 Year Range):Bearish-ExtremeBullish-ExtremeBearish-Extreme
NET POSITION MOVEMENT INDEX:
– 6-Week Change in Strength Index:-23.523.7-13.2


British Pound Sterling Futures:

British Pound Sterling Futures COT ChartThe British Pound Sterling large speculator standing this week totaled a net position of -28,990 contracts in the data reported through Tuesday. This was a weekly lowering of -2,757 contracts from the previous week which had a total of -26,233 net contracts.

This week’s current strength score (the trader positioning range over the past three years, measured from 0 to 100) shows the speculators are currently Bearish with a score of 34.1 percent. The commercials are Bullish with a score of 70.1 percent and the small traders (not shown in chart) are Bearish with a score of 29.4 percent.

Price Trend-Following Model: Downtrend

Our weekly trend-following model classifies the current market price position as: Downtrend. The current action for the model is considered to be: Hold – Maintain Short Position.

BRITISH POUND StatisticsSPECULATORSCOMMERCIALSSMALL TRADERS
– Percent of Open Interest Longs:18.568.99.0
– Percent of Open Interest Shorts:30.850.415.2
– Net Position:-28,99043,560-14,570
– Gross Longs:43,668162,36621,215
– Gross Shorts:72,658118,80635,785
– Long to Short Ratio:0.6 to 11.4 to 10.6 to 1
NET POSITION TREND:
– Strength Index Score (3 Year Range Pct):34.170.129.4
– Strength Index Reading (3 Year Range):BearishBullishBearish
NET POSITION MOVEMENT INDEX:
– 6-Week Change in Strength Index:-54.556.6-37.2


Japanese Yen Futures:

Japanese Yen Forex Futures COT ChartThe Japanese Yen large speculator standing this week totaled a net position of -168,388 contracts in the data reported through Tuesday. This was a weekly rise of 11,531 contracts from the previous week which had a total of -179,919 net contracts.

This week’s current strength score (the trader positioning range over the past three years, measured from 0 to 100) shows the speculators are currently Bearish-Extreme with a score of 7.2 percent. The commercials are Bullish-Extreme with a score of 98.1 percent and the small traders (not shown in chart) are Bullish with a score of 58.3 percent.

Price Trend-Following Model: Downtrend

Our weekly trend-following model classifies the current market price position as: Downtrend. The current action for the model is considered to be: Hold – Maintain Short Position.

JAPANESE YEN StatisticsSPECULATORSCOMMERCIALSSMALL TRADERS
– Percent of Open Interest Longs:12.173.112.5
– Percent of Open Interest Shorts:62.420.514.8
– Net Position:-168,388176,122-7,734
– Gross Longs:40,435244,92041,917
– Gross Shorts:208,82368,79849,651
– Long to Short Ratio:0.2 to 13.6 to 10.8 to 1
NET POSITION TREND:
– Strength Index Score (3 Year Range Pct):7.298.158.3
– Strength Index Reading (3 Year Range):Bearish-ExtremeBullish-ExtremeBullish
NET POSITION MOVEMENT INDEX:
– 6-Week Change in Strength Index:-32.837.7-27.1


Swiss Franc Futures:

Swiss Franc Forex Futures COT ChartThe Swiss Franc large speculator standing this week totaled a net position of -41,786 contracts in the data reported through Tuesday. This was a weekly gain of 776 contracts from the previous week which had a total of -42,562 net contracts.

This week’s current strength score (the trader positioning range over the past three years, measured from 0 to 100) shows the speculators are currently Bearish-Extreme with a score of 1.4 percent. The commercials are Bullish-Extreme with a score of 100.0 percent and the small traders (not shown in chart) are Bearish-Extreme with a score of 2.2 percent.

Price Trend-Following Model: Downtrend

Our weekly trend-following model classifies the current market price position as: Downtrend. The current action for the model is considered to be: Hold – Maintain Short Position.

SWISS FRANC StatisticsSPECULATORSCOMMERCIALSSMALL TRADERS
– Percent of Open Interest Longs:11.279.39.2
– Percent of Open Interest Shorts:53.420.425.9
– Net Position:-41,78658,283-16,497
– Gross Longs:11,04078,4469,120
– Gross Shorts:52,82620,16325,617
– Long to Short Ratio:0.2 to 13.9 to 10.4 to 1
NET POSITION TREND:
– Strength Index Score (3 Year Range Pct):1.4100.02.2
– Strength Index Reading (3 Year Range):Bearish-ExtremeBullish-ExtremeBearish-Extreme
NET POSITION MOVEMENT INDEX:
– 6-Week Change in Strength Index:-37.937.3-16.4


Canadian Dollar Futures:

Canadian Dollar Forex Futures COT ChartThe Canadian Dollar large speculator standing this week totaled a net position of -63,201 contracts in the data reported through Tuesday. This was a weekly advance of 13,249 contracts from the previous week which had a total of -76,450 net contracts.

This week’s current strength score (the trader positioning range over the past three years, measured from 0 to 100) shows the speculators are currently Bearish-Extreme with a score of 14.9 percent. The commercials are Bullish-Extreme with a score of 87.9 percent and the small traders (not shown in chart) are Bearish-Extreme with a score of 6.8 percent.

Price Trend-Following Model: Downtrend

Our weekly trend-following model classifies the current market price position as: Downtrend. The current action for the model is considered to be: Hold – Maintain Short Position.

CANADIAN DOLLAR StatisticsSPECULATORSCOMMERCIALSSMALL TRADERS
– Percent of Open Interest Longs:16.068.213.4
– Percent of Open Interest Shorts:45.834.916.8
– Net Position:-63,20170,490-7,289
– Gross Longs:33,793144,35928,321
– Gross Shorts:96,99473,86935,610
– Long to Short Ratio:0.3 to 12.0 to 10.8 to 1
NET POSITION TREND:
– Strength Index Score (3 Year Range Pct):14.987.96.8
– Strength Index Reading (3 Year Range):Bearish-ExtremeBullish-ExtremeBearish-Extreme
NET POSITION MOVEMENT INDEX:
– 6-Week Change in Strength Index:-19.816.7-6.8


Australian Dollar Futures:

Australian Dollar Forex Futures COT ChartThe Australian Dollar large speculator standing this week totaled a net position of -83,235 contracts in the data reported through Tuesday. This was a weekly lift of 13,004 contracts from the previous week which had a total of -96,239 net contracts.

This week’s current strength score (the trader positioning range over the past three years, measured from 0 to 100) shows the speculators are currently Bearish with a score of 22.0 percent. The commercials are Bullish-Extreme with a score of 81.8 percent and the small traders (not shown in chart) are Bearish with a score of 31.1 percent.

Price Trend-Following Model: Weak Downtrend

Our weekly trend-following model classifies the current market price position as: Weak Downtrend. The current action for the model is considered to be: Hold – Maintain Short Position.

AUSTRALIAN DOLLAR StatisticsSPECULATORSCOMMERCIALSSMALL TRADERS
– Percent of Open Interest Longs:18.470.29.2
– Percent of Open Interest Shorts:55.529.013.3
– Net Position:-83,23592,394-9,159
– Gross Longs:41,293157,62920,613
– Gross Shorts:124,52865,23529,772
– Long to Short Ratio:0.3 to 12.4 to 10.7 to 1
NET POSITION TREND:
– Strength Index Score (3 Year Range Pct):22.081.831.1
– Strength Index Reading (3 Year Range):BearishBullish-ExtremeBearish
NET POSITION MOVEMENT INDEX:
– 6-Week Change in Strength Index:22.0-17.1-1.6


New Zealand Dollar Futures:

New Zealand Dollar Forex Futures COT ChartThe New Zealand Dollar large speculator standing this week totaled a net position of -8,551 contracts in the data reported through Tuesday. This was a weekly boost of 3,496 contracts from the previous week which had a total of -12,047 net contracts.

This week’s current strength score (the trader positioning range over the past three years, measured from 0 to 100) shows the speculators are currently Bearish with a score of 36.1 percent. The commercials are Bullish with a score of 66.5 percent and the small traders (not shown in chart) are Bearish with a score of 27.7 percent.

Price Trend-Following Model: Downtrend

Our weekly trend-following model classifies the current market price position as: Downtrend. The current action for the model is considered to be: Hold – Maintain Short Position.

NEW ZEALAND DOLLAR StatisticsSPECULATORSCOMMERCIALSSMALL TRADERS
– Percent of Open Interest Longs:36.657.75.5
– Percent of Open Interest Shorts:51.139.79.0
– Net Position:-8,55110,607-2,056
– Gross Longs:21,51433,9423,253
– Gross Shorts:30,06523,3355,309
– Long to Short Ratio:0.7 to 11.5 to 10.6 to 1
NET POSITION TREND:
– Strength Index Score (3 Year Range Pct):36.166.527.7
– Strength Index Reading (3 Year Range):BearishBullishBearish
NET POSITION MOVEMENT INDEX:
– 6-Week Change in Strength Index:-23.725.9-29.0


Mexican Peso Futures:

Mexican Peso Futures COT ChartThe Mexican Peso large speculator standing this week totaled a net position of 119,045 contracts in the data reported through Tuesday. This was a weekly decline of -4,610 contracts from the previous week which had a total of 123,655 net contracts.

This week’s current strength score (the trader positioning range over the past three years, measured from 0 to 100) shows the speculators are currently Bullish-Extreme with a score of 89.9 percent. The commercials are Bearish-Extreme with a score of 10.1 percent and the small traders (not shown in chart) are Bearish with a score of 38.5 percent.

Price Trend-Following Model: Weak Uptrend

Our weekly trend-following model classifies the current market price position as: Weak Uptrend. The current action for the model is considered to be: Hold – Maintain Long Position.

MEXICAN PESO StatisticsSPECULATORSCOMMERCIALSSMALL TRADERS
– Percent of Open Interest Longs:58.138.42.9
– Percent of Open Interest Shorts:10.387.91.2
– Net Position:119,045-123,3254,280
– Gross Longs:144,67995,7157,175
– Gross Shorts:25,634219,0402,895
– Long to Short Ratio:5.6 to 10.4 to 12.5 to 1
NET POSITION TREND:
– Strength Index Score (3 Year Range Pct):89.910.138.5
– Strength Index Reading (3 Year Range):Bullish-ExtremeBearish-ExtremeBearish
NET POSITION MOVEMENT INDEX:
– 6-Week Change in Strength Index:-4.74.6-0.2


Brazilian Real Futures:

Brazil Real Futures COT ChartThe Brazilian Real large speculator standing this week totaled a net position of 286 contracts in the data reported through Tuesday. This was a weekly fall of -678 contracts from the previous week which had a total of 964 net contracts.

This week’s current strength score (the trader positioning range over the past three years, measured from 0 to 100) shows the speculators are currently Bearish with a score of 24.1 percent. The commercials are Bullish with a score of 76.3 percent and the small traders (not shown in chart) are Bearish with a score of 34.8 percent.

Price Trend-Following Model: Downtrend

Our weekly trend-following model classifies the current market price position as: Downtrend. The current action for the model is considered to be: Hold – Maintain Short Position.

BRAZIL REAL StatisticsSPECULATORSCOMMERCIALSSMALL TRADERS
– Percent of Open Interest Longs:47.049.02.1
– Percent of Open Interest Shorts:46.749.32.0
– Net Position:286-32135
– Gross Longs:47,28149,3052,074
– Gross Shorts:46,99549,6262,039
– Long to Short Ratio:1.0 to 11.0 to 11.0 to 1
NET POSITION TREND:
– Strength Index Score (3 Year Range Pct):24.176.334.8
– Strength Index Reading (3 Year Range):BearishBullishBearish
NET POSITION MOVEMENT INDEX:
– 6-Week Change in Strength Index:-15.117.8-20.3


Bitcoin Futures:

Bitcoin Crypto Futures COT ChartThe Bitcoin large speculator standing this week totaled a net position of 6 contracts in the data reported through Tuesday. This was a weekly rise of 6 contracts from the previous week which had a total of 0 net contracts.

This week’s current strength score (the trader positioning range over the past three years, measured from 0 to 100) shows the speculators are currently Bullish with a score of 66.5 percent. The commercials are Bullish with a score of 51.2 percent and the small traders (not shown in chart) are Bearish with a score of 24.9 percent.

Price Trend-Following Model: Uptrend

Our weekly trend-following model classifies the current market price position as: Uptrend. The current action for the model is considered to be: Hold – Maintain Long Position.

BITCOIN StatisticsSPECULATORSCOMMERCIALSSMALL TRADERS
– Percent of Open Interest Longs:78.95.25.9
– Percent of Open Interest Shorts:78.97.33.8
– Net Position:6-530524
– Gross Longs:19,5691,2911,461
– Gross Shorts:19,5631,821937
– Long to Short Ratio:1.0 to 10.7 to 11.6 to 1
NET POSITION TREND:
– Strength Index Score (3 Year Range Pct):66.551.224.9
– Strength Index Reading (3 Year Range):BullishBullishBearish
NET POSITION MOVEMENT INDEX:
– 6-Week Change in Strength Index:31.6-45.4-7.3


Article By InvestMacroReceive our weekly COT Newsletter

*COT Report: The COT data, released weekly to the public each Friday, is updated through the most recent Tuesday (data is 3 days old) and shows a quick view of how large speculators or non-commercials (for-profit traders) were positioned in the futures markets.

The CFTC categorizes trader positions according to commercial hedgers (traders who use futures contracts for hedging as part of the business), non-commercials (large traders who speculate to realize trading profits) and nonreportable traders (usually small traders/speculators) as well as their open interest (contracts open in the market at time of reporting). See CFTC criteria here.