By InvestMacro

Here are the latest charts and statistics for the Commitment of Traders (COT) data published by the Commodities Futures Trading Commission (CFTC).
The latest COT data is updated through Tuesday April 8th and shows a quick view of how large market participants (for-profit speculators and commercial traders) were positioned in the futures markets. All currency positions are in direct relation to the US dollar where, for example, a bet for the euro is a bet that the euro will rise versus the dollar while a bet against the euro will be a bet that the euro will decline versus the dollar.
Weekly Speculator Changes led by Japanese Yen, Australian Dollar & Swiss Franc

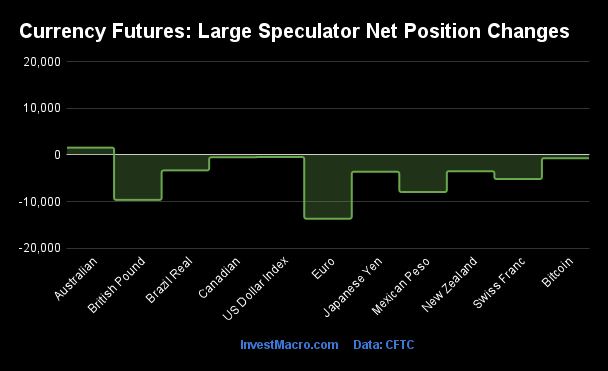
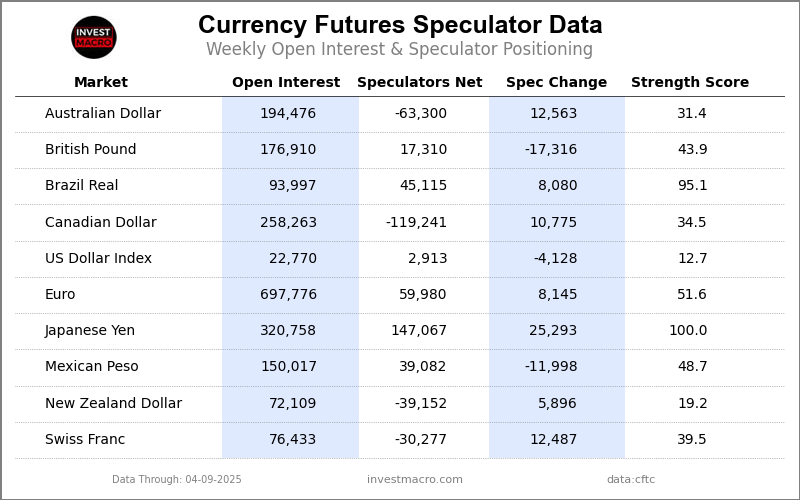
The COT currency market speculator bets were overall higher this week as eight out of the eleven currency markets we cover had higher positioning while the other three markets had lower speculator contracts.
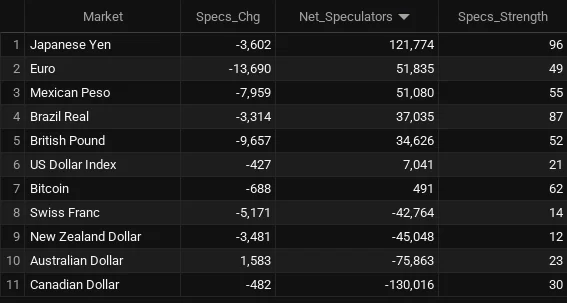
Leading the gains for the currency markets was the Japanese Yen (25,293 contracts) with the Australian Dollar (12,563 contracts), the Swiss Franc (12,487 contracts), the Canadian Dollar (10,775 contracts), the EuroFX (8,145 contracts), the Brazilian Real (8,080 contracts), the New Zealand Dollar (5,896 contracts) and Bitcoin (841 contracts) also showing positive weeks.
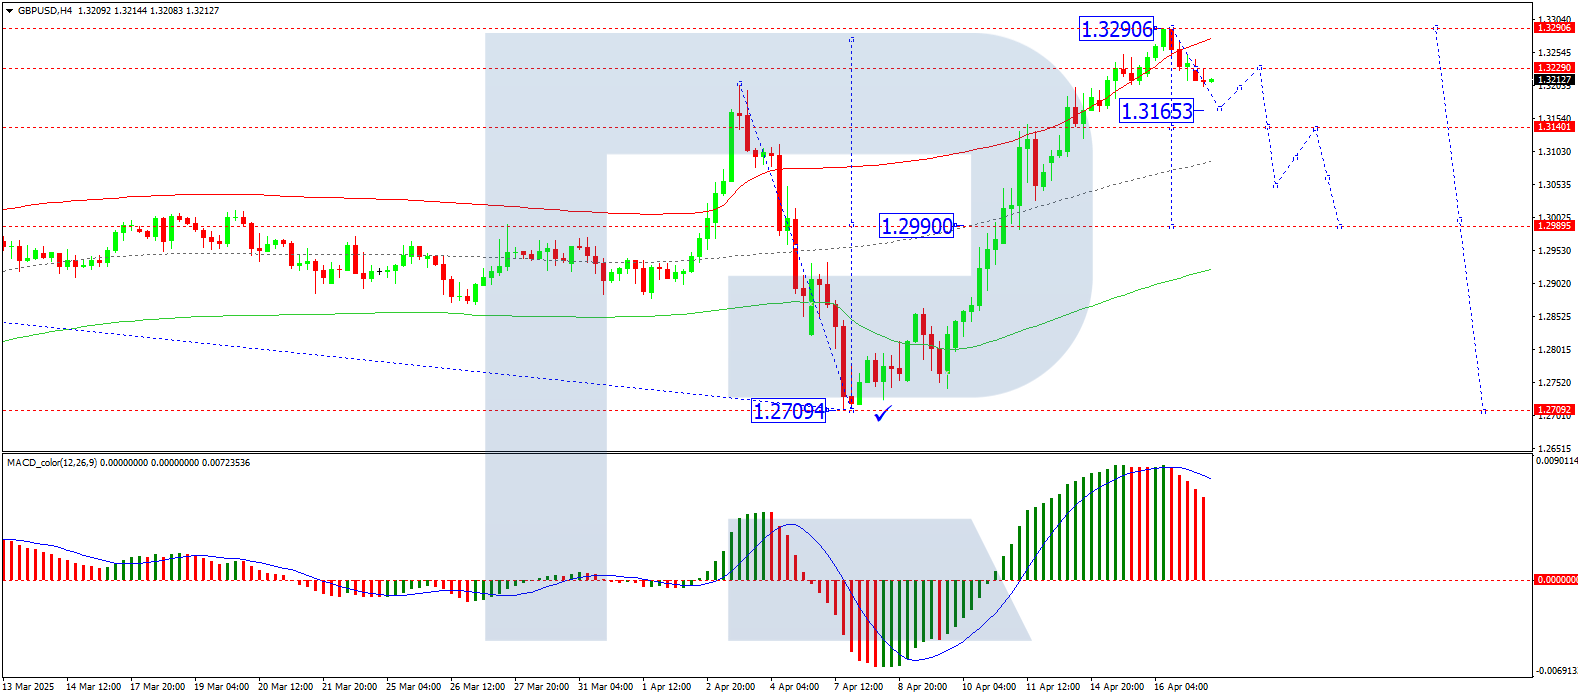
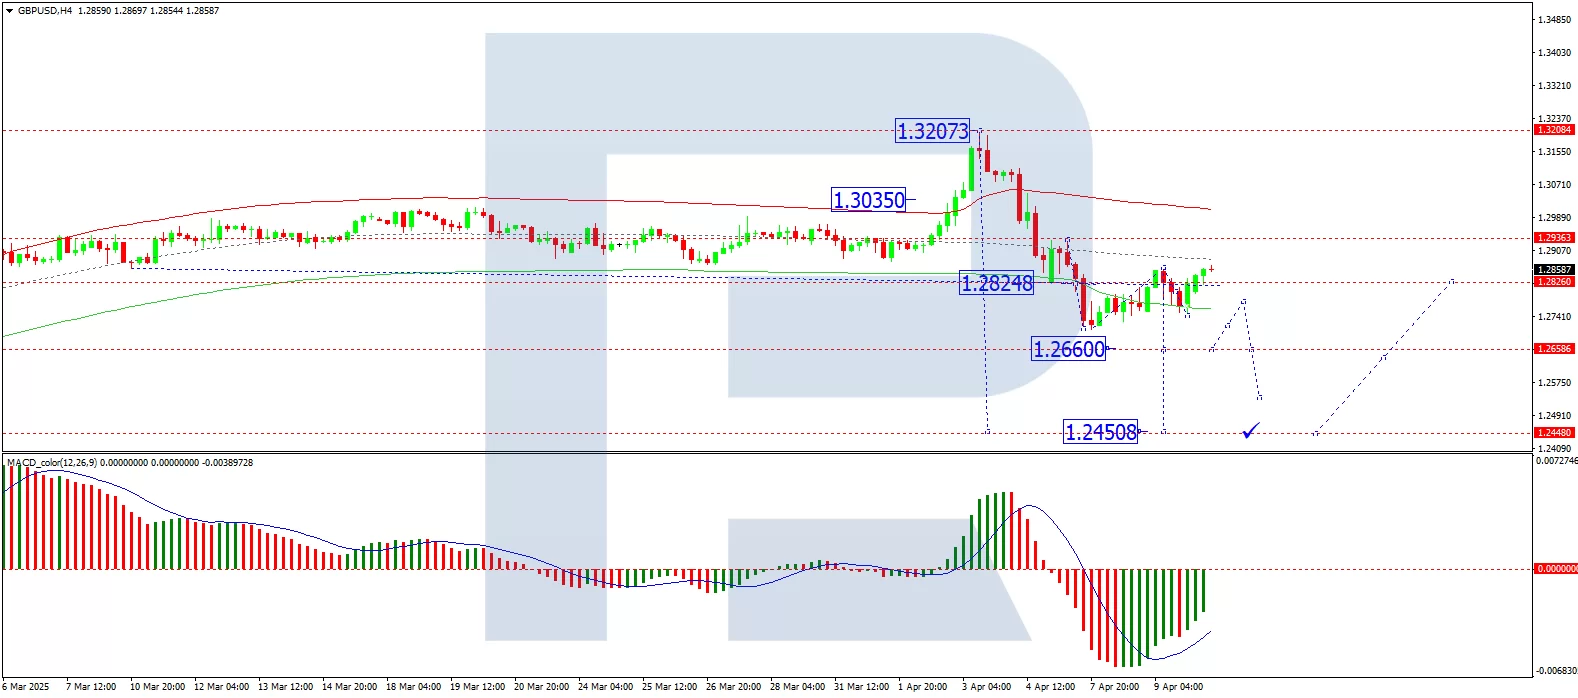
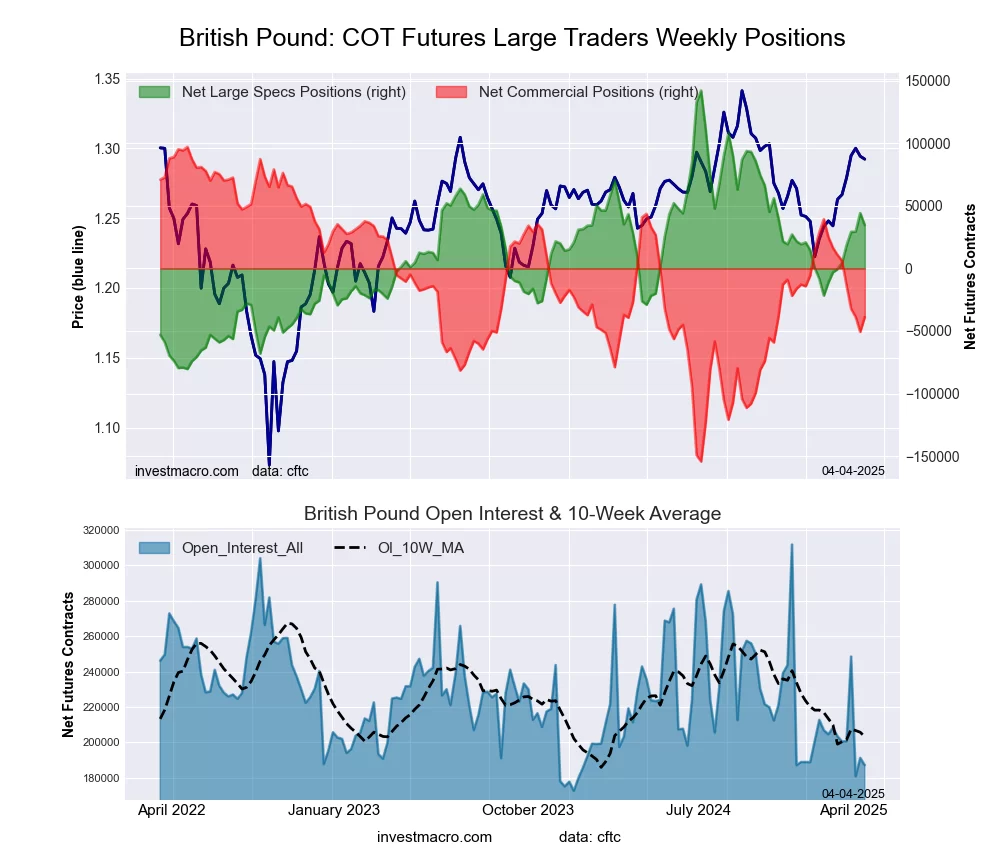
The currencies seeing declines in speculator bets on the week were the British Pound (-17,316 contracts), the Mexican Peso (-11,998 contracts) and with the US Dollar Index (-4,128 contracts) also recording lower bets on the week.
Japanese Yen Speculators push bullish bets to new record high
Highlighting the COT currency’s data this week is the continued push higher in bullish bets for the Japanese yen speculators.
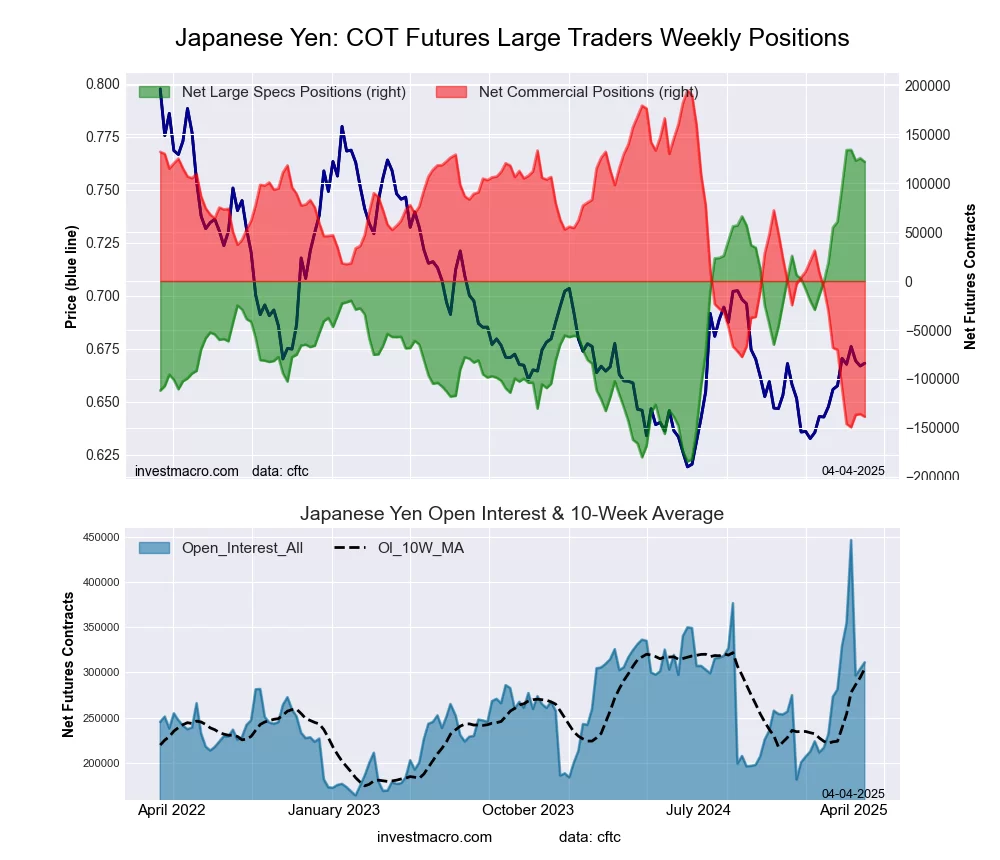
Large speculative yen positions surged higher by +25,293 contracts this week and have now advanced in ten out of the past twelve weeks. Over these past twelve weeks, the speculator position has gained by a total of +176,478 contracts and gone from a bearish position on January 14th (-29,411 contracts) to a new all-time high this week (+147,067 contracts). The new record high surpasses the most recent record reached on March 11th at a total of +133,902 contracts.
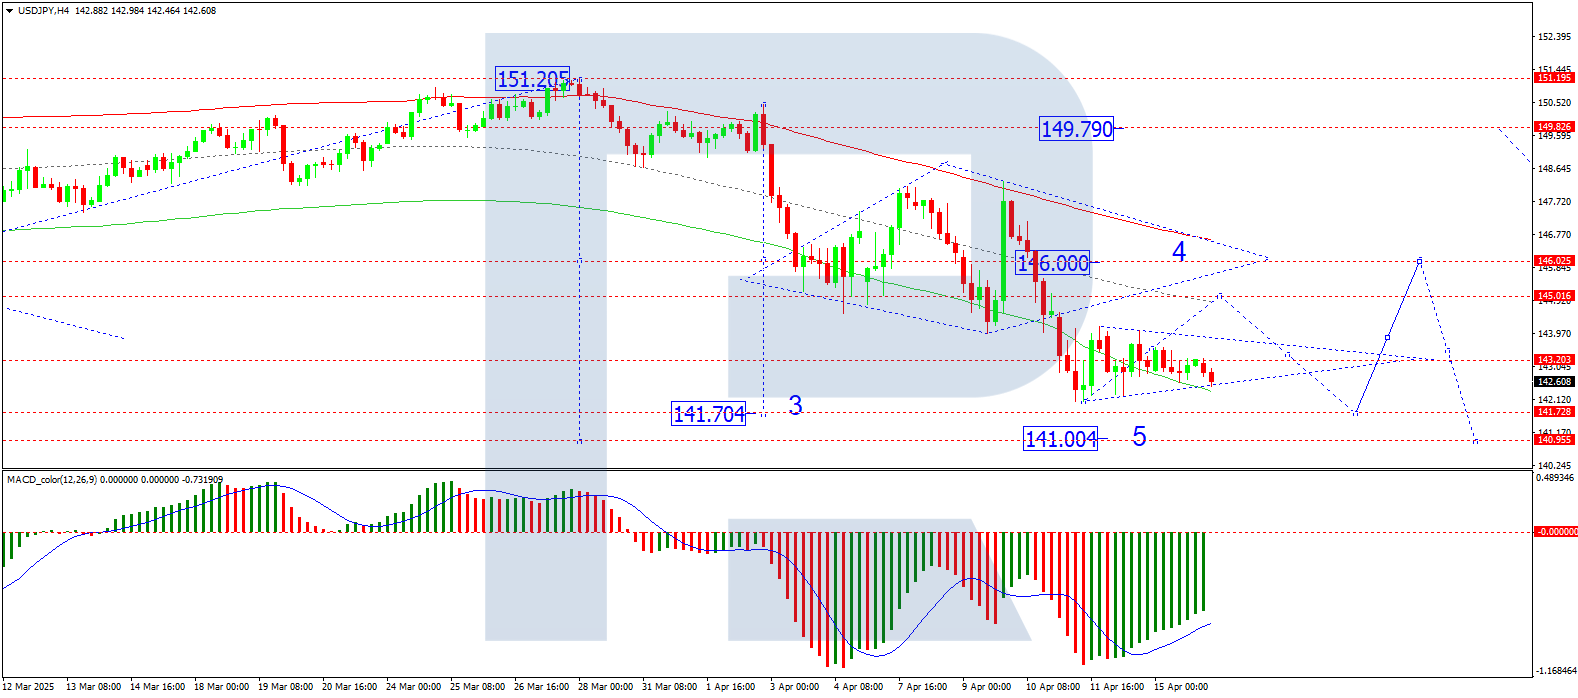
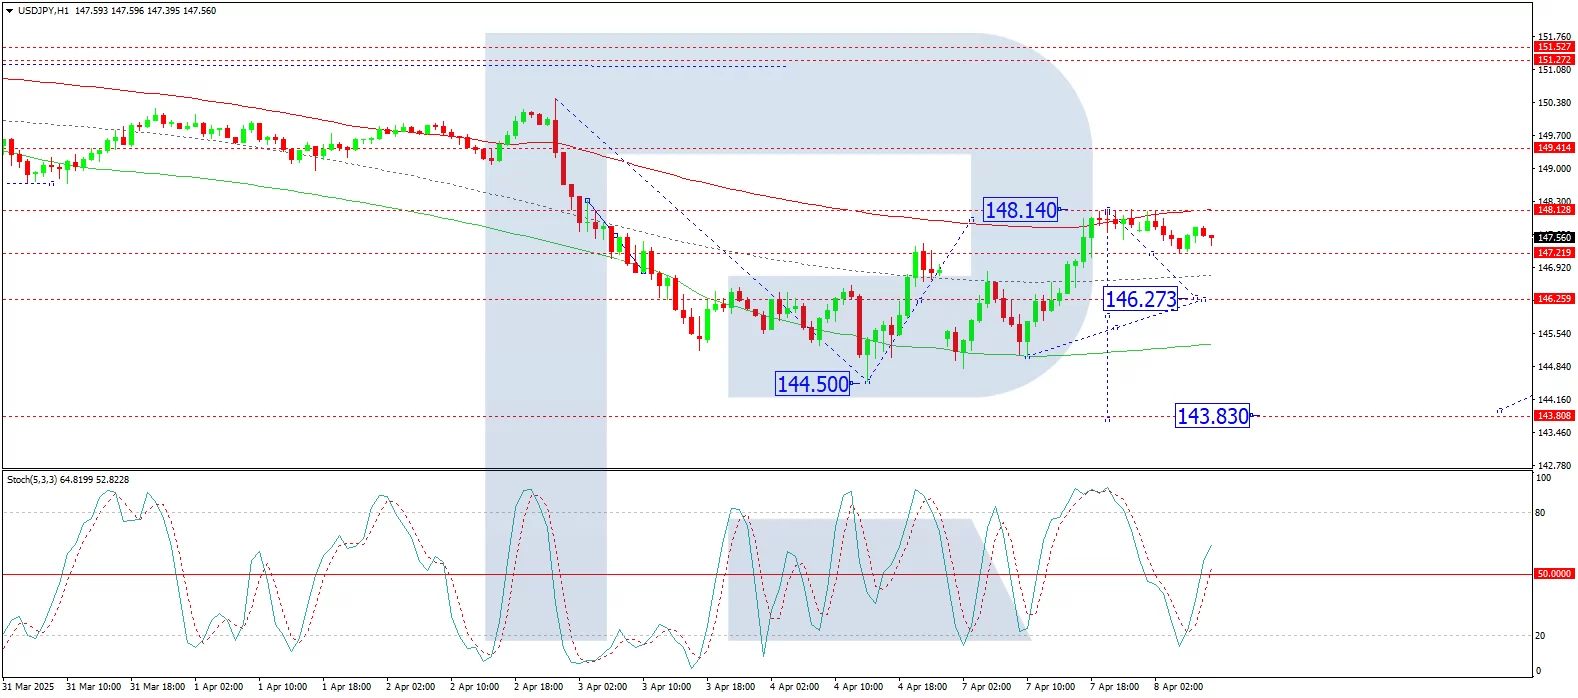
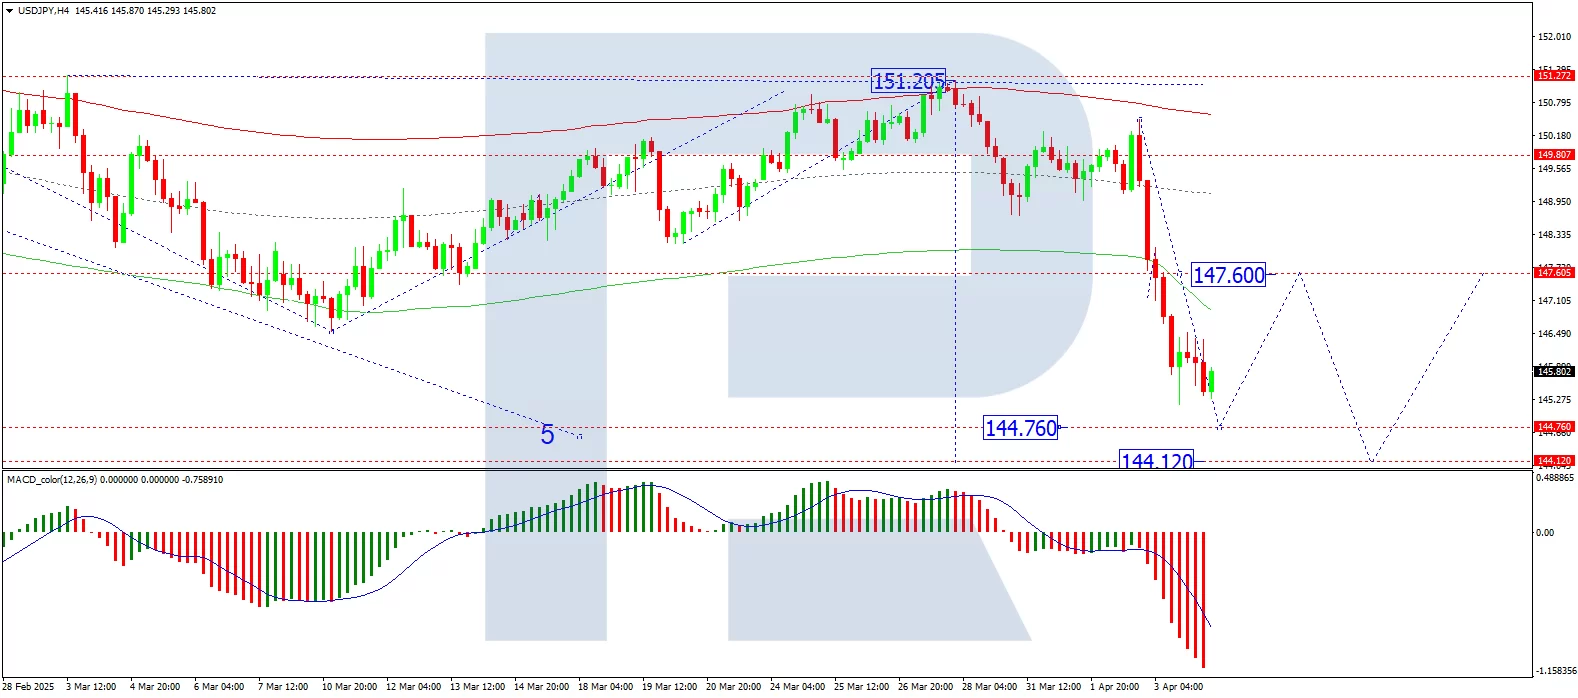
The yen exchange rate has been on the move higher as well with the JPY rising this week to the best level against the US Dollar since September of 2024. The USDJPY currency pair is currently trading around 143.50 and further USD weakness/JPY strength with set up a test of the major support level at 140.00.
Tariff turmoil boosts Swiss Franc & Euro, hits USD
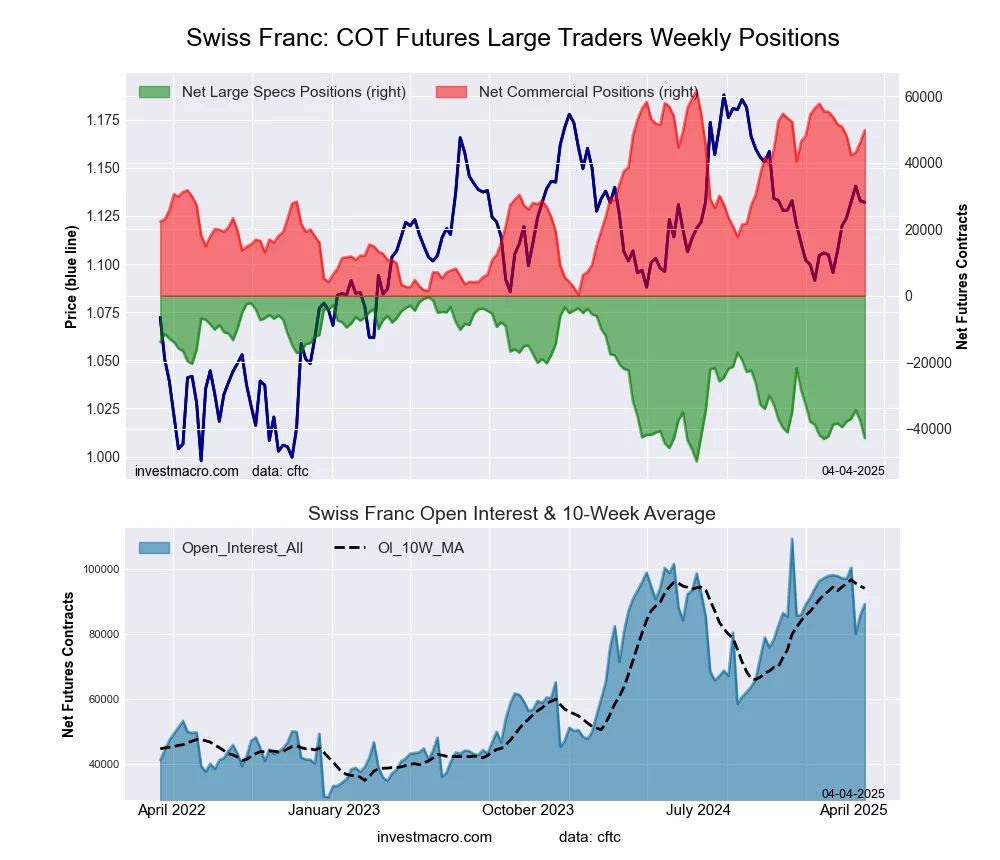
Elsewhere, the Swiss franc has been the recipient of safe haven flows and saw speculators sharply boost their bets this week by +12,487 contracts. The overall franc position remains bearish and has been since 2021 – so there is a lot of room for speculator bets to turn around. The Swiss franc (CHF) exchange rate has been on a sharp upward move since the Tariff turmoil hit the markets. This week, the franc rose by over 5 percent and the currency is up over 10 percent in just the past 30 days. The franc closed at the highest level versus the USD since 2011 on Friday.
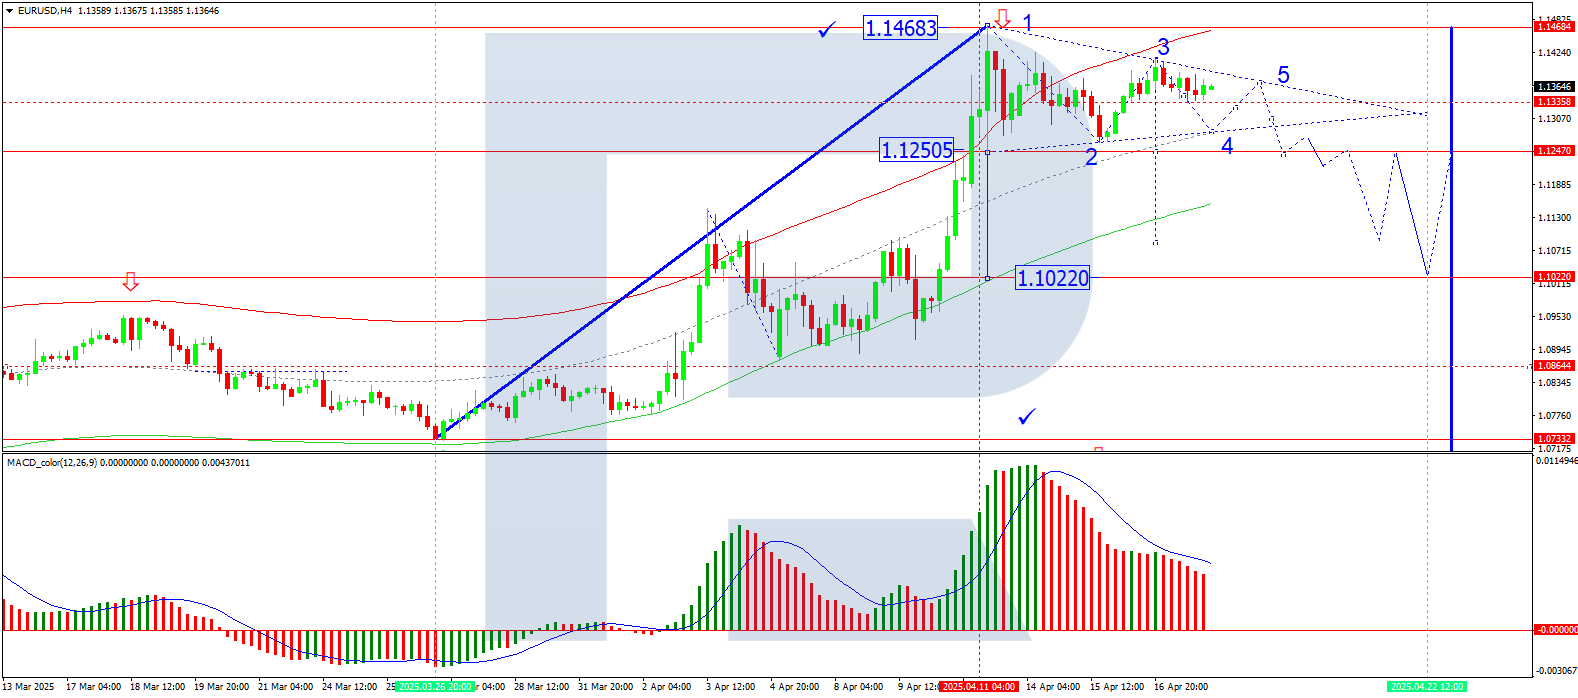
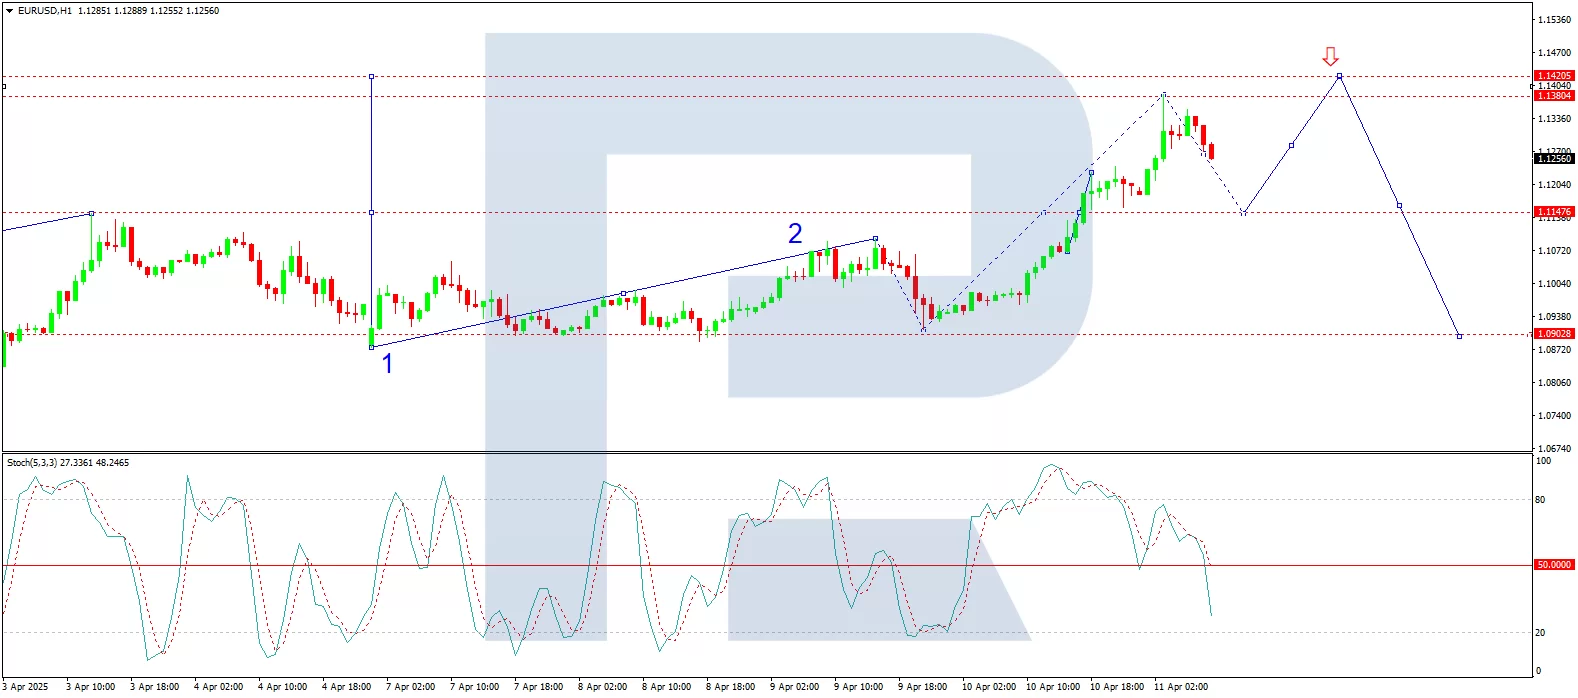
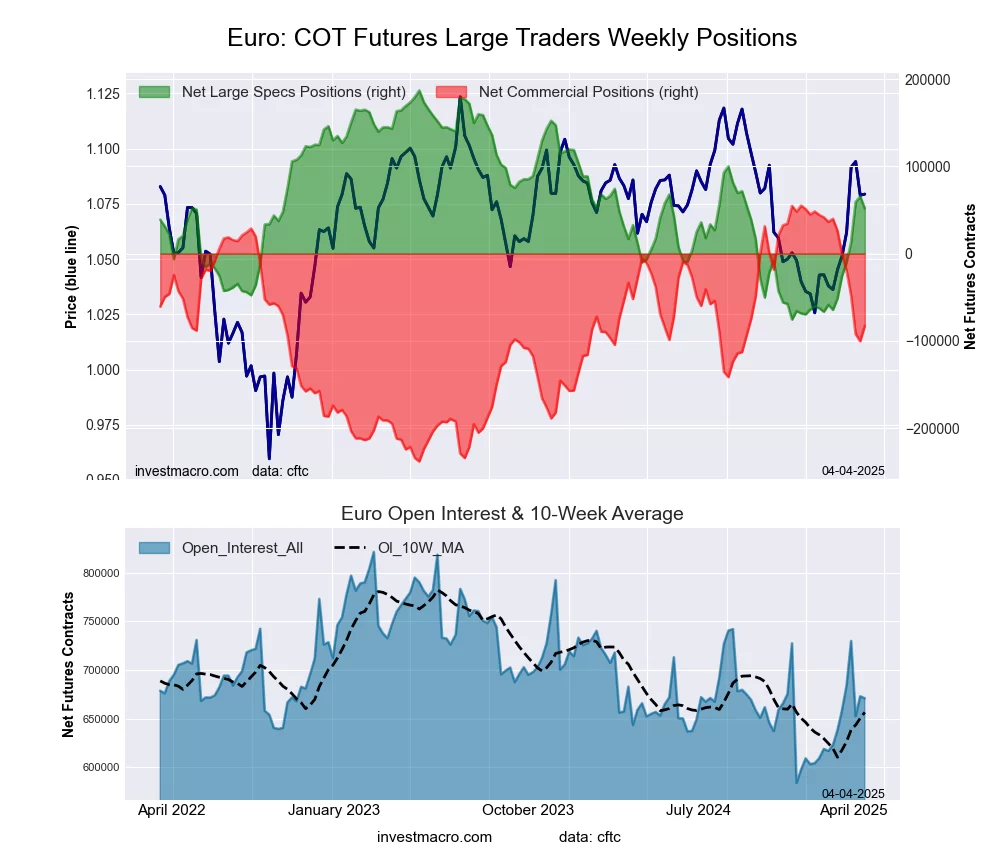
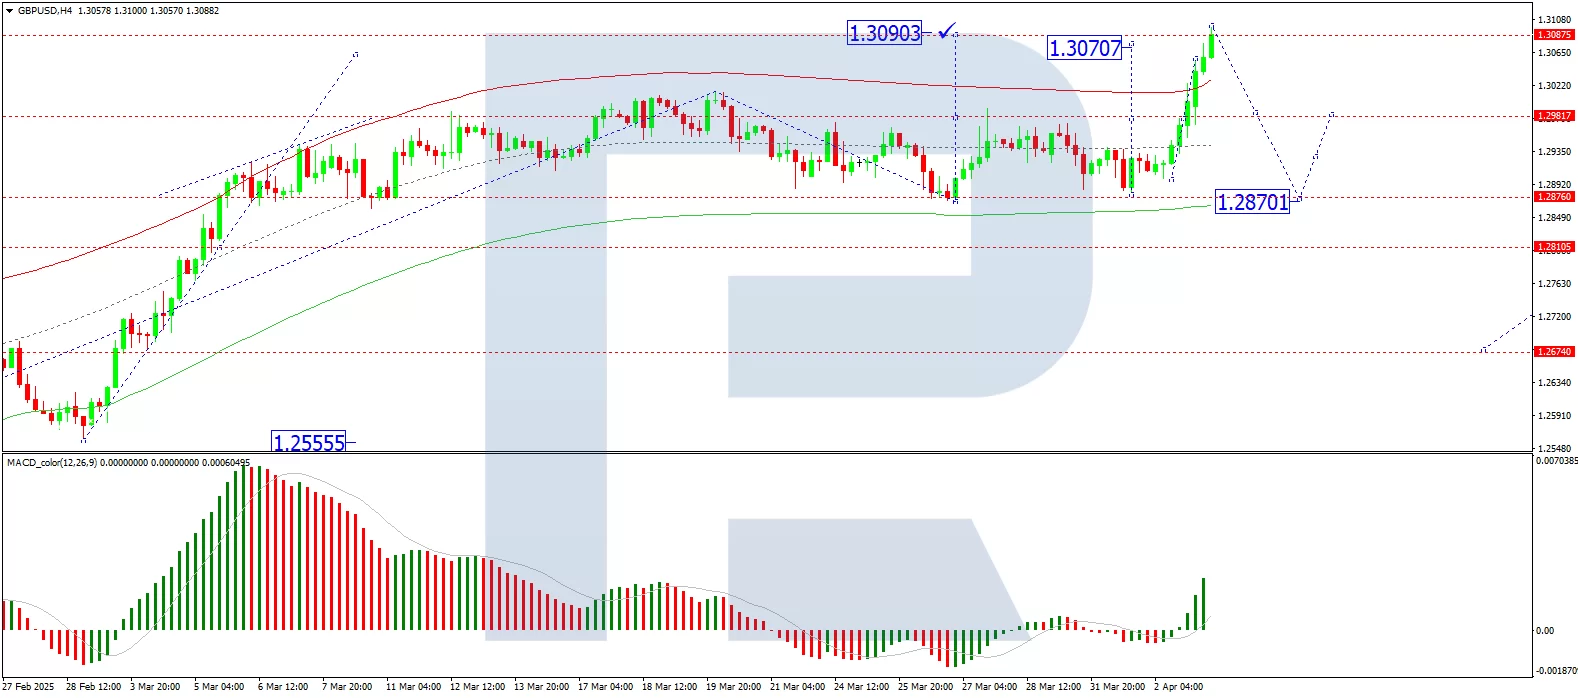
The Euro speculators raised their bullish bets this week for the seventh time out of the past eight weeks. This has added a total of +46,335 contracts to the Euro position in the past eight weeks. The overall bullish standing at the moment for the Euro is at approximately +60,000 contracts which is right down the middle of its 3-year range (strength score of 51 percent). The Euro exchange rate versus the USD has been moving higher and closed this week at its highest level since 2022 at over 1.1350. The Euro move has seen a gain by almost 10 percent in the past 30 days.
The US Dollar Index (DXY) has been on the opposite side of the Tariff turmoil and has been sold off strongly in the past couple of weeks. The DXY closed this week under the 100.00 for the first time since July of 2023 and has also closed firmly under its 200-week moving average. Speculators reduced their positions for the USD Index by -4,128 contracts this week and brought the overall bullish position down to +2,913 contracts, the lowest level since December.
Currency Data:
Legend: Weekly Speculators Change | Speculators Current Net Position | Speculators Strength Score compared to last 3-Years (0-100 range)
Strength Scores led by Japanese Yen & Brazilian Real

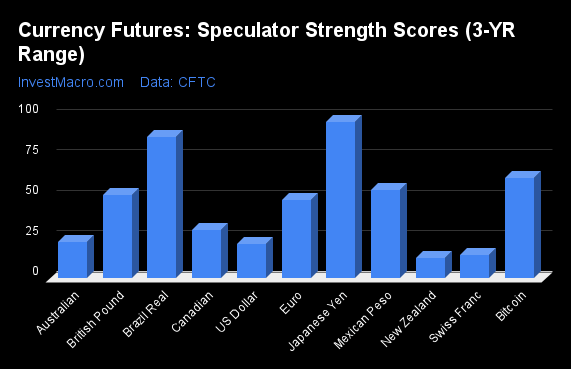
COT Strength Scores (a normalized measure of Speculator positions over a 3-Year range, from 0 to 100 where above 80 is Extreme-Bullish and below 20 is Extreme-Bearish) showed that the Japanese Yen (100 percent) and the Brazilian Real (95 percent) lead the currency markets this week. Bitcoin (80 percent) and the EuroFX (52 percent) come in as the next highest in the weekly strength scores.
On the downside, the US Dollar Index (13 percent) and the New Zealand Dollar (19 percent) come in at the lowest strength levels currently and are in Extreme-Bearish territory (below 20 percent). The next lowest strength scores are the Australian Dollar (31 percent) and the Canadian Dollar (35 percent).
3-Year Strength Statistics:
US Dollar Index (12.7 percent) vs US Dollar Index previous week (21.3 percent)
EuroFX (51.6 percent) vs EuroFX previous week (48.5 percent)
British Pound Sterling (43.9 percent) vs British Pound Sterling previous week (51.7 percent)
Japanese Yen (100.0 percent) vs Japanese Yen previous week (92.4 percent)
Swiss Franc (39.5 percent) vs Swiss Franc previous week (14.2 percent)
Canadian Dollar (34.5 percent) vs Canadian Dollar previous week (29.7 percent)
Australian Dollar (31.4 percent) vs Australian Dollar previous week (22.5 percent)
New Zealand Dollar (19.2 percent) vs New Zealand Dollar previous week (12.4 percent)
Mexican Peso (48.7 percent) vs Mexican Peso previous week (54.8 percent)
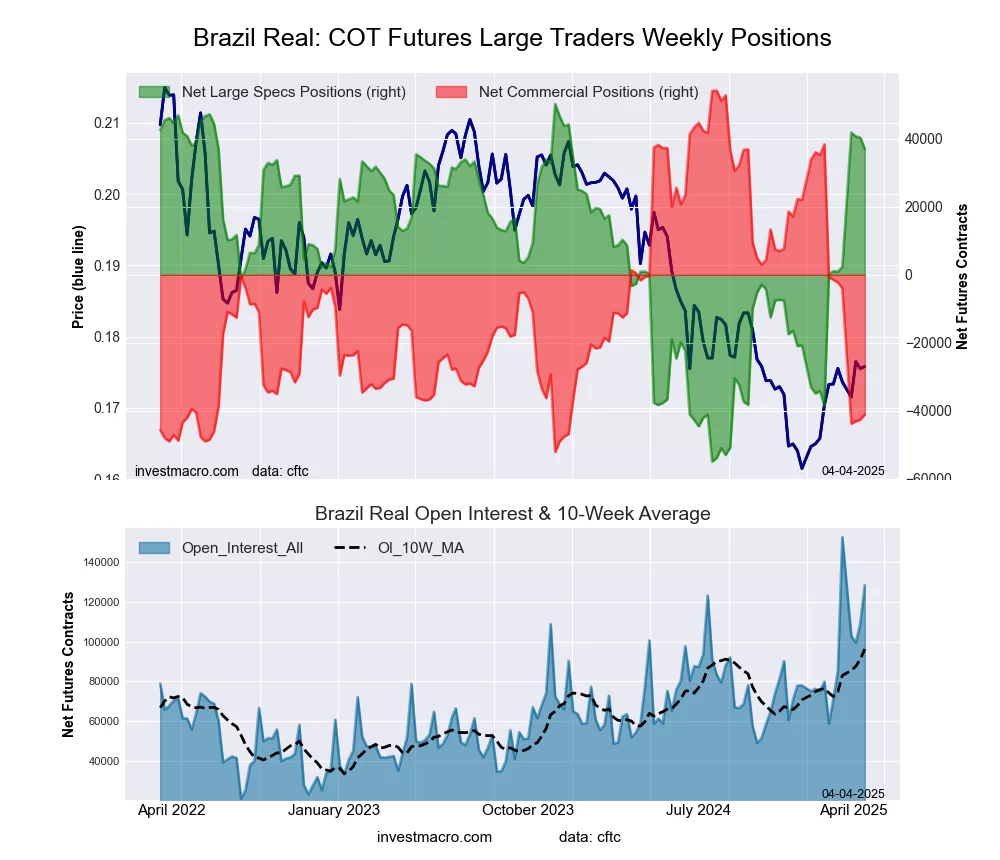
Brazilian Real (95.1 percent) vs Brazilian Real previous week (87.4 percent)
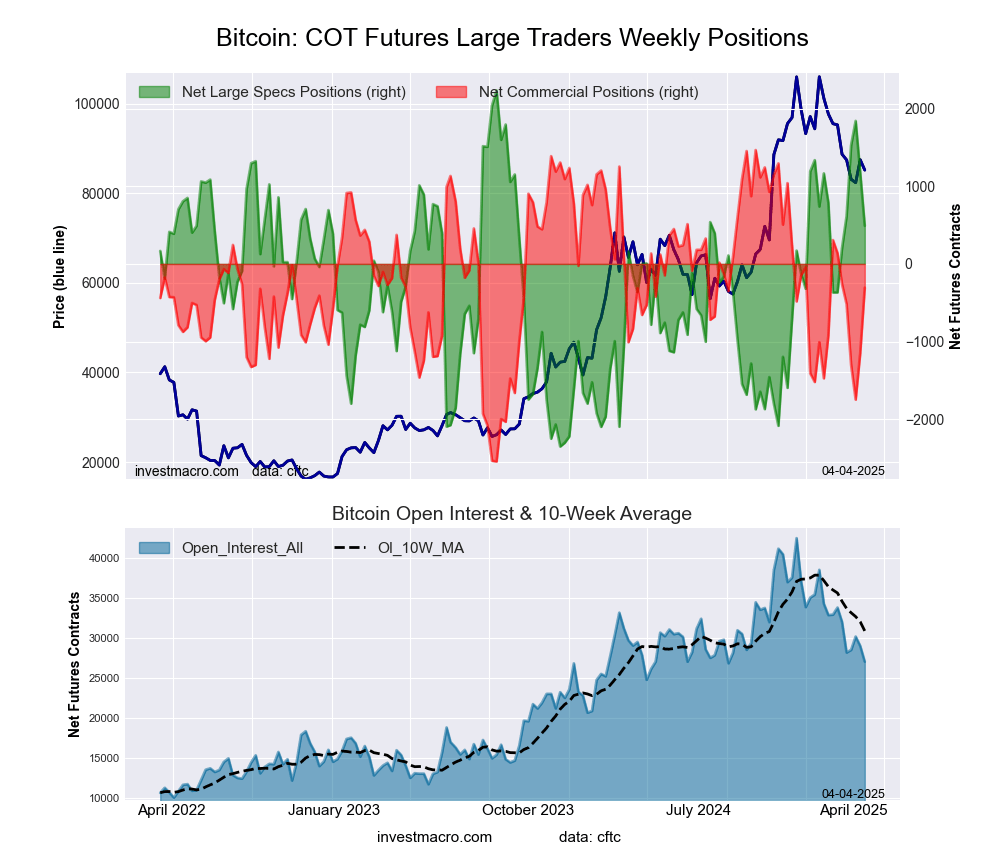
Bitcoin (80.4 percent) vs Bitcoin previous week (62.0 percent)
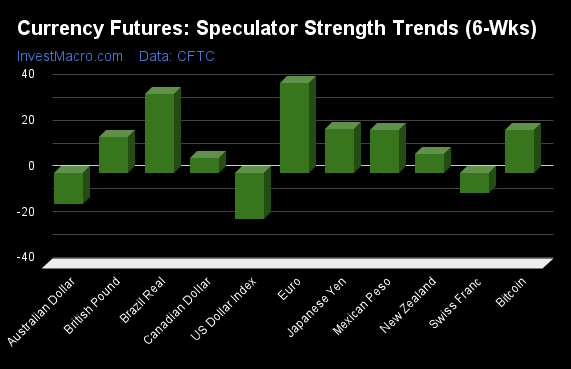
Brazilian Real & EuroFX top the 6-Week Strength Trends

COT Strength Score Trends (or move index, calculates the 6-week changes in strength scores) showed that the Brazilian Real (41 percent) and the EuroFX (33 percent) lead the past six weeks trends for the currencies. Bitcoin (25 percent), the Swiss Franc (19 percent) and the New Zealand Dollar (17 percent) are the next highest positive movers in the 3-Year trends data.
The US Dollar Index (-27 percent) leads the downside trend scores currently with the Australian Dollar (-13 percent) following next with a lower trend score.
3-Year Strength Trends:
US Dollar Index (-26.6 percent) vs US Dollar Index previous week (-20.2 percent)
EuroFX (32.5 percent) vs EuroFX previous week (39.3 percent)
British Pound Sterling (5.8 percent) vs British Pound Sterling previous week (15.8 percent)
Japanese Yen (15.4 percent) vs Japanese Yen previous week (18.5 percent)
Swiss Franc (18.6 percent) vs Swiss Franc previous week (-8.9 percent)
Canadian Dollar (8.4 percent) vs Canadian Dollar previous week (6.6 percent)
Australian Dollar (-12.6 percent) vs Australian Dollar previous week (-13.6 percent)
New Zealand Dollar (16.8 percent) vs New Zealand Dollar previous week (8.2 percent)
Mexican Peso (5.3 percent) vs Mexican Peso previous week (18.6 percent)
Brazilian Real (40.7 percent) vs Brazilian Real previous week (34.3 percent)
Bitcoin (24.6 percent) vs Bitcoin previous week (18.7 percent)
Individual COT Forex Markets:
US Dollar Index Futures:
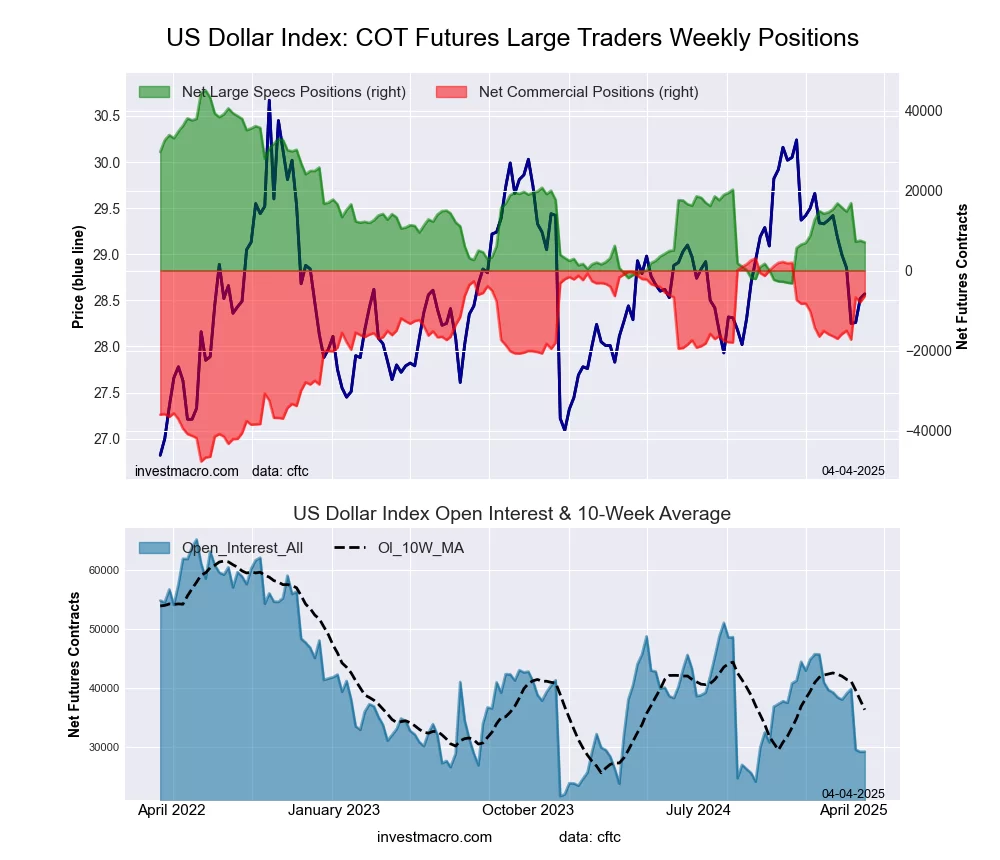
 The US Dollar Index large speculator standing this week was a net position of 2,913 contracts in the data reported through Tuesday. This was a weekly decrease of -4,128 contracts from the previous week which had a total of 7,041 net contracts.
This week’s current strength score (the trader positioning range over the past three years, measured from 0 to 100) shows the speculators are currently Bearish-Extreme with a score of 12.7 percent. The commercials are Bullish-Extreme with a score of 88.9 percent and the small traders (not shown in chart) are Bearish with a score of 26.1 percent.
Price Trend-Following Model: Strong Downtrend
Our weekly trend-following model classifies the current market price position as: Strong Downtrend.
| US DOLLAR INDEX Statistics | SPECULATORS | COMMERCIALS | SMALL TRADERS |
| – Percent of Open Interest Longs: | 68.0 | 15.7 | 10.9 |
| – Percent of Open Interest Shorts: | 55.2 | 27.1 | 12.3 |
| – Net Position: | 2,913 | -2,601 | -312 |
| – Gross Longs: | 15,487 | 3,580 | 2,479 |
| – Gross Shorts: | 12,574 | 6,181 | 2,791 |
| – Long to Short Ratio: | 1.2 to 1 | 0.6 to 1 | 0.9 to 1 |
| NET POSITION TREND: | | | |
| – Strength Index Score (3 Year Range Pct): | 12.7 | 88.9 | 26.1 |
| – Strength Index Reading (3 Year Range): | Bearish-Extreme | Bullish-Extreme | Bearish |
| NET POSITION MOVEMENT INDEX: | | | |
| – 6-Week Change in Strength Index: | -26.6 | 26.1 | -6.0 |
Euro Currency Futures:
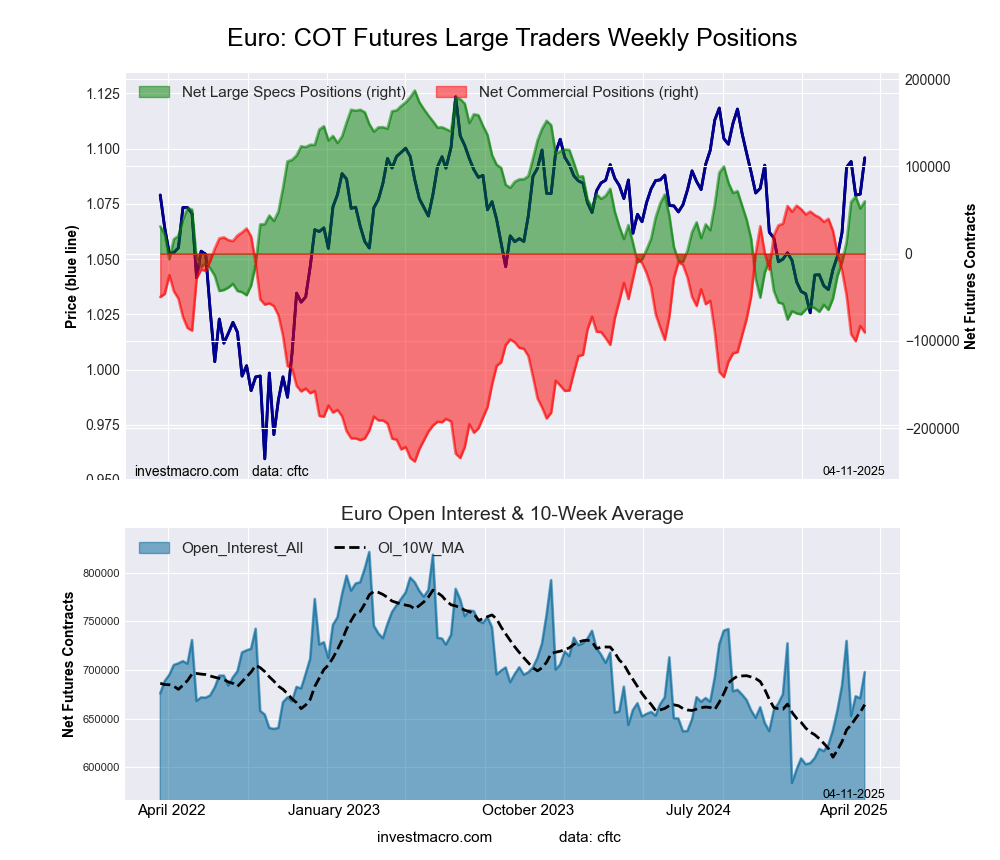 The Euro Currency large speculator standing this week was a net position of 59,980 contracts in the data reported through Tuesday. This was a weekly increase of 8,145 contracts from the previous week which had a total of 51,835 net contracts.
This week’s current strength score (the trader positioning range over the past three years, measured from 0 to 100) shows the speculators are currently Bullish with a score of 51.6 percent. The commercials are Bullish with a score of 50.4 percent and the small traders (not shown in chart) are Bearish with a score of 40.9 percent.
Price Trend-Following Model: Strong Uptrend
Our weekly trend-following model classifies the current market price position as: Strong Uptrend.
| EURO Currency Statistics | SPECULATORS | COMMERCIALS | SMALL TRADERS |
| – Percent of Open Interest Longs: | 27.3 | 57.6 | 11.6 |
| – Percent of Open Interest Shorts: | 18.7 | 70.5 | 7.2 |
| – Net Position: | 59,980 | -90,416 | 30,436 |
| – Gross Longs: | 190,296 | 401,858 | 80,668 |
| – Gross Shorts: | 130,316 | 492,274 | 50,232 |
| – Long to Short Ratio: | 1.5 to 1 | 0.8 to 1 | 1.6 to 1 |
| NET POSITION TREND: | | | |
| – Strength Index Score (3 Year Range Pct): | 51.6 | 50.4 | 40.9 |
| – Strength Index Reading (3 Year Range): | Bullish | Bullish | Bearish |
| NET POSITION MOVEMENT INDEX: | | | |
| – 6-Week Change in Strength Index: | 32.5 | -30.6 | 9.7 |
British Pound Sterling Futures:
 The British Pound Sterling large speculator standing this week was a net position of 17,310 contracts in the data reported through Tuesday. This was a weekly decline of -17,316 contracts from the previous week which had a total of 34,626 net contracts.
This week’s current strength score (the trader positioning range over the past three years, measured from 0 to 100) shows the speculators are currently Bearish with a score of 43.9 percent. The commercials are Bullish with a score of 55.1 percent and the small traders (not shown in chart) are Bullish with a score of 59.0 percent.
Price Trend-Following Model: Uptrend
Our weekly trend-following model classifies the current market price position as: Uptrend.
| BRITISH POUND Statistics | SPECULATORS | COMMERCIALS | SMALL TRADERS |
| – Percent of Open Interest Longs: | 51.9 | 33.8 | 13.6 |
| – Percent of Open Interest Shorts: | 42.1 | 42.7 | 14.5 |
| – Net Position: | 17,310 | -15,795 | -1,515 |
| – Gross Longs: | 91,733 | 59,719 | 24,131 |
| – Gross Shorts: | 74,423 | 75,514 | 25,646 |
| – Long to Short Ratio: | 1.2 to 1 | 0.8 to 1 | 0.9 to 1 |
| NET POSITION TREND: | | | |
| – Strength Index Score (3 Year Range Pct): | 43.9 | 55.1 | 59.0 |
| – Strength Index Reading (3 Year Range): | Bearish | Bullish | Bullish |
| NET POSITION MOVEMENT INDEX: | | | |
| – 6-Week Change in Strength Index: | 5.8 | -8.7 | 19.2 |
Japanese Yen Futures:
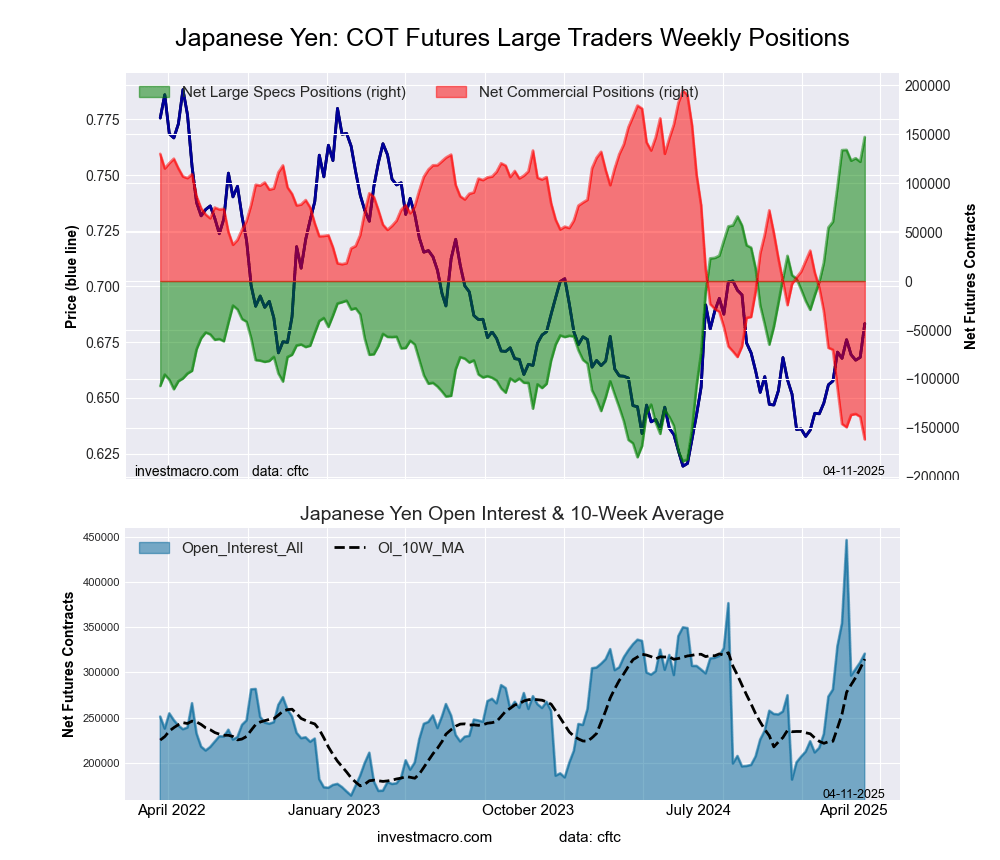 The Japanese Yen large speculator standing this week was a net position of 147,067 contracts in the data reported through Tuesday. This was a weekly increase of 25,293 contracts from the previous week which had a total of 121,774 net contracts.
This week’s current strength score (the trader positioning range over the past three years, measured from 0 to 100) shows the speculators are currently Bullish-Extreme with a score of 100.0 percent. The commercials are Bearish-Extreme with a score of 0.0 percent and the small traders (not shown in chart) are Bullish-Extreme with a score of 94.5 percent.
Price Trend-Following Model: Strong Uptrend
Our weekly trend-following model classifies the current market price position as: Strong Uptrend.
| JAPANESE YEN Statistics | SPECULATORS | COMMERCIALS | SMALL TRADERS |
| – Percent of Open Interest Longs: | 55.0 | 31.1 | 12.3 |
| – Percent of Open Interest Shorts: | 9.2 | 81.5 | 7.8 |
| – Net Position: | 147,067 | -161,669 | 14,602 |
| – Gross Longs: | 176,555 | 99,659 | 39,600 |
| – Gross Shorts: | 29,488 | 261,328 | 24,998 |
| – Long to Short Ratio: | 6.0 to 1 | 0.4 to 1 | 1.6 to 1 |
| NET POSITION TREND: | | | |
| – Strength Index Score (3 Year Range Pct): | 100.0 | 0.0 | 94.5 |
| – Strength Index Reading (3 Year Range): | Bullish-Extreme | Bearish-Extreme | Bullish-Extreme |
| NET POSITION MOVEMENT INDEX: | | | |
| – 6-Week Change in Strength Index: | 15.4 | -14.8 | 4.2 |
Swiss Franc Futures:
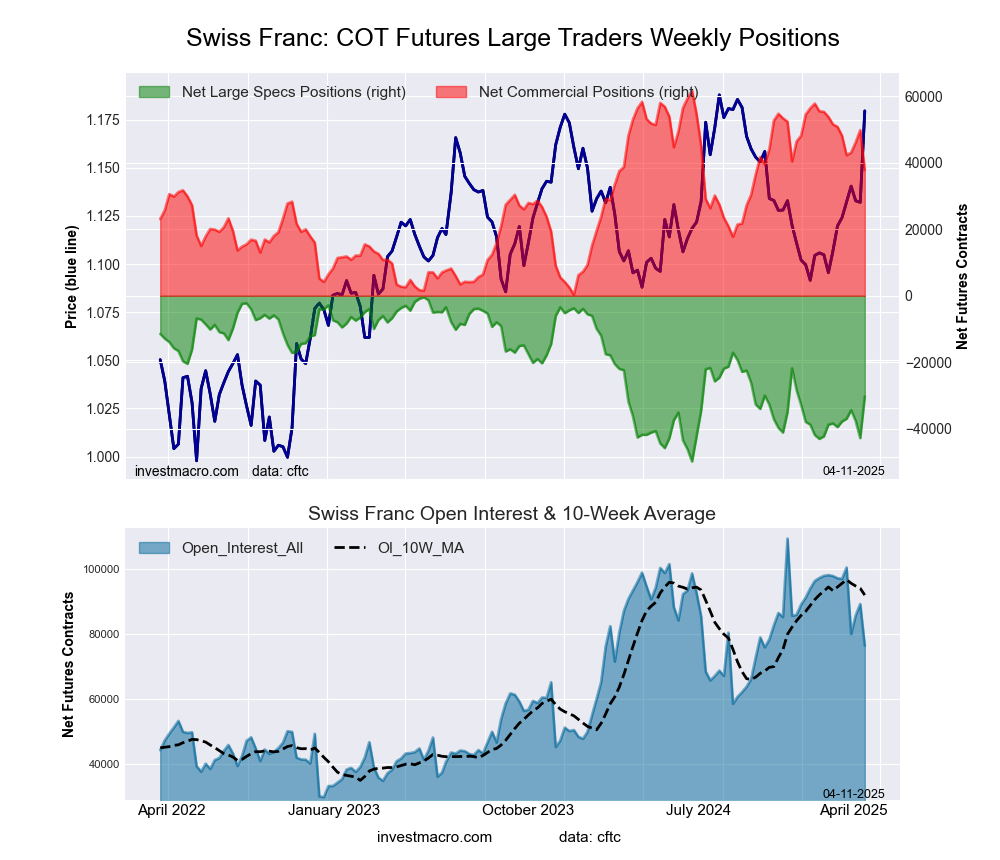 The Swiss Franc large speculator standing this week was a net position of -30,277 contracts in the data reported through Tuesday. This was a weekly boost of 12,487 contracts from the previous week which had a total of -42,764 net contracts.
This week’s current strength score (the trader positioning range over the past three years, measured from 0 to 100) shows the speculators are currently Bearish with a score of 39.5 percent. The commercials are Bullish with a score of 61.1 percent and the small traders (not shown in chart) are Bearish with a score of 46.9 percent.
Price Trend-Following Model: Strong Uptrend
Our weekly trend-following model classifies the current market price position as: Strong Uptrend.
| SWISS FRANC Statistics | SPECULATORS | COMMERCIALS | SMALL TRADERS |
| – Percent of Open Interest Longs: | 5.7 | 79.6 | 13.9 |
| – Percent of Open Interest Shorts: | 45.3 | 30.2 | 23.8 |
| – Net Position: | -30,277 | 37,800 | -7,523 |
| – Gross Longs: | 4,348 | 60,872 | 10,659 |
| – Gross Shorts: | 34,625 | 23,072 | 18,182 |
| – Long to Short Ratio: | 0.1 to 1 | 2.6 to 1 | 0.6 to 1 |
| NET POSITION TREND: | | | |
| – Strength Index Score (3 Year Range Pct): | 39.5 | 61.1 | 46.9 |
| – Strength Index Reading (3 Year Range): | Bearish | Bullish | Bearish |
| NET POSITION MOVEMENT INDEX: | | | |
| – 6-Week Change in Strength Index: | 18.6 | -21.1 | 16.0 |
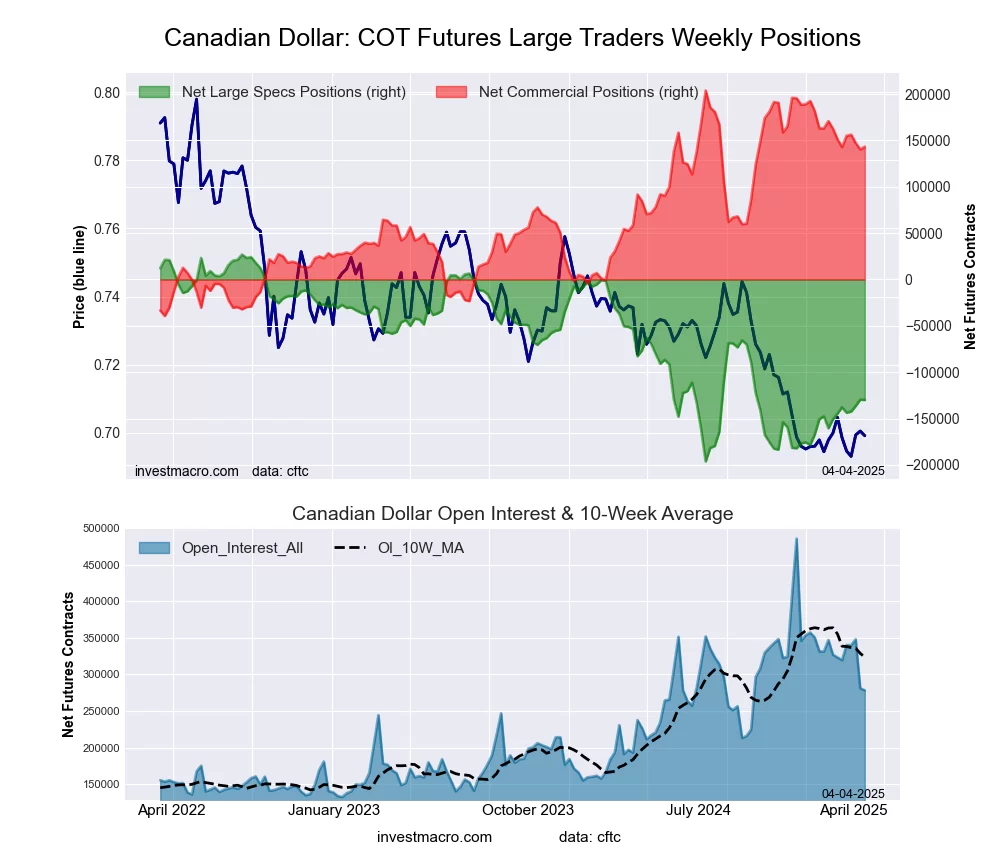
Canadian Dollar Futures:
 The Canadian Dollar large speculator standing this week was a net position of -119,241 contracts in the data reported through Tuesday. This was a weekly lift of 10,775 contracts from the previous week which had a total of -130,016 net contracts.
This week’s current strength score (the trader positioning range over the past three years, measured from 0 to 100) shows the speculators are currently Bearish with a score of 34.5 percent. The commercials are Bullish with a score of 69.4 percent and the small traders (not shown in chart) are Bearish-Extreme with a score of 14.7 percent.
Price Trend-Following Model: Weak Downtrend
Our weekly trend-following model classifies the current market price position as: Weak Downtrend.
| CANADIAN DOLLAR Statistics | SPECULATORS | COMMERCIALS | SMALL TRADERS |
| – Percent of Open Interest Longs: | 6.2 | 84.8 | 7.9 |
| – Percent of Open Interest Shorts: | 52.4 | 34.6 | 11.9 |
| – Net Position: | -119,241 | 129,460 | -10,219 |
| – Gross Longs: | 16,029 | 218,923 | 20,529 |
| – Gross Shorts: | 135,270 | 89,463 | 30,748 |
| – Long to Short Ratio: | 0.1 to 1 | 2.4 to 1 | 0.7 to 1 |
| NET POSITION TREND: | | | |
| – Strength Index Score (3 Year Range Pct): | 34.5 | 69.4 | 14.7 |
| – Strength Index Reading (3 Year Range): | Bearish | Bullish | Bearish-Extreme |
| NET POSITION MOVEMENT INDEX: | | | |
| – 6-Week Change in Strength Index: | 8.4 | -5.5 | -15.2 |
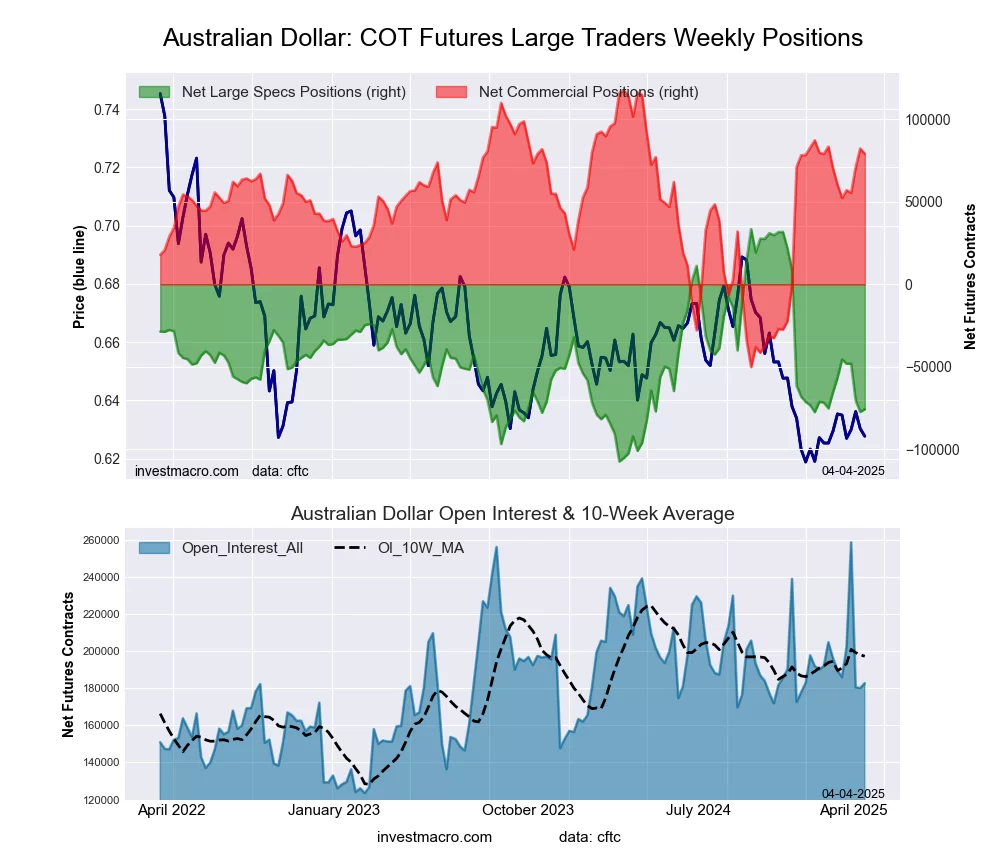
Australian Dollar Futures:
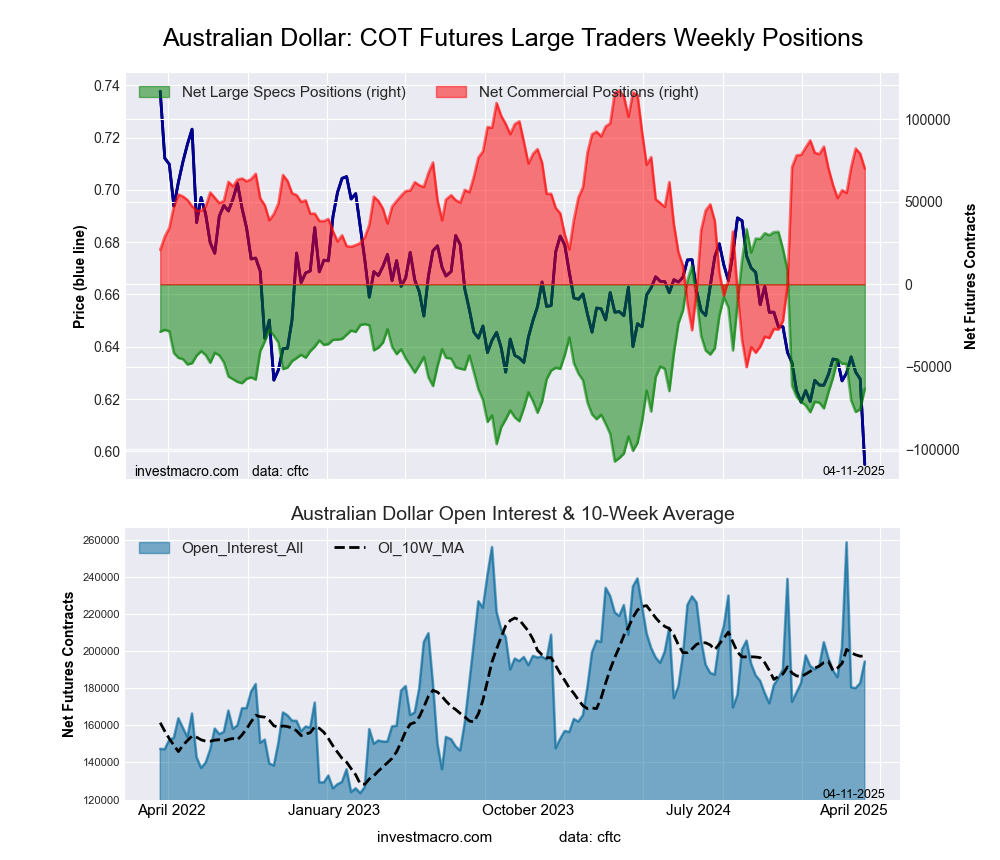 The Australian Dollar large speculator standing this week was a net position of -63,300 contracts in the data reported through Tuesday. This was a weekly gain of 12,563 contracts from the previous week which had a total of -75,863 net contracts.
This week’s current strength score (the trader positioning range over the past three years, measured from 0 to 100) shows the speculators are currently Bearish with a score of 31.4 percent. The commercials are Bullish with a score of 71.8 percent and the small traders (not shown in chart) are Bearish with a score of 30.9 percent.
Price Trend-Following Model: Downtrend
Our weekly trend-following model classifies the current market price position as: Downtrend.
| AUSTRALIAN DOLLAR Statistics | SPECULATORS | COMMERCIALS | SMALL TRADERS |
| – Percent of Open Interest Longs: | 14.7 | 65.6 | 13.0 |
| – Percent of Open Interest Shorts: | 47.2 | 29.5 | 16.6 |
| – Net Position: | -63,300 | 70,205 | -6,905 |
| – Gross Longs: | 28,493 | 127,546 | 25,334 |
| – Gross Shorts: | 91,793 | 57,341 | 32,239 |
| – Long to Short Ratio: | 0.3 to 1 | 2.2 to 1 | 0.8 to 1 |
| NET POSITION TREND: | | | |
| – Strength Index Score (3 Year Range Pct): | 31.4 | 71.8 | 30.9 |
| – Strength Index Reading (3 Year Range): | Bearish | Bullish | Bearish |
| NET POSITION MOVEMENT INDEX: | | | |
| – 6-Week Change in Strength Index: | -12.6 | 10.7 | -0.4 |
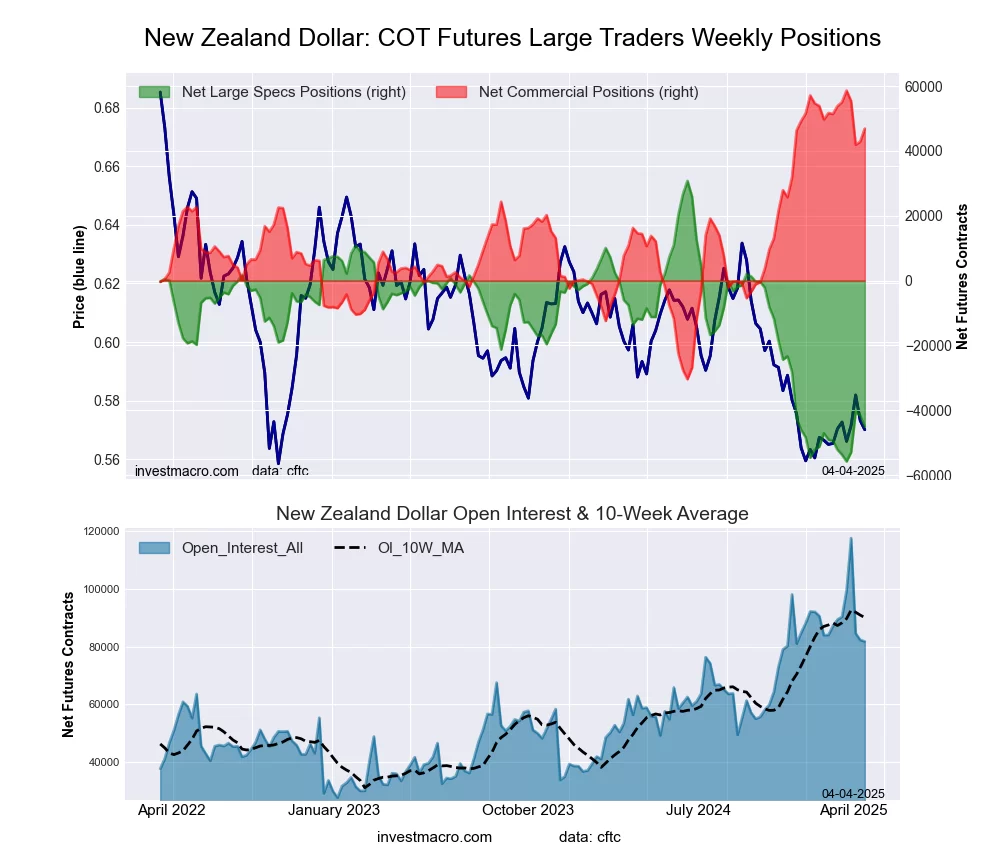
New Zealand Dollar Futures:
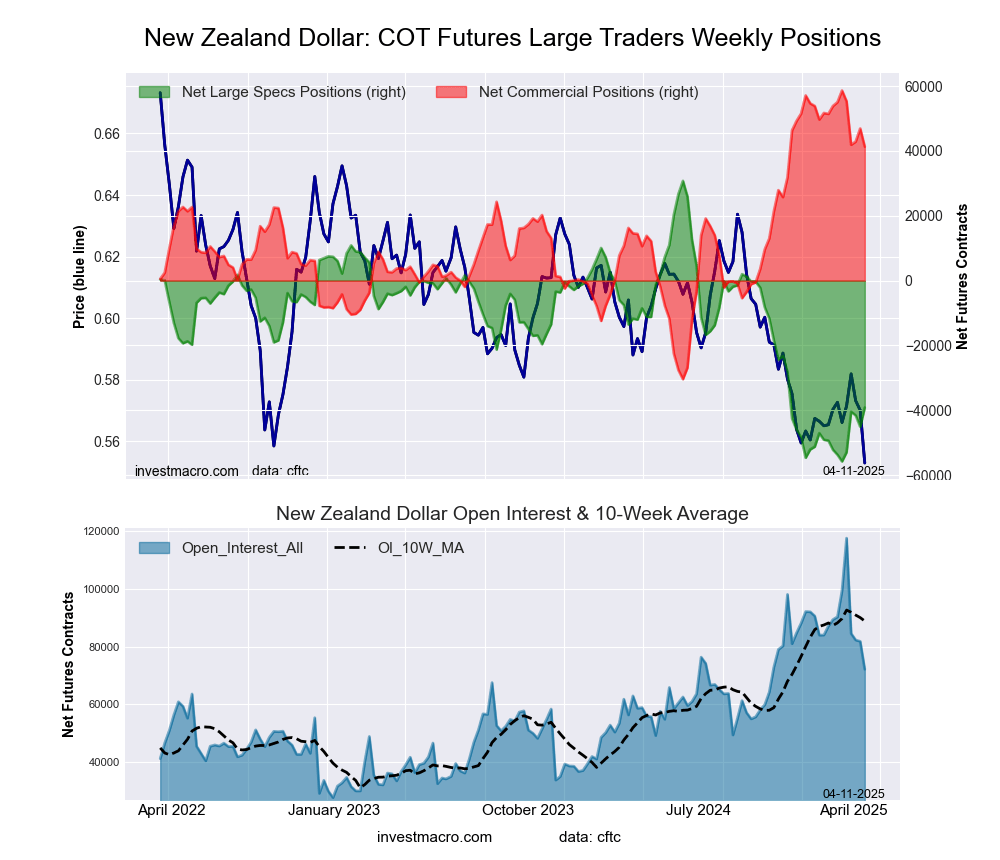 The New Zealand Dollar large speculator standing this week was a net position of -39,152 contracts in the data reported through Tuesday. This was a weekly increase of 5,896 contracts from the previous week which had a total of -45,048 net contracts.
This week’s current strength score (the trader positioning range over the past three years, measured from 0 to 100) shows the speculators are currently Bearish-Extreme with a score of 19.2 percent. The commercials are Bullish-Extreme with a score of 80.5 percent and the small traders (not shown in chart) are Bearish with a score of 26.2 percent.
Price Trend-Following Model: Downtrend
Our weekly trend-following model classifies the current market price position as: Downtrend.
| NEW ZEALAND DOLLAR Statistics | SPECULATORS | COMMERCIALS | SMALL TRADERS |
| – Percent of Open Interest Longs: | 11.0 | 84.6 | 4.1 |
| – Percent of Open Interest Shorts: | 65.3 | 27.4 | 7.1 |
| – Net Position: | -39,152 | 41,292 | -2,140 |
| – Gross Longs: | 7,935 | 61,022 | 2,947 |
| – Gross Shorts: | 47,087 | 19,730 | 5,087 |
| – Long to Short Ratio: | 0.2 to 1 | 3.1 to 1 | 0.6 to 1 |
| NET POSITION TREND: | | | |
| – Strength Index Score (3 Year Range Pct): | 19.2 | 80.5 | 26.2 |
| – Strength Index Reading (3 Year Range): | Bearish-Extreme | Bullish-Extreme | Bearish |
| NET POSITION MOVEMENT INDEX: | | | |
| – 6-Week Change in Strength Index: | 16.8 | -15.5 | -10.2 |
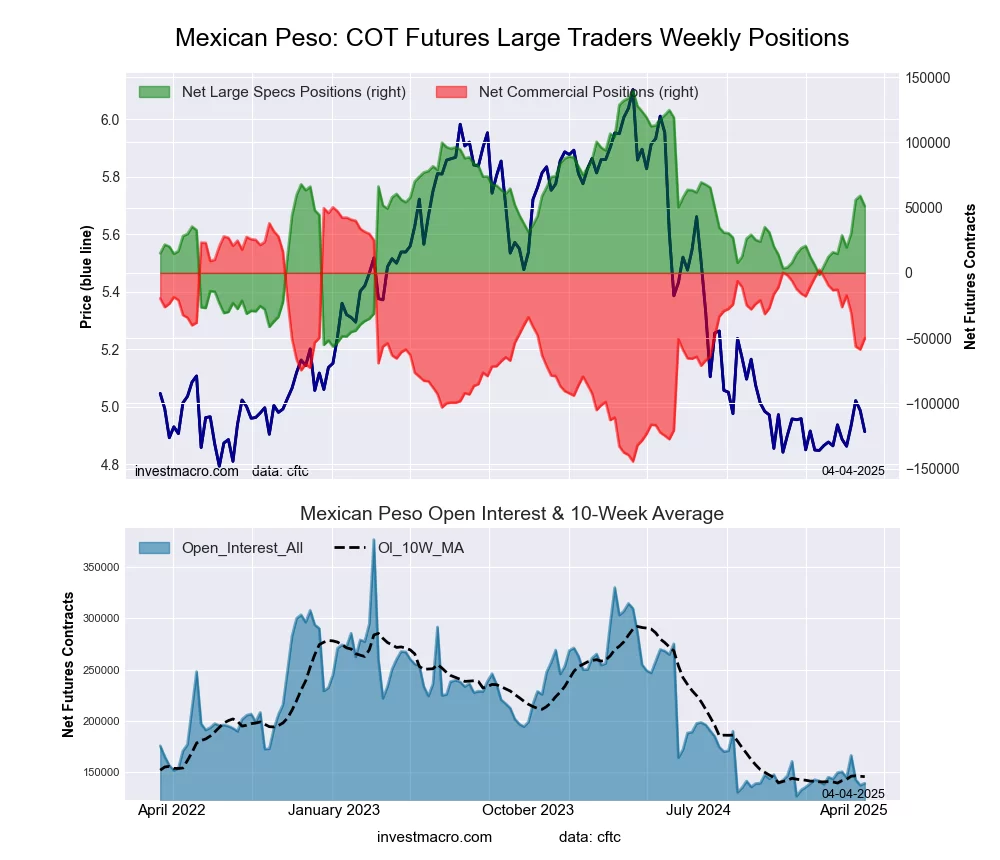
Mexican Peso Futures:
 The Mexican Peso large speculator standing this week was a net position of 39,082 contracts in the data reported through Tuesday. This was a weekly lowering of -11,998 contracts from the previous week which had a total of 51,080 net contracts.
This week’s current strength score (the trader positioning range over the past three years, measured from 0 to 100) shows the speculators are currently Bearish with a score of 48.7 percent. The commercials are Bullish with a score of 55.6 percent and the small traders (not shown in chart) are Bearish-Extreme with a score of 7.1 percent.
Price Trend-Following Model: Downtrend
Our weekly trend-following model classifies the current market price position as: Downtrend.
| MEXICAN PESO Statistics | SPECULATORS | COMMERCIALS | SMALL TRADERS |
| – Percent of Open Interest Longs: | 53.4 | 41.2 | 2.1 |
| – Percent of Open Interest Shorts: | 27.4 | 65.4 | 4.0 |
| – Net Position: | 39,082 | -36,259 | -2,823 |
| – Gross Longs: | 80,167 | 61,831 | 3,195 |
| – Gross Shorts: | 41,085 | 98,090 | 6,018 |
| – Long to Short Ratio: | 2.0 to 1 | 0.6 to 1 | 0.5 to 1 |
| NET POSITION TREND: | | | |
| – Strength Index Score (3 Year Range Pct): | 48.7 | 55.6 | 7.1 |
| – Strength Index Reading (3 Year Range): | Bearish | Bullish | Bearish-Extreme |
| NET POSITION MOVEMENT INDEX: | | | |
| – 6-Week Change in Strength Index: | 5.3 | -5.2 | -1.7 |
Brazilian Real Futures:
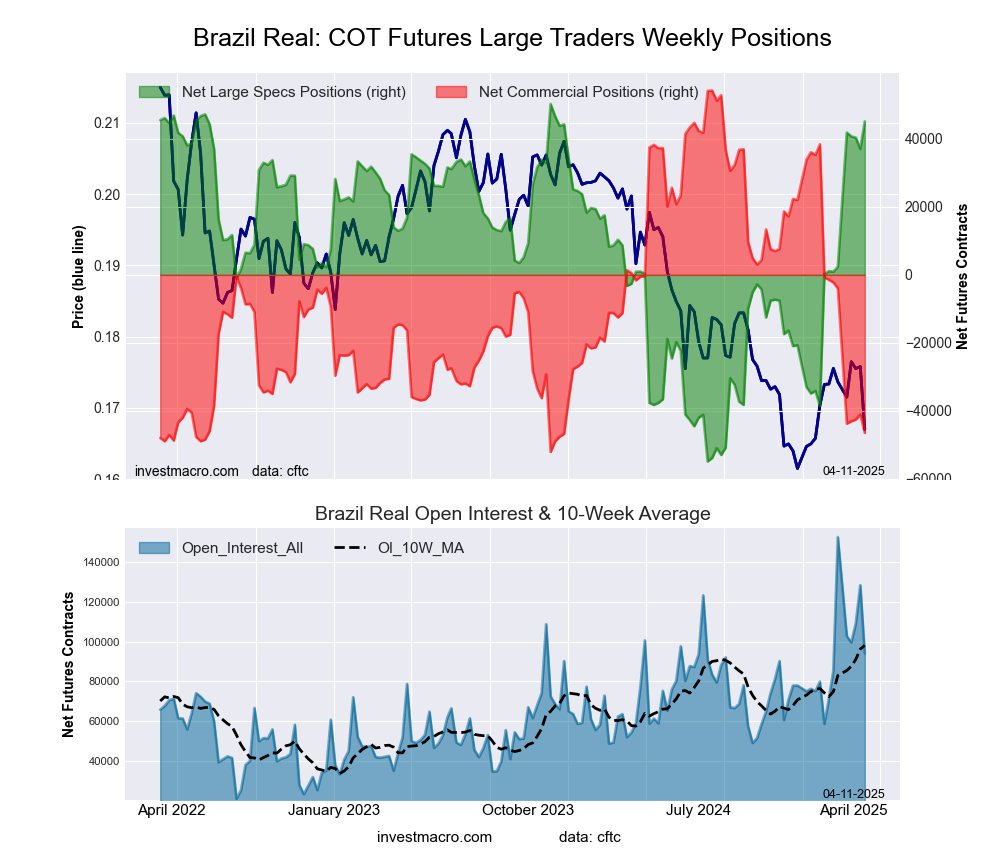 The Brazilian Real large speculator standing this week was a net position of 45,115 contracts in the data reported through Tuesday. This was a weekly boost of 8,080 contracts from the previous week which had a total of 37,035 net contracts.
This week’s current strength score (the trader positioning range over the past three years, measured from 0 to 100) shows the speculators are currently Bullish-Extreme with a score of 95.1 percent. The commercials are Bearish-Extreme with a score of 5.3 percent and the small traders (not shown in chart) are Bearish with a score of 28.5 percent.
Price Trend-Following Model: Weak Uptrend
Our weekly trend-following model classifies the current market price position as: Weak Uptrend.
| BRAZIL REAL Statistics | SPECULATORS | COMMERCIALS | SMALL TRADERS |
| – Percent of Open Interest Longs: | 71.4 | 24.4 | 3.8 |
| – Percent of Open Interest Shorts: | 23.4 | 73.9 | 2.4 |
| – Net Position: | 45,115 | -46,473 | 1,358 |
| – Gross Longs: | 67,079 | 22,960 | 3,599 |
| – Gross Shorts: | 21,964 | 69,433 | 2,241 |
| – Long to Short Ratio: | 3.1 to 1 | 0.3 to 1 | 1.6 to 1 |
| NET POSITION TREND: | | | |
| – Strength Index Score (3 Year Range Pct): | 95.1 | 5.3 | 28.5 |
| – Strength Index Reading (3 Year Range): | Bullish-Extreme | Bearish-Extreme | Bearish |
| NET POSITION MOVEMENT INDEX: | | | |
| – 6-Week Change in Strength Index: | 40.7 | -40.0 | -1.3 |
Bitcoin Futures:
 The Bitcoin large speculator standing this week was a net position of 1,332 contracts in the data reported through Tuesday. This was a weekly gain of 841 contracts from the previous week which had a total of 491 net contracts.
This week’s current strength score (the trader positioning range over the past three years, measured from 0 to 100) shows the speculators are currently Bullish-Extreme with a score of 80.4 percent. The commercials are Bearish with a score of 41.1 percent and the small traders (not shown in chart) are Bearish-Extreme with a score of 0.0 percent.
Price Trend-Following Model: Strong Downtrend
Our weekly trend-following model classifies the current market price position as: Strong Downtrend.
| BITCOIN Statistics | SPECULATORS | COMMERCIALS | SMALL TRADERS |
| – Percent of Open Interest Longs: | 83.2 | 2.2 | 3.7 |
| – Percent of Open Interest Shorts: | 78.2 | 5.5 | 5.3 |
| – Net Position: | 1,332 | -897 | -435 |
| – Gross Longs: | 22,388 | 591 | 985 |
| – Gross Shorts: | 21,056 | 1,488 | 1,420 |
| – Long to Short Ratio: | 1.1 to 1 | 0.4 to 1 | 0.7 to 1 |
| NET POSITION TREND: | | | |
| – Strength Index Score (3 Year Range Pct): | 80.4 | 41.1 | 0.0 |
| – Strength Index Reading (3 Year Range): | Bullish-Extreme | Bearish | Bearish-Extreme |
| NET POSITION MOVEMENT INDEX: | | | |
| – 6-Week Change in Strength Index: | 24.6 | -15.9 | -29.9 |
Article By InvestMacro – Receive our weekly COT Newsletter
*COT Report: The COT data, released weekly to the public each Friday, is updated through the most recent Tuesday (data is 3 days old) and shows a quick view of how large speculators or non-commercials (for-profit traders) were positioned in the futures markets.
The CFTC categorizes trader positions according to commercial hedgers (traders who use futures contracts for hedging as part of the business), non-commercials (large traders who speculate to realize trading profits) and nonreportable traders (usually small traders/speculators) as well as their open interest (contracts open in the market at time of reporting). See CFTC criteria here.