Archive for Forex and Currency News – Page 210

Fibonacci Retracements Analysis 15.10.2021 (AUDUSD, USDCAD)

Article By RoboForex.com

AUDUSD, “Australian Dollar vs US Dollar”

As we can see in the H4 chart, convergence on MACD made the pair start a new rising wave, which is quite stable, to extend the correctional range. The closest target is 50.0% fibo at 0.7499, the next one – 61.8% fibo at 0.7591. The support remains at the low at 0.7106.

AUDUSD_H4
Risk Warning: the result of previous trading operations do not guarantee the same results in the future

The H1 chart of AUDUSD shows that the current growth is testing 76.0% fibo and may later continue to reach the high at 0.7478. After breaking the high, UADUSD may continue growing towards the post-correctional extension area between 138.2% and 161.8% fibo at 0.7596 and 0.7668 respectively. The local support is the low at 0.7170.

AUDUSD_H1
Risk Warning: the result of previous trading operations do not guarantee the same results in the future

USDCAD, “US Dollar vs Canadian Dollar”

As we can see in the H4 chart, USDCAD has already reached 61.8% fibo and may later continue falling towards 76.0% fibo at 1.2233. After that, the asset may rebound from the latter level and forming a long-term ascending wave to reach the high at 1.2949, a breakout of which may result in a further uptrend towards 38.2% fibo at 1.3022.

USDCAD_H4
Risk Warning: the result of previous trading operations do not guarantee the same results in the future

The H1 chart shows a more detailed structure of the current descending tendency towards 76.0% fibo at 1.2233. At the same time, there is convergence on MACD, which may indicate a possible rebound to the upside.

USDCAD_H1

Article By RoboForex.com

Attention!
Forecasts presented in this section only reflect the author’s private opinion and should not be considered as guidance for trading. RoboForex LP bears no responsibility for trading results based on trading recommendations described in these analytical reviews.

Japanese Candlesticks Analysis 15.10.2021 (USDCAD, AUDUSD, USDCHF)

Article By RoboForex.com

USDCAD, “US Dollar vs Canadian Dollar”

As we can see in the H4 chart, after forming several reversal patterns, including Hammer, close to the support level, USDCAD may reverse in the form of a new correctional impulse. In this case, the correctional target may be the resistance area at 1.2445. However, an alternative scenario implies that the asset may continue falling to reach 1.2300 without reversing and correcting.

USDCAD
Risk Warning: the result of previous trading operations do not guarantee the same results in the future

AUDUSD, “Australian Dollar vs US Dollar”

As we can see in the H4 chart, AUDUSD has formed several reversal patterns, such as Shooting Star, while testing the resistance level. At the moment, the asset may reverse and start a new pullback. In this case, the correctional target may be at 0.7373. At the same time, an opposite scenario implies that the price may continue growing towards 0.7465 without any corrections.

AUDUSD
Risk Warning: the result of previous trading operations do not guarantee the same results in the future

USDCHF

As we can see in the H4 chart, after testing the rising channel’s downside border, the pair has formed several reversal patterns, for example, Hammer. At the moment, USDCHF is reversing and may later start a new growth towards the resistance level. In this case, the upside target may be at 0.9284. Still, there might be an alternative scenario, according to which the asset may return to 0.9200 first and then resume its ascending tendency.

USDCHF

Article By RoboForex.com

Attention!
Forecasts presented in this section only reflect the author’s private opinion and should not be considered as guidance for trading. RoboForex LP bears no responsibility for trading results based on trading recommendations described in these analytical reviews.

The Analytical Overview of the Main Currency Pairs on 2021.10.15

by JustForex

The EUR/USD currency pair

Technical indicators of the currency pair:
  • Prev Open: 1.1587
  • Prev Close: 1.1597
  • % chg. over the last day: +0.08%

German economic institutions believe the German economy will reach normal industrial capacity by 2022. The German economy is expected to grow for 2.4% in 2021 and for 4.8% in 2022. ECB spokesman Ren claims that the Eurozone’s economic recovery is getting stronger and more resilient, but the ECB will maintain stimulus for some time.

Trading recommendations
  • Support levels: 1.1548, 1.1502, 1.1453
  • Resistance levels: 1.1615, 1.1671, 1.1717, 1.1772, 1.1802, 1.1835

From the technical point of view, the EUR/USD trend is bearish. The MACD indicator has become positive. Under such market conditions, it is better to look for Sell deals from the priority change level, however it should be noted that the pressure of buyers is increasing. Buy trades should be considered only from the support levels or from the buyers’ initiative areas.

Alternative scenario: if the price breaks out through the 1.1615 resistance level and fixes above, the mid-term uptrend will more likely resume.

EUR/USD
News feed for 2021.10.15:
  • – US Retail Sales (m/m) at 15:30 (GMT+3);
  • – US Empire State Manufacturing Index (m/m) at 15:30 (GMT+3);
  • – US Michigan Consumer Sentiment (m/m) at 17:00 (GMT+3);
  • – US FOMC Member Williams Speech at 19:20 (GMT+3).

The GBP/USD currency pair

Technical indicators of the currency pair:
  • Prev Open: 1.3656
  • Prev Close: 1.3674
  • % chg. over the last day: +0.13%

Bank of England spokeswoman Mann said yesterday that the supply chain may last longer, but the Bank of England expects the demand to shift toward the services. The UK financial markets expect the QE program to be reduced at the end of December.

Trading recommendations
  • Support levels: 1.3671, 1.3617, 1.3584, 1.3532, 1.3457, 1.3360, 1.3282
  • Resistance levels: 1.3759, 1.3812, 1.3886

On the hourly time frame, the GBP/USD trend has changed to bullish. The British currency is strengthening due to the direct correlation with oil prices. The MACD indicator has become inactive. Buy trades should be considered only within the day and only from the initiative zone of the buyers. It is better to look for sell deals from the resistance levels, but after an additional confirmation in the form of a sellers’ initiative, as the buyers’ pressure is higher right now.

Alternative scenario: if the price breaks down through the 1.3532 support level and consolidates below, the bullish scenario is more likely to be broken.

GBP/USD
There is no news feed for today.

The USD/JPY currency pair

Technical indicators of the currency pair:
  • Prev Open: 113.24
  • Prev Close: 113.67
  • % chg. over the last day: +0.38%

Bank of Japan spokesman Noguchi claimed that monetary policy easing is not an option for Japan at least until the end of the year. The Japanese Yen will correlate with the US Dollar at most now.

Trading recommendations
  • Support levels: 113.66, 113.25, 112.19, 111.53, 110.99, 110.65, 109.95, 109.63
  • Resistance levels: 114.40

The main trend of the USD/JPY currency pair is bullish. The Japanese yen is rapidly declining against the US dollar. The MACD indicator is in the positive zone, but on higher time frames there is a divergence, which means that growth is limited and the correction should be expected to take place in the nearest future. Under such market conditions, it’s better to look for buy positions from the support levels near the moving average, since the price has deviated greatly from the average line. Sell positions should be considered only throughout the day from the resistance levels, given that there is sellers’ initiative.

Alternative scenario: if the price falls below 112.19, the uptrend is more likely to be broken.

USD/JPY
There is no news feed for today.

The USD/CAD currency pair

Technical indicators of the currency pair:
  • Prev Open: 1.2440
  • Prev Close: 1.2368
  • % chg. over the last day: -0.58%

The Canadian dollar is a commodity currency, so the USD/CAD currency pair is highly dependent on the dynamics of the dollar index and oil prices. The dollar index continues to decline, while oil prices slowly grow. As a result, the USD/CAD currency pair is declining due to US currency weakening.

Trading recommendations
  • Support levels: 1.2312
  • Resistance levels: 1.2425 1.2518, 1.2565, 1.2628, 1.2729, 1.2774

From the technical point of view, the trend of the USD/CAD currency pair is bearish. The narrowing triangle pattern turned out to be bearish. The MACD indicator has become negative, but there are still signs of divergence on higher time frames. Under such market conditions, it is better to look for sell deals from the resistance levels near the triangle pattern. Buy trades should be considered only on lower time frames from the support levels if there is the buyer’s initiative.

Alternative scenario: if the price breaks out through the 1.2565 resistance level and fixes above, the uptrend will more likely to resume.

USD/CAD
There is no news feed for today.

by JustForex


This article reflects a personal opinion and should not be interpreted as an investment advice, and/or offer, and/or a persistent request for carrying out financial transactions, and/or a guarantee, and/or a forecast of future events.

Strong corporate reports support growth of US and European indices

by JustForex

The US stock market closed yesterday in the green zone. Almost all sectors of the economy showed growth yesterday, but the biggest gains were in the health care, technology and industrial sectors. At the close of the NYSE, the Dow Jones index increased by 1.56%, hitting a one-month high; S&P 500 increased by 1.71% and NASDAQ added 1.73%.

Fed spokesman Bullard said yesterday that the Fed should strive to reduce the QE program as soon as possible, as high inflation is a cause for concern.

According to Michael Schumacher of Wells Fargo Securities, inflation caused by the supply chain crisis will push bond yields higher over the next few weeks. Schumacher also sees the expectation that the Federal Reserve will respond to yields increase. He notes that several central banks, including Norway and New Zealand, have already adjusted their rates. The Fed is likely to cut purchases and announce it next month.

Amazon is buying refurbished cargo versions of 10 Airbus A330-300 planes, as well as an unspecified number of 777-300ERs. The purchase of the long-range cargo planes will allow Amazon to ship goods directly from China to the US and help avoid shipping delays.

Boeing is dealing with a new defect of its 787 Dreamliner that has caused delayed aircraft deliveries and drawn increased attention from the US government.

Chip maker TSMC announces the opening of a chip manufacturing plant in Japan. TSMC is already building its most advanced chip plant in Arizona and is considering the possibility of opening a plant in Germany.

European stock indices were also on the rise yesterday. German DAX increased by 1.4%, French CAC 40 added 1.3%, Italian FTSE MIB increased by 1.2%. The British FTSE 100 and the Spanish IBEX 35 added 0.7% and 0.8%, respectively.

British railroad operator Freightliner claimed that they are returning to diesel-powered trains as the electricity costs had become too high. Germany’s economic recovery after the lifting of coronavirus restrictions has been hampered by disruptions in the supply of certain industrial goods. The country’s leading economic institutions have adjusted their forecasts downward.

The G7 finance ministers have agreed to cooperate in solving global supply chain problems. Europe is starting to use up its gas reserves from underground storage facilities. The state of gas reserves in Europe’s storage facilities and the inability to fill them to a safe level by the onset of the cold weather due to the global shortages is the main fear that pushes the gas prices up.

The US oil inventories increased by 6.1 million barrels within the week. The IEA raised its oil demand forecasts for 2021 and 2022 by 170,000 bpd and 210,000 bpd, respectively. Goldman Sachs, head of energy research, claims that oil prices could remain at a higher level in coming years as demand recovers while supply remains limited.

Natural gas inventories in the US increased by 81 billion cubic meters against an expected 94 billion cubic meters. The price of gas in Europe has risen again above $1200 per thousand cubic meters. The UAE Energy Minister Mazroui said yesterday that the The UAE will produce more natural gas with the possibility of its export.

The deadly typhoon Compassu was hitting Hong Kong and southern China. But Asian stock indices have risen on Friday, fueled by a rally on Wall Street driven by strong corporate earnings and the fact that China eased restrictions on mortgages at some of its biggest banks. Japan’s Nikkei added 1.67%, China’s CSI 300 increased by 0.35%, South Korea’s Kospi added 0.92% and Australia’s ASX 200 added 0.69%.

China’s economy is now experiencing a downfall in many sectors: real estate, the energy crisis, weak consumer sentiment and rising commodity prices.

Main market quotes:

S&P 500 (F) 4,438.26 +74.46 (+1.71%)

Dow Jones 34,912.56 +534.75 (+1.56%)

DAX 15,462.72 +213.34 (+1.40%)

FTSE 100 7,207.71 +65.89 (+0.92%)

USD Index 93.97 −0.06 (−0.06%)

Important events for today:
  • – US Retail Sales (m/m) at 15:30 (GMT+3);
  • – US Empire State Manufacturing Index (m/m) at 15:30 (GMT+3);
  • – US Michigan Consumer Sentiment (m/m) at 17:00 (GMT+3);
  • – US FOMC Member Williams Speech at 19:20 (GMT+3).

by JustForex


This article reflects a personal opinion and should not be interpreted as an investment advice, and/or offer, and/or a persistent request for carrying out financial transactions, and/or a guarantee, and/or a forecast of future events.

Intraday Market Analysis – WTI Rally Gains Traction

By Orbex

USOIL consolidates gains

USOIL

Oil prices jumped after the IEA raised its global oil demand growth forecast. WTI crude continues to grind its way up after it reached a seven-year high.

The RSI has returned to the neutrality area and a short-lived retracement met strong buying interest above 78.70. The bulls may raise volatility once again if they succeed in pushing back above the psychological tag of 82.00.

A newly overbought RSI may temporarily restrain the momentum. On the downside, a breakout could trigger a correction to 75.50.

XAGUSD rises towards key resistance

XAGUSD

Silver advanced higher as the US dollar index licks wounds after a heavy decline.

The precious metal broke above the supply zone around the 30-day moving average (23.10). This is a sign of a bullish U-turn with 23.95 from the daily timeframe as the next target.

As the RSI flirts with the overbought territory, we can expect strong selling pressure at that level of interest. 22.90 is the immediate support in case of retracement. Further down, 22.20 is the bulls’ second line of defense.

US 100 attempts a bullish reversal

US100

The Nasdaq 100 rose as investors anticipate strong profit growth in the third quarter.

The break above 14930 has prompted sellers to cover their positions, alleviating the bearish pressure in the process. The tech index has then secured support around 14600.

A bullish close above the psychological level of 15000 would bring some much-needed confidence to the long side. Then the daily resistance at 15415 would be in the crosshair. Meanwhile, the RSI’s overbought situation may cause a limited pullback to 14900.


Orbex-LogoArticle by Orbex

Orbex is a fully licensed broker that was established in 2011. Founded with a mission to serve its traders responsibly and provides traders with access to the world’s largest and most liquid financial markets. www.orbex.com

Chris Sits Down With Jim Goddard To Cover The Recent Moves Of Gold, Silver, US Dollar, Canadian Dollar.

By TheTechnicalTraders

Chris joins Jim Goddard on Howestreet.com to discuss the latest moves of precious metals. This year, the US dollar has put in a major double bottom pattern and in the last three weeks has been threatening to break out above 95. If that happens, we are probably going to see a pretty big shift in commodity pricing, mostly precious metals.

Metals are hanging on by a thread, trading at resistance, and in a downtrend. If the dollar pops and rallies, don’t be surprised if the gold and silver go into a multi-week correction.

CLICK ON THE IMAGE BELOW TO LISTEN TO THE INTERVIEW

GET YOUR DAILY DOSE OF CHRIS’ PRECIOUS METALS ANALYSIS ALONG WITH THE HOTTEST ETFS TO TRADE WITH BAN TRADER PRO now part of the total etf portfolio!

TheTechnicalTraders.com

EU Trade And The Weaker Euro

By Orbex

The euro has been tracking lower for several months now. And there are several analysts who think that trend will continue.

Most recently, JPMorgan suggested that the EURUSD could drop as far as the 1.1000 handle. In fact, there are some good macroeconomic reasons for this projection. But, there are also some assumptions that might not pan out.

One of the things to note on the trade front is that the EU appears to largely have escaped the shipping problem that has plagued the other two major world economies of China and the US.

Hundreds of container and bulk ships are piled up offshore by the US and China waiting to unload cargo. This has been one of the important drivers of price increases, and an indication that inflation will set in for the long haul.

The trade balance and the future of shopping

The European Union’s trade balance has remained fairly steady even throughout the pandemic. That’s not to say that there haven’t been supply difficulties and potential logistics issues.

Nonetheless, the EU might be one of the beneficiaries of Brexit policies that have plunged the island nation into supply chaos. Truck drivers who would have gone to work in Britain are now staying in the EU and are helping keep goods flowing.

Even so, industry analysts suggest that as many as 400,000 truckers are essential to meet growing demand.

The prospect of self-driving rigs could be a savior for a market sector struggling to get employees. However, the fact that this work will likely phase out in the near future might be a disincentive for people seeking out driving as a career. That’s also given the relatively low wages of the profession.

This has led a few analysts to suggest that Europe isn’t far away from reaching the same situation as in Britain, as prices rise across the continent.

What to look out for
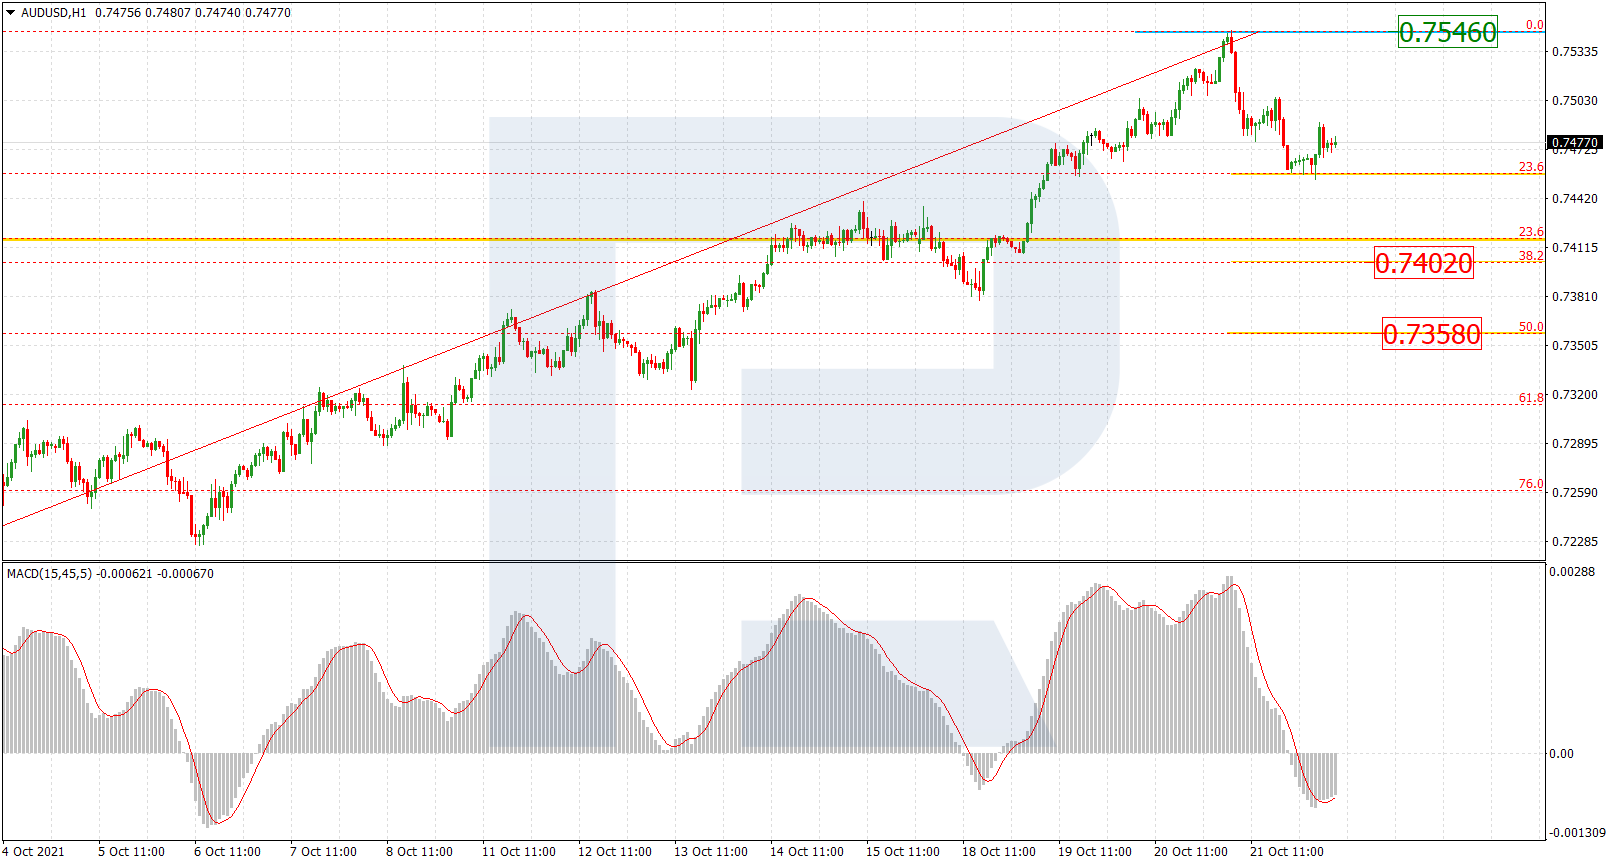
Economists project the EU’s trade balance to come in at €16.1B, down from €20.7B in the prior month. That’s well within the normal fluctuations between around €10B to €30B. And even if it were to miss by a few billion on either side, it likely won’t affect the markets immediately.

Europe has relatively more ports than the other two major economies. This means that unloading cargo at the ports hasn’t been as much of a challenge.

The expectation is that better supply chain connections across the continent will mitigate some of the inflation pressures that will continue to affect other major trade partners. Naturally, there might be some indirect impact, as ships that would pick up cargo for Europe are waiting in foreign ports.

Keeping the euro under pressure

As other central banks must take action to curb rising inflation, the ECB has a relatively easy situation to keep easing going. Additionally, a slower recovery across the EU causes less price pressure.

Of all the major central banks, the ECB could be the last to raise rates. The overall consensus is expecting the possibility of a rate hike near the end of 2023.

Therefore, the euro could remain under pressure for a while, especially with lower inflation and a higher divergence in bond yields.


Orbex-LogoArticle by Orbex

Orbex is a fully licensed broker that was established in 2011. Founded with a mission to serve its traders responsibly and provides traders with access to the world’s largest and most liquid financial markets. www.orbex.com

Ichimoku Cloud Analysis 14.10.2021 (EURUSD, AUDUSD, USDCHF)

Article By RoboForex.com

EURUSD, “Euro vs US Dollar”

EURUSD is trading at 1.1598; the instrument is moving inside Ichimoku Cloud, thus indicating a sideways tendency. The markets could indicate that the price may test the cloud’s downside border at 1.1560 and then resume moving upwards to reach 1.1725. Another signal in favour of a further uptrend will be a rebound from the descending channel’s upside border. However, the bullish scenario may no longer be valid if the price breaks the cloud’s downside border and fixes below 1.1520. In this case, the pair may continue falling towards 1.1430. To confirm further growth, the asset must break the cloud’s upside border and fix above 1.1645.

EURUSD
Risk Warning: the result of previous trading operations do not guarantee the same results in the future

AUDUSD, “Australian Dollar vs US Dollar”

AUDUSD is trading at 0.7393; the instrument is moving above Ichimoku Cloud, thus indicating an ascending tendency. The markets could indicate that the price may test Tenkan-Sen and Kijun-Sen at 0.7335 and then resume moving upwards to reach 0.7525. Another signal in favour of a further uptrend will be a rebound from the rising channel’s downside border. However, the bullish scenario may no longer be valid if the price breaks the cloud’s downside border and fixes below 0.7210. In this case, the pair may continue falling towards 0.7120.

AUDUSD
Risk Warning: the result of previous trading operations do not guarantee the same results in the future

USDCHF, “US Dollar vs Swiss Franc”

USDCHF is trading at 0.9215; the instrument is moving below Ichimoku Cloud, thus indicating a descending tendency. The markets could indicate that the price may test Tenkan-Sen and Kijun-Sen at 0.9240 and then resume moving downwards to reach 0.9105. Another signal in favour of a further downtrend will be a rebound from the “neckline” of a Head & Shoulders reversal pattern. However, the bearish scenario may no longer be valid if the price breaks the cloud’s upside border and fixes above 0.9315. In this case, the pair may continue growing towards 0.9405.

USDCHF

Article By RoboForex.com

Attention!
Forecasts presented in this section only reflect the author’s private opinion and should not be considered as guidance for trading. RoboForex LP bears no responsibility for trading results based on trading recommendations described in these analytical reviews.

Intraday Market Analysis – USD Seeks Support

By Orbex

USDCHF tests short-term support

USDCHF

The US dollar eased after the FOMC minutes failed to pinpoint the first rate hike next year. The drop below 0.9280 was a sign of profit-taking after the RSI showed that the rally had overextended.

The pair has then found support along the 20-day moving average (0.9220). This is a major level for the bulls to keep the uptrend intact after a short-lived bounce revealed weakness.

A bearish breakout would send the pair to 0.9150. A rebound could propel the pair to 0.9400 if it succeeds in absorbing offers around 0.9330.

AUDUSD tests key resistance

AUDUSD

The Australian dollar rallied after the unemployment rate fell to 4.6% in September. The pair has met stiff selling pressure near 0.7480, a supply zone from the sell-off in early September.

The RSI’s double top in the overbought area and its bearish divergence are signs of exhaustion. This has led cautious buyers’ to take some chips off the table with a drop below 0.7335.

0.7290 would be the support to monitor in case of a pullback. On the upside, a greater high would pave the way for September’s peak at 0.7460.

EURGBP hovers above major support

EURGBP

The pound inched higher after Britain’s GDP returned to positive territory in August. The euro, on the other hand, has fallen victim to the selling pressure after it broke below 0.8530.

Price action is heading to 0.8450, a daily support from the August rally. To the bulls’ relief, the RSI’s divergence shows a slowdown in the bearish impetus.

They will need to lift 0.8520 before they could attempt a reversal. Failing that, a breakout below the said floor would trigger an extended sell-off towards 0.8360.


Orbex-LogoArticle by Orbex

Orbex is a fully licensed broker that was established in 2011. Founded with a mission to serve its traders responsibly and provides traders with access to the world’s largest and most liquid financial markets. www.orbex.com

Japanese Candlesticks Analysis 14.10.2021 (XAUUSD, NZDUSD, GBPUSD)

Article By RoboForex.com

XAUUSD, “Gold vs US Dollar”

As we can see in the H4 chart, the asset continues trading upwards. After forming several reversal patterns, such as Shooting Star, not far from the resistance level, XAUUSD is reversing and may form a new correctional impulse. In this case, the downside target may be the support area at 1777.00. At the same time, an opposite scenario implies that the price may continue growing towards 1810.00 without any corrections.

XAUUSD
Risk Warning: the result of previous trading operations do not guarantee the same results in the future

NZDUSD, “New Zealand vs US Dollar”

As we can see in the H4 chart, NZDUSD has formed several reversal patterns, such as Engulfing, close to the support level. At the moment, the asset is reversing in the form of a new growth. In this case, the upside target may be the resistance area at 0.7030. After that, the asset may break it and continue moving upwards. However, an alternative scenario implies that the price may correct to reach 0.6910 before resuming its ascending tendency.

NZDUSD
Risk Warning: the result of previous trading operations do not guarantee the same results in the future

GBPUSD, “Great Britain Pound vs US Dollar”

As we can see in the H4 chart, after breaking the channel’s upside border, the asset continues growing. By now, GBPUSD has formed several reversal patterns, such as Hammer, not far from the support area. At the moment, the pair is reversing in the form of another growth. In this case, the upside target may be at 1.3750. After testing the resistance level, the market may break it and continue growing. Still, there might be an alternative scenario, according to which the asset may correct towards 1.3600 before resuming the uptrend to reach the resistance level.

GBPUSD

Article By RoboForex.com

Attention!
Forecasts presented in this section only reflect the author’s private opinion and should not be considered as guidance for trading. RoboForex LP bears no responsibility for trading results based on trading recommendations described in these analytical reviews.