By InvestMacro.com COT Home | Data Tables | Data Downloads | Newsletter
Here are the latest charts and statistics for the Commitment of Traders (COT) data published by the Commodities Futures Trading Commission (CFTC).
The latest COT data is updated through Tuesday October 19th 2021 and shows a quick view of how large traders (for-profit speculators and commercial entities) were positioned in the futures markets. All currency positions are in direct relation to the US dollar where, for example, a bet for the euro is a bet that the euro will rise versus the dollar while a bet against the euro will be a bet that the euro will decline versus the dollar.
Highlighting this week’s COT Currency data is once again the speculator’s US Dollar Index bullish bets which have gained for nine consecutive weeks. Dollar Index speculative bullish positions have now risen for seventeen out of the past eighteen weeks to hit the highest level in the past one-hundred and five weeks, dating back to October 15th of 2019. The speculator strength index score (current levels compared to past three years) rose again this week and shows that spec sentiment is now in an extreme bullish position (88 percent score) for the third week in a row.
| Oct-19-2021 | OI | OI-Index | Spec-Net | Spec-Index | Com-Net | COM-Index | Smalls-Net | Smalls-Index |
|---|
| USD Index | 60,731 | 91 | 35,934 | 88 | -42,728 | 4 | 6,794 | 91 |
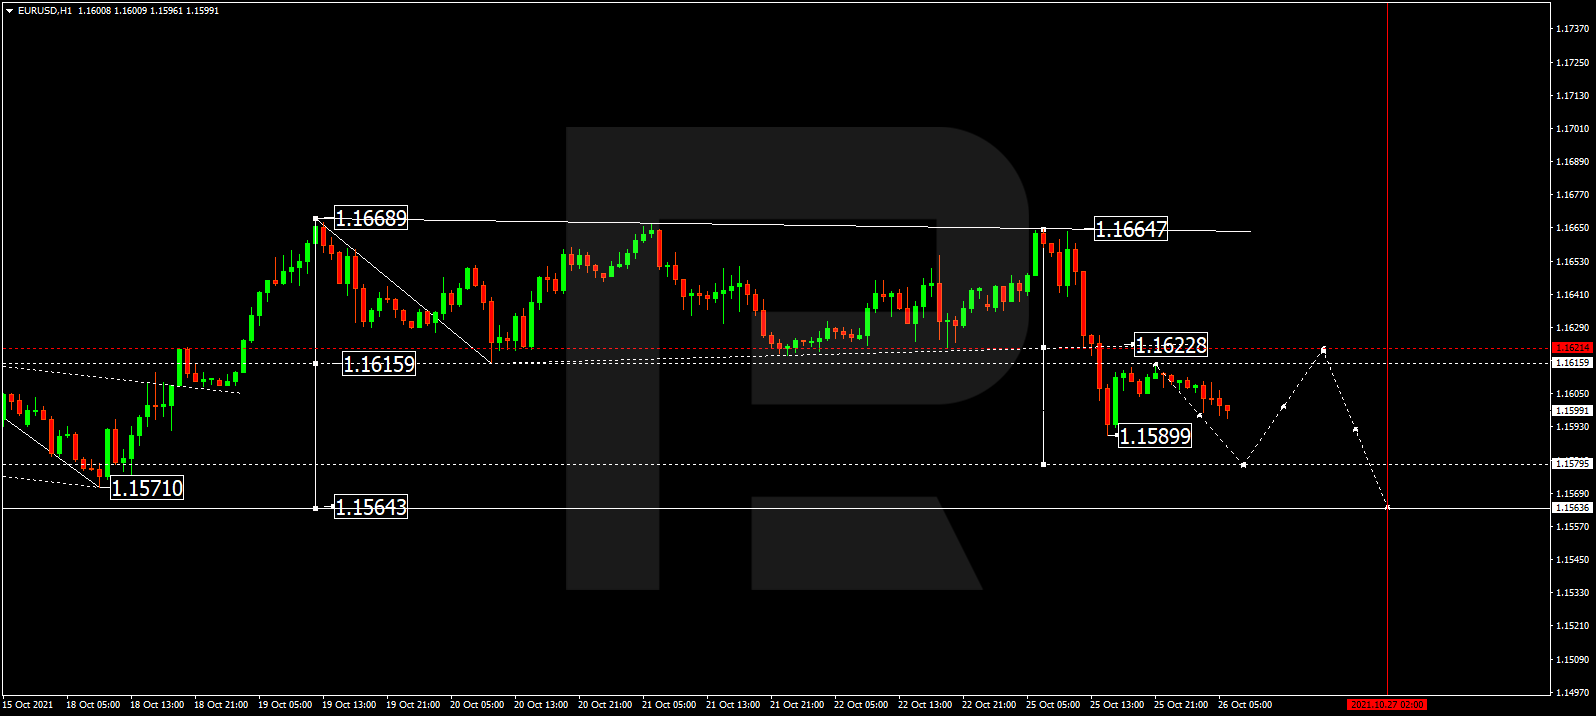
| EUR | 679,418 | 75 | -12,107 | 31 | -17,573 | 71 | 29,680 | 27 |
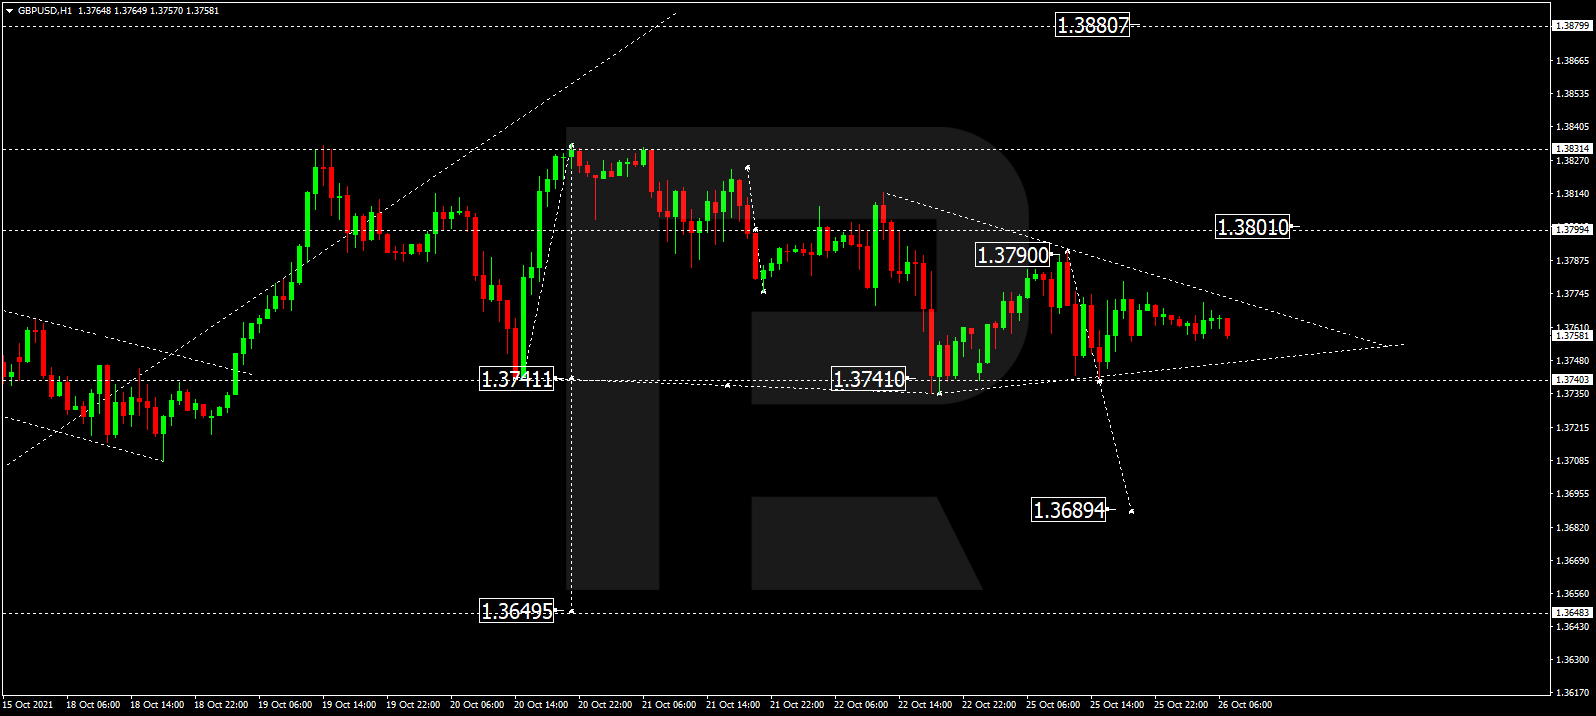
| GBP | 158,961 | 13 | 1,615 | 75 | -2,381 | 28 | 766 | 57 |
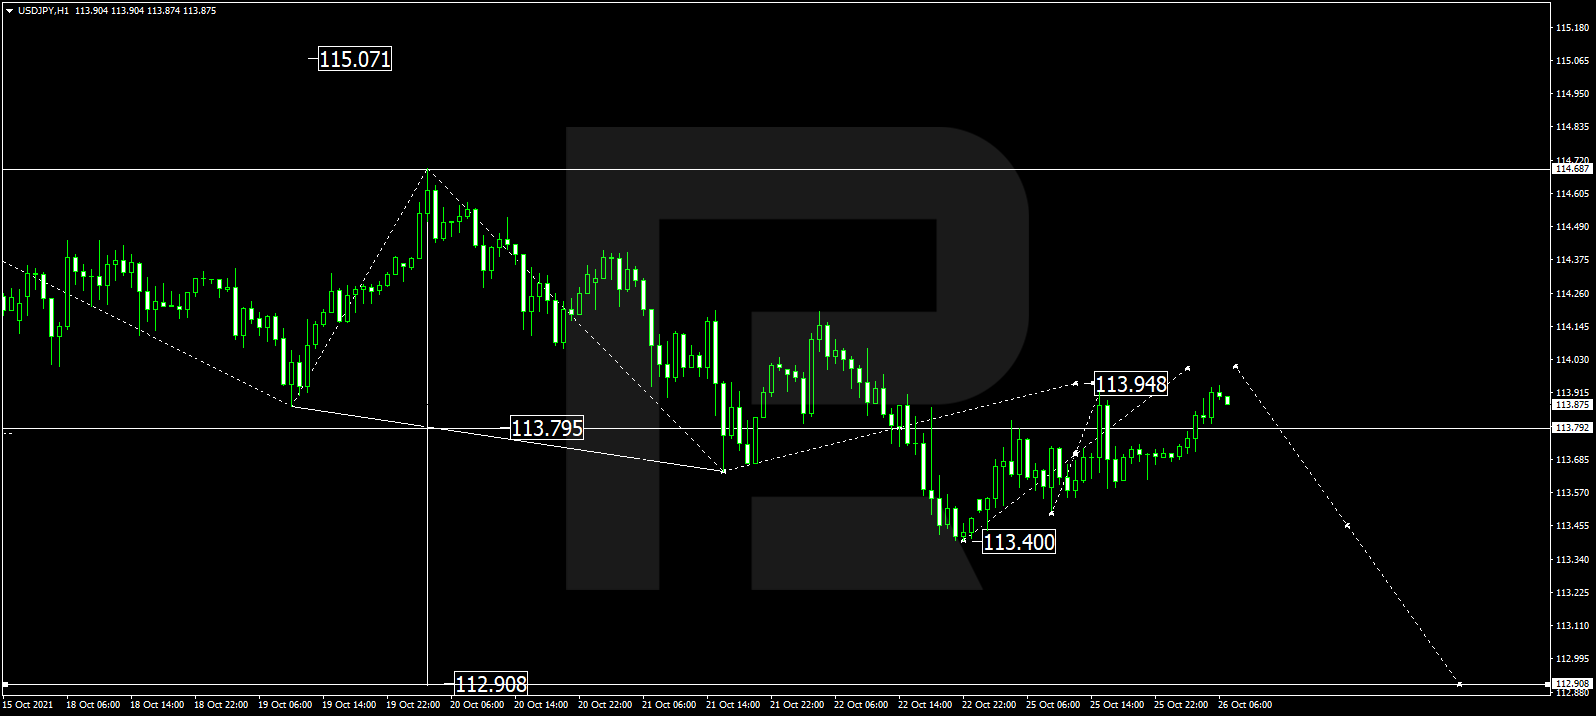
| JPY | 266,750 | 100 | -102,734 | 4 | 122,640 | 98 | -19,906 | 9 |
| CHF | 55,600 | 36 | -17,584 | 39 | 33,353 | 68 | -15,769 | 17 |
| CAD | 153,912 | 33 | -10,924 | 46 | -7,837 | 47 | 18,761 | 75 |
| AUD | 158,531 | 51 | -76,058 | 13 | 81,311 | 80 | -5,253 | 42 |
| NZD | 37,730 | 20 | 6,440 | 82 | -7,598 | 19 | 1,158 | 65 |
| MXN | 164,268 | 31 | -38,571 | 1 | 36,459 | 99 | 2,112 | 52 |
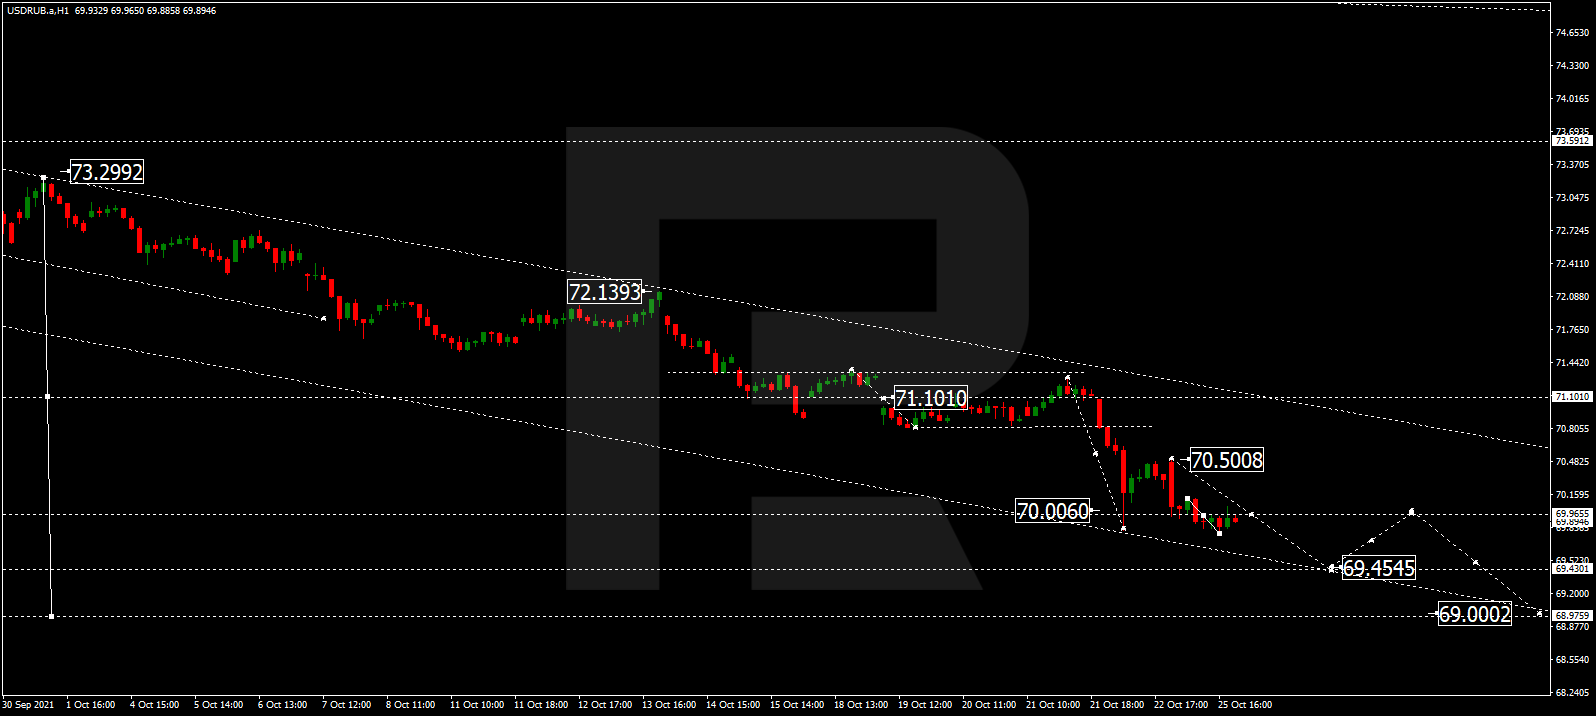
| RUB | 53,589 | 59 | 22,171 | 66 | -24,341 | 30 | 2,170 | 93 |
| BRL | 29,983 | 30 | -658 | 68 | -115 | 33 | 773 | 76 |
| Bitcoin | 13,605 | 93 | -2,846 | 24 | 246 | 0 | 2,600 | 75 |
US Dollar Index Futures:
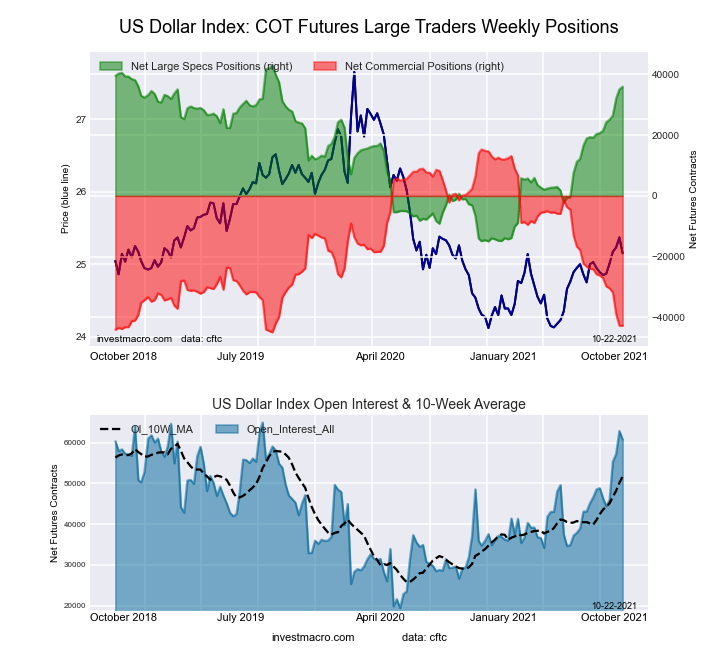 The US Dollar Index large speculator standing this week equaled a net position of 35,934 contracts in the data reported through Tuesday. This was a weekly rise of 872 contracts from the previous week which had a total of 35,062 net contracts.
This week’s current strength score (the trader positioning range over the past three years, measured from 0 to 100) shows the speculators are currently Bullish-Extreme with a score of 87.8 percent. The commercials are Bearish-Extreme with a score of 3.6 percent and the small traders (not shown in chart) are Bullish-Extreme with a score of 90.9 percent.
| US DOLLAR INDEX Statistics | SPECULATORS | COMMERCIALS | SMALL TRADERS |
| – Percent of Open Interest Longs: | 78.3 | 3.5 | 14.2 |
| – Percent of Open Interest Shorts: | 19.2 | 73.8 | 3.0 |
| – Net Position: | 35,934 | -42,728 | 6,794 |
| – Gross Longs: | 47,568 | 2,104 | 8,642 |
| – Gross Shorts: | 11,634 | 44,832 | 1,848 |
| – Long to Short Ratio: | 4.1 to 1 | 0.0 to 1 | 4.7 to 1 |
| NET POSITION TREND: | | | |
| – COT Index Score (3 Year Range Pct): | 87.8 | 3.6 | 90.9 |
| – COT Index Reading (3 Year Range): | Bullish-Extreme | Bearish-Extreme | Bullish-Extreme |
| NET POSITION MOVEMENT INDEX: | | | |
| – 6-Week Change in Strength Index: | 25.0 | -26.0 | 13.1 |
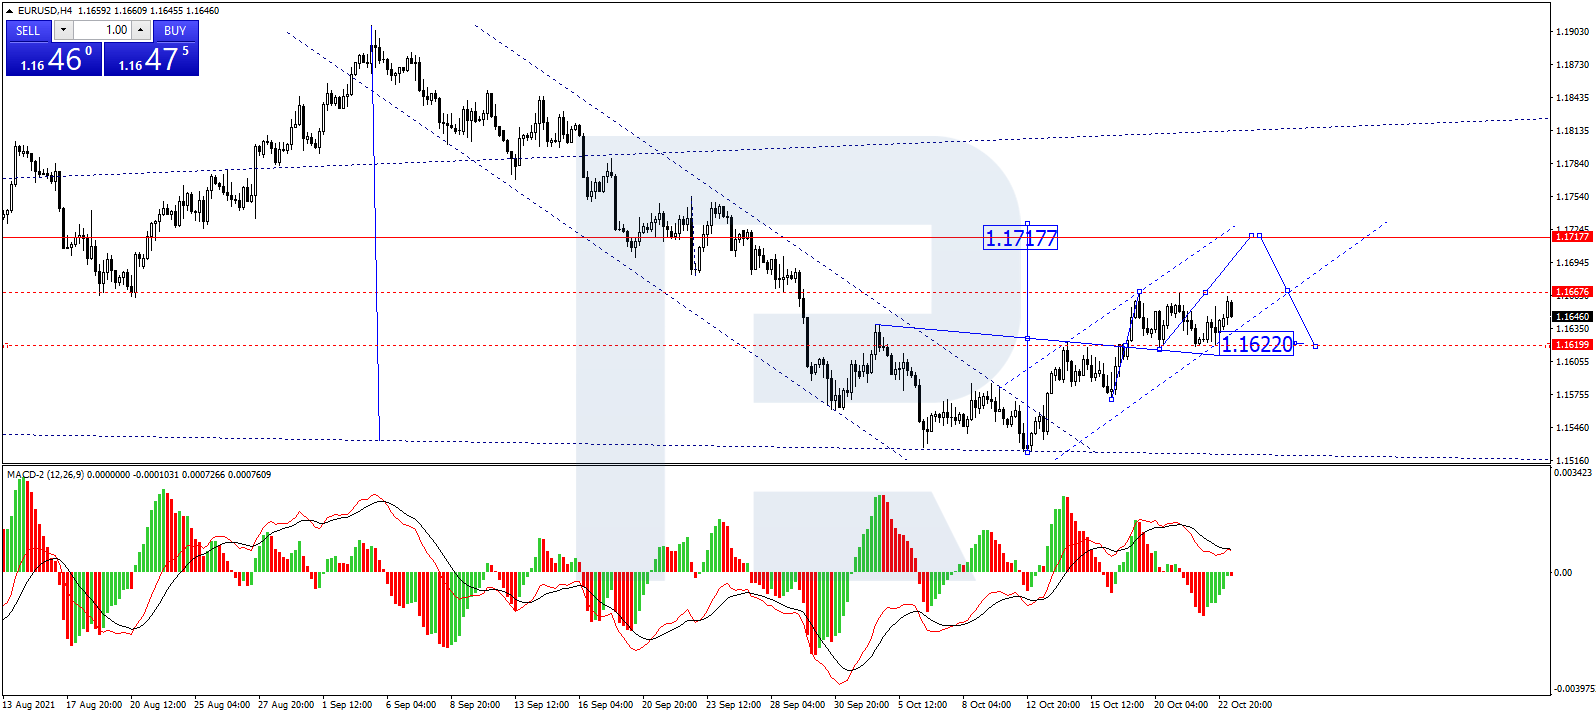
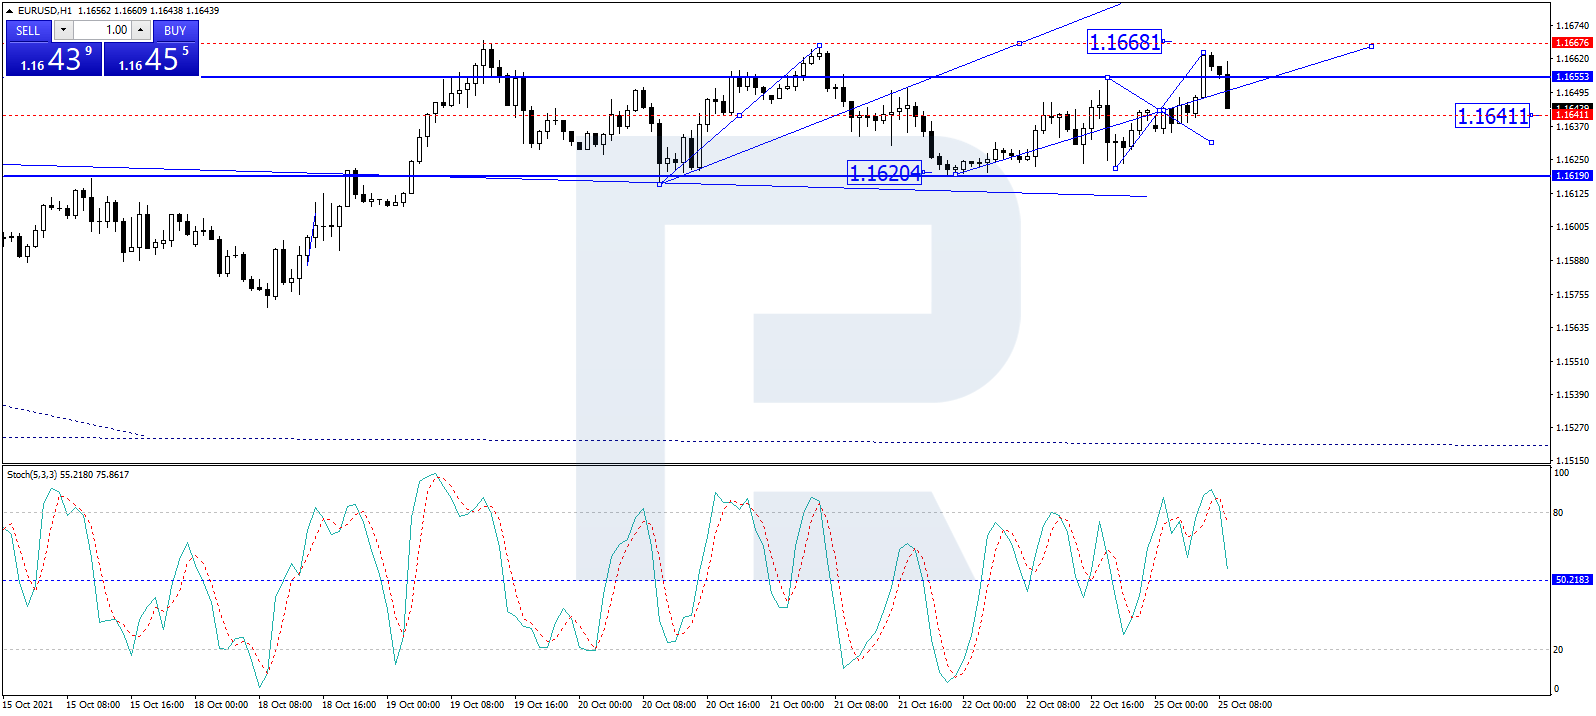
Euro Currency Futures:
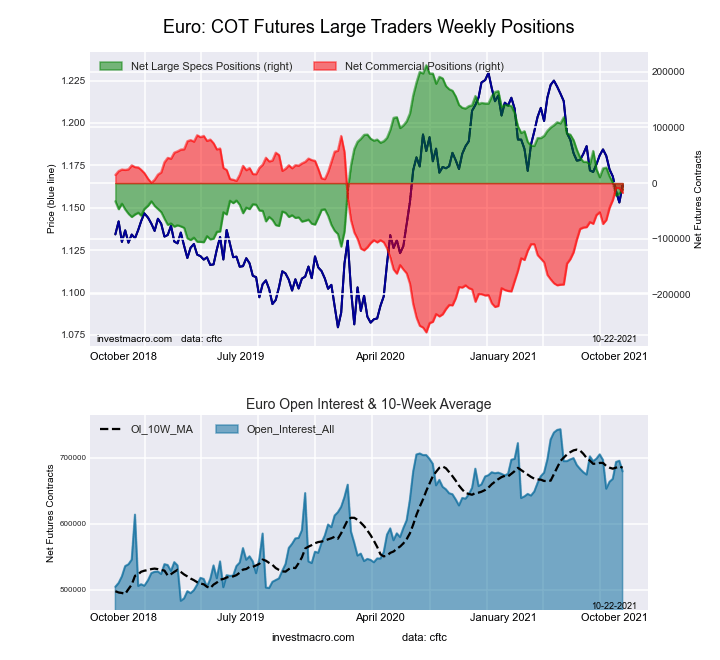 The Euro Currency large speculator standing this week equaled a net position of -12,107 contracts in the data reported through Tuesday. This was a weekly increase of 6,291 contracts from the previous week which had a total of -18,398 net contracts.
This week’s current strength score (the trader positioning range over the past three years, measured from 0 to 100) shows the speculators are currently Bearish with a score of 31.3 percent. The commercials are Bullish with a score of 70.8 percent and the small traders (not shown in chart) are Bearish with a score of 27.0 percent.
| EURO Currency Statistics | SPECULATORS | COMMERCIALS | SMALL TRADERS |
| – Percent of Open Interest Longs: | 28.5 | 57.4 | 12.9 |
| – Percent of Open Interest Shorts: | 30.2 | 59.9 | 8.5 |
| – Net Position: | -12,107 | -17,573 | 29,680 |
| – Gross Longs: | 193,320 | 389,682 | 87,763 |
| – Gross Shorts: | 205,427 | 407,255 | 58,083 |
| – Long to Short Ratio: | 0.9 to 1 | 1.0 to 1 | 1.5 to 1 |
| NET POSITION TREND: | | | |
| – COT Index Score (3 Year Range Pct): | 31.3 | 70.8 | 27.0 |
| – COT Index Reading (3 Year Range): | Bearish | Bullish | Bearish |
| NET POSITION MOVEMENT INDEX: | | | |
| – 6-Week Change in Strength Index: | -11.8 | 15.7 | -27.4 |
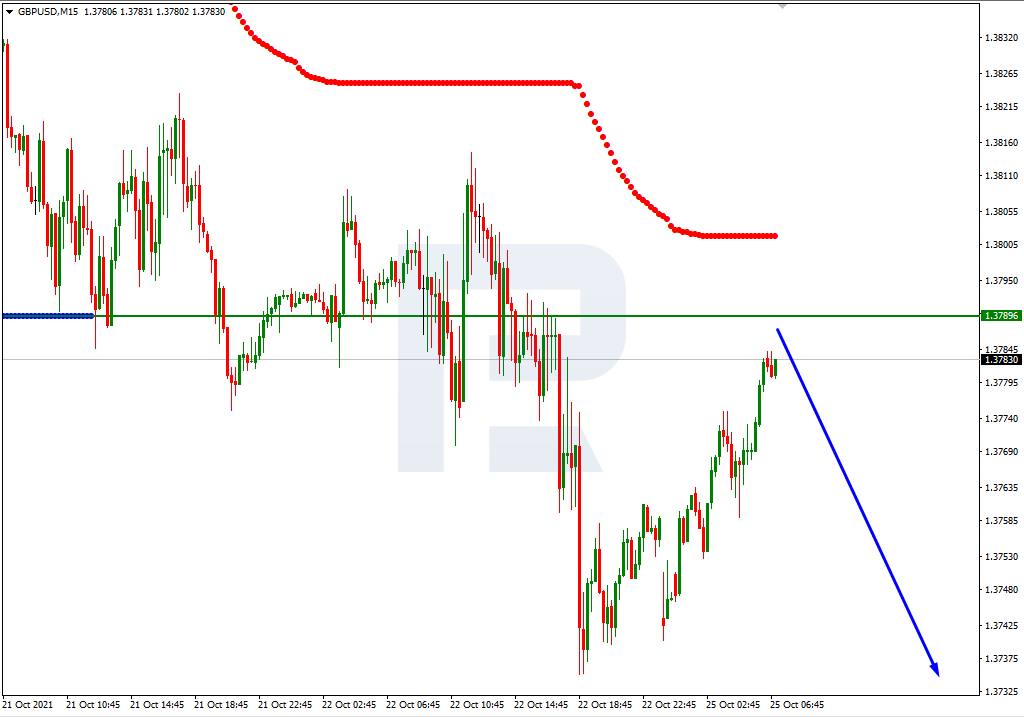
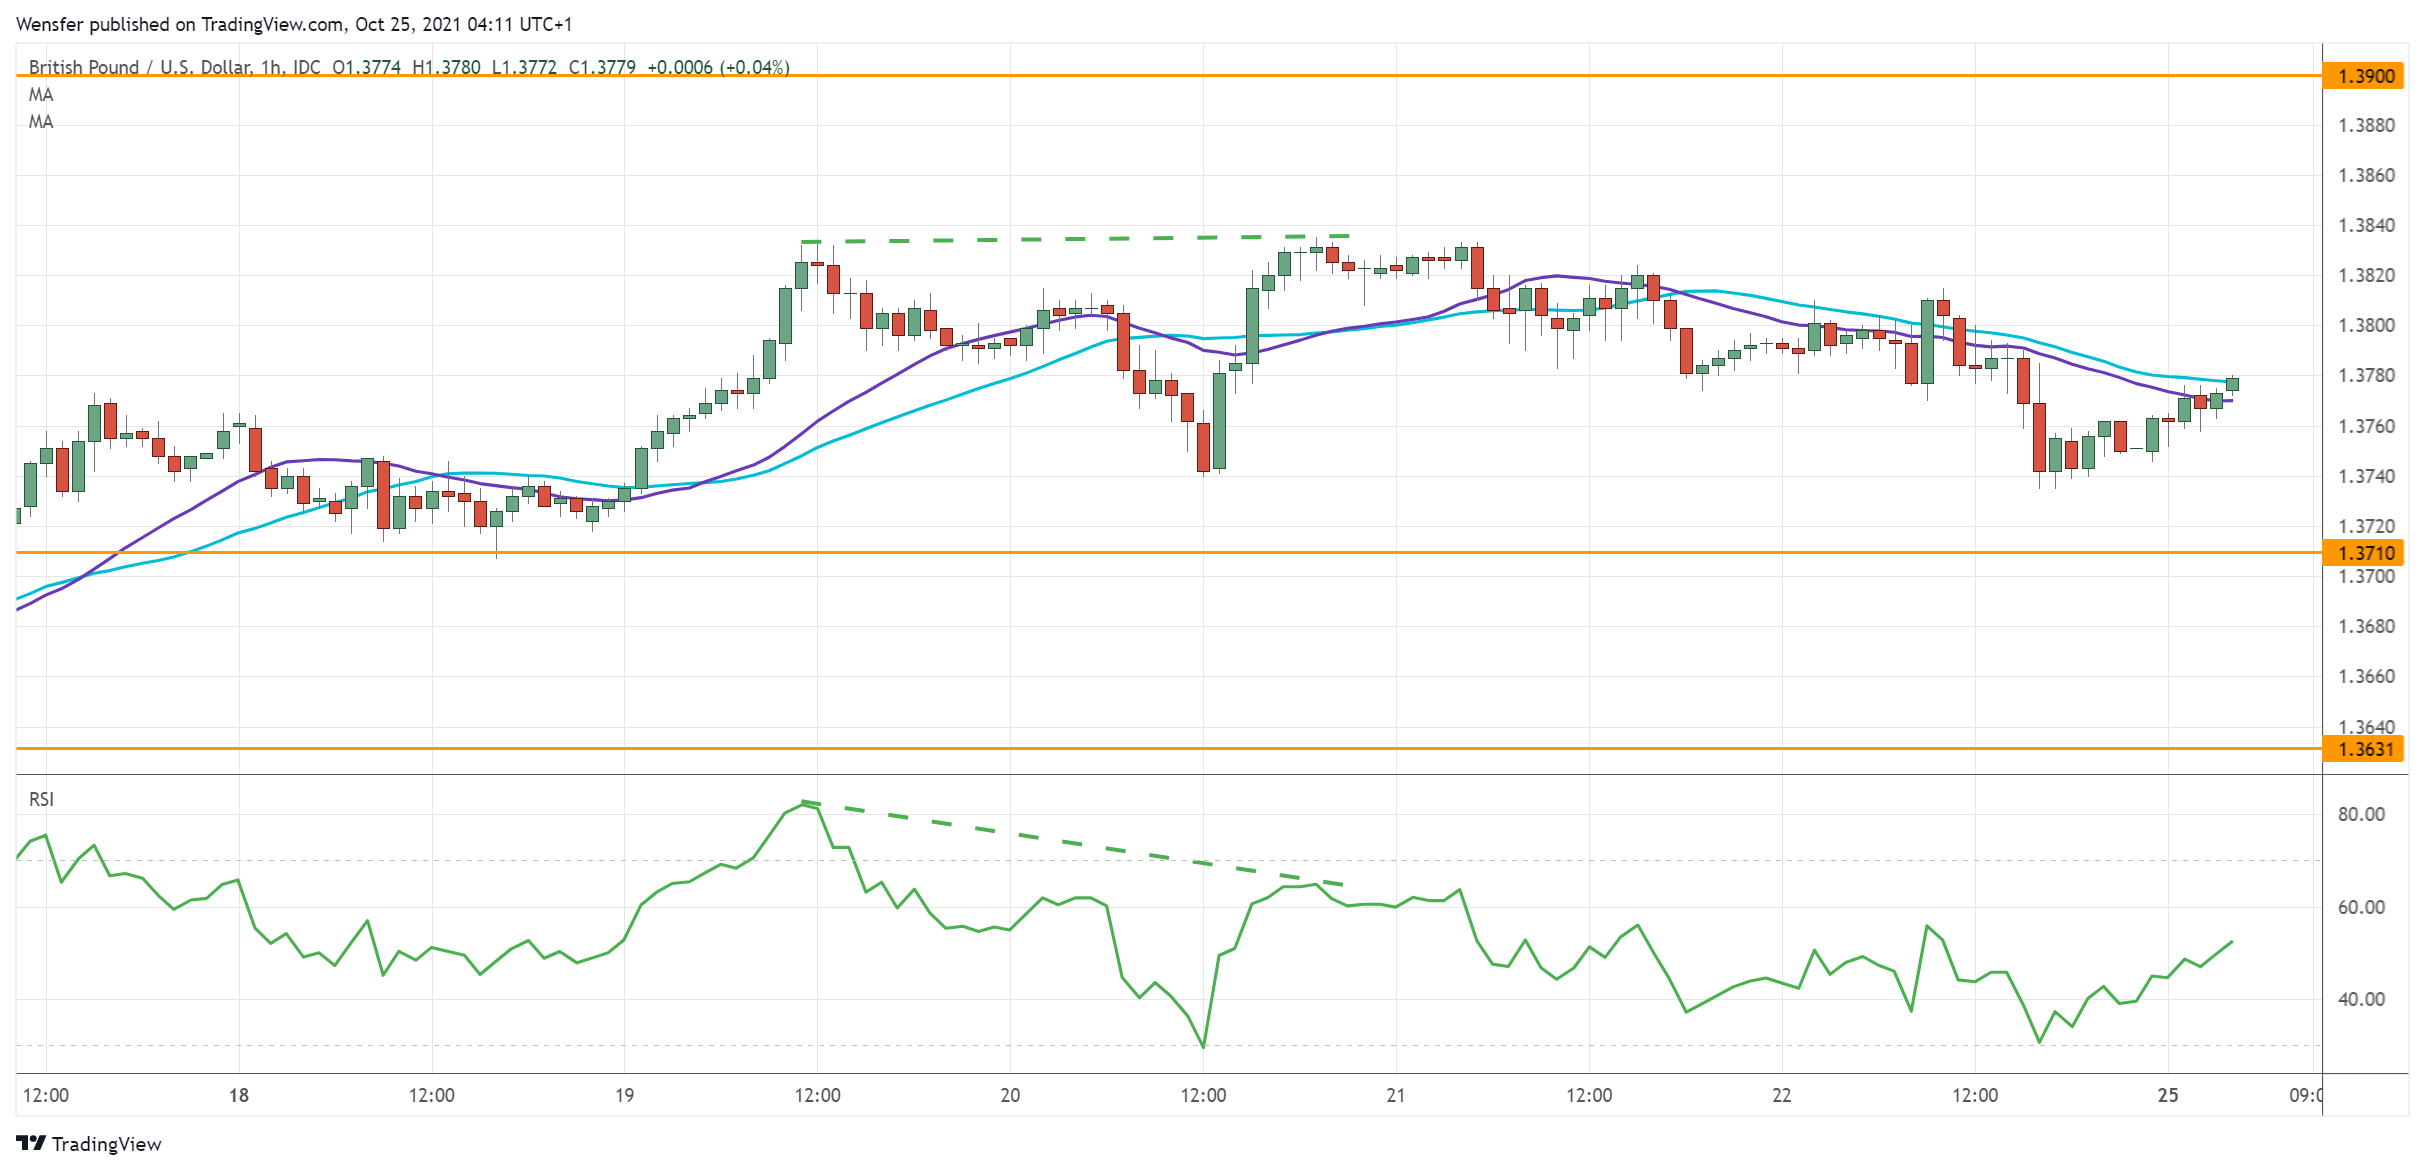
British Pound Sterling Futures:
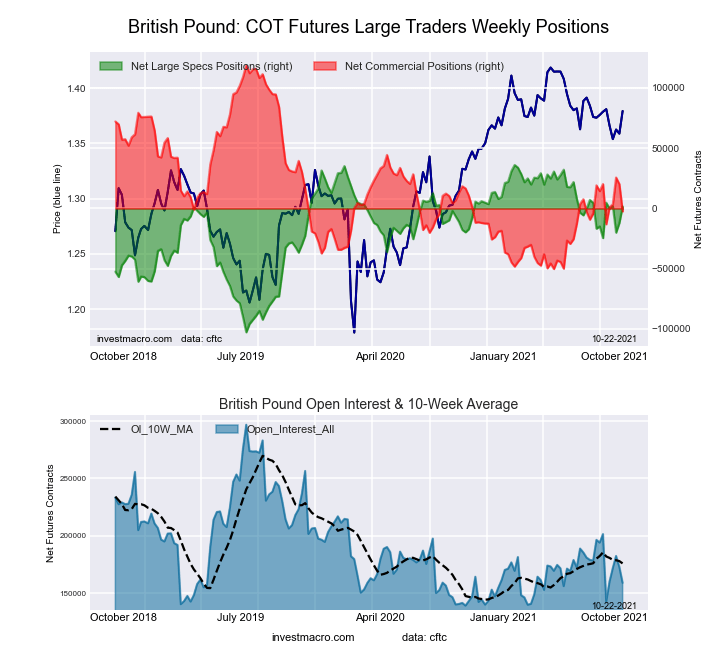 The British Pound Sterling large speculator standing this week equaled a net position of 1,615 contracts in the data reported through Tuesday. This was a weekly gain of 13,594 contracts from the previous week which had a total of -11,979 net contracts.
This week’s current strength score (the trader positioning range over the past three years, measured from 0 to 100) shows the speculators are currently Bullish with a score of 75.2 percent. The commercials are Bearish with a score of 28.3 percent and the small traders (not shown in chart) are Bullish with a score of 57.2 percent.
| BRITISH POUND Statistics | SPECULATORS | COMMERCIALS | SMALL TRADERS |
| – Percent of Open Interest Longs: | 30.9 | 50.0 | 17.6 |
| – Percent of Open Interest Shorts: | 29.9 | 51.5 | 17.1 |
| – Net Position: | 1,615 | -2,381 | 766 |
| – Gross Longs: | 49,112 | 79,459 | 27,920 |
| – Gross Shorts: | 47,497 | 81,840 | 27,154 |
| – Long to Short Ratio: | 1.0 to 1 | 1.0 to 1 | 1.0 to 1 |
| NET POSITION TREND: | | | |
| – COT Index Score (3 Year Range Pct): | 75.2 | 28.3 | 57.2 |
| – COT Index Reading (3 Year Range): | Bullish | Bearish | Bullish |
| NET POSITION MOVEMENT INDEX: | | | |
| – 6-Week Change in Strength Index: | 18.8 | -13.4 | -7.2 |
Japanese Yen Futures:
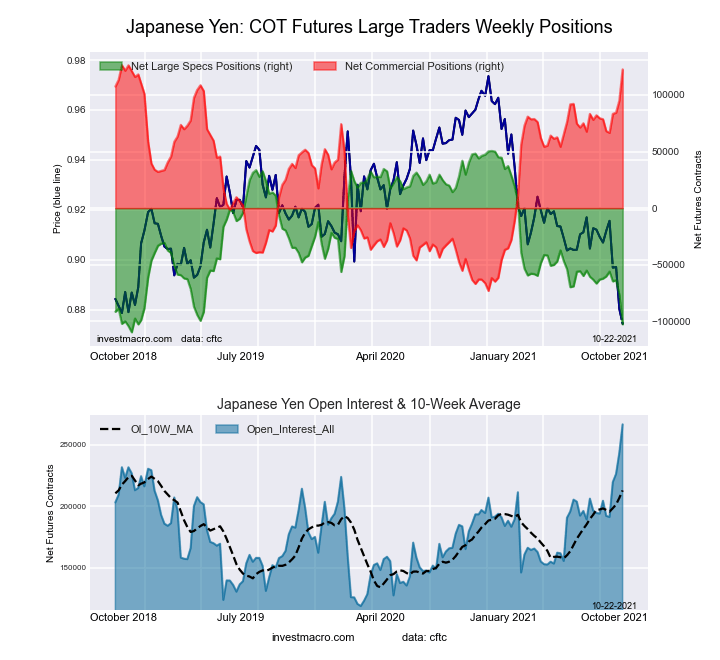 The Japanese Yen large speculator standing this week equaled a net position of -102,734 contracts in the data reported through Tuesday. This was a weekly lowering of -26,100 contracts from the previous week which had a total of -76,634 net contracts.
This week’s current strength score (the trader positioning range over the past three years, measured from 0 to 100) shows the speculators are currently Bearish-Extreme with a score of 4.4 percent. The commercials are Bullish-Extreme with a score of 98.1 percent and the small traders (not shown in chart) are Bearish-Extreme with a score of 9.3 percent.
| JAPANESE YEN Statistics | SPECULATORS | COMMERCIALS | SMALL TRADERS |
| – Percent of Open Interest Longs: | 13.4 | 77.9 | 7.9 |
| – Percent of Open Interest Shorts: | 51.9 | 31.9 | 15.4 |
| – Net Position: | -102,734 | 122,640 | -19,906 |
| – Gross Longs: | 35,713 | 207,735 | 21,090 |
| – Gross Shorts: | 138,447 | 85,095 | 40,996 |
| – Long to Short Ratio: | 0.3 to 1 | 2.4 to 1 | 0.5 to 1 |
| NET POSITION TREND: | | | |
| – COT Index Score (3 Year Range Pct): | 4.4 | 98.1 | 9.3 |
| – COT Index Reading (3 Year Range): | Bearish-Extreme | Bullish-Extreme | Bearish-Extreme |
| NET POSITION MOVEMENT INDEX: | | | |
| – 6-Week Change in Strength Index: | -25.2 | 22.1 | -7.7 |
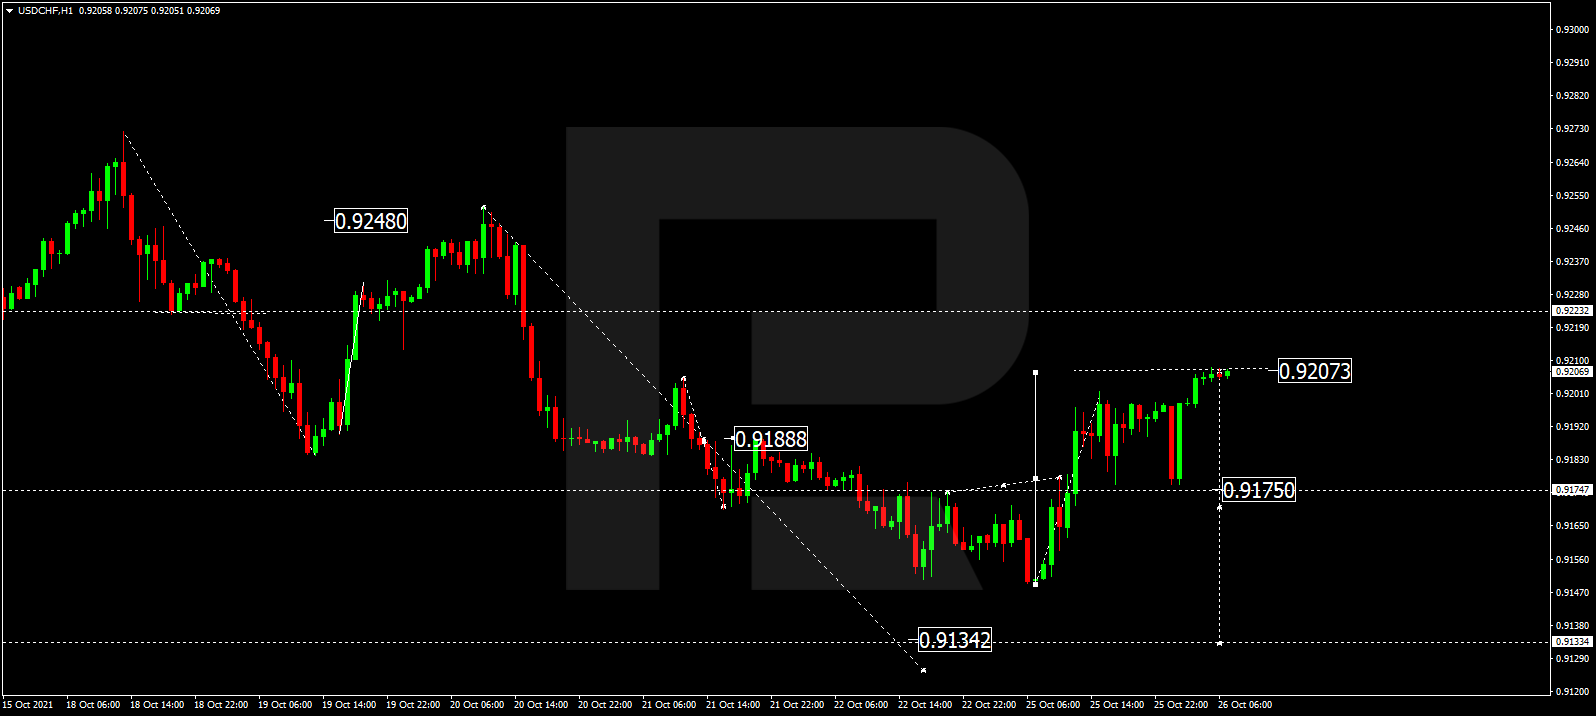
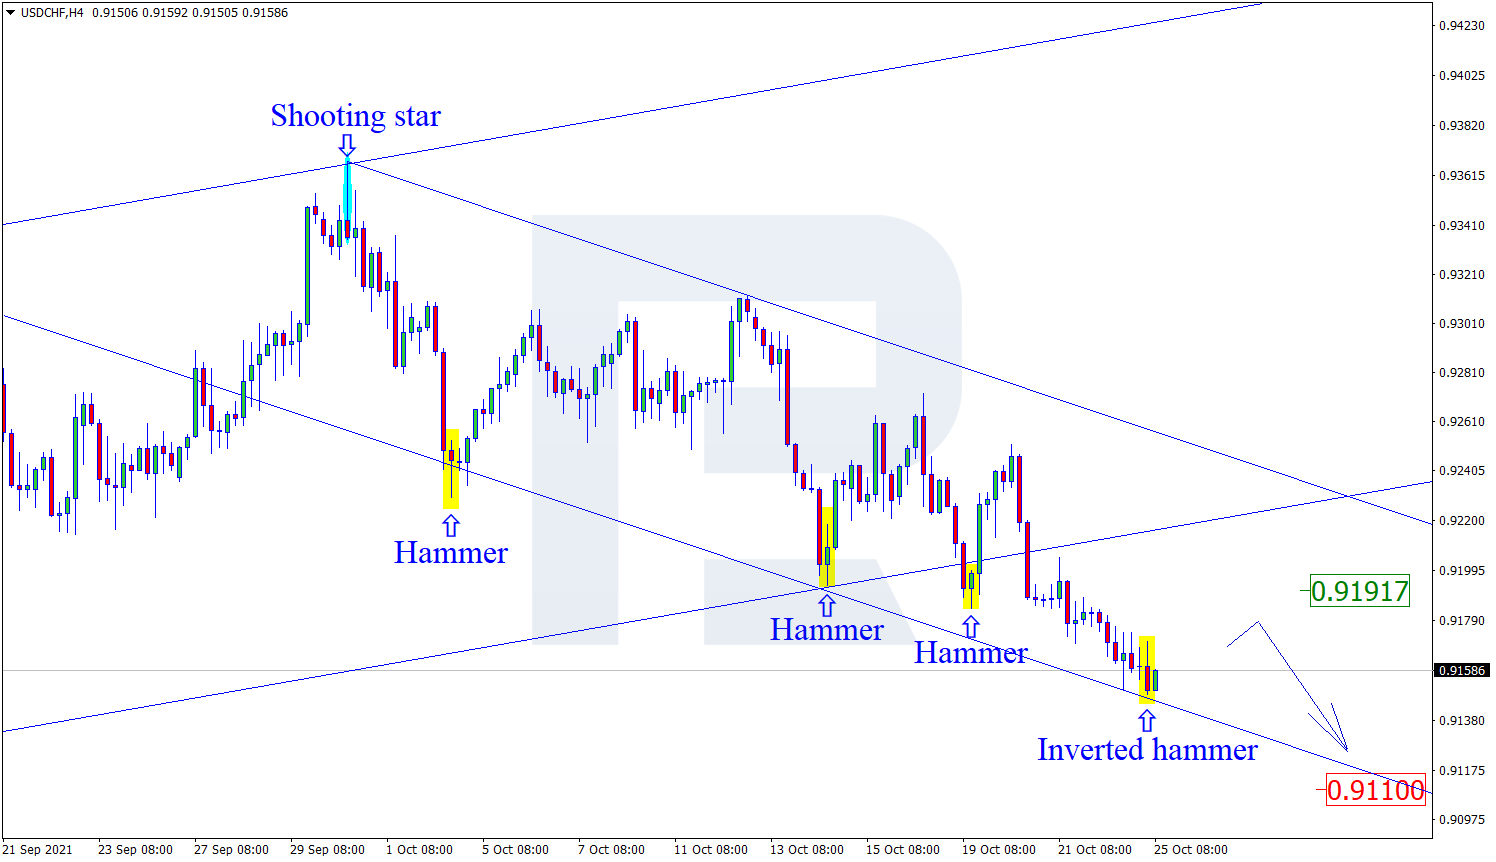
Swiss Franc Futures:
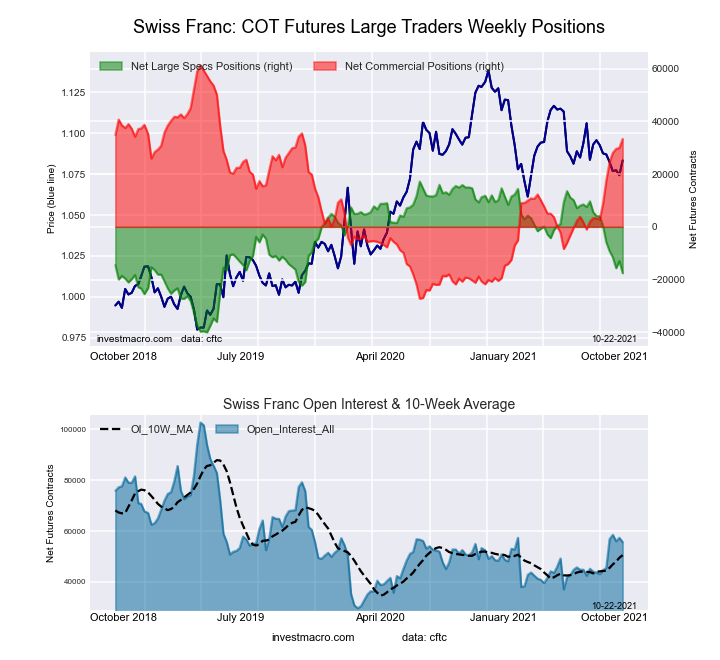 The Swiss Franc large speculator standing this week equaled a net position of -17,584 contracts in the data reported through Tuesday. This was a weekly reduction of -4,612 contracts from the previous week which had a total of -12,972 net contracts.
This week’s current strength score (the trader positioning range over the past three years, measured from 0 to 100) shows the speculators are currently Bearish with a score of 39.2 percent. The commercials are Bullish with a score of 68.4 percent and the small traders (not shown in chart) are Bearish-Extreme with a score of 17.0 percent.
| SWISS FRANC Statistics | SPECULATORS | COMMERCIALS | SMALL TRADERS |
| – Percent of Open Interest Longs: | 4.3 | 80.3 | 15.4 |
| – Percent of Open Interest Shorts: | 35.9 | 20.3 | 43.7 |
| – Net Position: | -17,584 | 33,353 | -15,769 |
| – Gross Longs: | 2,365 | 44,662 | 8,549 |
| – Gross Shorts: | 19,949 | 11,309 | 24,318 |
| – Long to Short Ratio: | 0.1 to 1 | 3.9 to 1 | 0.4 to 1 |
| NET POSITION TREND: | | | |
| – COT Index Score (3 Year Range Pct): | 39.2 | 68.4 | 17.0 |
| – COT Index Reading (3 Year Range): | Bearish | Bullish | Bearish-Extreme |
| NET POSITION MOVEMENT INDEX: | | | |
| – 6-Week Change in Strength Index: | -31.1 | 27.7 | -19.8 |
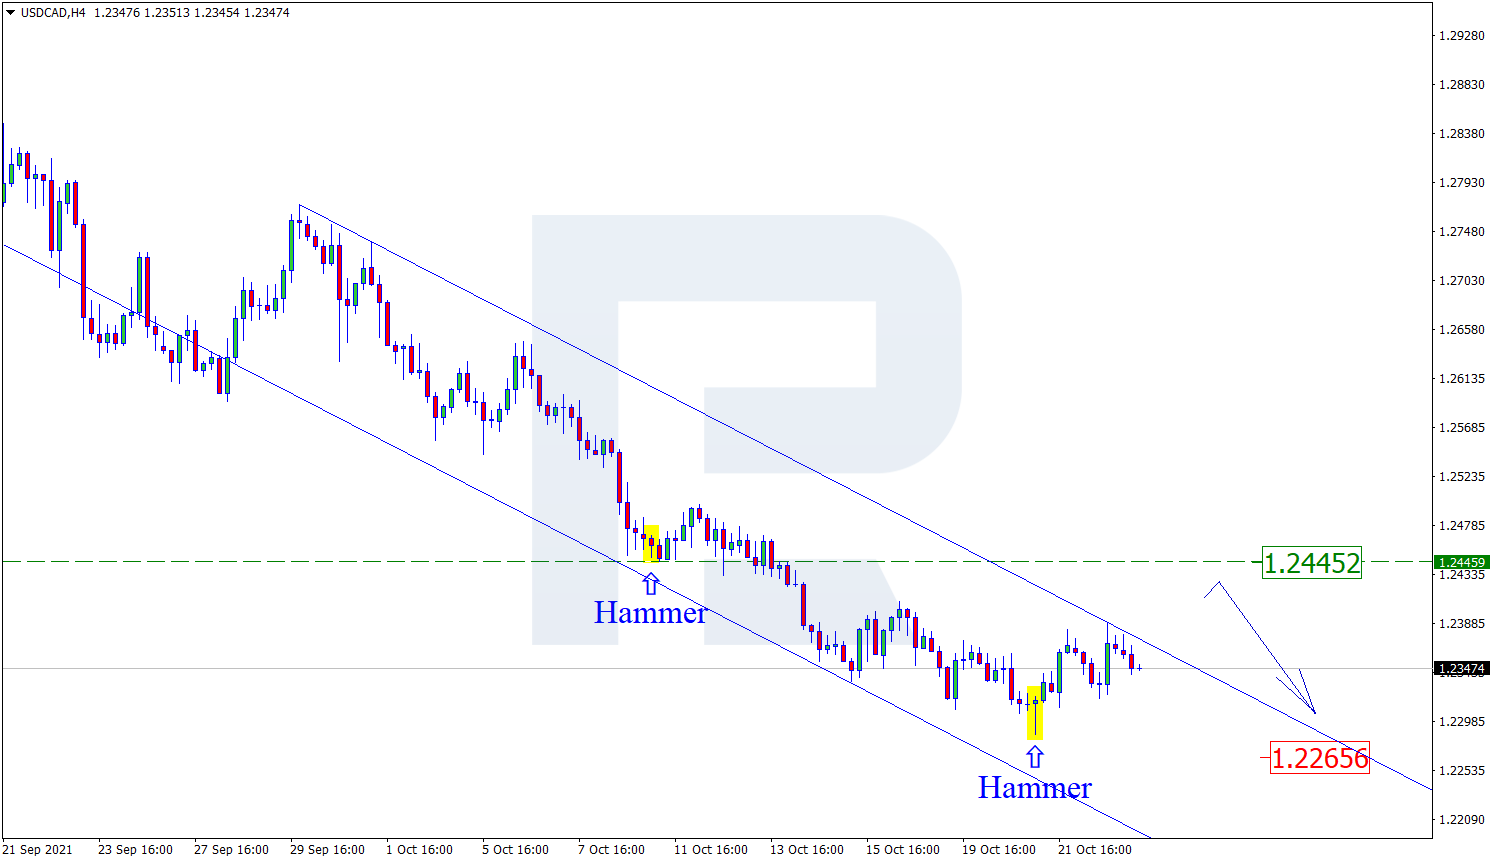
Canadian Dollar Futures:
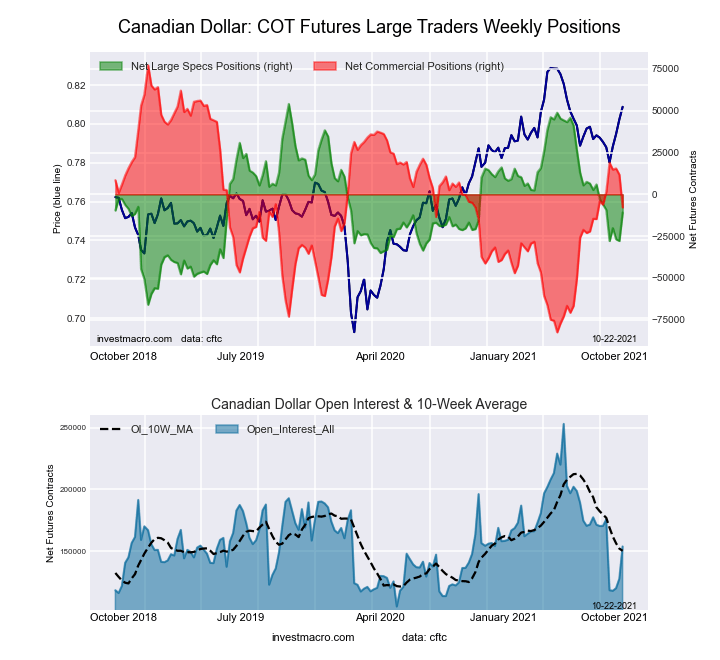 The Canadian Dollar large speculator standing this week equaled a net position of -10,924 contracts in the data reported through Tuesday. This was a weekly rise of 16,936 contracts from the previous week which had a total of -27,860 net contracts.
This week’s current strength score (the trader positioning range over the past three years, measured from 0 to 100) shows the speculators are currently Bearish with a score of 45.9 percent. The commercials are Bearish with a score of 46.7 percent and the small traders (not shown in chart) are Bullish with a score of 75.1 percent.
| CANADIAN DOLLAR Statistics | SPECULATORS | COMMERCIALS | SMALL TRADERS |
| – Percent of Open Interest Longs: | 26.2 | 47.2 | 25.3 |
| – Percent of Open Interest Shorts: | 33.3 | 52.3 | 13.1 |
| – Net Position: | -10,924 | -7,837 | 18,761 |
| – Gross Longs: | 40,380 | 72,675 | 38,947 |
| – Gross Shorts: | 51,304 | 80,512 | 20,186 |
| – Long to Short Ratio: | 0.8 to 1 | 0.9 to 1 | 1.9 to 1 |
| NET POSITION TREND: | | | |
| – COT Index Score (3 Year Range Pct): | 45.9 | 46.7 | 75.1 |
| – COT Index Reading (3 Year Range): | Bearish | Bearish | Bullish |
| NET POSITION MOVEMENT INDEX: | | | |
| – 6-Week Change in Strength Index: | -4.1 | -1.1 | 10.1 |
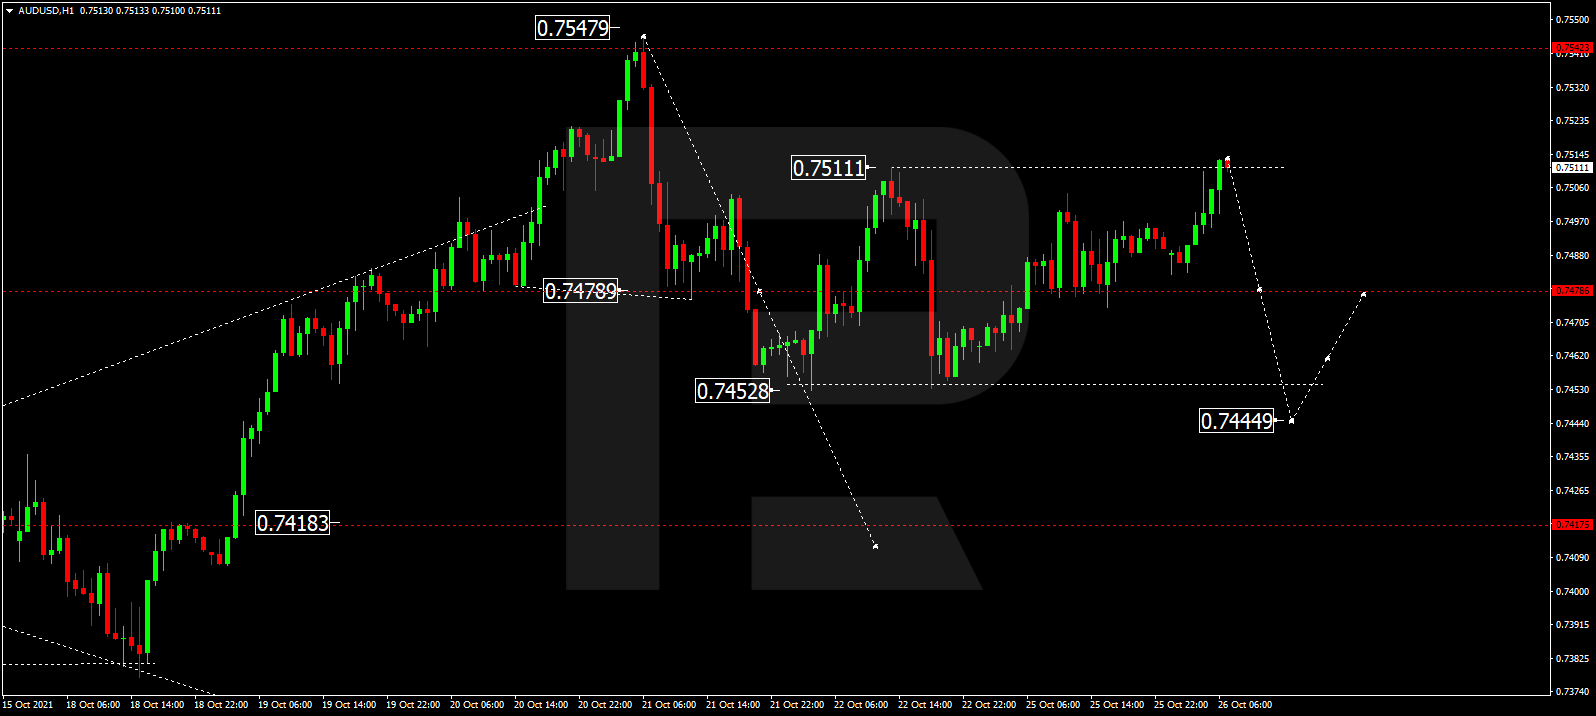
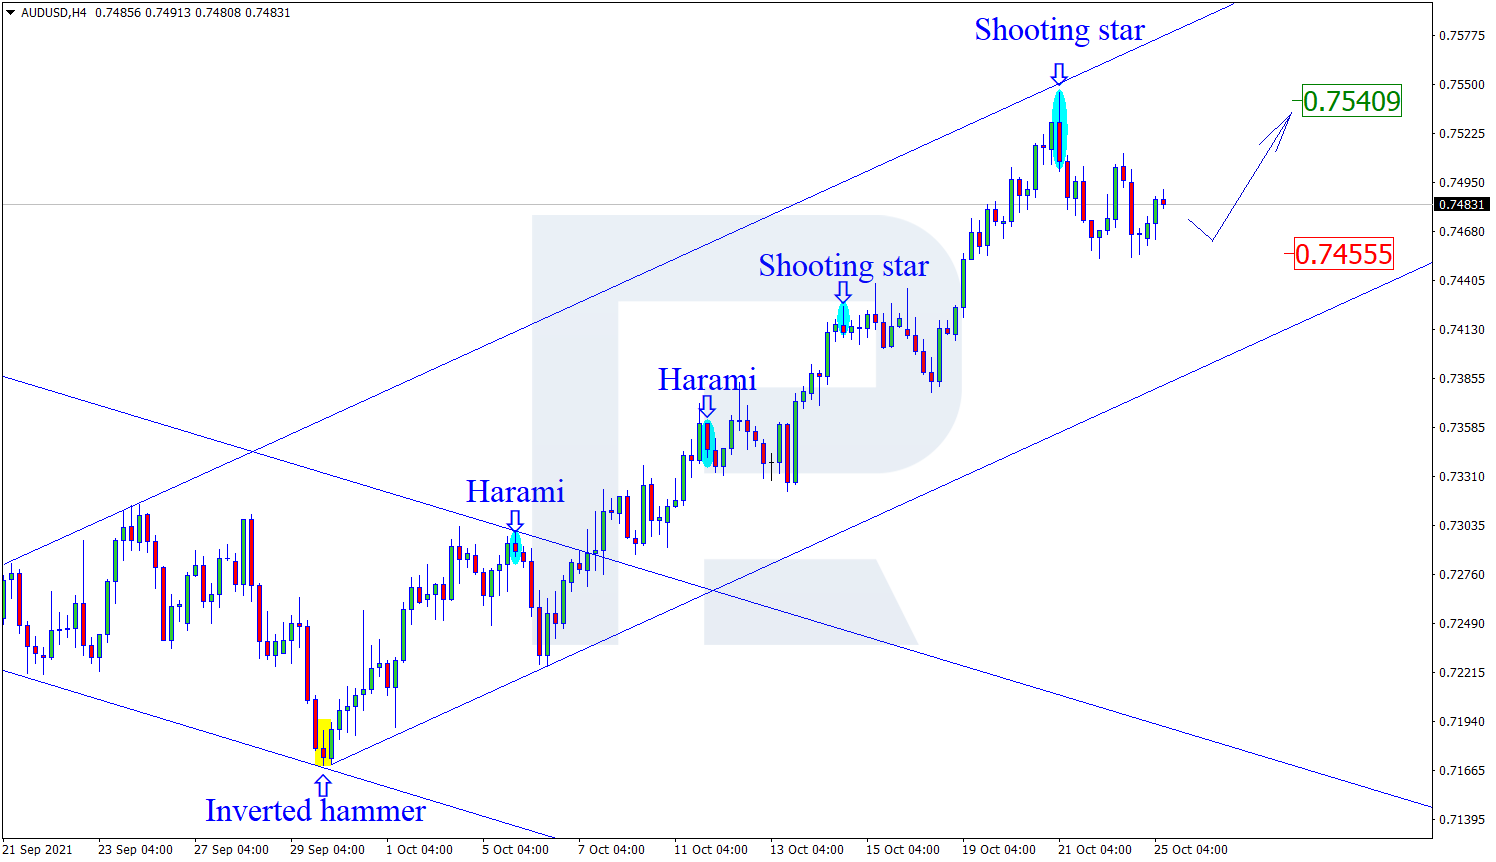
Australian Dollar Futures:
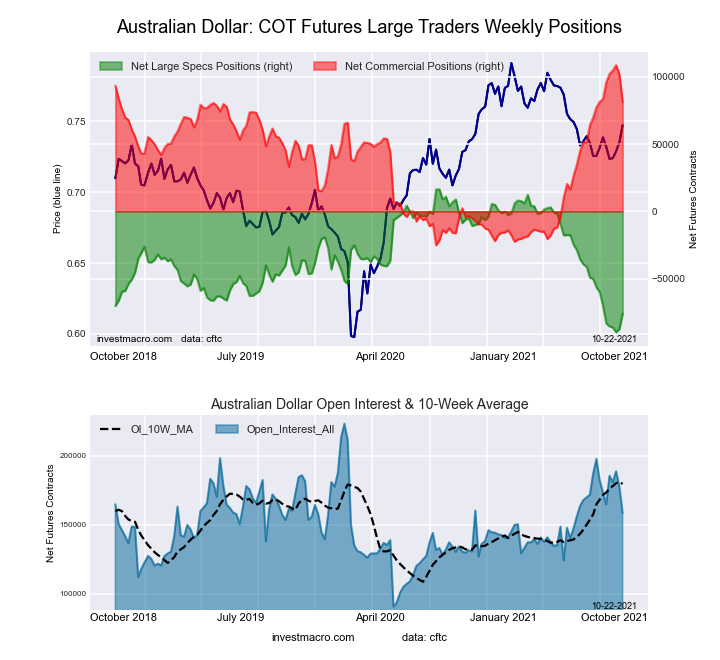 The Australian Dollar large speculator standing this week equaled a net position of -76,058 contracts in the data reported through Tuesday. This was a weekly increase of 11,550 contracts from the previous week which had a total of -87,608 net contracts.
This week’s current strength score (the trader positioning range over the past three years, measured from 0 to 100) shows the speculators are currently Bearish-Extreme with a score of 13.1 percent. The commercials are Bullish with a score of 79.6 percent and the small traders (not shown in chart) are Bearish with a score of 41.7 percent.
| AUSTRALIAN DOLLAR Statistics | SPECULATORS | COMMERCIALS | SMALL TRADERS |
| – Percent of Open Interest Longs: | 7.3 | 76.6 | 13.7 |
| – Percent of Open Interest Shorts: | 55.3 | 25.4 | 17.0 |
| – Net Position: | -76,058 | 81,311 | -5,253 |
| – Gross Longs: | 11,632 | 121,502 | 21,748 |
| – Gross Shorts: | 87,690 | 40,191 | 27,001 |
| – Long to Short Ratio: | 0.1 to 1 | 3.0 to 1 | 0.8 to 1 |
| NET POSITION TREND: | | | |
| – COT Index Score (3 Year Range Pct): | 13.1 | 79.6 | 41.7 |
| – COT Index Reading (3 Year Range): | Bearish-Extreme | Bullish | Bearish |
| NET POSITION MOVEMENT INDEX: | | | |
| – 6-Week Change in Strength Index: | -5.2 | -1.6 | 18.2 |
New Zealand Dollar Futures:
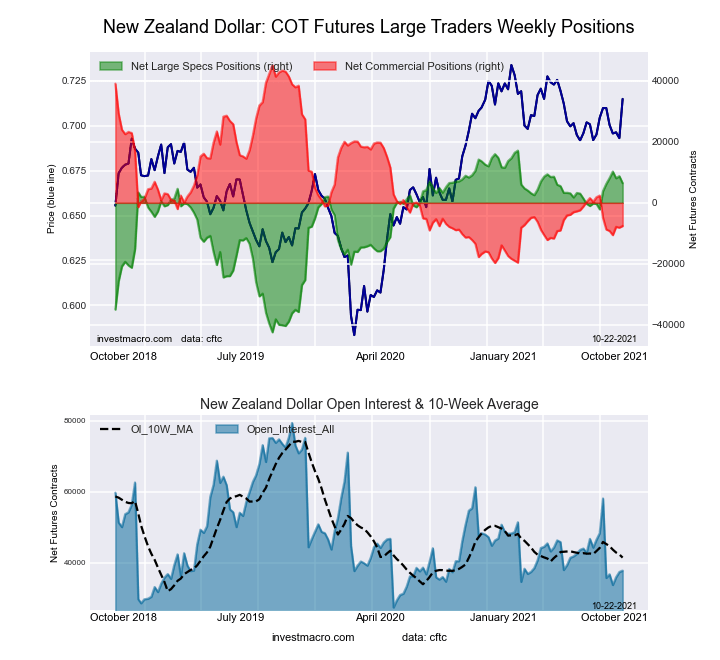 The New Zealand Dollar large speculator standing this week equaled a net position of 6,440 contracts in the data reported through Tuesday. This was a weekly lowering of -2,308 contracts from the previous week which had a total of 8,748 net contracts.
This week’s current strength score (the trader positioning range over the past three years, measured from 0 to 100) shows the speculators are currently Bullish-Extreme with a score of 82.1 percent. The commercials are Bearish-Extreme with a score of 18.7 percent and the small traders (not shown in chart) are Bullish with a score of 65.1 percent.
| NEW ZEALAND DOLLAR Statistics | SPECULATORS | COMMERCIALS | SMALL TRADERS |
| – Percent of Open Interest Longs: | 55.7 | 29.7 | 12.3 |
| – Percent of Open Interest Shorts: | 38.6 | 49.8 | 9.2 |
| – Net Position: | 6,440 | -7,598 | 1,158 |
| – Gross Longs: | 21,004 | 11,194 | 4,631 |
| – Gross Shorts: | 14,564 | 18,792 | 3,473 |
| – Long to Short Ratio: | 1.4 to 1 | 0.6 to 1 | 1.3 to 1 |
| NET POSITION TREND: | | | |
| – COT Index Score (3 Year Range Pct): | 82.1 | 18.7 | 65.1 |
| – COT Index Reading (3 Year Range): | Bullish-Extreme | Bearish-Extreme | Bullish |
| NET POSITION MOVEMENT INDEX: | | | |
| – 6-Week Change in Strength Index: | 4.3 | -4.0 | 0.4 |
Mexican Peso Futures:
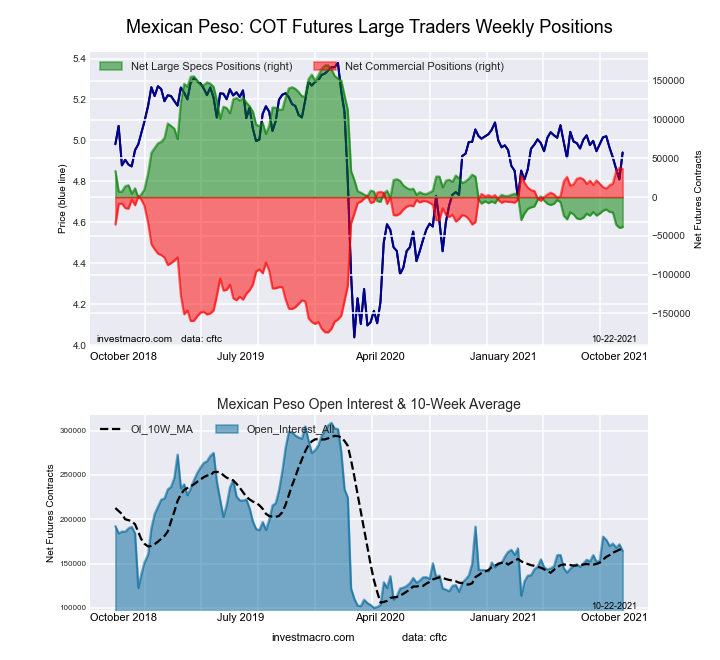 The Mexican Peso large speculator standing this week equaled a net position of -38,571 contracts in the data reported through Tuesday. This was a weekly increase of 1,063 contracts from the previous week which had a total of -39,634 net contracts.
This week’s current strength score (the trader positioning range over the past three years, measured from 0 to 100) shows the speculators are currently Bearish-Extreme with a score of 0.5 percent. The commercials are Bullish-Extreme with a score of 99.4 percent and the small traders (not shown in chart) are Bullish with a score of 52.0 percent.
| MEXICAN PESO Statistics | SPECULATORS | COMMERCIALS | SMALL TRADERS |
| – Percent of Open Interest Longs: | 42.7 | 52.9 | 3.6 |
| – Percent of Open Interest Shorts: | 66.2 | 30.7 | 2.3 |
| – Net Position: | -38,571 | 36,459 | 2,112 |
| – Gross Longs: | 70,192 | 86,864 | 5,934 |
| – Gross Shorts: | 108,763 | 50,405 | 3,822 |
| – Long to Short Ratio: | 0.6 to 1 | 1.7 to 1 | 1.6 to 1 |
| NET POSITION TREND: | | | |
| – COT Index Score (3 Year Range Pct): | 0.5 | 99.4 | 52.0 |
| – COT Index Reading (3 Year Range): | Bearish-Extreme | Bullish-Extreme | Bullish |
| NET POSITION MOVEMENT INDEX: | | | |
| – 6-Week Change in Strength Index: | -10.0 | 11.1 | -10.8 |
Brazilian Real Futures:
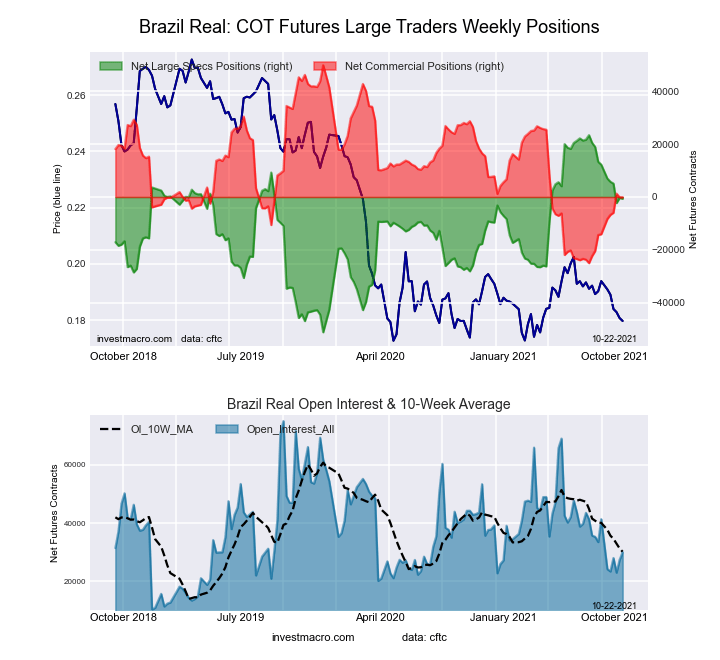 The Brazilian Real large speculator standing this week equaled a net position of -658 contracts in the data reported through Tuesday. This was a weekly reduction of -285 contracts from the previous week which had a total of -373 net contracts.
This week’s current strength score (the trader positioning range over the past three years, measured from 0 to 100) shows the speculators are currently Bullish with a score of 67.7 percent. The commercials are Bearish with a score of 33.3 percent and the small traders (not shown in chart) are Bullish with a score of 76.2 percent.
| BRAZIL REAL Statistics | SPECULATORS | COMMERCIALS | SMALL TRADERS |
| – Percent of Open Interest Longs: | 54.7 | 33.0 | 11.8 |
| – Percent of Open Interest Shorts: | 56.9 | 33.4 | 9.2 |
| – Net Position: | -658 | -115 | 773 |
| – Gross Longs: | 16,399 | 9,906 | 3,535 |
| – Gross Shorts: | 17,057 | 10,021 | 2,762 |
| – Long to Short Ratio: | 1.0 to 1 | 1.0 to 1 | 1.3 to 1 |
| NET POSITION TREND: | | | |
| – COT Index Score (3 Year Range Pct): | 67.7 | 33.3 | 76.2 |
| – COT Index Reading (3 Year Range): | Bullish | Bearish | Bullish |
| NET POSITION MOVEMENT INDEX: | | | |
| – 6-Week Change in Strength Index: | -9.4 | 10.2 | -8.2 |
Russian Ruble Futures:
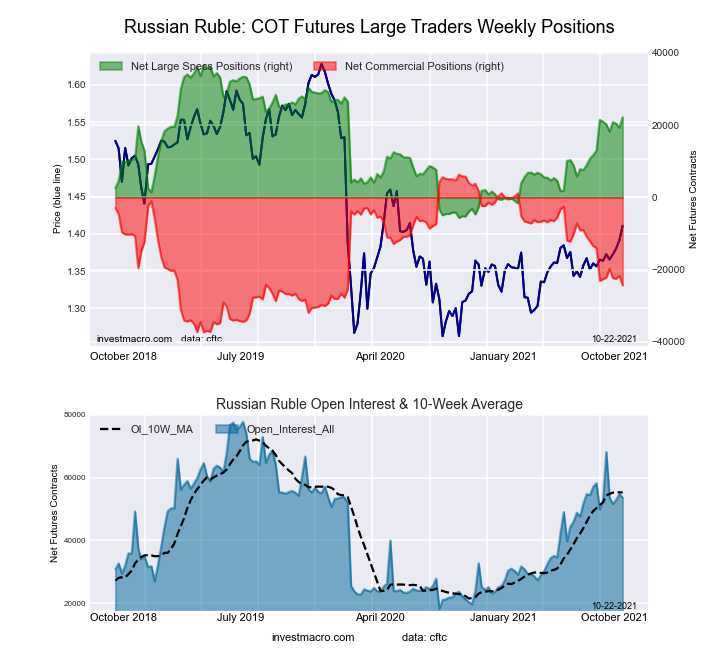 The Russian Ruble large speculator standing this week equaled a net position of 22,171 contracts in the data reported through Tuesday. This was a weekly lift of 2,863 contracts from the previous week which had a total of 19,308 net contracts.
This week’s current strength score (the trader positioning range over the past three years, measured from 0 to 100) shows the speculators are currently Bullish with a score of 65.9 percent. The commercials are Bearish with a score of 29.7 percent and the small traders (not shown in chart) are Bullish-Extreme with a score of 93.5 percent.
| RUSSIAN RUBLE Statistics | SPECULATORS | COMMERCIALS | SMALL TRADERS |
| – Percent of Open Interest Longs: | 58.9 | 35.0 | 5.8 |
| – Percent of Open Interest Shorts: | 17.5 | 80.5 | 1.8 |
| – Net Position: | 22,171 | -24,341 | 2,170 |
| – Gross Longs: | 31,551 | 18,778 | 3,134 |
| – Gross Shorts: | 9,380 | 43,119 | 964 |
| – Long to Short Ratio: | 3.4 to 1 | 0.4 to 1 | 3.3 to 1 |
| NET POSITION TREND: | | | |
| – COT Index Score (3 Year Range Pct): | 65.9 | 29.7 | 93.5 |
| – COT Index Reading (3 Year Range): | Bullish | Bearish | Bullish-Extreme |
| NET POSITION MOVEMENT INDEX: | | | |
| – 6-Week Change in Strength Index: | 2.9 | -3.9 | 13.3 |
Bitcoin Futures:
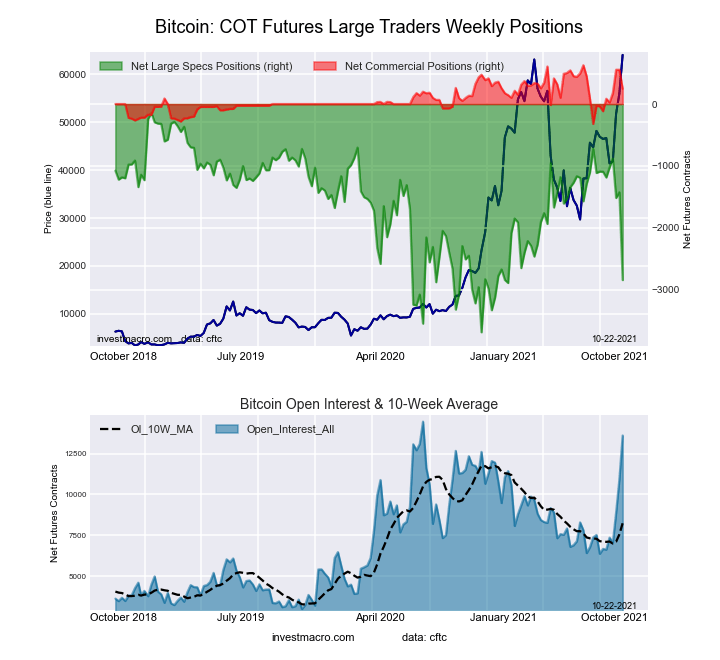 The Bitcoin large speculator standing this week equaled a net position of -2,846 contracts in the data reported through Tuesday. This was a weekly decrease of -1,420 contracts from the previous week which had a total of -1,426 net contracts.
This week’s current strength score (the trader positioning range over the past three years, measured from 0 to 100) shows the speculators are currently Bearish with a score of 23.8 percent. The commercials are Bullish with a score of 59.7 percent and the small traders (not shown in chart) are Bullish with a score of 75.3 percent.
| BITCOIN Statistics | SPECULATORS | COMMERCIALS | SMALL TRADERS |
| – Percent of Open Interest Longs: | 52.0 | 3.6 | 28.4 |
| – Percent of Open Interest Shorts: | 72.9 | 1.8 | 9.3 |
| – Net Position: | -2,846 | 246 | 2,600 |
| – Gross Longs: | 7,069 | 486 | 3,868 |
| – Gross Shorts: | 9,915 | 240 | 1,268 |
| – Long to Short Ratio: | 0.7 to 1 | 2.0 to 1 | 3.1 to 1 |
| NET POSITION TREND: | | | |
| – COT Index Score (3 Year Range Pct): | 23.8 | 59.7 | 75.3 |
| – COT Index Reading (3 Year Range): | Bearish | Bullish | Bullish |
| NET POSITION MOVEMENT INDEX: | | | |
| – 6-Week Change in Strength Index: | -49.4 | 38.0 | 45.8 |
Article By InvestMacro.com – Receive our weekly COT Reports by Email
*COT Report: The COT data, released weekly to the public each Friday, is updated through the most recent Tuesday (data is 3 days old) and shows a quick view of how large speculators or non-commercials (for-profit traders) were positioned in the futures markets.
The CFTC categorizes trader positions according to commercial hedgers (traders who use futures contracts for hedging as part of the business), non-commercials (large traders who speculate to realize trading profits) and nonreportable traders (usually small traders/speculators).
Find CFTC criteria here: (http://www.cftc.gov/MarketReports/CommitmentsofTraders/ExplanatoryNotes/index.htm).


