
Article By RoboForex.com
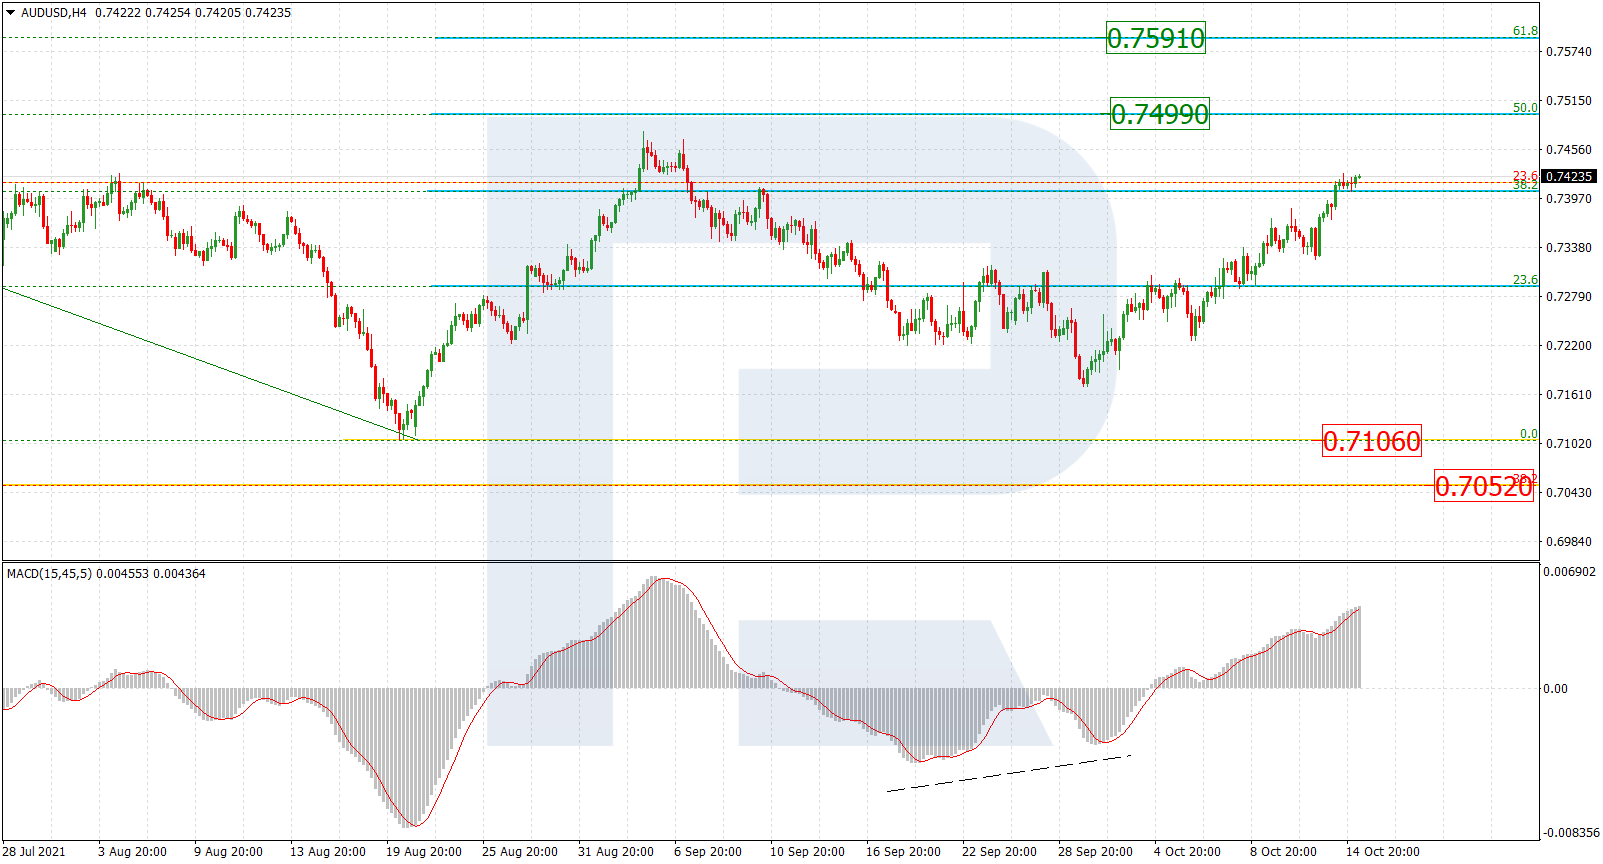
AUDUSD, “Australian Dollar vs US Dollar”
As we can see in the H4 chart, convergence on MACD made the pair start a new rising wave, which is quite stable, to extend the correctional range. The closest target is 50.0% fibo at 0.7499, the next one – 61.8% fibo at 0.7591. The support remains at the low at 0.7106.

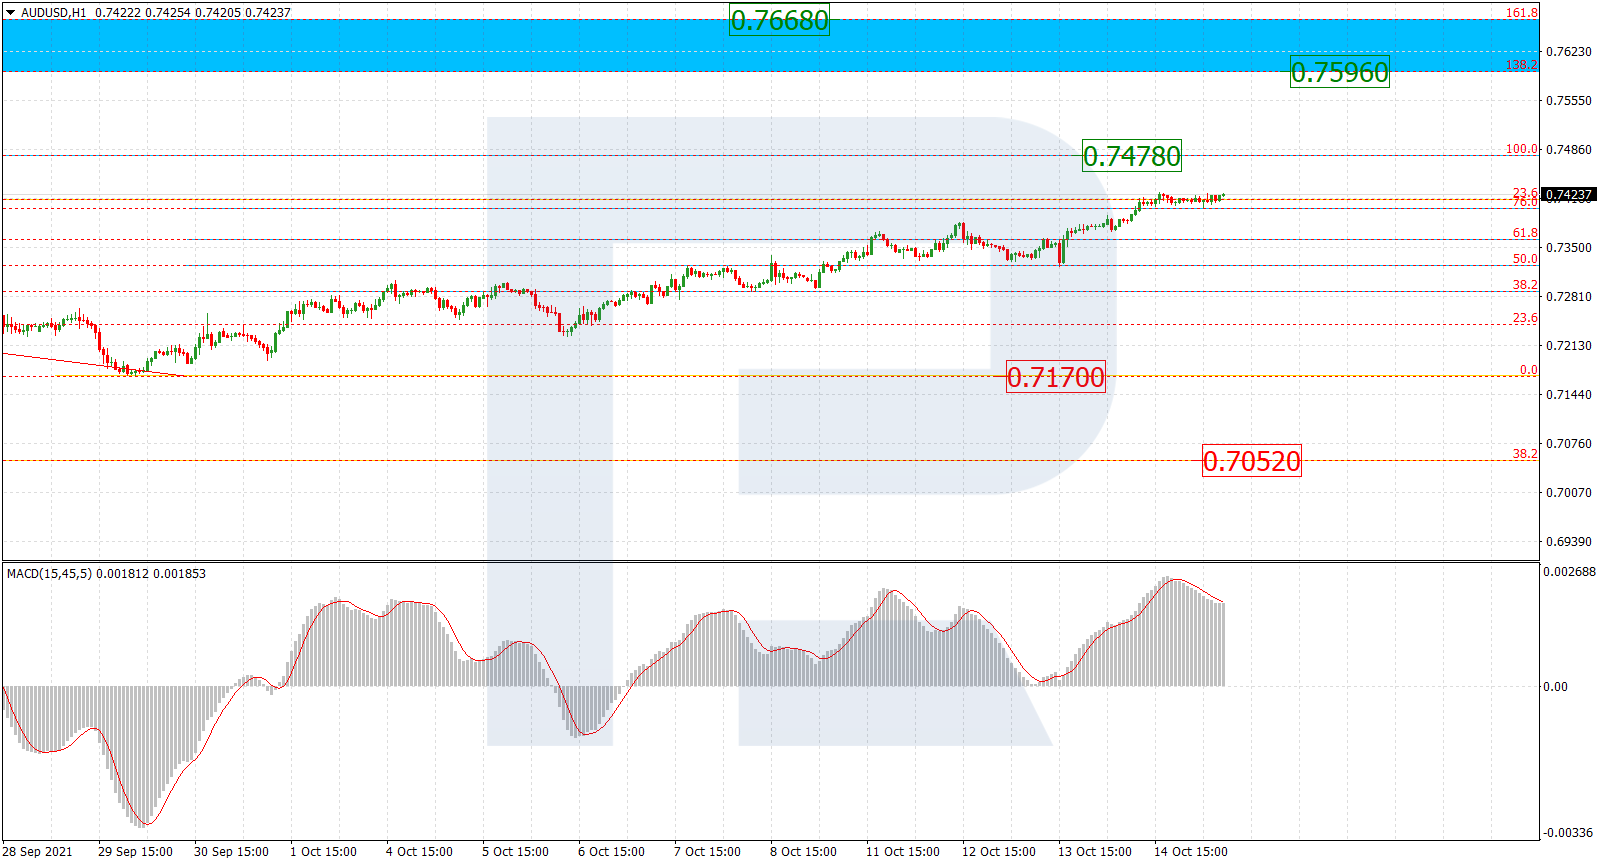
The H1 chart of AUDUSD shows that the current growth is testing 76.0% fibo and may later continue to reach the high at 0.7478. After breaking the high, UADUSD may continue growing towards the post-correctional extension area between 138.2% and 161.8% fibo at 0.7596 and 0.7668 respectively. The local support is the low at 0.7170.
Free Reports:
 Get our Weekly Commitment of Traders Reports - See where the biggest traders (Hedge Funds and Commercial Hedgers) are positioned in the futures markets on a weekly basis.
 Sign Up for Our Stock Market Newsletter – Get updated on News, Charts & Rankings of Public Companies when you join our Stocks Newsletter
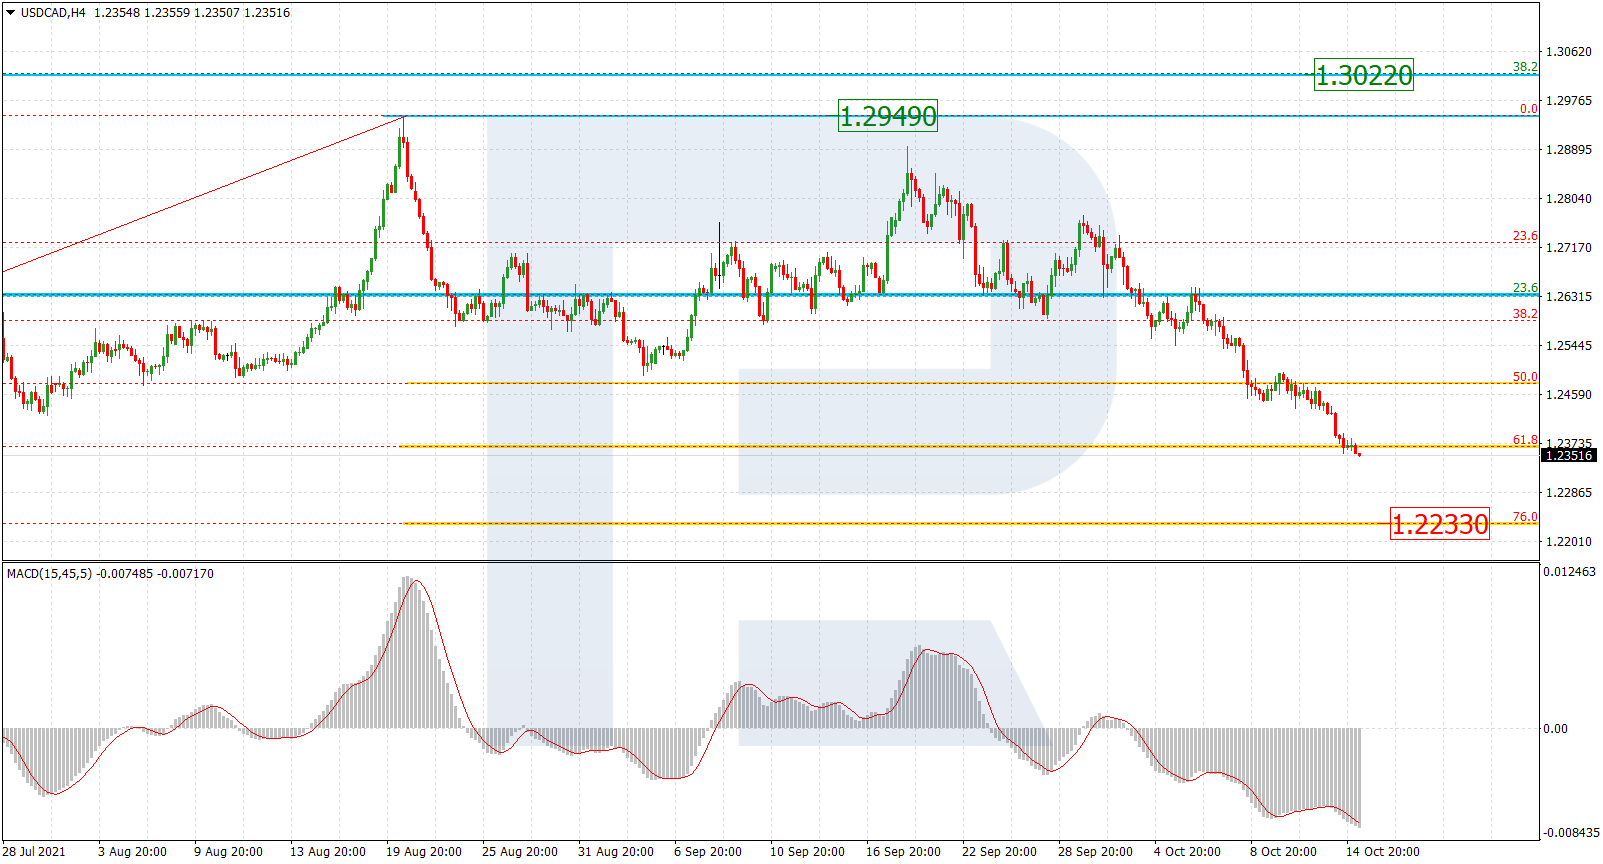
USDCAD, “US Dollar vs Canadian Dollar”
As we can see in the H4 chart, USDCAD has already reached 61.8% fibo and may later continue falling towards 76.0% fibo at 1.2233. After that, the asset may rebound from the latter level and forming a long-term ascending wave to reach the high at 1.2949, a breakout of which may result in a further uptrend towards 38.2% fibo at 1.3022.
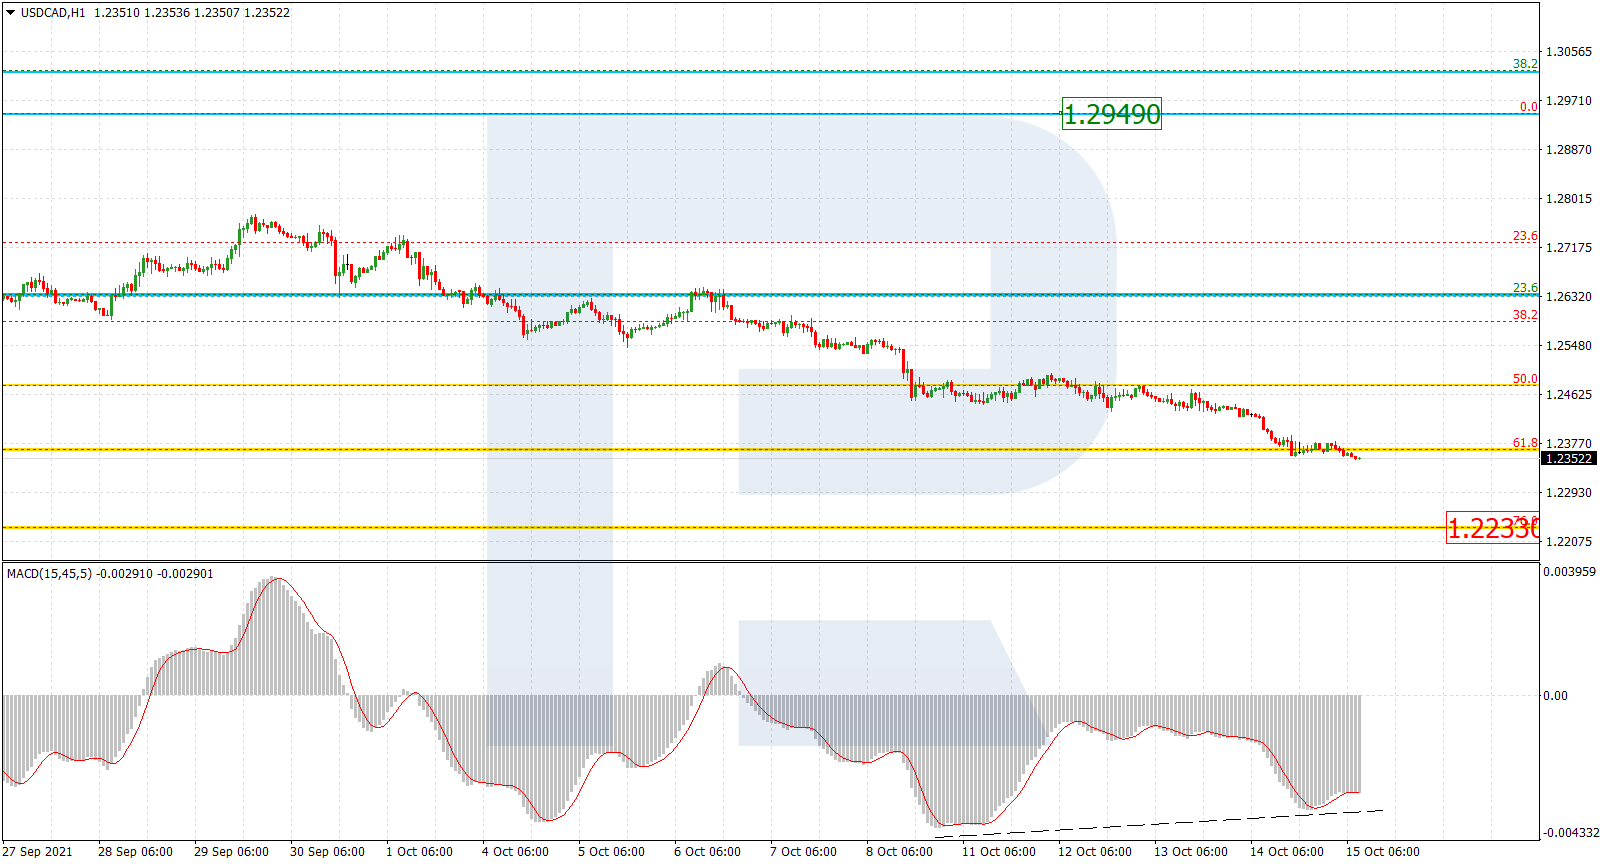
The H1 chart shows a more detailed structure of the current descending tendency towards 76.0% fibo at 1.2233. At the same time, there is convergence on MACD, which may indicate a possible rebound to the upside.
Article By RoboForex.com
Attention!
Forecasts presented in this section only reflect the author’s private opinion and should not be considered as guidance for trading. RoboForex LP bears no responsibility for trading results based on trading recommendations described in these analytical reviews.

- COT Metals Charts: Weekly Speculator Bets led by Copper & Steel Jul 18, 2026
- COT Bonds Charts: Weekly Speculator Bets led by 2-Year, SOFR 3M & 5-Year Bonds Jul 18, 2026
- COT Energy Charts: Weekly Speculator Bets led by Brent Oil & Heating Oil Jul 18, 2026
- COT Soft Commodities Charts: Weekly Speculator Bets led by Wheat, Corn & Soybean Meal Jul 18, 2026
- The Bank of Canada kept its interest rate unchanged. Platinum prices reached a three‑week high Jul 16, 2026
- Stock indices rose after the release of US inflation data. China’s GDP slowed sharply Jul 15, 2026
- GBP/USD Awaits Political News: What Will Happen Next Jul 15, 2026
- USD/JPY Holds at Highs: Pressure Lingers on Yen Jul 14, 2026
- Oil prices jumped 4% amid a new wave of escalation between the US and Iran Jul 13, 2026
- EUR/USD: US Inflation Will Determine Everything Jul 13, 2026