Archive for Forex and Currency News – Page 211

Mid-Week Technical Outlook: Pullbacks & Breakouts

Lukman Otunuga

By Lukman Otunuga Senior Research Analyst, ForexTime

There was some action across FX markets on Wednesday with major currencies swinging between losses and gains.

King dollar weakened across the board thanks to falling treasury yields while the Japanese Yen appreciated against its major counterparts amid the cautious mood. Interestingly, commodity currencies like the Australian dollar and Canadian dollar were able to maintain their gains. But the pound and euro traded lower against most other G10 currencies with the EURUSD wobbling above 1.16 as of writing.

A lot is going on in the FX space thanks to the fundamental drivers with some potential big moves on the horizon. Today, our focus will be on G10 currencies and as you can guess – our tool of choice is technical analysis.

EURUSD bears rev engines

Watch this space, as things could get spicy for the EURUSD over the next few days to weeks.

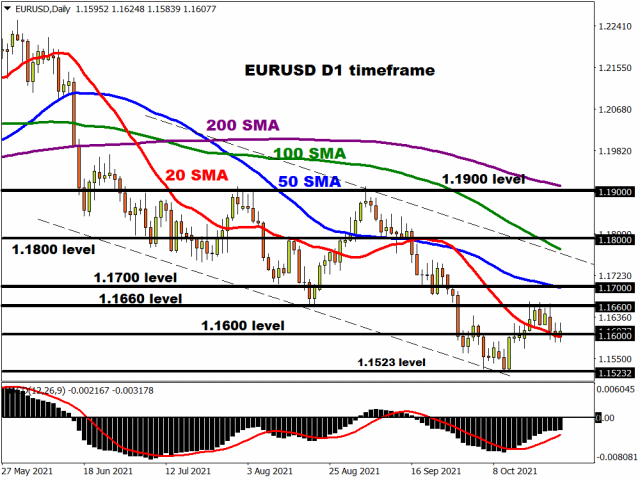
Prices are under pressure on the daily charts and currently respecting a bearish channel. The MACD trades below zero while the candlesticks are trading below the 200, 100, 50, and 20-day Simple Moving Averages. Sustained weakness below 1.1600 may encourage a decline towards 1.1523 and 1.1500, respectively. Should 1.1600 prove to be reliable support, a move back towards 1.1660 and 1.1700 could be on the cards.
GBPUSD approaches sticky territory

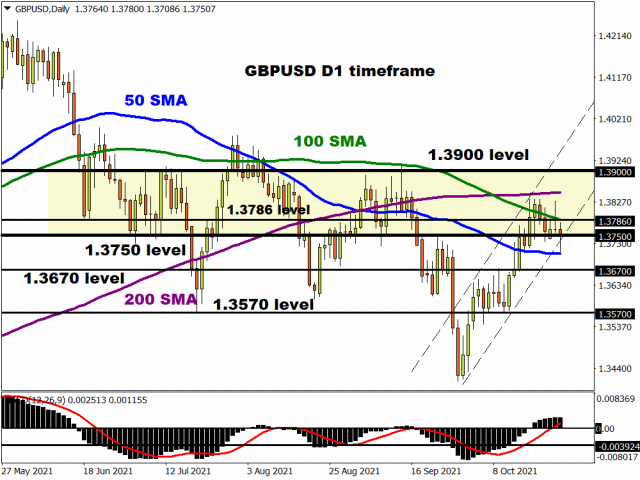
As the subtitle says, the GBPUSD is approaching a sticky range with support at 1.3750 and resistance at 1.3900. Should the 50 SMA prove to be reliable minor support, a breakout through 1.3750 could happen this week. But this is where things get interesting. Above 1.3750 resides the 100-day and 200-day Simple Moving Average, followed by the 1.3900 resistance. Bulls certainly have a tough road ahead with multiple walls of resistance to conquer.

Should prices fail to push back above 1.3750, prices may decline towards 1.3670 and 1.3570.
EURJPY pullback or breakdown?

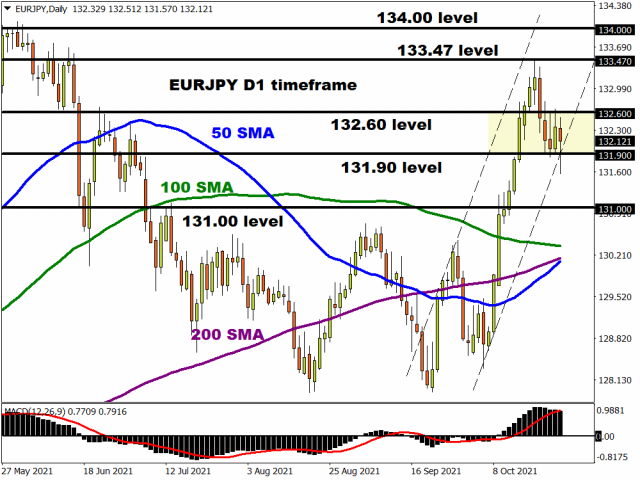
We already covered the fundamentals behind the EURJPY in our trade of the week. However, the technicals are raising some questions, especially after today’s choppy price action. We saw the EURJPY sink as low as 131.57 this afternoon before clawing back some small losses. Bulls and bears continue to fight for dominance and this continues to be reflected in price action. A range is forming with support around 131.90 and resistance at 132.60.

A solid daily close below 131.90 may trigger a breakdown with prices sinking towards 131.00 and 130.70. Alternatively, a strong back above 132.60 could open the doors towards 133.47 and 134.00.
NZDUSD eyes 0.7200

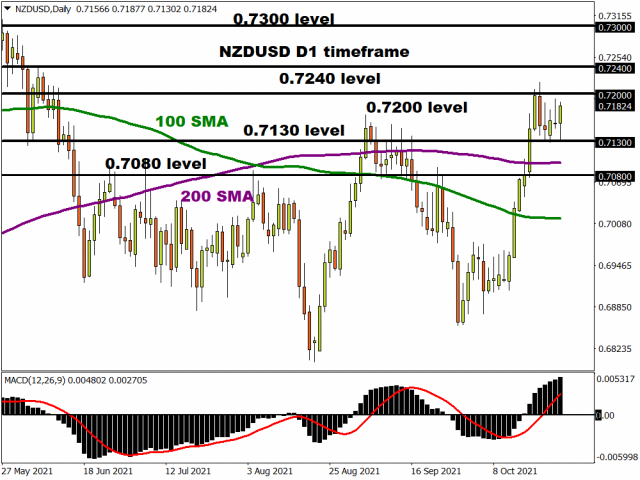
There is a classic breakout setup on the NZDUSD with the 0.7200 level acting as a key point of interest.

A solid breakout above 0.7200 may encourage a move towards 0.7240 and 0.7300. If 0.7200 proves to be a tough resistance to crack, prices may decline back towards 0.7130 and 0.7080.
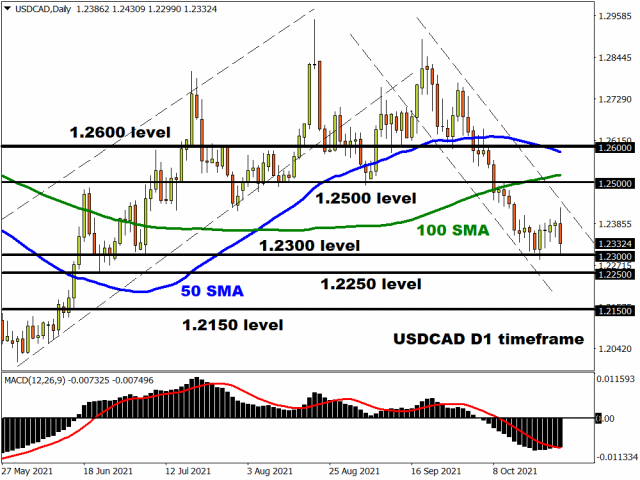
USDCAD knocks on 1.2300’s door…

It looks like USDCAD bears are hungry for the 1.2300 level. There have been consistently lower lows and lower highs while the MACD trades below zero. A strong daily close below 1.2300 may open the doors towards 1.2250 and 1.2150, respectively.
Disclaimer: The content in this article comprises personal opinions and should not be construed as containing personal and/or other investment advice and/or an offer of and/or solicitation for any transactions in financial instruments and/or a guarantee and/or prediction of future performance. ForexTime (FXTM), its affiliates, agents, directors, officers or employees do not guarantee the accuracy, validity, timeliness or completeness, of any information or data made available and assume no liability as to any loss arising from any investment based on the same.


Forex-Time-LogoArticle by ForexTime

ForexTime Ltd (FXTM) is an award winning international online forex broker regulated by CySEC 185/12 www.forextime.com

The Aussie is skyrocketing. Overview for 27.10.2021

Article By RoboForex.com

AUDUSD is rising and ready to update its local highs.

The Australian Dollar is steadily growing against the USD. The current quote for the instrument is 0.7527.

The statistics published today showed that the Australian CPI was 0.8% q/q in the third quarter, the same as expected. On YoY, the indicator showed 3.1%, which is below market expectations.

It’s rather unusual: basically, the world is fighting inflation boosts and deflation can be seen only in some particular countries, where it’s some kind of chronic disease of local economies. As for Australia, a stable monetary policy and the state’s consistent work with the labour market really pay off.

At the same time, one shouldn’t disregard the possibility of the economic slump in China, which, despite all issues of the last 18 months, remains Australia’s key trade and economic partner. There are a lot of talks on the global market right now relating to a possible slowdown in the Chinese GDP and that’s may have a serious influence on the Australian economy later.

Nevertheless, right now the AUD rate is quite bullish despite the fact that the USD is also pretty strong. We can even say that the current bullish impulse in the Aussie may get stronger and the instrument is on the way to updating its highs.

Article By RoboForex.com

Attention!
Forecasts presented in this section only reflect the author’s private opinion and should not be considered as guidance for trading. RoboForex LP bears no responsibility for trading results based on trading recommendations described in these analytical reviews.

Japanese Candlesticks Analysis 27.10.2021 (XAUUSD, NZDUSD, GBPUSD)

Article By RoboForex.com

XAUUSD, “Gold vs US Dollar”

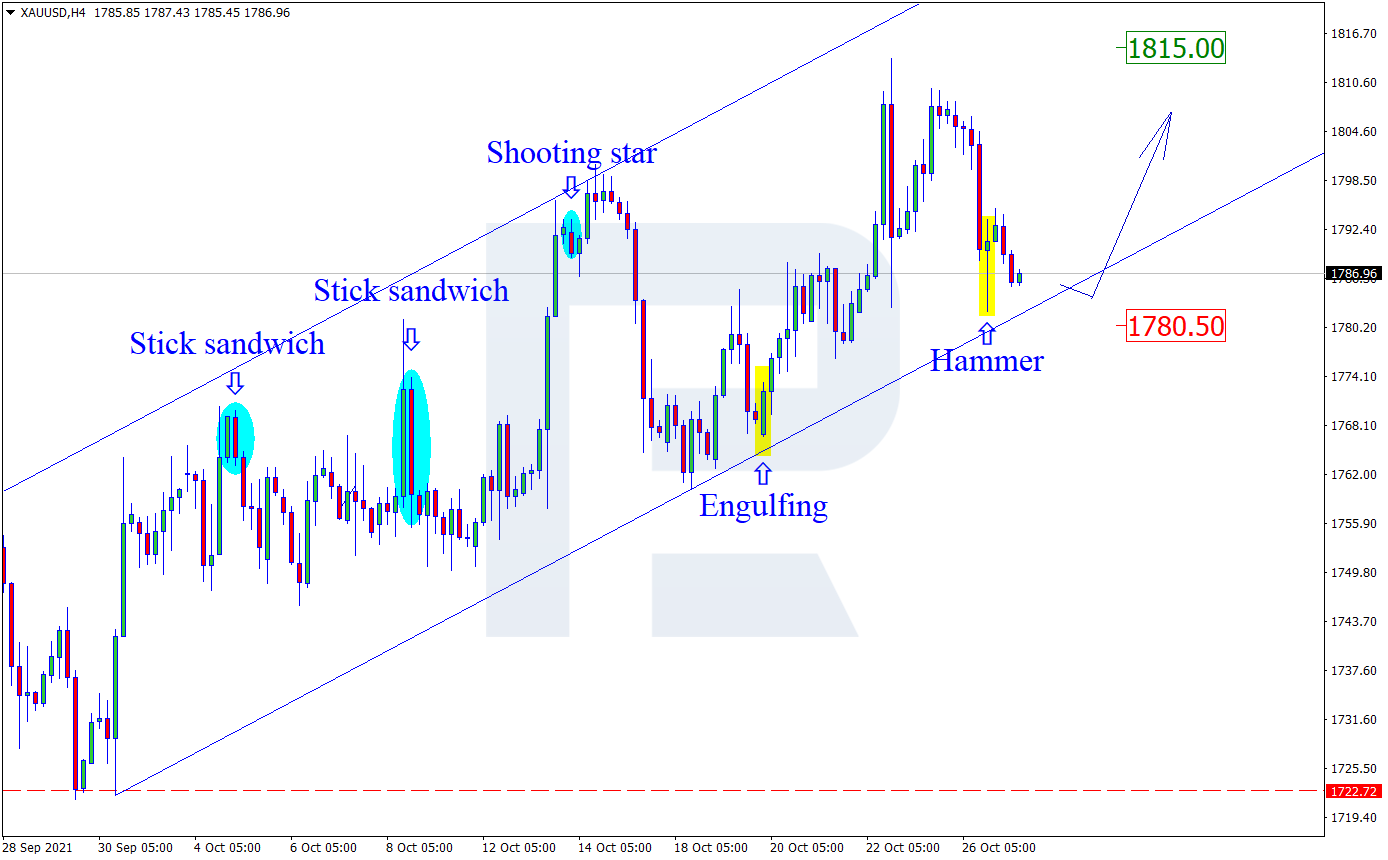
As we can see in the H4 chart, the asset is still correcting within the uptrends. After forming several reversal patterns, such as Hammer, not far from the support level, XAUUSD may reverse and form a new rising impulse. In this case, the upside target may be the resistance area at 1815.00. At the same time, an opposite scenario implies that the price may correct towards 1780.50 first and then resume trading upwards.

XAUUSD
Risk Warning: the result of previous trading operations do not guarantee the same results in the future

NZDUSD, “New Zealand vs US Dollar”

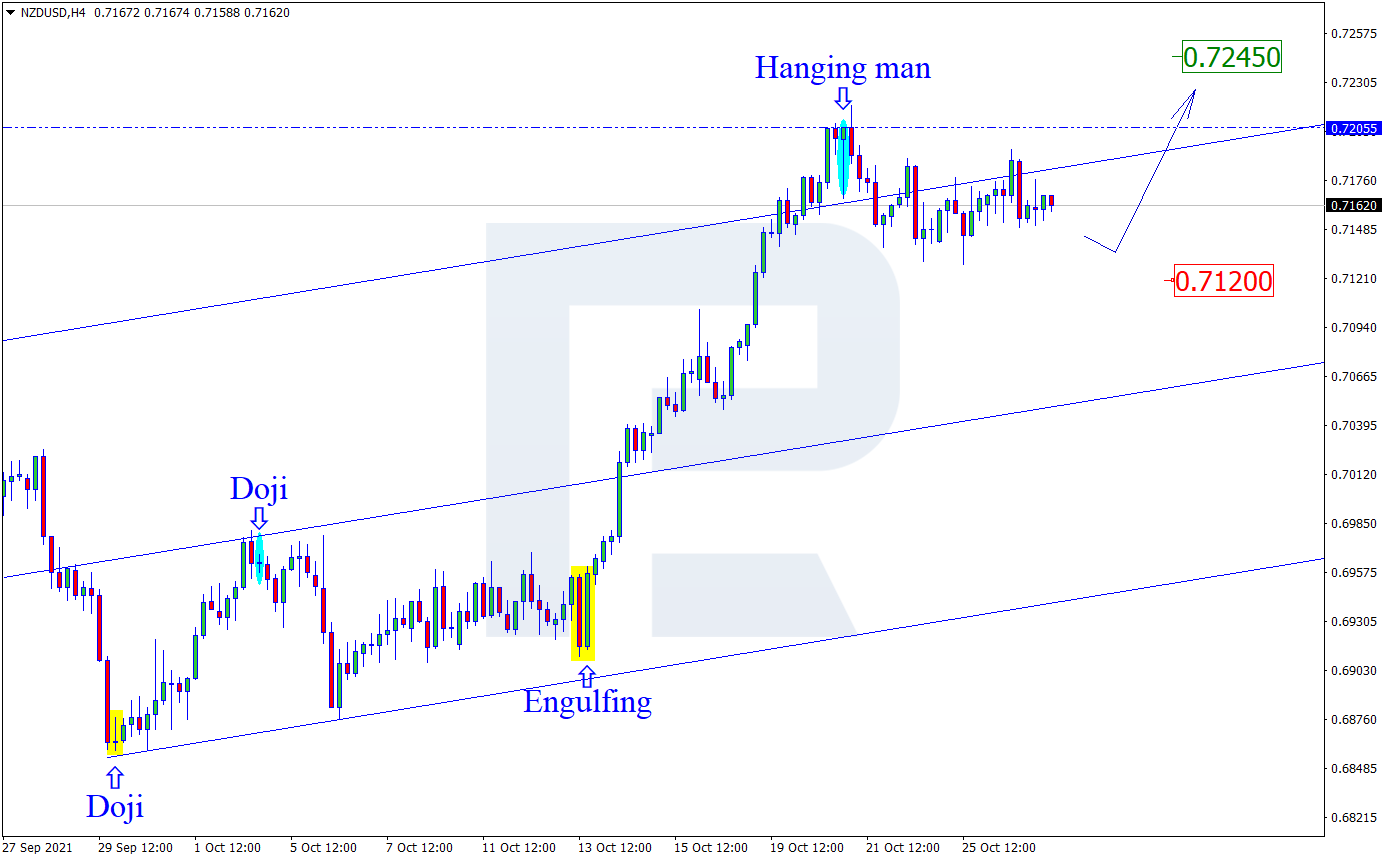
As we can see in the H4 chart, NZDUSD has formed several reversal patterns, such as Hanging Man, close to the resistance level. At the moment, the asset is reversing in the form of a new pullback. In this case, the correctional target may be the support area at 0.7120. After that, the asset may rebound from it and resume moving upwards. However, an alternative scenario implies that the price may grow to reach 0.7245 without any corrections towards the support area.

NZDUSD
Risk Warning: the result of previous trading operations do not guarantee the same results in the future

GBPUSD, “Great Britain Pound vs US Dollar”

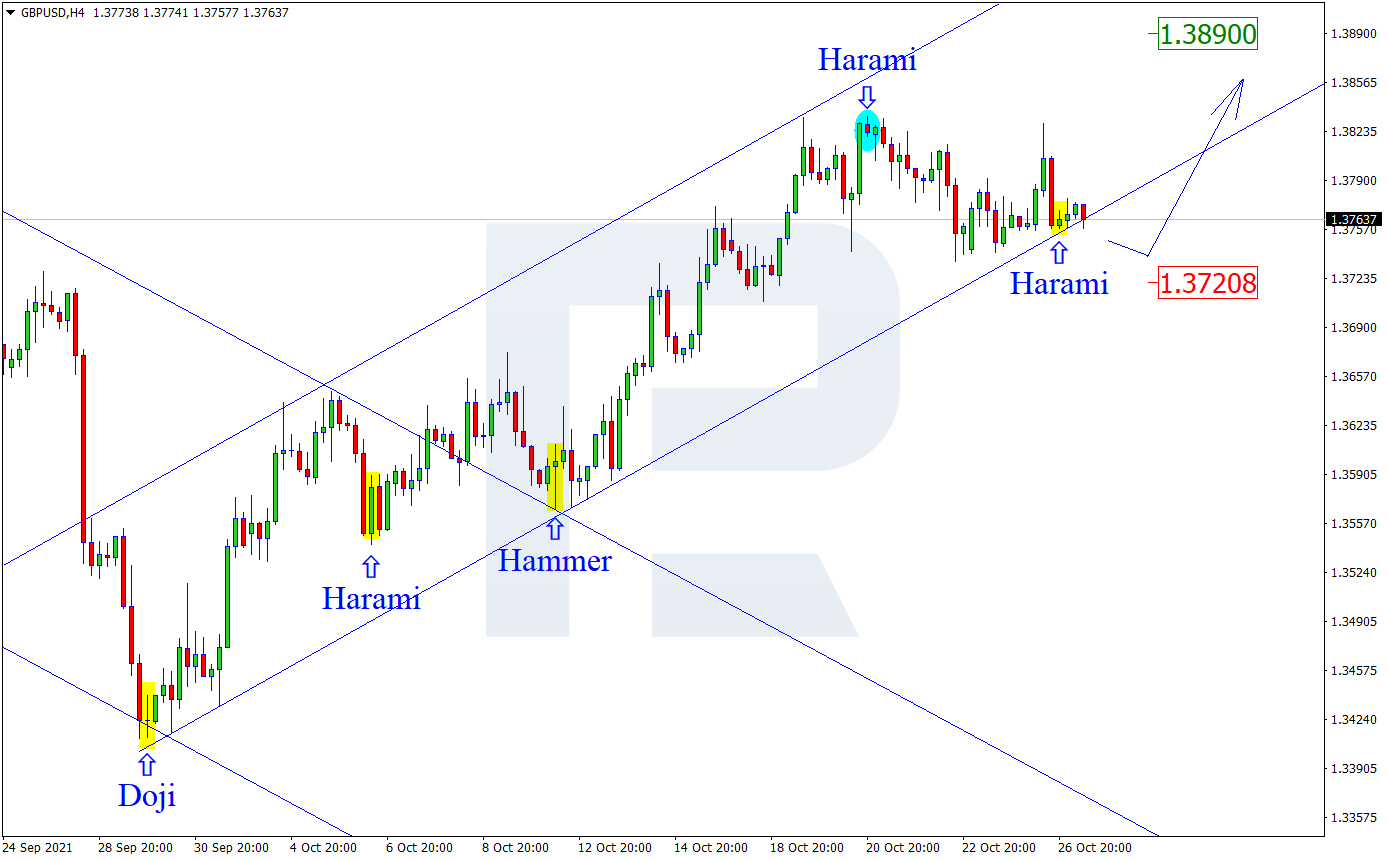
As we can see in the H4 chart, GBPUSD has formed several reversal patterns, such as Harami, not far from the support area. At the moment, the pair may reverse and resume growing. In this case, the upside target may be at 1.3890. After testing the resistance level, the market may break it and continue trading upwards. Still, there might be an alternative scenario, according to which the asset may correct towards 1.3720 before resuming the ascending tendency.

GBPUSD

Article By RoboForex.com

Attention!
Forecasts presented in this section only reflect the author’s private opinion and should not be considered as guidance for trading. RoboForex LP bears no responsibility for trading results based on trading recommendations described in these analytical reviews.

Intraday Market Analysis – USD Struggles To Bounce

By Orbex

AUDUSD consolidates gains

AUDUSD

The Australian dollar rallied after Q3 inflation exceeded expectations.

A bullish MA cross on the daily chart indicates an acceleration in the upward movement. Pullbacks are likely to attract a ‘buy the dips’ crowd.

The pair has been consolidating its recent gains above 0.7450, a former major resistance that has turned into support. A close above 0.7545 may extend the rally to last July’s high at 0.7610.

On the downside, a deeper retracement would test the demand area between 0.7380 and the psychological level of 0.7400.

USDNOK maintains bearish trend

USDNOK

The Norwegian krone keeps the high ground supported by continued strength in oil prices.

Sentiment has remained downbeat after a break below the daily support at 8.4700. Rebounds have so far been checked by solid selling interest.

The current sideways action under 8.4100 could be another phase of distribution. Then the bears would be pushing towards June’s low at 8.2400, the last support before reaching this year’s low at 8.1500.

8.4800 near the 20-day moving average would be the second resistance in case of a bullish attempt.

UK 100 resumes rally

UK100

The FTSE 100 breaks higher as confidence grew after fresh highs on Wall Street. The rally above August’s high at 7220 is an indication of a strong commitment from the long side.

Breakout candles and a bullish MA cross confirm that the uptrend has resumed. The index is now on its way to the pre-pandemic level around 7550.

7350 would be an intermediate hurdle as an overbought RSI may trigger some profit-taking. 7220 has become fresh support if the bulls need to catch their breath.


Orbex-LogoArticle by Orbex

Orbex is a fully licensed broker that was established in 2011. Founded with a mission to serve its traders responsibly and provides traders with access to the world’s largest and most liquid financial markets. www.orbex.com

Murrey Math Lines 26.10.2021 (AUDUSD, NZDUSD)

Article By RoboForex.com

AUDUSD, “Australian Dollar vs US Dollar”

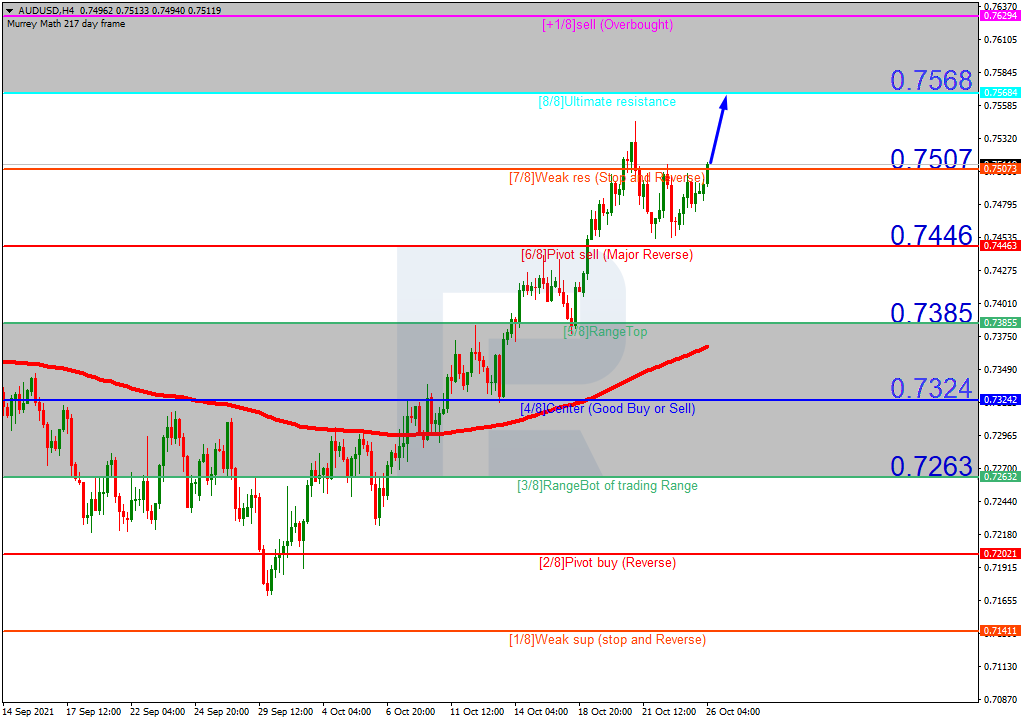
In the H4 chart, AUDUSD is trading above the 200-day Moving Average, thus indicating an ascending tendency. In this case, the price is expected to continue moving upwards to reach the resistance at 8/8. However, this scenario may no longer be valid if the price breaks 6/8 to the downside. After that, the instrument may reverse and fall towards the support at 5/8.

AUDUSDH4
Risk Warning: the result of previous trading operations do not guarantee the same results in the future

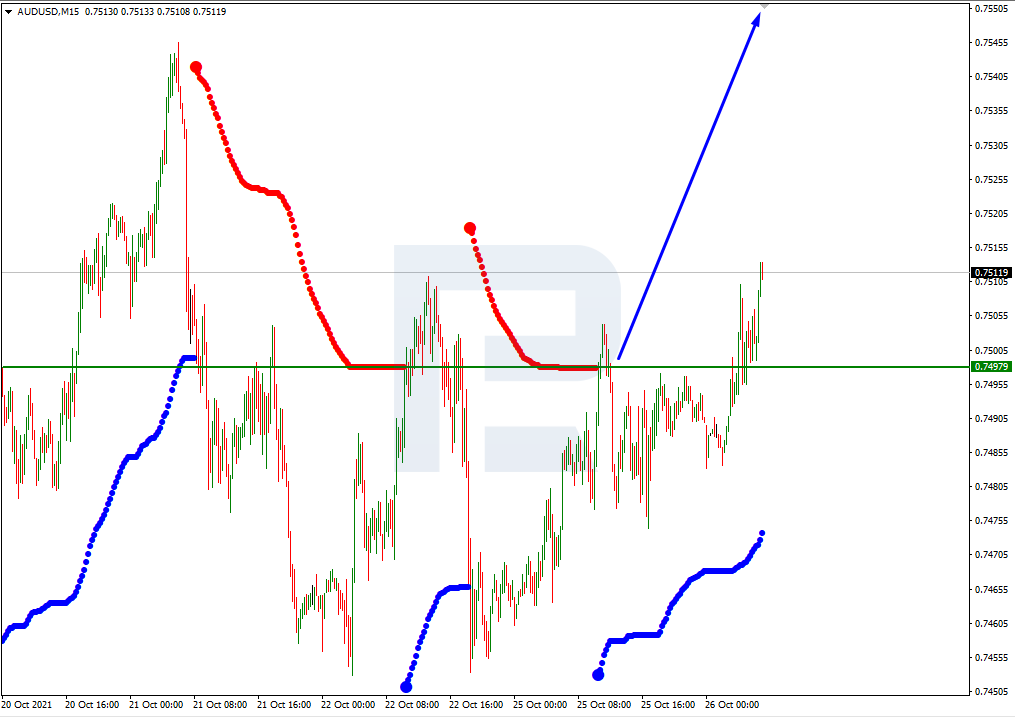
As we can see in the M15 chart, the pair has broken the upside line of the VoltyChannel indicator and, as a result, may continue trading upwards.

AUDUSD_M15
Risk Warning: the result of previous trading operations do not guarantee the same results in the future

NZDUSD, “New Zealand Dollar vs US Dollar”

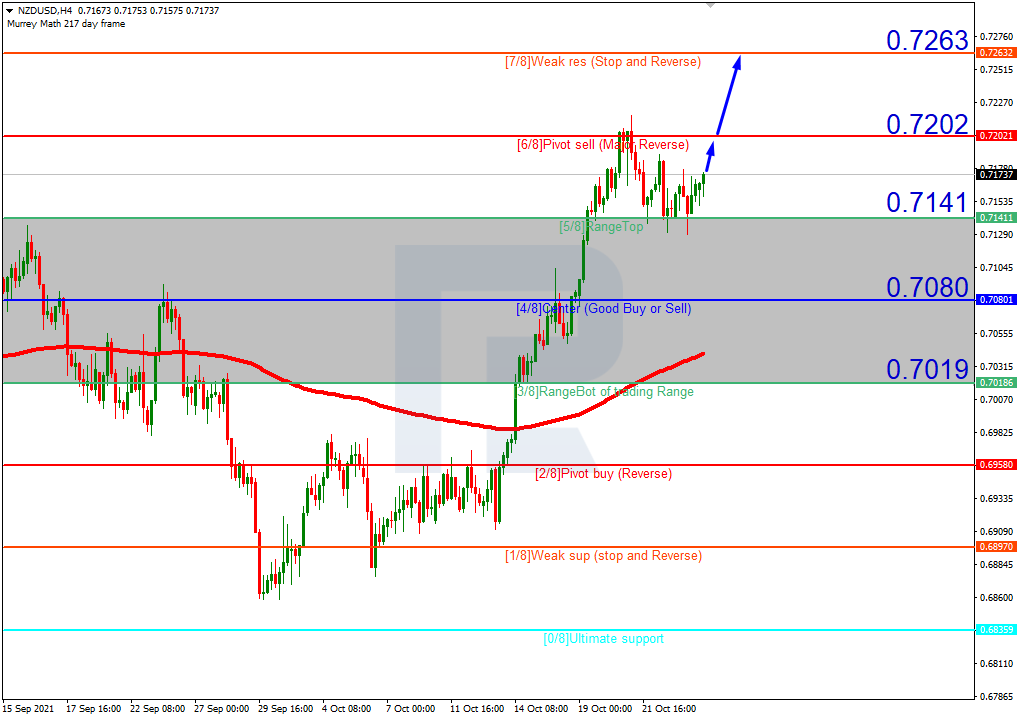
As we can see in the H4 chart, NZDUSD is trading above the 200-day Moving Average, thus indicating an ascending tendency. In this case, the price is expected to test 6/8, break it, and continue growing to reach the resistance at 7/8. However, this scenario may no longer be valid if the price breaks 5/8 to the downside. In this case, the instrument may correct towards the support at 4/8.

NZDUSD_H4
Risk Warning: the result of previous trading operations do not guarantee the same results in the future

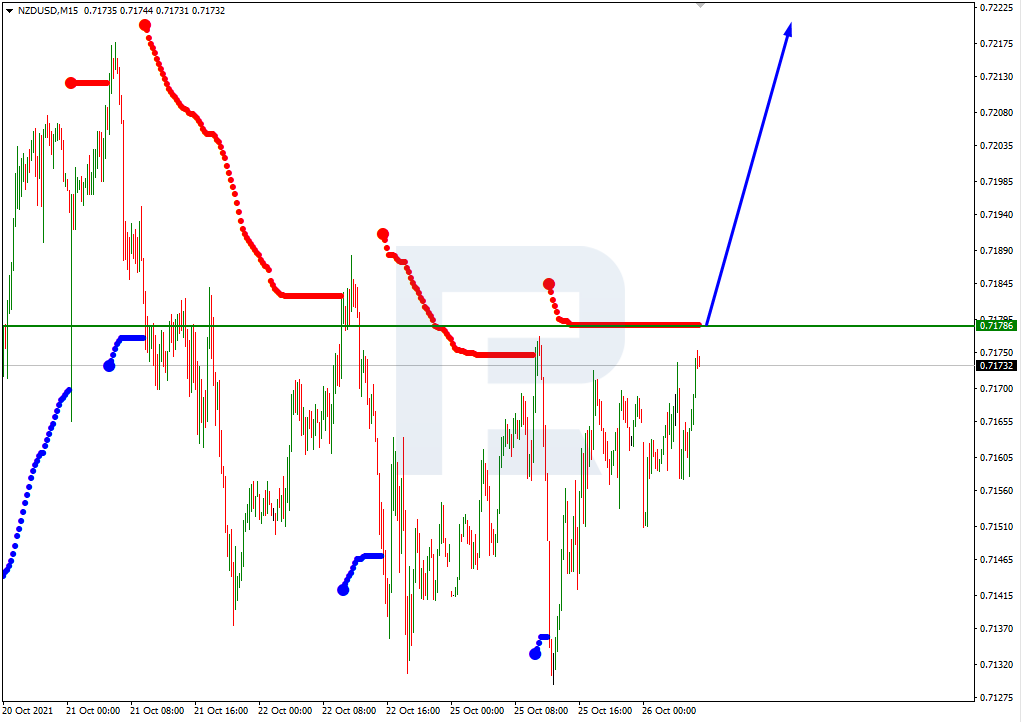
In the M15 chart, the pair may break the upside line of the VoltyChannel indicator and, as a result, continue its growth.

NZDUSD_M15

Article By RoboForex.com

Attention!
Forecasts presented in this section only reflect the author’s private opinion and should not be considered as guidance for trading. RoboForex LP bears no responsibility for trading results based on trading recommendations described in these analytical reviews.

Forex Technical Analysis & Forecast 26.10.2021

Article By RoboForex.com

EURUSD, “Euro vs US Dollar”

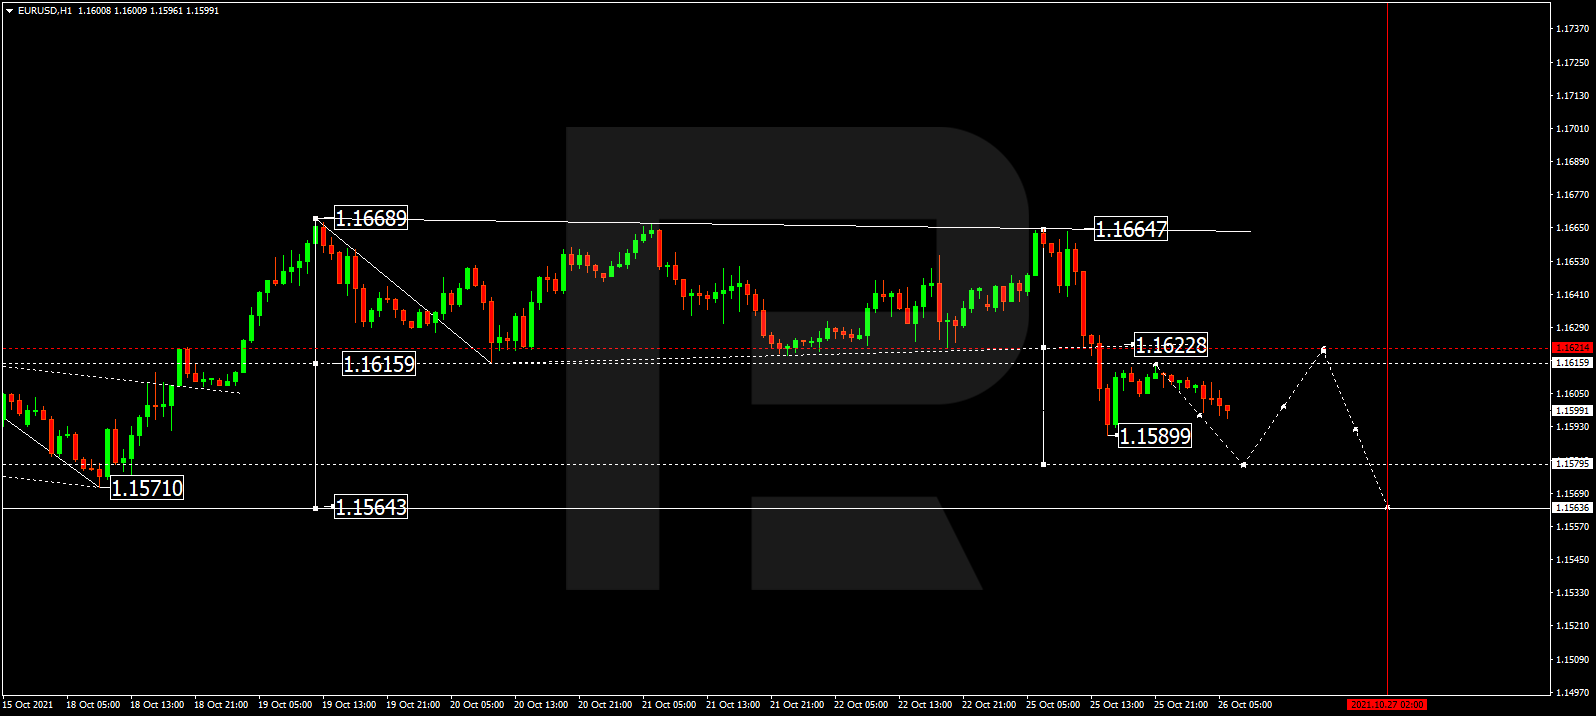
After rebounding from 1.1664 and then reaching the downside border of the range at 1.1622, EURUSD has broken the latter level; right now, it is still falling towards 1.1565. Possibly, today the pair may reach it and then start a new correction to test 1.1620 from below. Later, the market may resume trading downwards with the target at 1.1565.

EURUSD
Risk Warning: the result of previous trading operations do not guarantee the same results in the future

GBPUSD, “Great Britain Pound vs US Dollar”

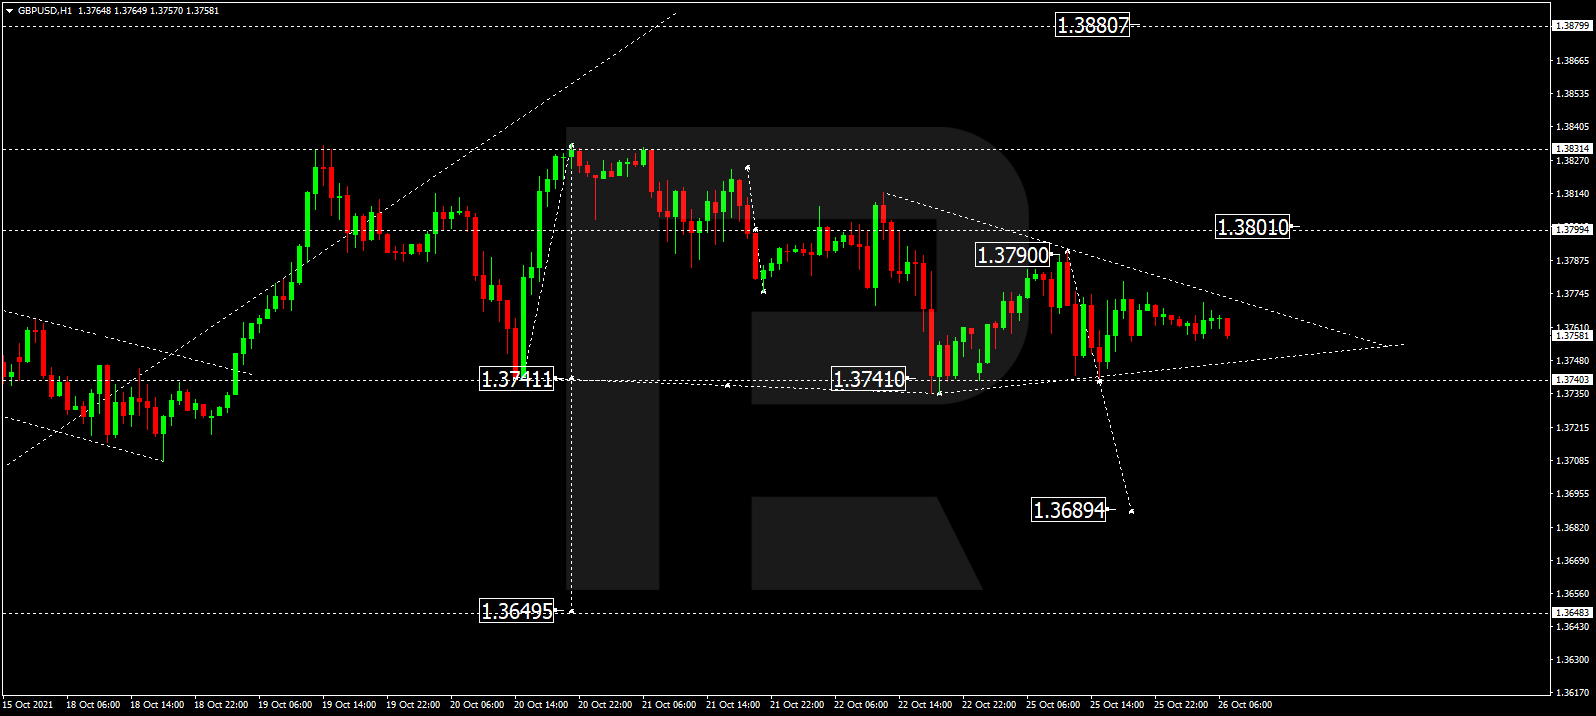
After completing the ascending wave at 1.3790 along with the correction at 1.3741, GBPUSD is consolidating between these two levels. Possibly, the pair may break the latter level to the downside and resume falling 1.3689. After that, the instrument may return to test 1.3740 from below and then resume trading downwards with the target at 1.3650.

GBPUSD
Risk Warning: the result of previous trading operations do not guarantee the same results in the future

USDRUB, “US Dollar vs Russian Ruble”

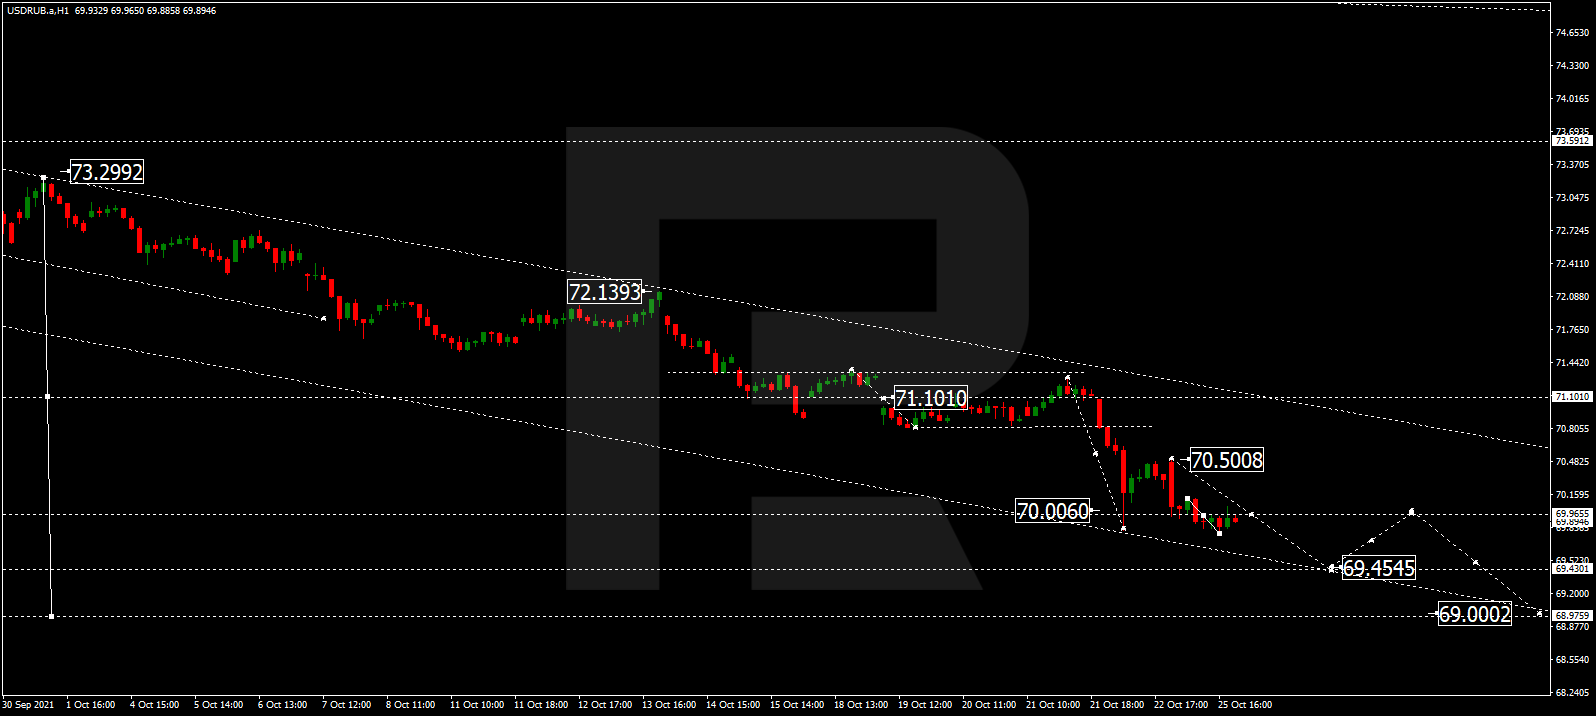
USDRUB is consolidating around 70.00. Today, the pair may form a new descending structure towards 69.45 and then start another correction to test 70.00 from below. After that, the instrument may resume falling within the downtrend with the target at 69.00.

USDRUB
Risk Warning: the result of previous trading operations do not guarantee the same results in the future

USDJPY, “US Dollar vs Japanese Yen”

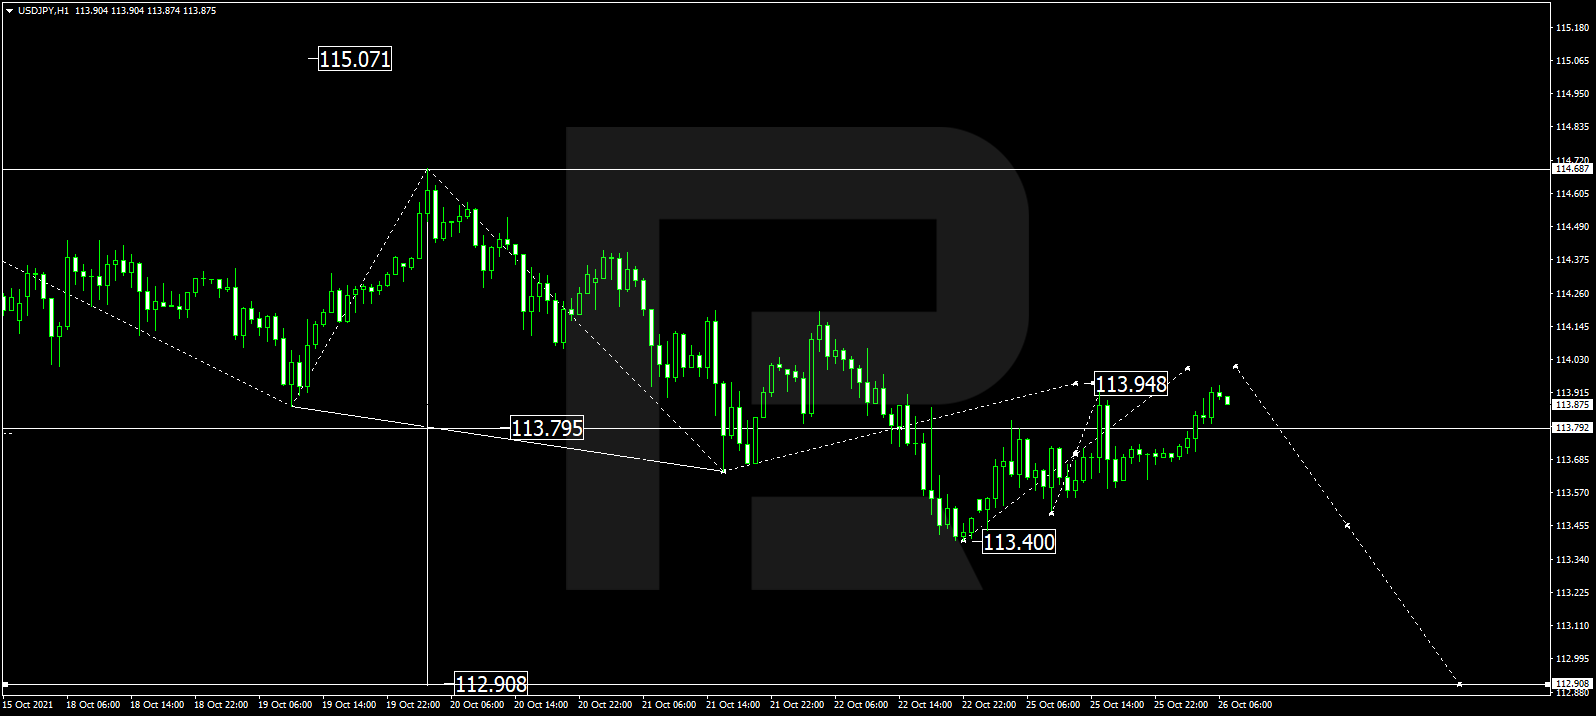
USDJPY is still correcting towards 113.95. Later, the market may resume trading downwards with the first target at 112.90.

USDJPY
Risk Warning: the result of previous trading operations do not guarantee the same results in the future

USDCHF, “US Dollar vs Swiss Franc”

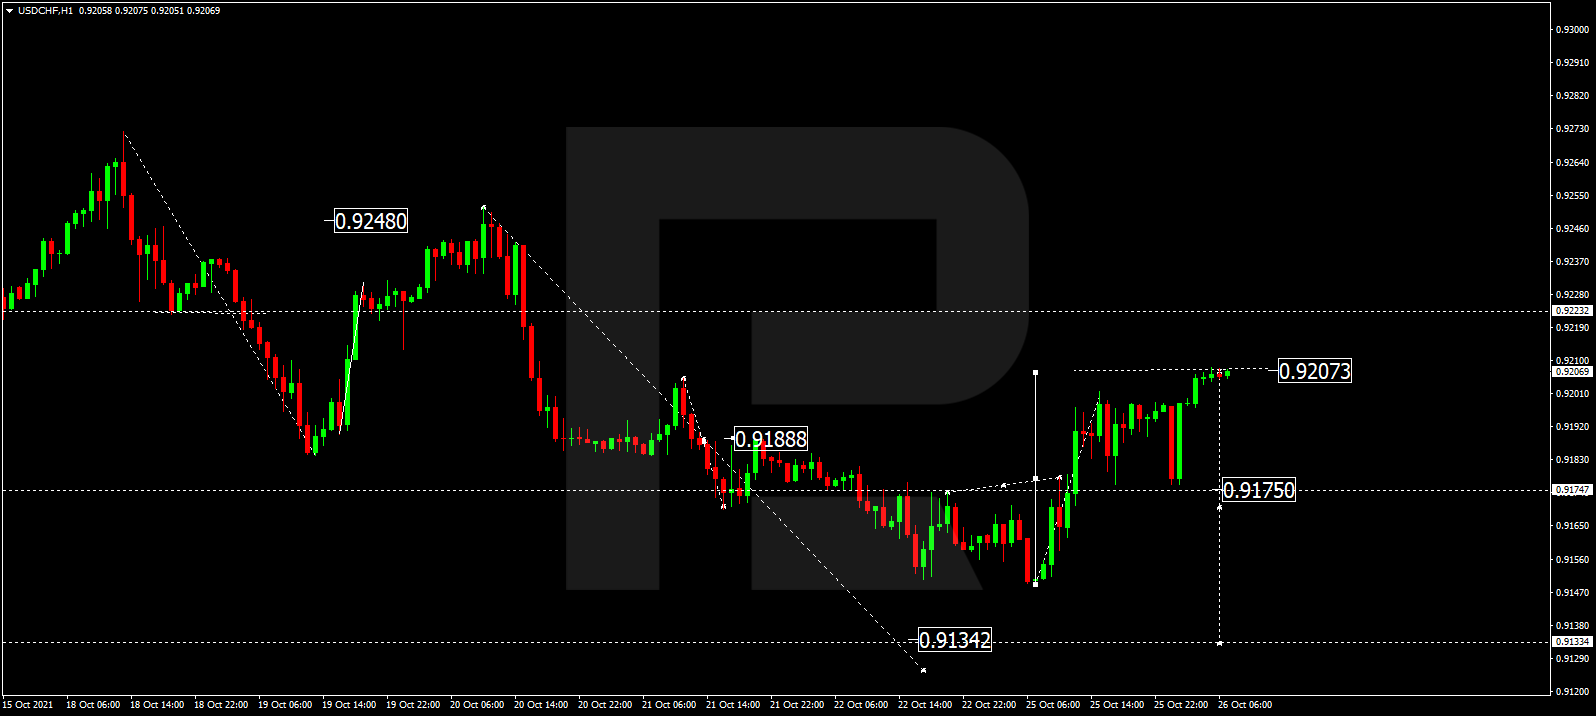
After forming a new consolidation range around 0.9175, USDCHF has broken it to the upside and may later grow towards 0.9207. After that, the instrument may form a new descending structure with the target at 0.9134.

USDCHF
Risk Warning: the result of previous trading operations do not guarantee the same results in the future

AUDUSD, “Australian Dollar vs US Dollar”

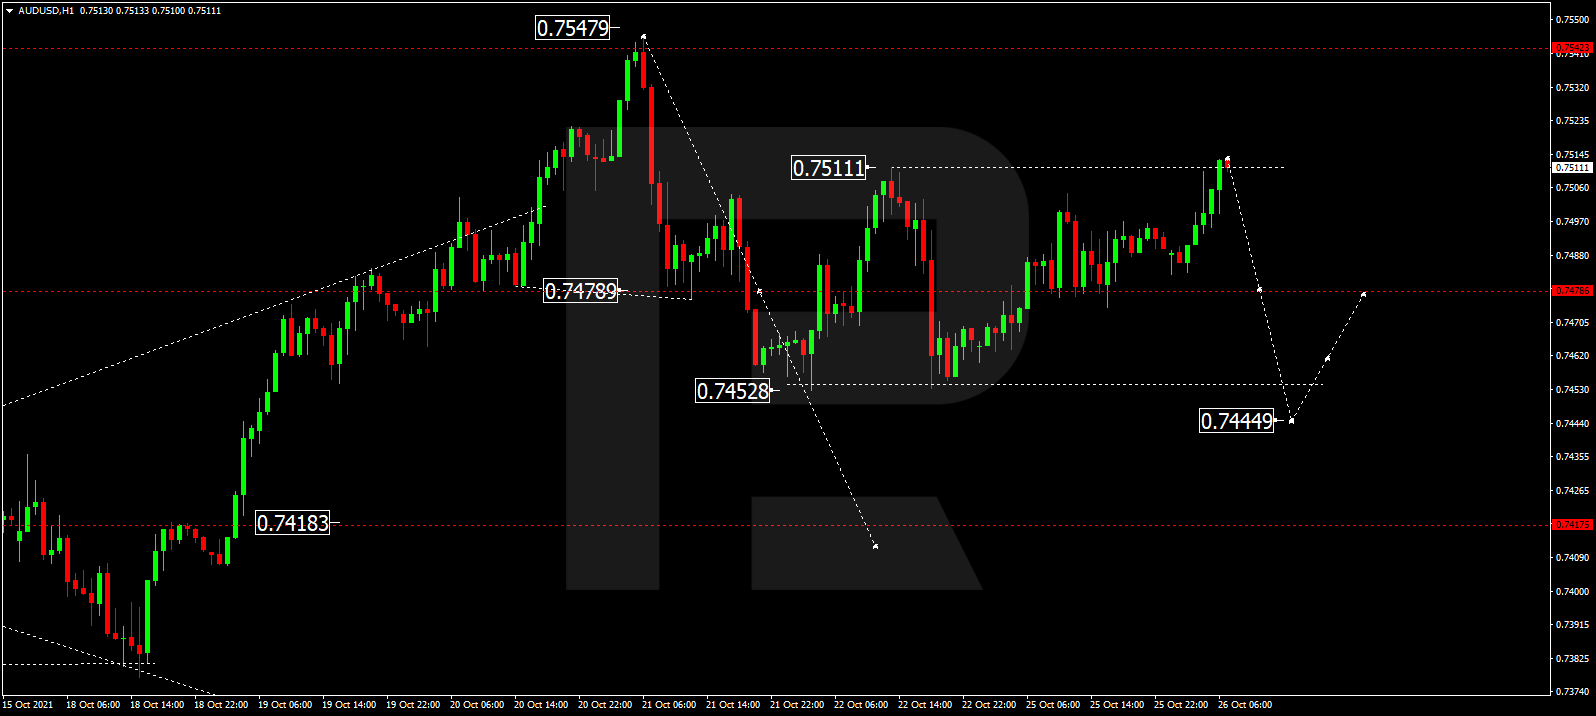
AUDUSD is still consolidating around 0.7482. Today, the pair may grow to reach 0.7511 and then fall to return to 0.7447. Later, the market may break the level to the downside and start a new decline the target at 0.7418.

AUDUSD
Risk Warning: the result of previous trading operations do not guarantee the same results in the future

BRENT

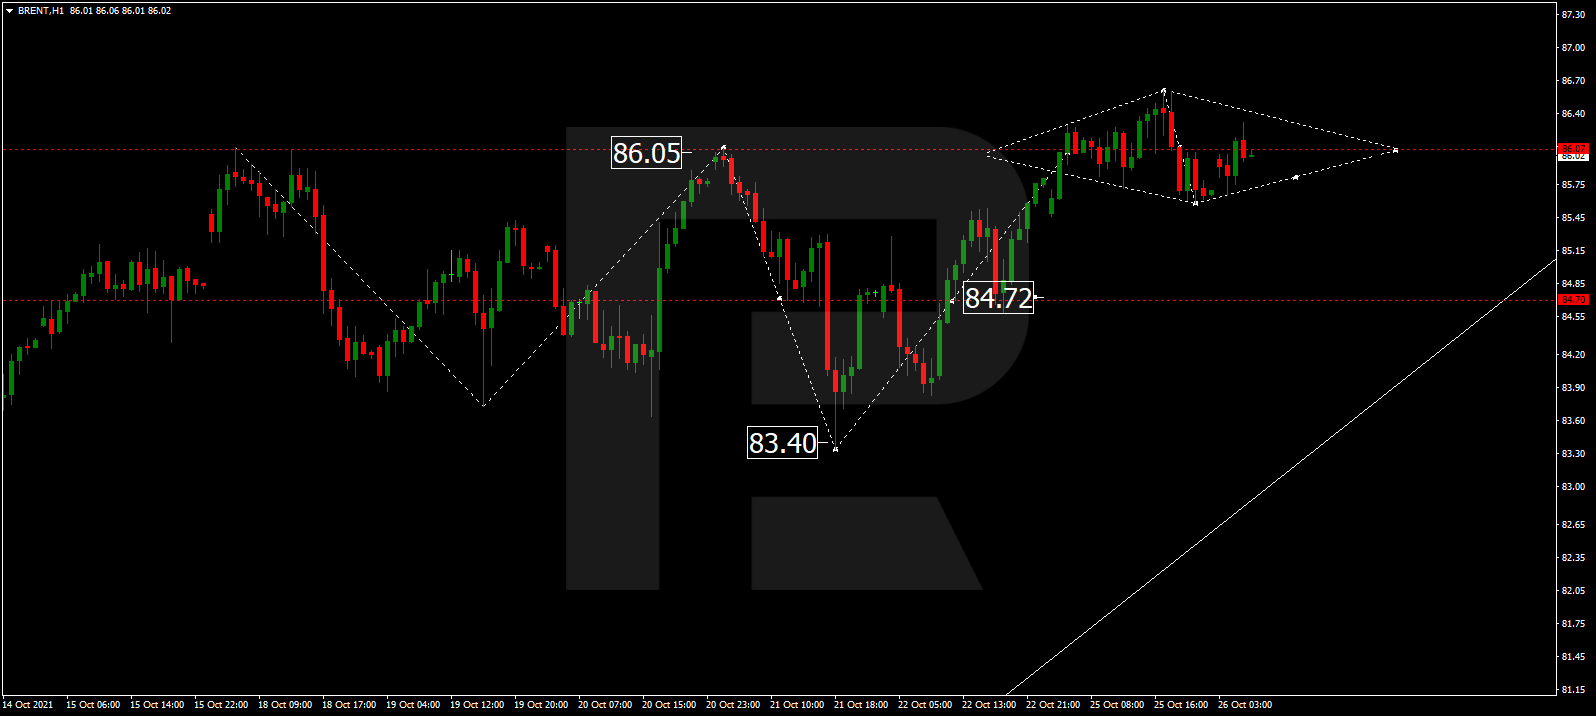
Brent is still consolidating around 86.05. If later the price breaks this range to the upside, the market may resume trading within the uptrend with the target at 88.00; if to the downside – start a new correction towards 84.70 and then form one more ascending structure to reach the above-mentioned target.

BRENT
Risk Warning: the result of previous trading operations do not guarantee the same results in the future

XAUUSD, “Gold vs US Dollar”

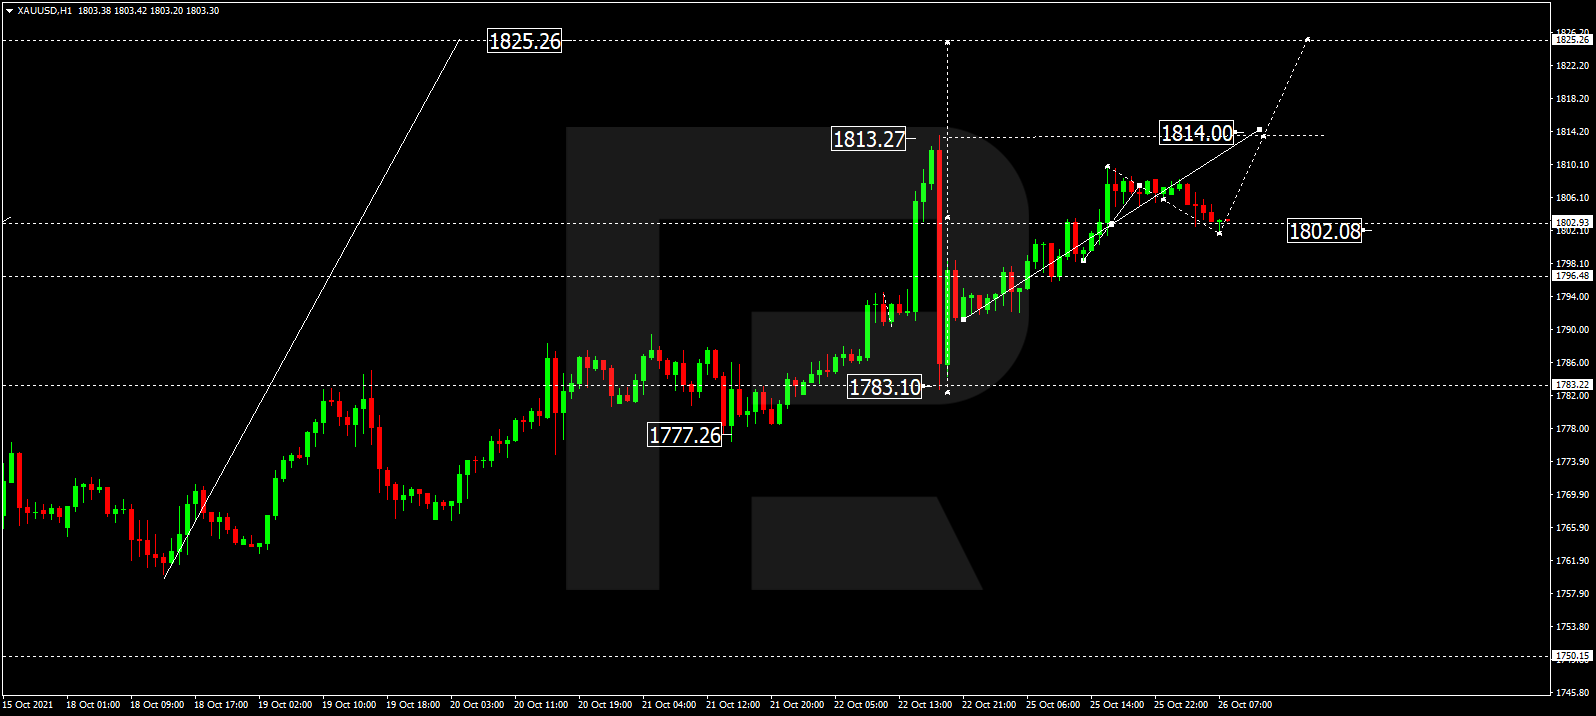
After completing the ascending structure, Gold is forming a new consolidation range around this level. If later the price breaks this range to the upside, the market may resume trading within the uptrend with the target at 1814.00. After breaking this level as well, the instrument may continue growing towards 1825.35.

GOLD
Risk Warning: the result of previous trading operations do not guarantee the same results in the future

S&P 500

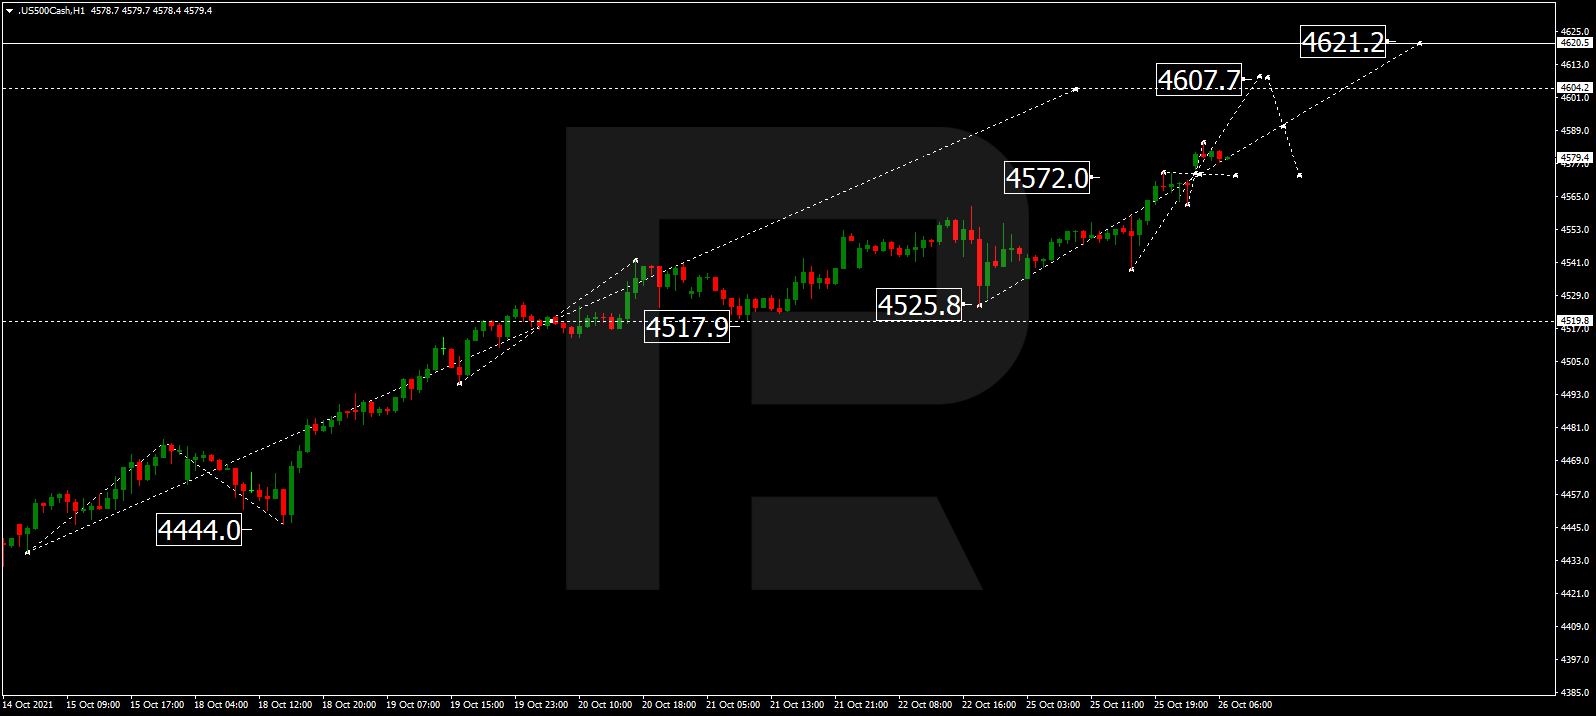
The S&P index continues trading upwards; it has already reached 4672.0 and is currently consolidating around this level. Possibly, the asset may resume growing to reach 4607.7. On the other hand, if the price falls and breaks 4565.0, the instrument may start a new correction with the target at 4517.9.

S&P 500

Article By RoboForex.com

Attention!
Forecasts presented in this section only reflect the author’s private opinion and should not be considered as guidance for trading. RoboForex LP bears no responsibility for trading results based on trading recommendations described in these analytical reviews.

GBPUSD Cycle Wave Y Hints At Double Zigzag

By Orbex

The current structure of the GBPUSD pair suggests a large cycle double w-x-y zigzag in the long term.

It is likely that the cycle intervening wave x has come to an end. It consists of primary sub-waves Ⓦ-Ⓧ-Ⓨ and has the form of a double zigzag.

From the beginning of October to the present day, the price rises within the initial part of the actionary wave y. This can take the form of a primary double zigzag Ⓦ-Ⓧ-Ⓨ, as shown on the chart.

The price could rise above the high of 1.3986, which was marked by the primary intervening wave Ⓧ.

GBPUSD

An alternative scenario shows that the construction of the cycle wave x will continue. Its final primary wave Ⓨ could be more complex in structure than in the first scenario. And it may take the form of an intermediate triple zigzag (W)-(X)-(Y)-(X)-(Z).

In the short term, the pair could decline in the intermediate wave (Z) near 1.330. At that level, primary actionary sub-waves Ⓨ and Ⓦ will be equal.

Then the cycle wave y can send the market above the high of 1.391.


Orbex-LogoArticle by Orbex

Orbex is a fully licensed broker that was established in 2011. Founded with a mission to serve its traders responsibly and provides traders with access to the world’s largest and most liquid financial markets. www.orbex.com

Intraday Market Analysis – USD Sees Limited Rebound

By Orbex

USDCHF tests resistance

USDCHF

The US dollar inched higher after Fed Chairman Jerome Powell commented that it was time to taper. A bearish MA cross on the daily chart weighs on overall sentiment.

Nonetheless, the pair has found some buying interest in the short-term over the daily support at 0.9150. A bullish RSI divergence was the first sign that the downward pressure might have eased for now.

A break above 0.9200 would prompt sellers to cover, opening up the path to the key resistance at 0.9250. A bearish breakout would send the price to 0.9100.

NZDUSD seeks support

NZDUSD

The US dollar recovers across the board thanks to rising Treasury yields. The Kiwi’s breakout above the daily resistance at 0.7150 may have put it back on a bullish trajectory.

However, a repeatedly overbought RSI and its bearish divergence indicate that the bulls have struggled to follow up.

Buyers are likely to be waiting on the sidelines and a pullback towards 0.7080 could be an opportunity. 0.7020 would be the second line of defense in case of a deeper correction.

A rebound above 0.7185 may resume the rally.

NAS 100 aims at an all-time high

US100

The Nasdaq 100 bounced higher as investors hope to see solid earnings from the Big Tech companies.

The index has consolidated its recent gains after it broke above the daily resistance at 15400. The bulls have pushed above the major step at 15550 which was the origin of the September sell-off. This would take out the selling interest and put the uptrend back on track.

The all-time high at 15700 is the next resistance. An overbought RSI may cause a temporary pullback to 15280 where the bulls may look to accumulate.


Orbex-LogoArticle by Orbex

Orbex is a fully licensed broker that was established in 2011. Founded with a mission to serve its traders responsibly and provides traders with access to the world’s largest and most liquid financial markets. www.orbex.com

Trade Of The Week: EURJPY – Battle Of The Doves

Lukman Otunuga

By Lukman Otunuga Senior Research Analyst, ForexTime

Grab your popcorn and find a seat, because this could be an eventful week for the euro & yen.

All eyes will be on the Bank of Japan (BOJ) and European Central Bank (ECB) meeting on Thursday.

Both central banks are notoriously dovish and are expected to leave monetary policy unchanged. However, it may be unwise to label these events as snoozers given the rising inflationary pressures in Europe and concerns around Japan’s economic outlook.

Before we discuss what to expect on Thursday, it is worth keeping in mind that the Euro has depreciated against almost every single G10 currency this month, excluding the dollar and Japanese Yen.

October has also been rough and rocky for the yen, which is down against all its major counterparts as of writing.

Given how our focus is on the ECB and BOJ meeting, our trade of the week will be the EURJPY which up 2.8% in October.

The EURJPY is certainly bullish on the daily timeframe as there have been consistently higher highs and higher lows. However, bears seem to be lingering in the vicinity with prices wobbling above 132.0 as of writing.

What to expect from Thursday’s BOJ meeting

If you are based in the United Kingdom or European timezone, the BOJ policy meeting usually ends in the early hours of the morning.

Markets widely expected the central bank to leave monetary policy unchanged. As inflation rages on across the world, Japan is still fighting an ongoing battle against deflation. Investors will direct their attention towards the BOJ’s latest quarterly growth and price forecasts. There has been speculation over the central bank downgrading its economic growth forecast for the fiscal year thanks to rising import costs and supply bottlenecks. Inflation forecasts are also expected to be downgraded despite Japan’s core consumer prices rising in September for the first time in 18 months.

The yen may weaken if economic growth and price forecasts are downgraded, with further losses on the card if the statement strikes a dovish tone.

How about the ECB meeting?

The European Central Bank monetary policy statement will be released at 12:45 pm UK time with the press conference held at 1:30 pm.

Earlier we highlighted how the ECB was widely expected to leave interest rates unchanged. However, there are some key things to look out for during the policy meeting and press conference.

  1. Euro-area inflation has jumped to the highest level since 2008 September. It will be interesting to hear what President Christine Lagarde has to say about this. Last week she stated that inflation is largely transitory and unlikely to last. Will she drop the same line when quizzed by journalists on Thursday?
  2. Markets are pricing a strong chance of a rate hike by the end of 2022 but the European Central Bank is expected to douse these expectations. What language will Lagarde employ?
  3. How about the mammoth 1.85 trillion-euro Pandemic emergency purchase program (PEPP) which expires in March 2022? Markets expect it to be extended beyond March but when it will end remains a mystery. Will this be at the end of December 2022 or beyond?

Now, this is where things get interesting. If both the BOJ and ECB strike a dovish tone – the EUR and JPY are likely to weaken against each other. Such could result in volatility and choppiness until one loses the tug-of-war.

When looking at the EURJPY, prices remain bullish. But the question that comes to mind is whether the currency pair is experiencing a pullback or the start of a downtrend? While the pending central bank meetings could play a role in where the EURJPY concludes this week, the technicals must not be overlooked. A solid breakdown below 132.00 could open the doors towards 131.40 and 131.00. A move back above 132.80 could inspire an incline towards 133.47 and 134.00.

Disclaimer: The content in this article comprises personal opinions and should not be construed as containing personal and/or other investment advice and/or an offer of and/or solicitation for any transactions in financial instruments and/or a guarantee and/or prediction of future performance. ForexTime (FXTM), its affiliates, agents, directors, officers or employees do not guarantee the accuracy, validity, timeliness or completeness, of any information or data made available and assume no liability as to any loss arising from any investment based on the same.


Forex-Time-LogoArticle by ForexTime

ForexTime Ltd (FXTM) is an award winning international online forex broker regulated by CySEC 185/12 www.forextime.com

Murrey Math Lines 25.10.2021 (EURUSD, GBPUSD)

Article By RoboForex.com
EURUSD, “Euro vs US Dollar”

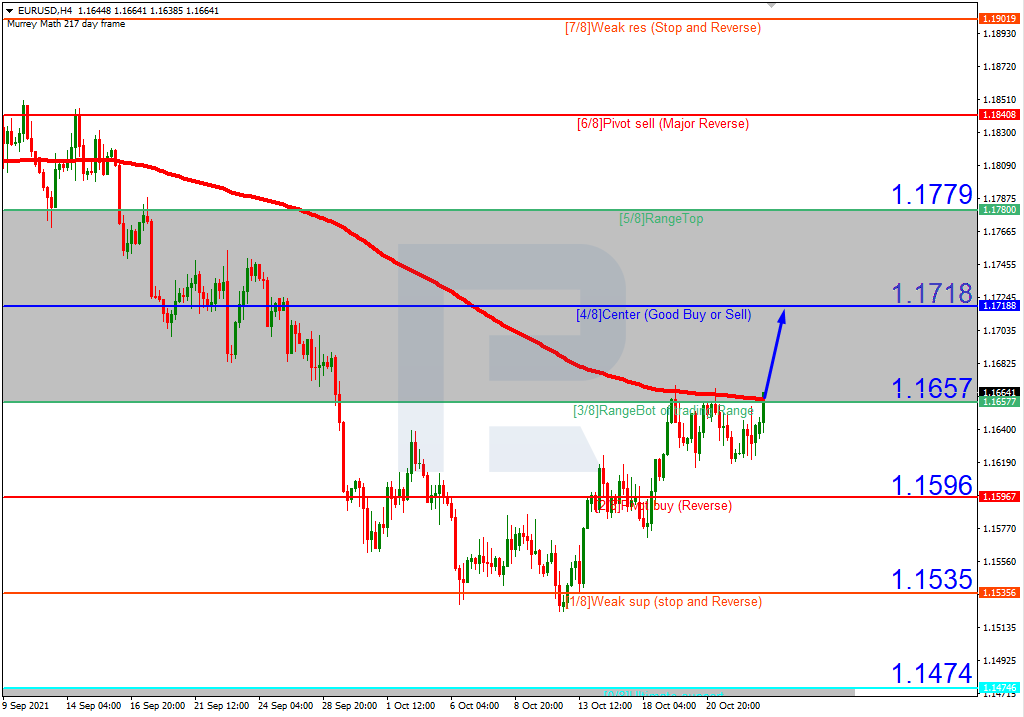
In the H4 chart, after breaking 3/8, EURUSD is consolidating. In this case, the price is expected to continue growing to reach the resistance at 4/8. Still, this scenario may no longer be valid if the price breaks 3/8 to the downside. After that, the instrument may fall towards the support at 1/8.

EURUSDH4
Risk Warning: the result of previous trading operations do not guarantee the same results in the future

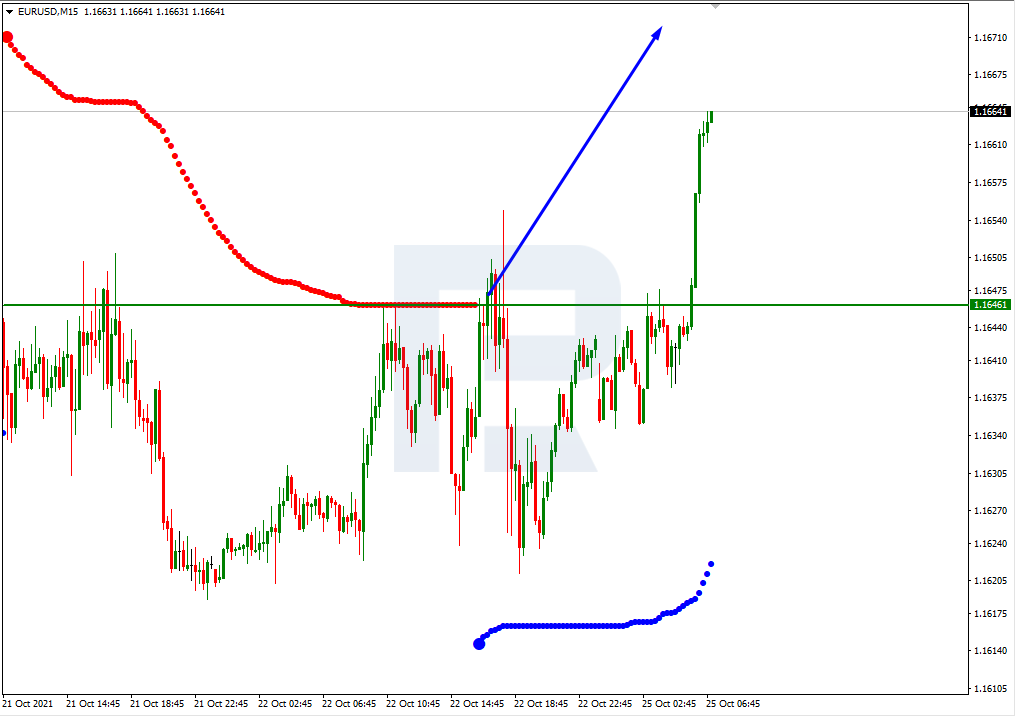
As we can see in the M15 chart, the pair has broken the upside line of the VoltyChannel indicator and, as a result, may continue its growth.

EURUSD_M15
Risk Warning: the result of previous trading operations do not guarantee the same results in the future

GBPUSD, “Great Britain Pound vs US Dollar”

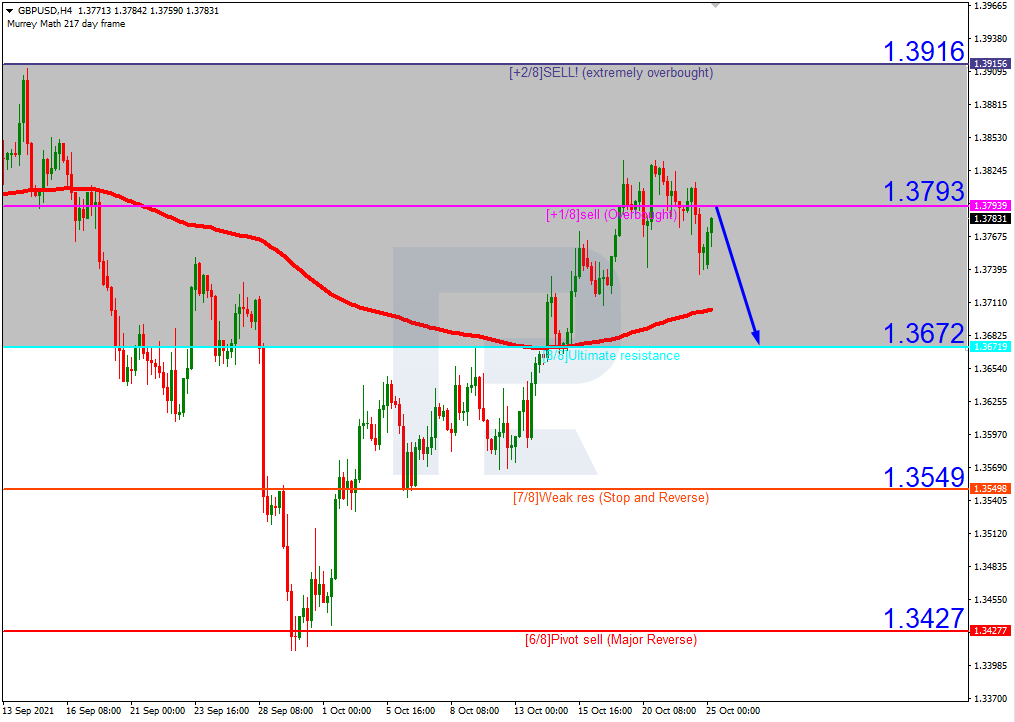
In the H4 chart, GBPUSD is still moving within the “overbought area”. In this case, the asset is expected to test +1/8, rebound from it, and then resume falling towards the support at 8/8. However, this scenario may no longer be valid if the price breaks +1/8 to the upside. After that, the instrument may continue growing to reach the resistance at +2/8.

GBPUSD_H4
Risk Warning: the result of previous trading operations do not guarantee the same results in the future

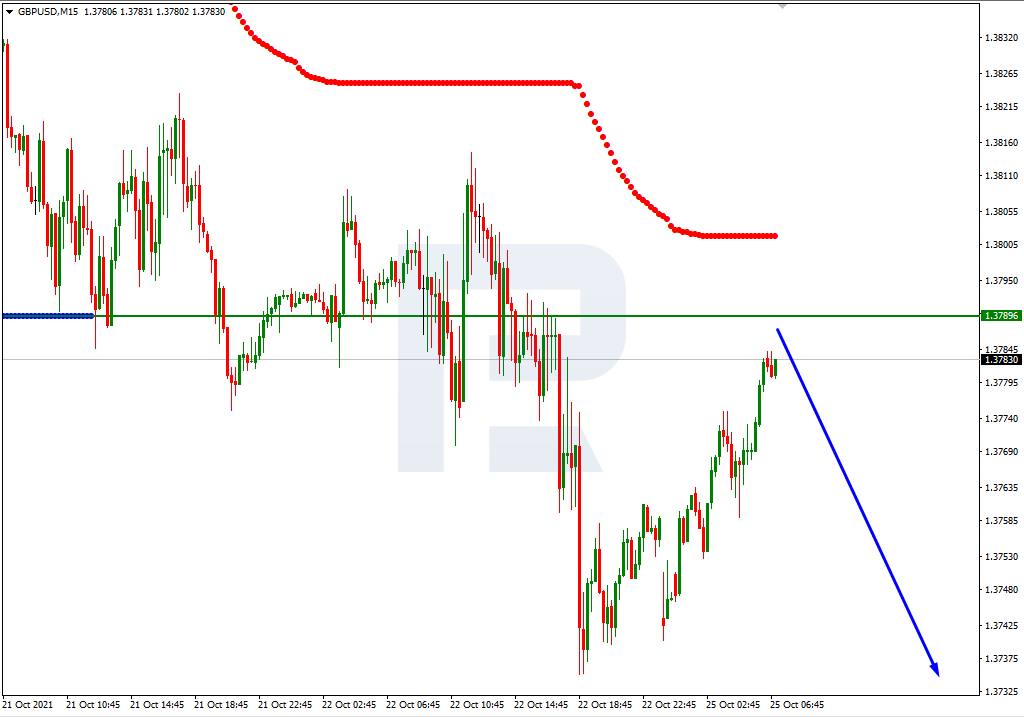
As we can see in the M15 chart, the pair has broken the downside line of the VoltyChannel indicator and, as a result, may continue trading downwards to reach 8/8 from the H4 chart.

GBPUSD_M15

Article By RoboForex.com
Attention!
Forecasts presented in this section only reflect the author’s private opinion and should not be considered as guidance for trading. RoboForex LP bears no responsibility for trading results based on trading recommendations described in these analytical reviews.