
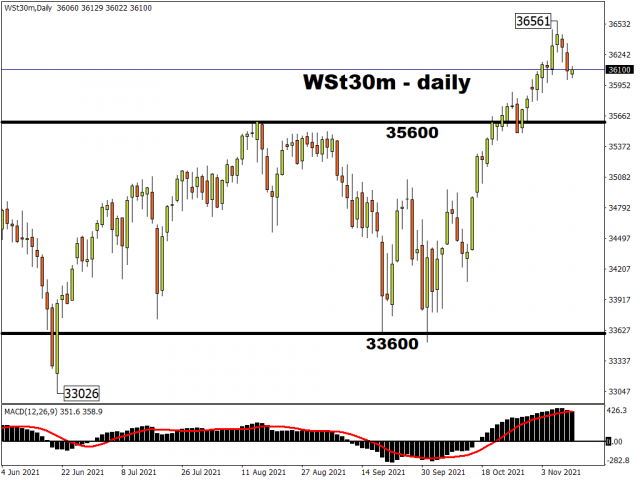
Markets are waking up to inflation numbers the like of which many of us have never seen before. US stock indices sold off with the Tech sector getting hit, especially after Elon Musk sold $5bn worth of Tesla stock.
The broader S&P500 experienced its worst day in more than a month. It also marked the first back-to-back decline in a month, after the index closed at a record high to start the week. Asian markets are mixed with the Nikkei is supported by the yen’s weakness. European markets are lower while US futures are modestly in the green.
Team Transitory licking its wounds
Is the battle between policymakers and many market watchers finally over?
Free Reports:
 Get our Weekly Commitment of Traders Reports - See where the biggest traders (Hedge Funds and Commercial Hedgers) are positioned in the futures markets on a weekly basis.
 Sign Up for Our Stock Market Newsletter – Get updated on News, Charts & Rankings of Public Companies when you join our Stocks Newsletter
We all know the argument by now – the former believe price pressures are temporary due to supply bottlenecks and lingering pandemic issues that will ease in time.
The “inflationistas” are finally enjoying their moment in the sun after multi-decade high US CPI numbers.
There are a multitude of statistics flying about. We like the one the Atlanta Fed produces on flexible and “sticky” inflation. Prices of some goods adjust quickly. Others which take months are hard to reverse and what central bankers certainly want to avoid. Last month saw the sharpest rise in “sticky” prices since January 1991.
Dollar breakout in full effect
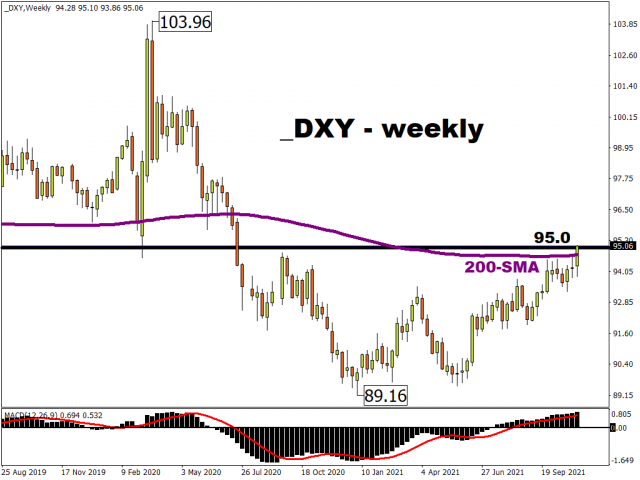
It’s Veterans Day holiday in the US which suggest liquidity will be lower than normal. But a narrative of inflation staying high and potentially heading higher (7% anyone?!), along with further employment gains and a Fed exiting loose policy more quickly should keep the dollar bid.
Trade weighted measures of the greenback have pushed to new highs for the year. The DXY has breached 95 having crossed the 200-week moving average.
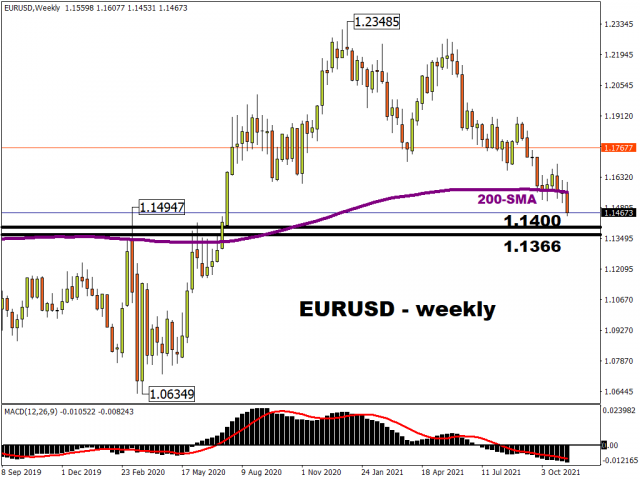
The five-month downtrend in EUR/USD has finally broken down through the 1.15 support zone. The failure below 1.16 had warned of further weakness. That support zone extends just below 1.15, with the March 2020 spike high at 1.14947.
Long-term levels below which sellers have their eyes on include 1.14 and then 1.1366. The weekly close will be key for an extended move like this to kick on.
Disclaimer: The content in this article comprises personal opinions and should not be construed as containing personal and/or other investment advice and/or an offer of and/or solicitation for any transactions in financial instruments and/or a guarantee and/or prediction of future performance. ForexTime (FXTM), its affiliates, agents, directors, officers or employees do not guarantee the accuracy, validity, timeliness or completeness, of any information or data made available and assume no liability as to any loss arising from any investment based on the same.
 Article by ForexTime
ForexTime Ltd (FXTM) is an award winning international online forex broker regulated by CySEC 185/12 www.forextime.com

- The Central Bank of Mexico kept its interest rate unchanged. Iran plans to introduce strict bans for US and Israeli vessels in the Strait of Hormuz Aug 7, 2026
- USD/JPY Holds Firm: Yen Loses Some Support Aug 7, 2026
- Australian trade balance returned to positive territory Aug 6, 2026
- Results in Line for Most Reporting Companies Aug 5, 2026
- Stock indices continue to break records. Oil is falling amid intensified diplomatic dialogue between the US and Iran Aug 5, 2026
- USD/JPY Holds Steady After Intervention: Outlook Remains Uncertain Aug 5, 2026
- EUR/USD: Busy Week Ahead Aug 3, 2026
- Positive sentiment in the AI sector supported stock indices. Oil prices remain volatile Aug 3, 2026
- The Tech‑heavy NASDAQ Index jumped by more than 3.3%. The offshore yuan is trading at its highest level since 2023 Jul 31, 2026
- USD/JPY After Volatility: Multiple Events in One Day Jul 31, 2026
