By InvestMacro
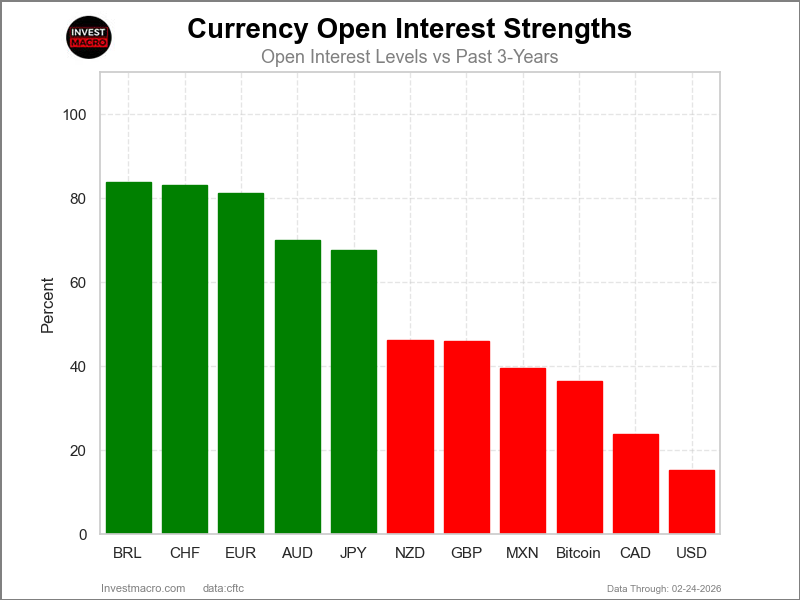
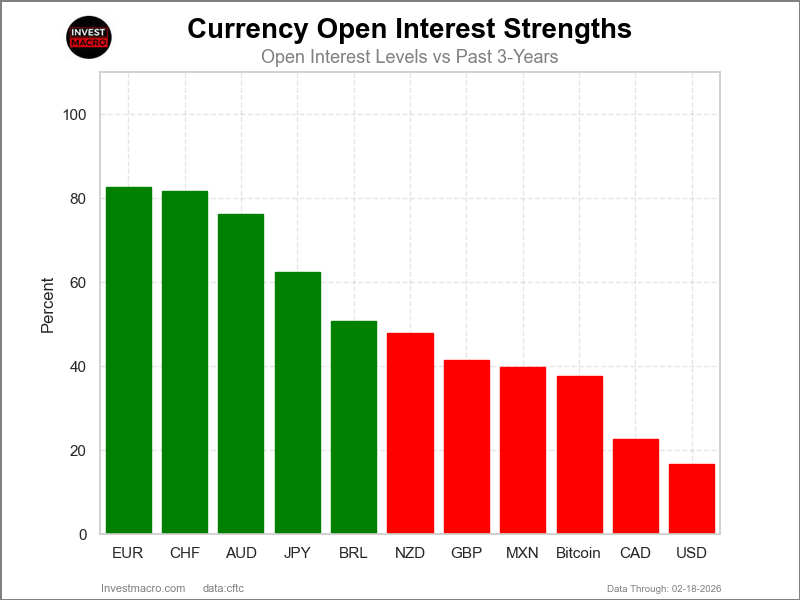
Open Interest Strength Levels show where current Open Futures Contracts are highest and lowest (higher interest can fuel trends and setup for more potential moves & vice versa) for currency markets.
Here are the latest charts and statistics for the Commitment of Traders (COT) data published by the Commodities Futures Trading Commission (CFTC).
The latest COT data is updated through Tuesday February 24th and shows a quick view of how large market participants (for-profit speculators and commercial traders) were positioned in the futures markets. All currency positions are in direct relation to the US dollar where, for example, a bet for the euro is a bet that the euro will rise versus the dollar while a bet against the euro will be a bet that the euro will decline versus the dollar.
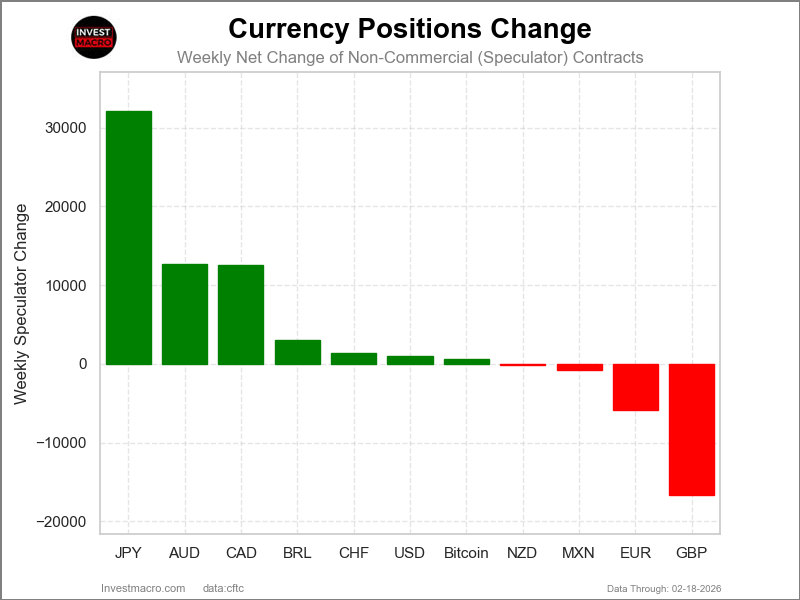
Weekly Speculator Changes led by Australian Dollar & New Zealand Dollar
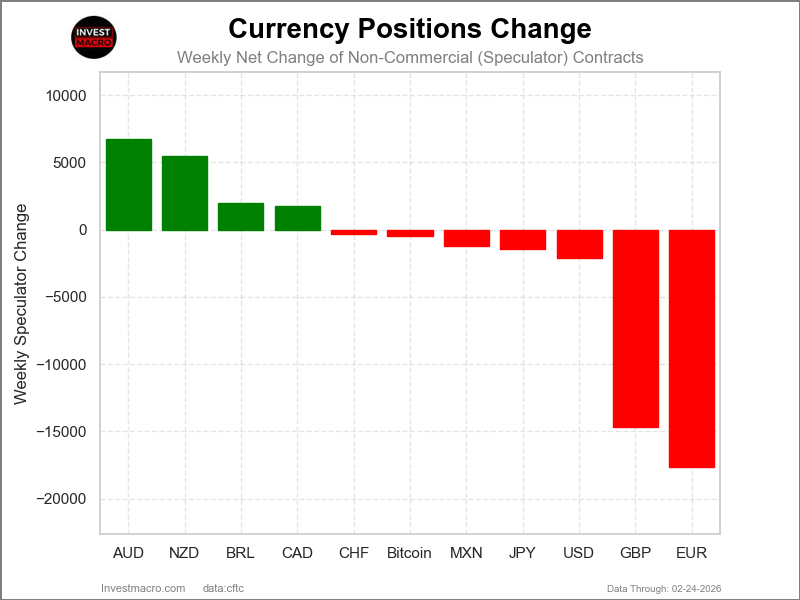
The COT currency market speculator bets were overall lower this week as just four out of the eleven currency markets we cover had higher positioning while the other seven markets had lower speculator contracts.
Leading the gains for the currency markets was the Australian Dollar (6,713 contracts) with the New Zealand Dollar (5,446 contracts), the Brazilian Real (2,012 contracts) and the Canadian Dollar (1,752 contracts) also seeing gaining weeks.
The currencies seeing declines in speculator bets on the week were the EuroFX (-17,624 contracts), the British Pound (-14,668 contracts), the US Dollar Index (-2,117 contracts), the Japanese Yen (-1,416 contracts), the Mexican Peso (-1,242 contracts), Bitcoin (-466 contracts) and with the Swiss Franc (-305 contracts) also recording lower bets on the week.
Speculators push Aussie Bets Higher, Euro & GBP Bets fall this week
Highlighting the currency speculator positioning for last week through Tuesday was the continued bullishness for speculators in the Australian dollar. The New Zealand dollar speculator bets continued to improve despite being bearish while the Euro bets took a breather and the British pound speculator position went increasingly bearish.
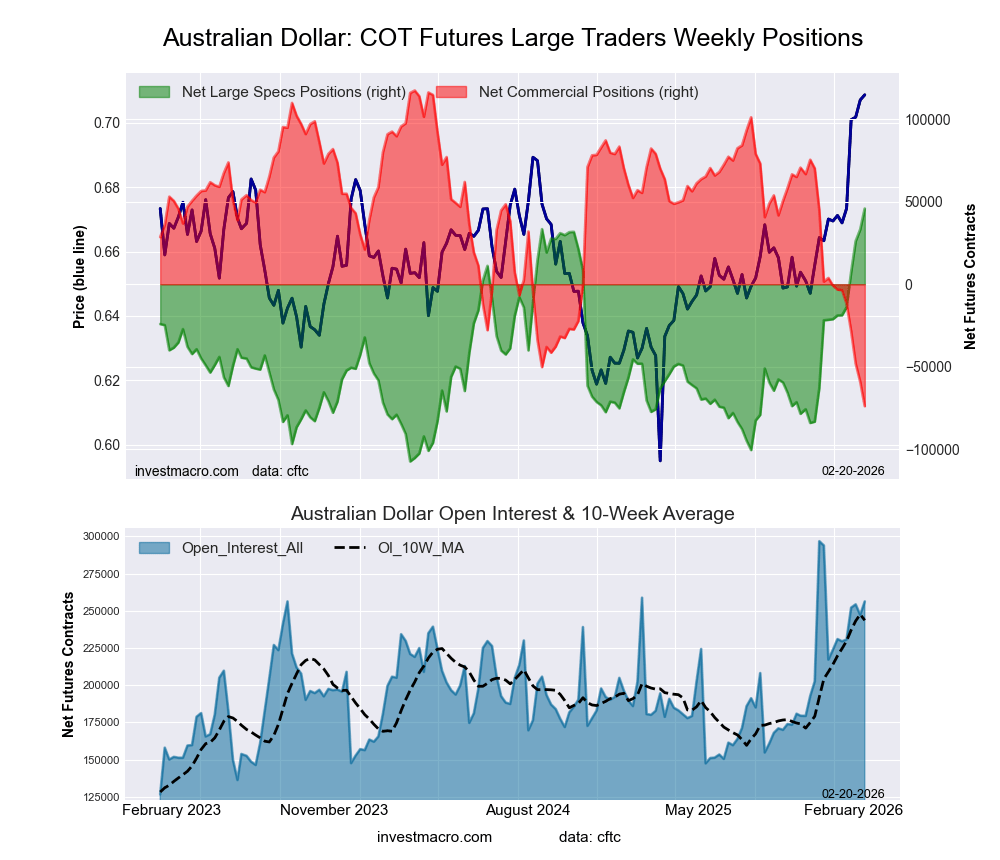
First off, the Australian dollar speculator position rose this week for a 13th consecutive week, with speculator positions adding a total of +136,820 net contracts over that time period. This has taken the Australian dollar net position from a total of -84,176 contracts on November 25th to this week’s net position of 52,644 contracts. This is the best level for the Australian dollar net position since October 24th of 2017, a span of 435 weeks. The Australian dollar in the foreign exchange market has continued to rally since the beginning of the year and is up by almost 6.50 percent since the start of 2026. Since the AUD lows in February of last year, the Australian dollar has risen by over 16 percent against the US dollar. The Aussie has been able to hold above the major 0.7000 level and closed out the week above the 0.7100 exchange rate. The AUD has been having its highest weekly closes at the highest levels since early 2023.
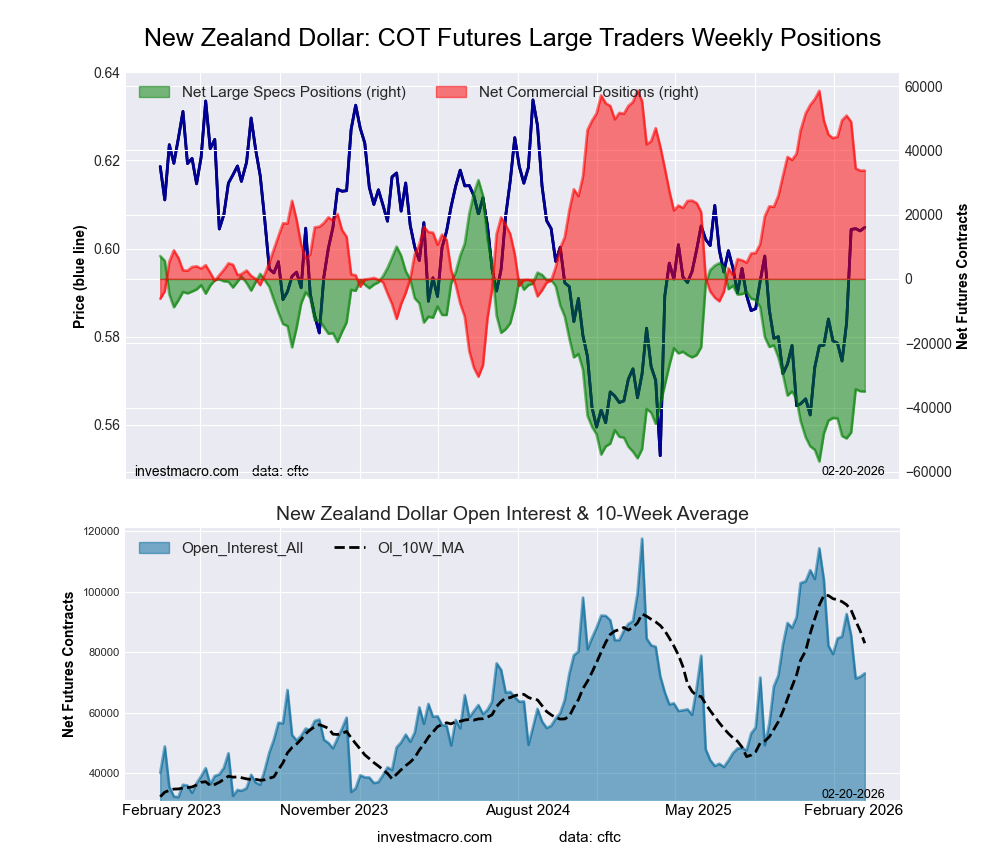
The New Zealand dollar speculator position has been improving steadily, with weekly speculator bets improving in six out of the last eleven weeks for an eleven-week gain of 27,214 net contracts. These gains date back to December 9th when the net position totaled -56,781 net contracts, which was the all-time low or most bearish level in history for the NZD speculator positions. Since then, the bets have been improving and this week reached a -29,567 net contract level, the best level or least bearish standing of the past twenty weeks. In the spot price market, the NZD has been up in six out of the past seven weeks and is currently trading right around the major psychological level of 0.6000 threshold, which also coincides with the two hundred weekly moving average.
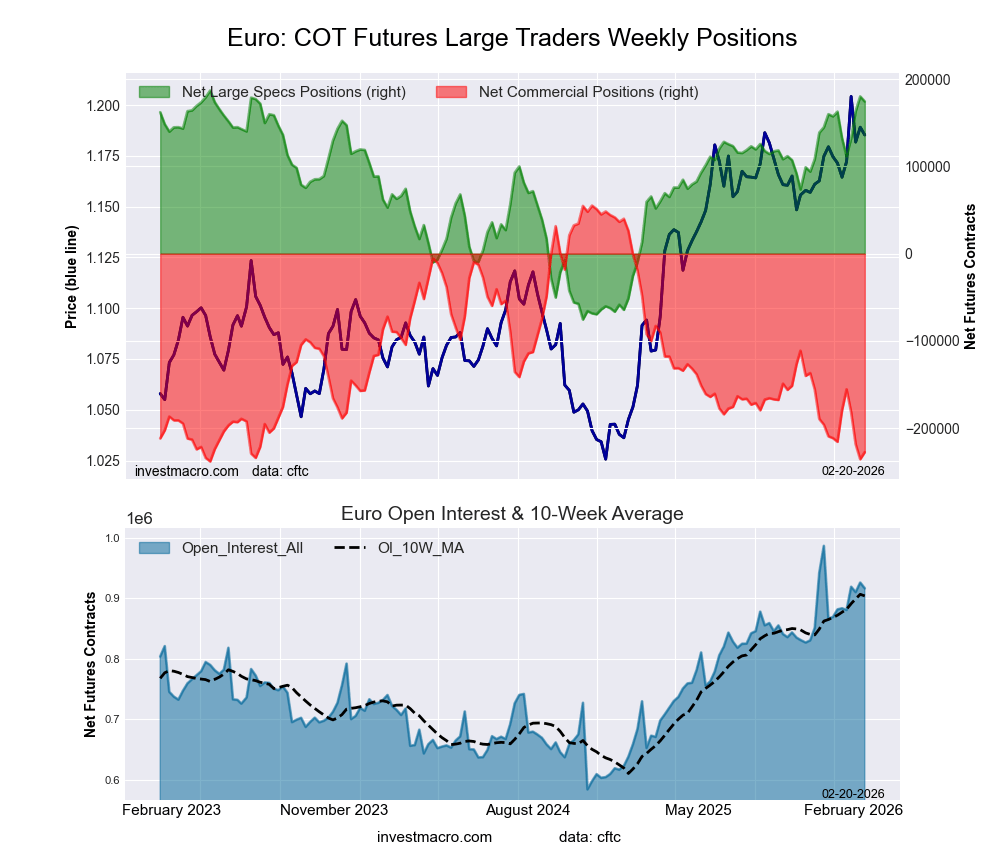
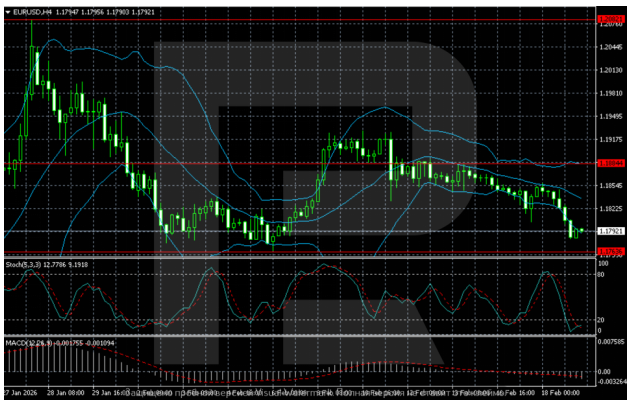
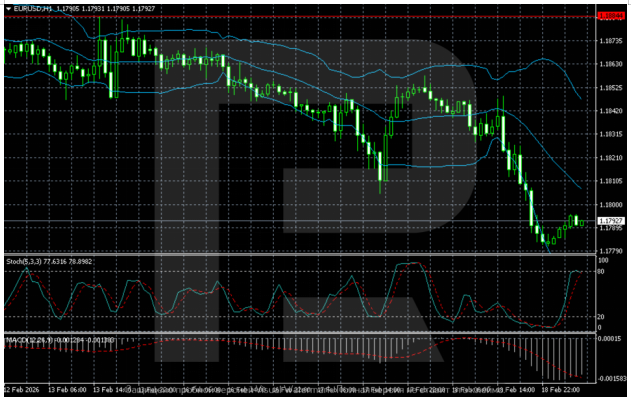
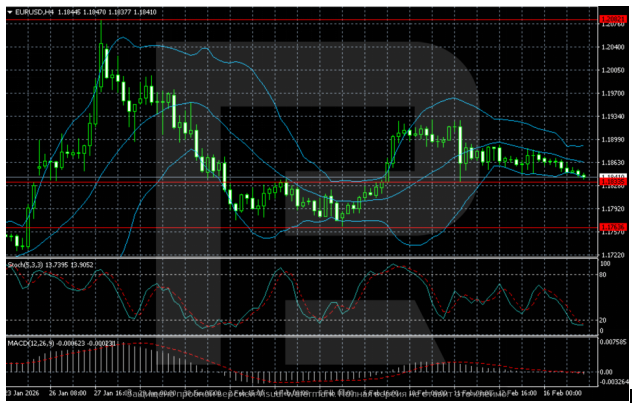
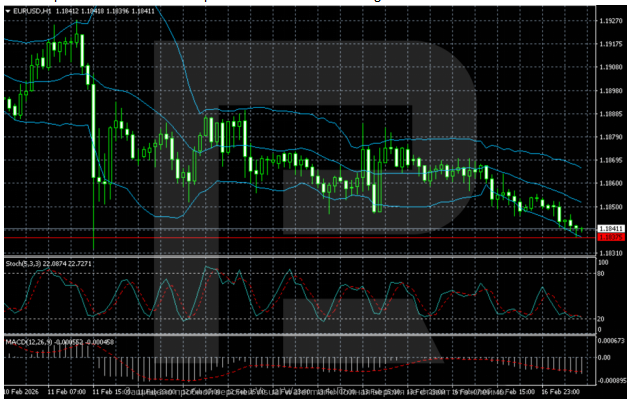
Euro speculator bets took a breather this week and fell for a second consecutive week. The Euro speculator positions have been mixed over the last ten weeks, with five weeks of falling speculator bets and five weeks of gaining speculator bets. Although the net change over the last ten weeks has been roughly a +12,000 net contracts. Overall, the speculator positioning for the Euro remains highly bullish with this week’s net position over +156,000 contracts. This marks the 13th consecutive week that the net position has been over +100,000 net contracts, and this is the 33rd out of the last 37 weeks that the net position has been over +100,000 net contracts. In the forex markets, the Euro closed over the 1.1820 level this week after seeing a small weekly gain. Continued overhead and major resistance resides at 1.2000, while there is support at the 1.1750 level, as well as the 1.1600 level below.
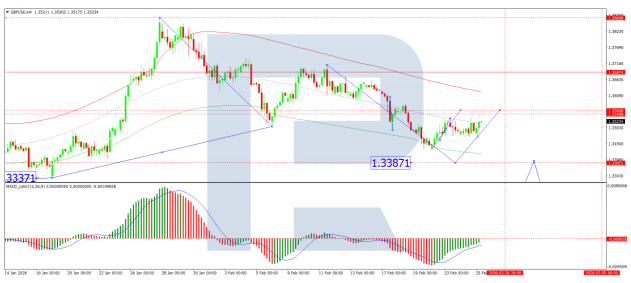
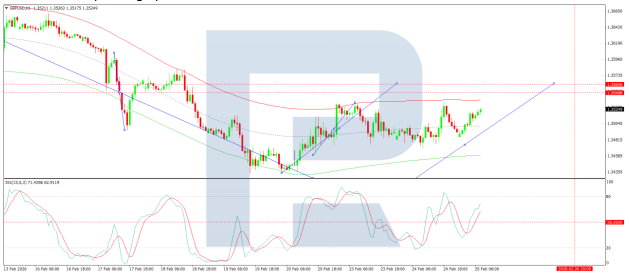
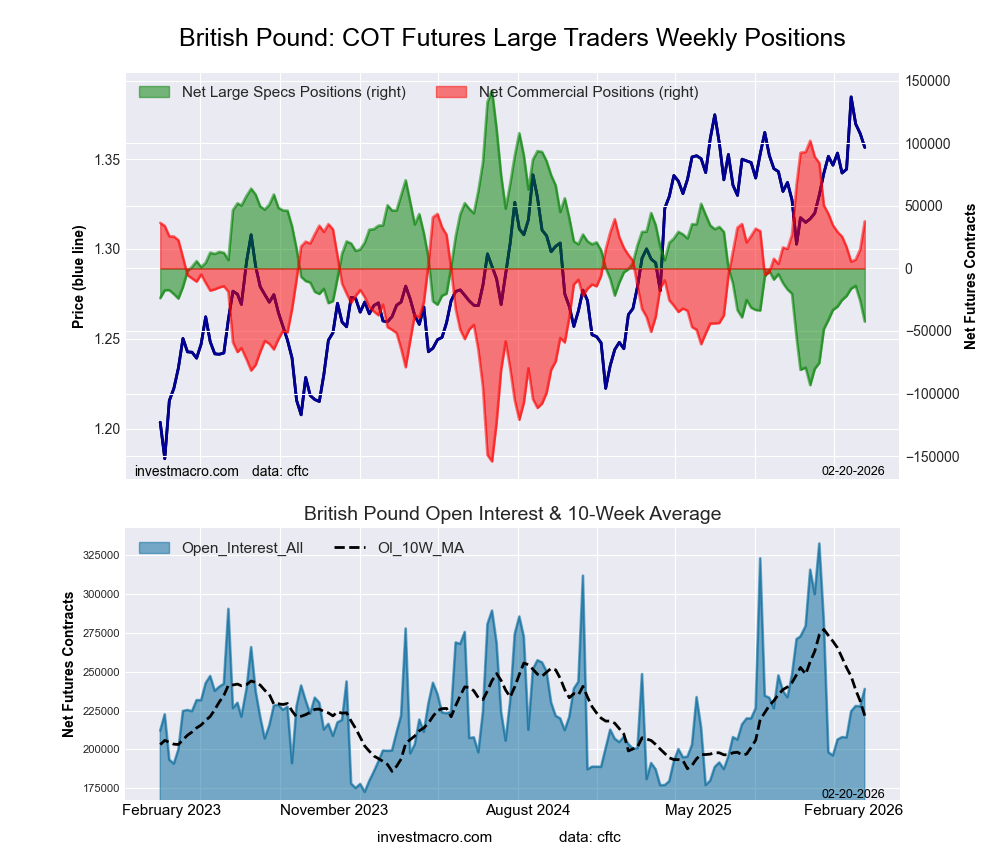
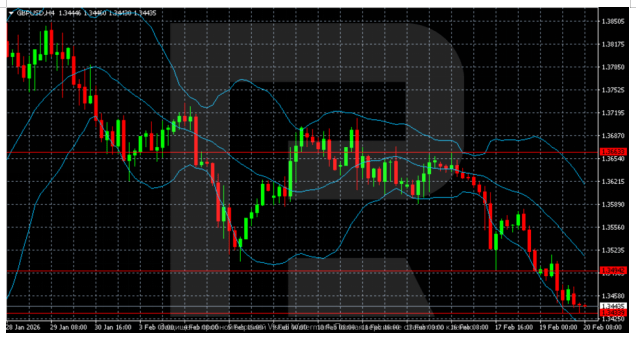
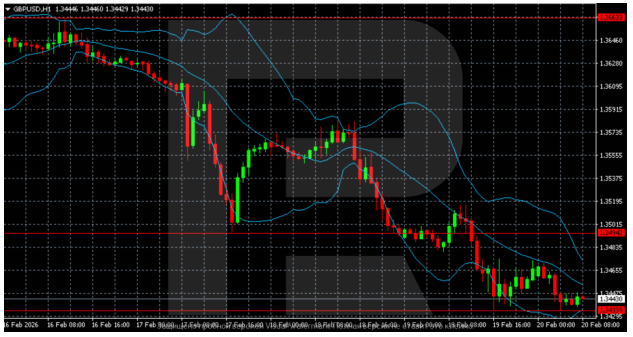
The British pound sterling saw its third week of strong bearish positioning and has now dropped by over -43,000 net contracts in the past three weeks. Previously, the British pound sterling had seen ten straight weeks of gains, so these last three weeks have cooled off that streak of bets. This week’s net position of negative -57,072 net contracts is the most bearish level of the past eleven weeks. Overall, the British pound sterling has been in bearish territory for 31 consecutive weeks dating back to July 2025. In the foreign exchange markets, the British pound sterling closed out the week at the 1.3480 level and has fallen for three out of the past four weeks. Currently, the bulls and the bears are battling it out around the 1.3500 area to see if this currency is gonna continue higher or take a breather and retreat lower. Since the beginning of 2025, the British pound has been up by approximately 11 percent against the US dollar in that time-frame.
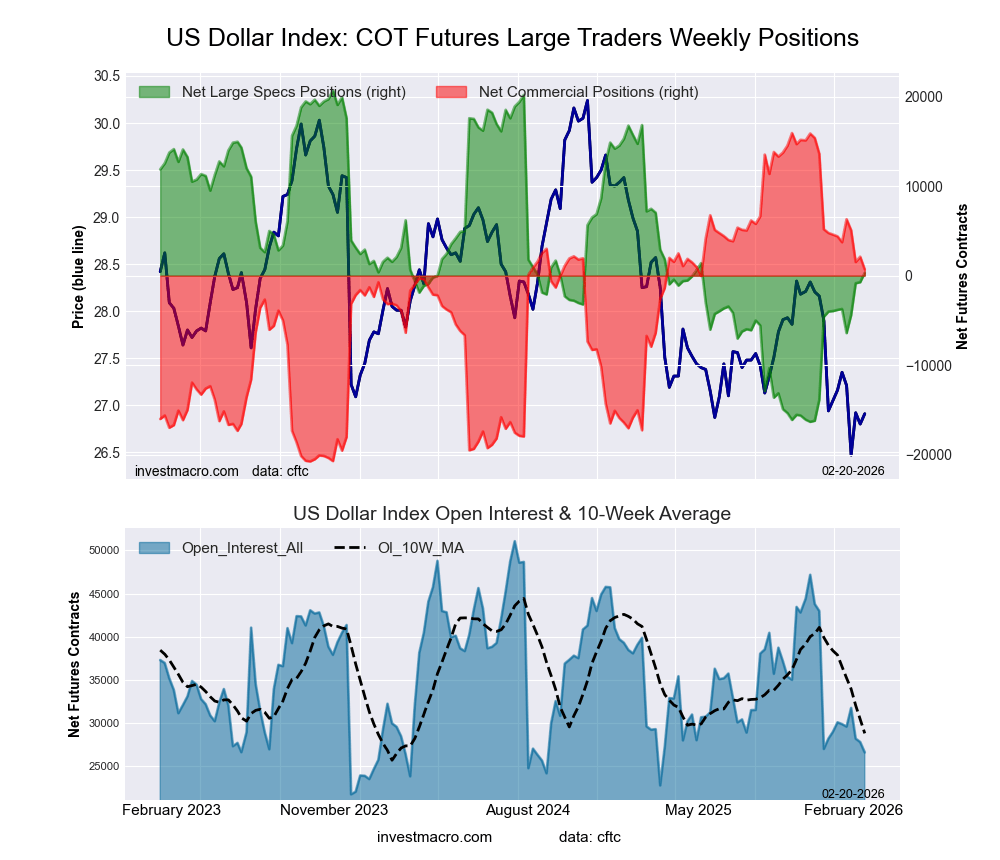
The US dollar index bets dipped this week following four consecutive weeks of gains that had brought the US dollar index net position into a small bullish level last week. Last week’s pop up into the bullish level was the first time since June 2025 that the US dollar index had seen a bullish net contract position, a span of 36 weeks. This week’s dollar index speculator position dipped by over -2,100 contracts, bringing the overall net positioning to -1,789 net contracts. Essentially, this is a neutral position for speculator contracts and shows there is no dominant trend in where the speculators are leaning, with uncertainty as to whether we go up or down from here. In the Forex markets, the USD index had a small dip this week in price and is settling in and consolidating around the 97.50 exchange rate. The USD index has overhead resistance at the 98.00 level, while there is also strong support below as prices have bounced off the 96.50 level at least three times since June and have been unable to hold below that level for any amount of time.
Brazilian Real leads Currency Market Price Performance
This week’s five-day price performance was led by the Brazilian real, which rose by over one percent with a 1.03 percent gain on the week. The Swiss franc came in second with a 0.91 percent increase, followed by the Australian dollar, which rose by 0.50 percent on the week.
The New Zealand dollar was higher by 0.40 percent, followed by the Canadian dollar, which saw an uptick by 0.35 percent. The Euro was marginally higher at 0.32 percent.
On the downside, Bitcoin saw a -3.02 percent shortfall on the week. The Mexican peso was down by -0.62 percent, followed by the Japanese yen with a similar -0.61 percent decline. The US dollar index was lower by -0.11 percent, and the British pound was virtually unchanged with a small edge lower by -0.02 percent.
Over the past thirty days, the Australian dollar has been the standout performer with a 6.49 percent gain over that period. The Brazilian real has been up by 4.87 percent while the Swiss franc has been higher by 4.55 percent and the New Zealand dollar has also floated higher by 4.29 percent in the 30-day time-frame.
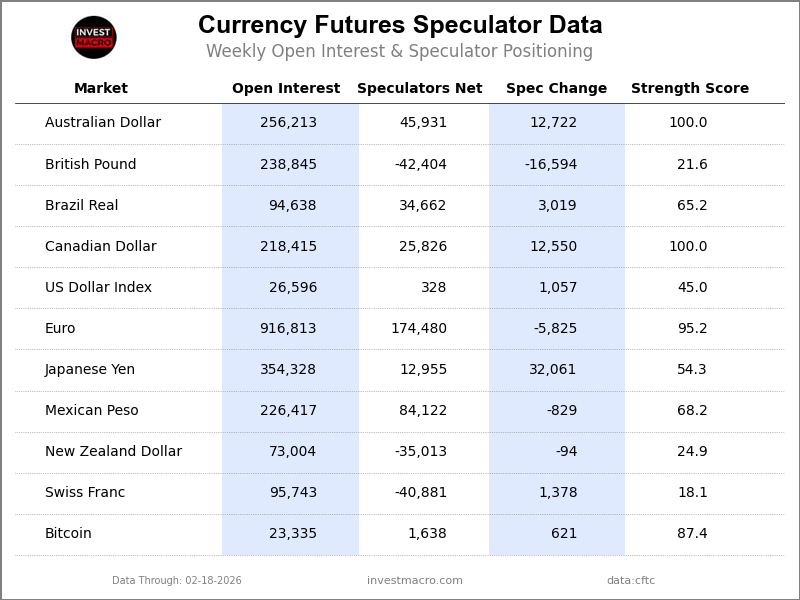
Currencies Data:
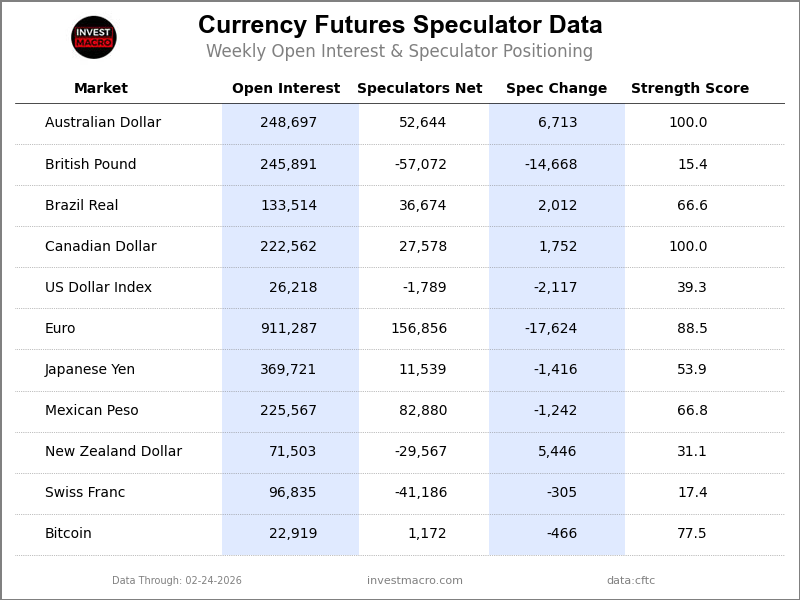
Legend: Open Interest | Speculators Current Net Position | Weekly Specs Change | Specs Strength Score compared to last 3-Years (0-100 range)
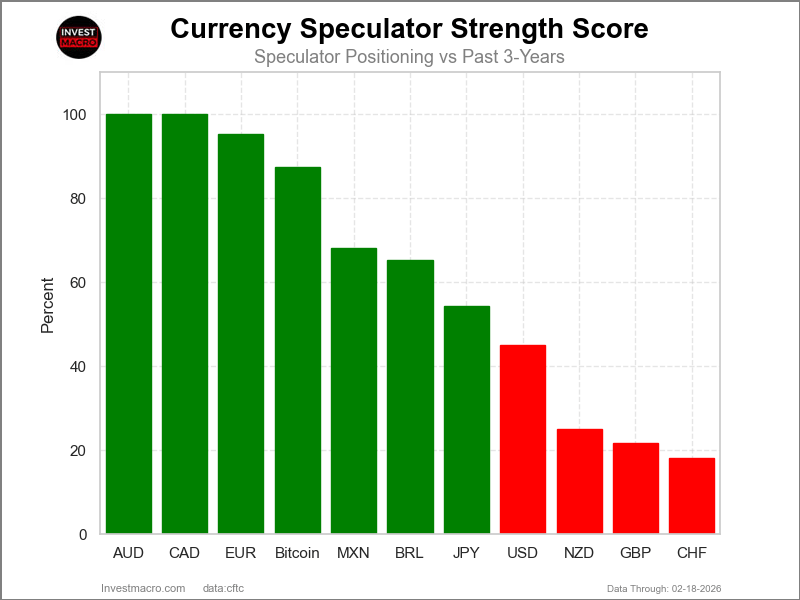
Strength Scores led by Canadian Dollar & Australian Dollar
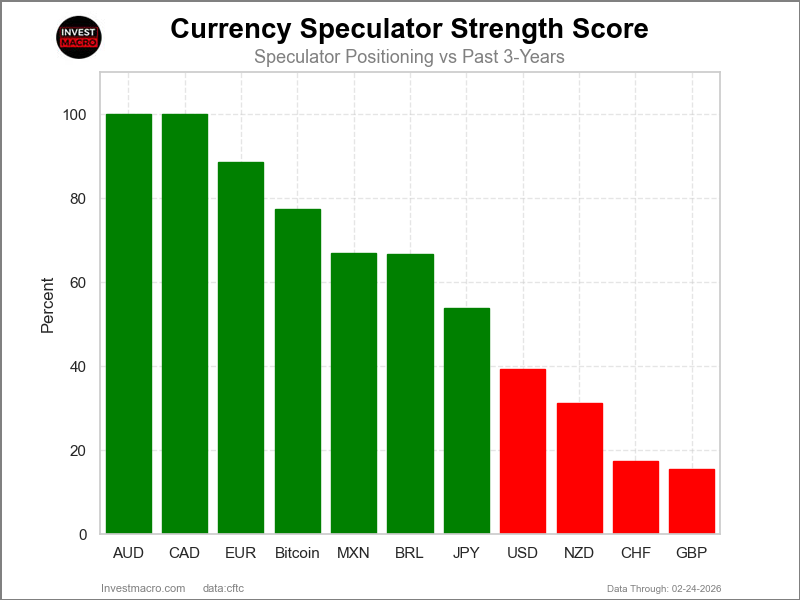
COT Strength Scores (a normalized measure of Speculator positions over a 3-Year range, from 0 to 100 where above 80 is Extreme-Bullish and below 20 is Extreme-Bearish, a 50 score is right down the middle of the past 3-Years) showed that the Canadian Dollar (100 percent) and the Australian Dollar (100 percent) lead the currency markets this week. The EuroFX (88 percent), Bitcoin (78 percent) and the Mexican Peso (67 percent) come in as the next highest in the weekly strength scores.
On the downside, the British Pound (15 percent) and the Swiss Franc (17 percent) come in at the lowest strength levels currently and are both in Extreme-Bearish territory (below 20 percent). The next lowest strength scores are the New Zealand Dollar (31 percent) and the US Dollar Index (39 percent).
3-Year Strength Statistics:
US Dollar Index (39.3 percent) vs US Dollar Index previous week (45.0 percent)
EuroFX (88.5 percent) vs EuroFX previous week (95.2 percent)
British Pound Sterling (15.4 percent) vs British Pound Sterling previous week (21.6 percent)
Japanese Yen (53.9 percent) vs Japanese Yen previous week (54.3 percent)
Swiss Franc (17.4 percent) vs Swiss Franc previous week (18.1 percent)
Canadian Dollar (100.0 percent) vs Canadian Dollar previous week (99.2 percent)
Australian Dollar (100.0 percent) vs Australian Dollar previous week (95.8 percent)
New Zealand Dollar (31.1 percent) vs New Zealand Dollar previous week (24.9 percent)
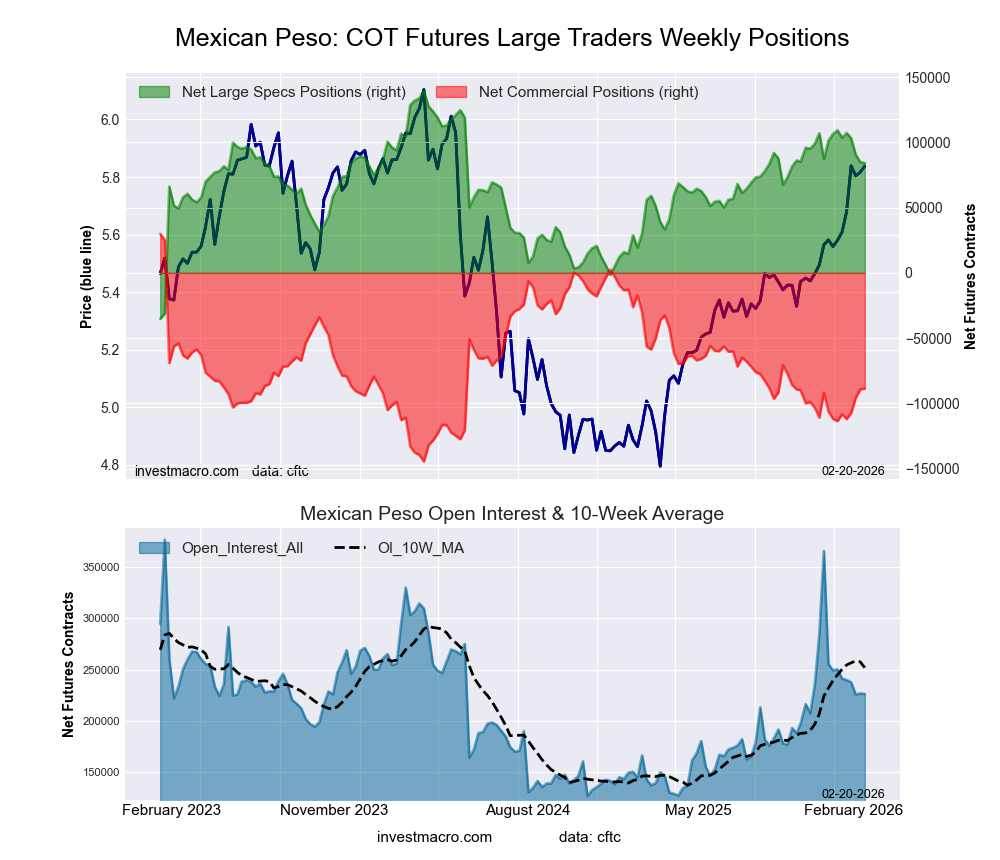
Mexican Peso (66.8 percent) vs Mexican Peso previous week (67.5 percent)
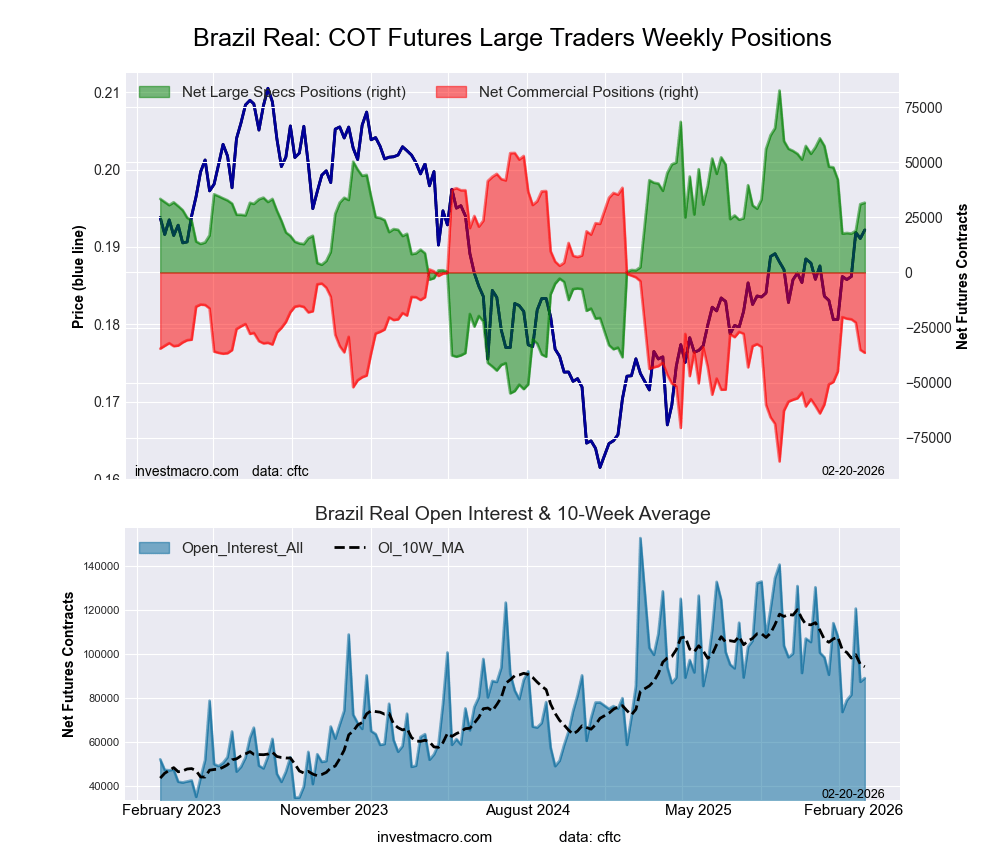
Brazilian Real (66.6 percent) vs Brazilian Real previous week (63.0 percent)
Bitcoin (77.5 percent) vs Bitcoin previous week (87.4 percent)
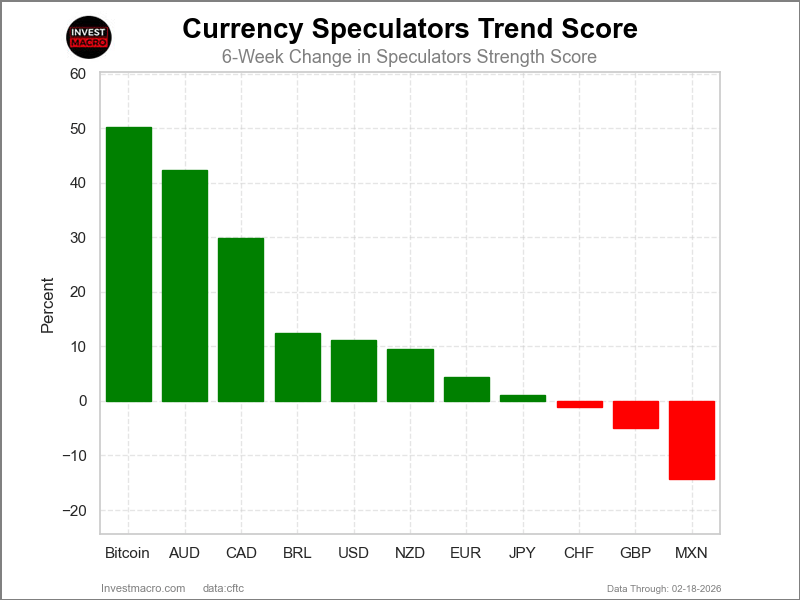
Australian Dollar & Canadian Dollar top the 6-Week Strength Trends
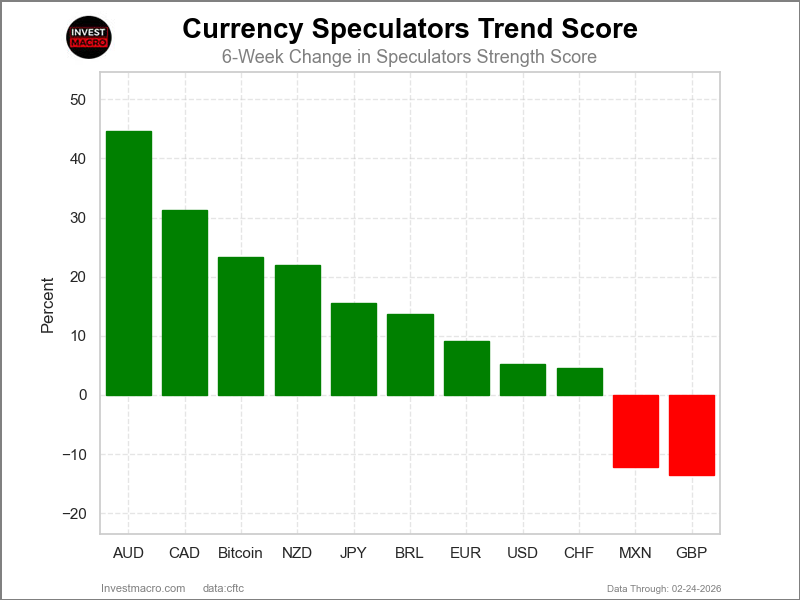
COT Strength Score Trends (or move index, calculates the 6-week changes in strength scores) showed that the Australian Dollar (45 percent) and the Canadian Dollar (31 percent) lead the past six weeks trends for the currencies. Bitcoin (23 percent), the New Zealand Dollar (22 percent) and the Japanese Yen (16 percent) are the next highest positive movers in the 3-Year trends data.
The British Pound (-14 percent) leads the downside trend scores currently with the Mexican Peso (-12 percent) following next with a lower trend score.
3-Year Strength Trends:
US Dollar Index (5.2 percent) vs US Dollar Index previous week (11.2 percent)
EuroFX (9.2 percent) vs EuroFX previous week (4.4 percent)
British Pound Sterling (-13.5 percent) vs British Pound Sterling previous week (-5.0 percent)
Japanese Yen (15.6 percent) vs Japanese Yen previous week (1.1 percent)
Swiss Franc (4.5 percent) vs Swiss Franc previous week (-1.2 percent)
Canadian Dollar (31.2 percent) vs Canadian Dollar previous week (29.7 percent)
Australian Dollar (44.6 percent) vs Australian Dollar previous week (40.5 percent)
New Zealand Dollar (22.0 percent) vs New Zealand Dollar previous week (9.5 percent)
Mexican Peso (-12.1 percent) vs Mexican Peso previous week (-14.7 percent)
Brazilian Real (13.7 percent) vs Brazilian Real previous week (-7.6 percent)
Bitcoin (23.4 percent) vs Bitcoin previous week (50.3 percent)
Individual COT Forex Markets:
US Dollar Index Futures:
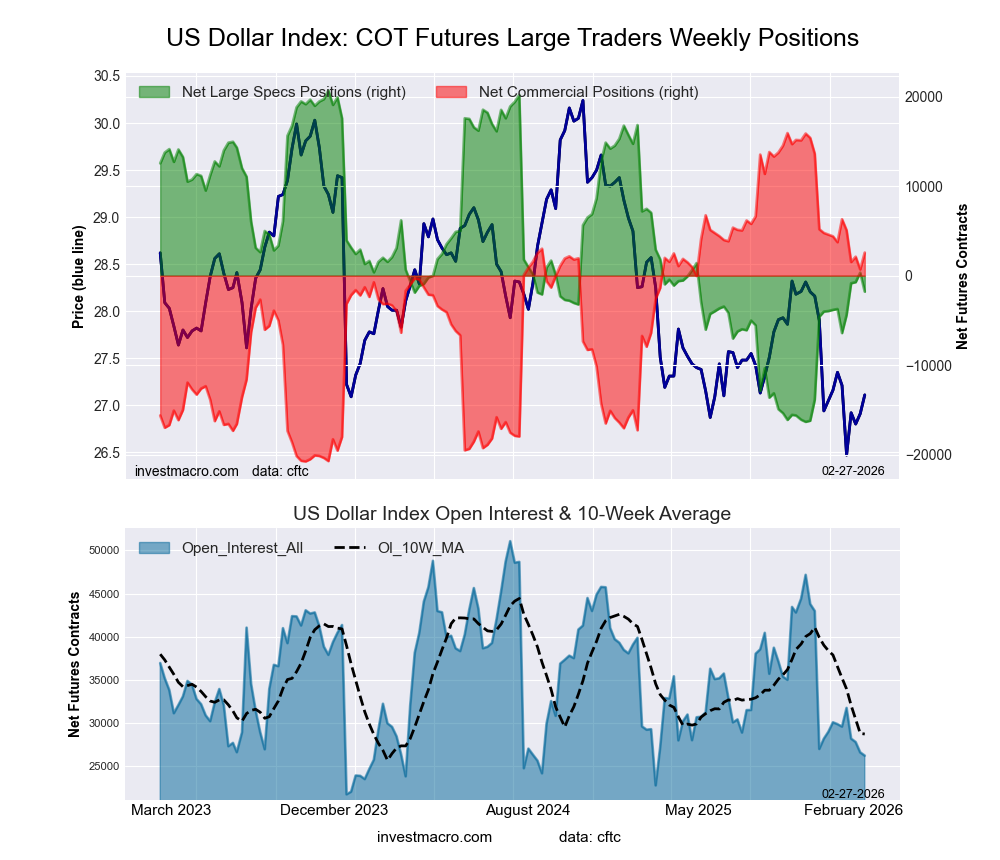 The US Dollar Index large speculator standing this week came in at a net position of -1,789 contracts in the data reported through Tuesday. This was a weekly reduction of -2,117 contracts from the previous week which had a total of 328 net contracts.
This week’s current strength score (the trader positioning range over the past three years, measured from 0 to 100) shows the speculators are currently Bearish with a score of 39.3 percent. The commercials are Bullish with a score of 63.6 percent and the small traders (not shown in chart) are Bearish with a score of 25.1 percent.
Price Trend-Following Model: Downtrend
Our weekly trend-following model classifies the current market price position as: Downtrend.
| US DOLLAR INDEX Statistics | SPECULATORS | COMMERCIALS | SMALL TRADERS |
| – Percent of Open Interest Longs: | 50.7 | 31.7 | 8.1 |
| – Percent of Open Interest Shorts: | 57.5 | 21.9 | 11.1 |
| – Net Position: | -1,789 | 2,582 | -793 |
| – Gross Longs: | 13,295 | 8,312 | 2,119 |
| – Gross Shorts: | 15,084 | 5,730 | 2,912 |
| – Long to Short Ratio: | 0.9 to 1 | 1.5 to 1 | 0.7 to 1 |
| NET POSITION TREND: | |||
| – Strength Index Score (3 Year Range Pct): | 39.3 | 63.6 | 25.1 |
| – Strength Index Reading (3 Year Range): | Bearish | Bullish | Bearish |
| NET POSITION MOVEMENT INDEX: | |||
| – 6-Week Change in Strength Index: | 5.2 | -3.2 | -13.7 |
Euro Currency Futures:
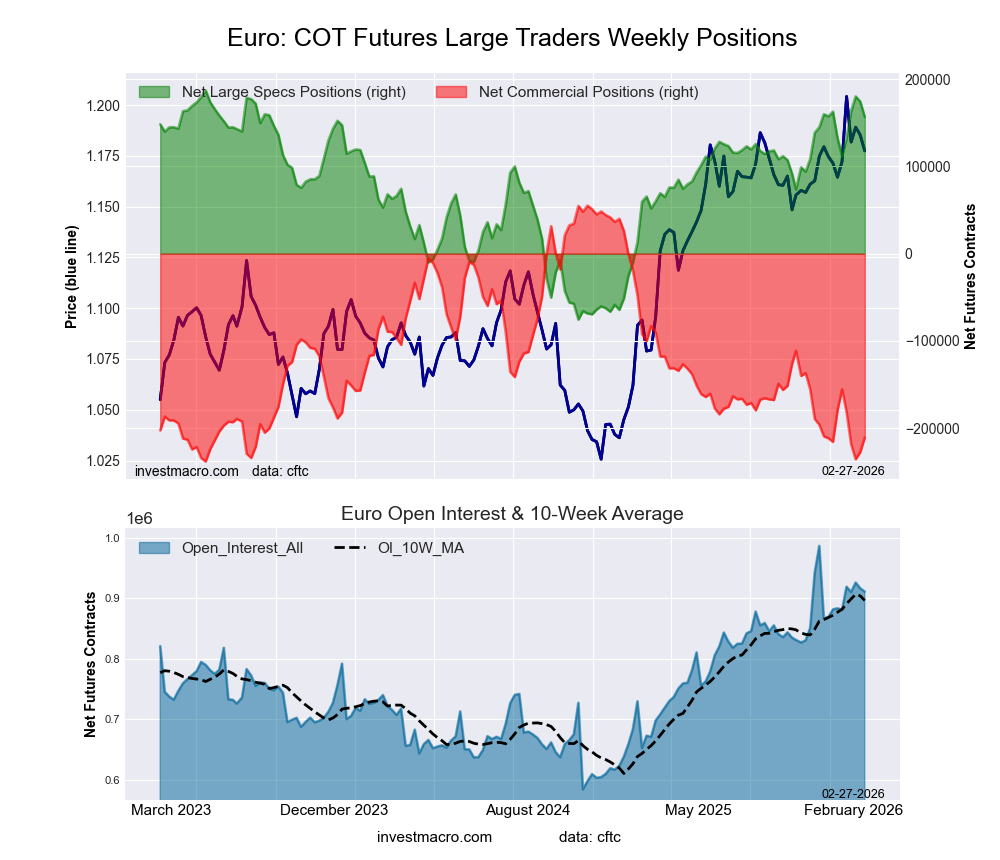 The Euro Currency large speculator standing this week came in at a net position of 156,856 contracts in the data reported through Tuesday. This was a weekly fall of -17,624 contracts from the previous week which had a total of 174,480 net contracts.
This week’s current strength score (the trader positioning range over the past three years, measured from 0 to 100) shows the speculators are currently Bullish-Extreme with a score of 88.5 percent. The commercials are Bearish-Extreme with a score of 9.3 percent and the small traders (not shown in chart) are Bullish-Extreme with a score of 88.6 percent.
Price Trend-Following Model: Uptrend
Our weekly trend-following model classifies the current market price position as: Uptrend.
| EURO Currency Statistics | SPECULATORS | COMMERCIALS | SMALL TRADERS |
| – Percent of Open Interest Longs: | 32.4 | 54.7 | 10.2 |
| – Percent of Open Interest Shorts: | 15.1 | 77.8 | 4.3 |
| – Net Position: | 156,856 | -210,903 | 54,047 |
| – Gross Longs: | 294,873 | 498,044 | 93,336 |
| – Gross Shorts: | 138,017 | 708,947 | 39,289 |
| – Long to Short Ratio: | 2.1 to 1 | 0.7 to 1 | 2.4 to 1 |
| NET POSITION TREND: | |||
| – Strength Index Score (3 Year Range Pct): | 88.5 | 9.3 | 88.6 |
| – Strength Index Reading (3 Year Range): | Bullish-Extreme | Bearish-Extreme | Bullish-Extreme |
| NET POSITION MOVEMENT INDEX: | |||
| – 6-Week Change in Strength Index: | 9.2 | -10.6 | 14.6 |
British Pound Sterling Futures:
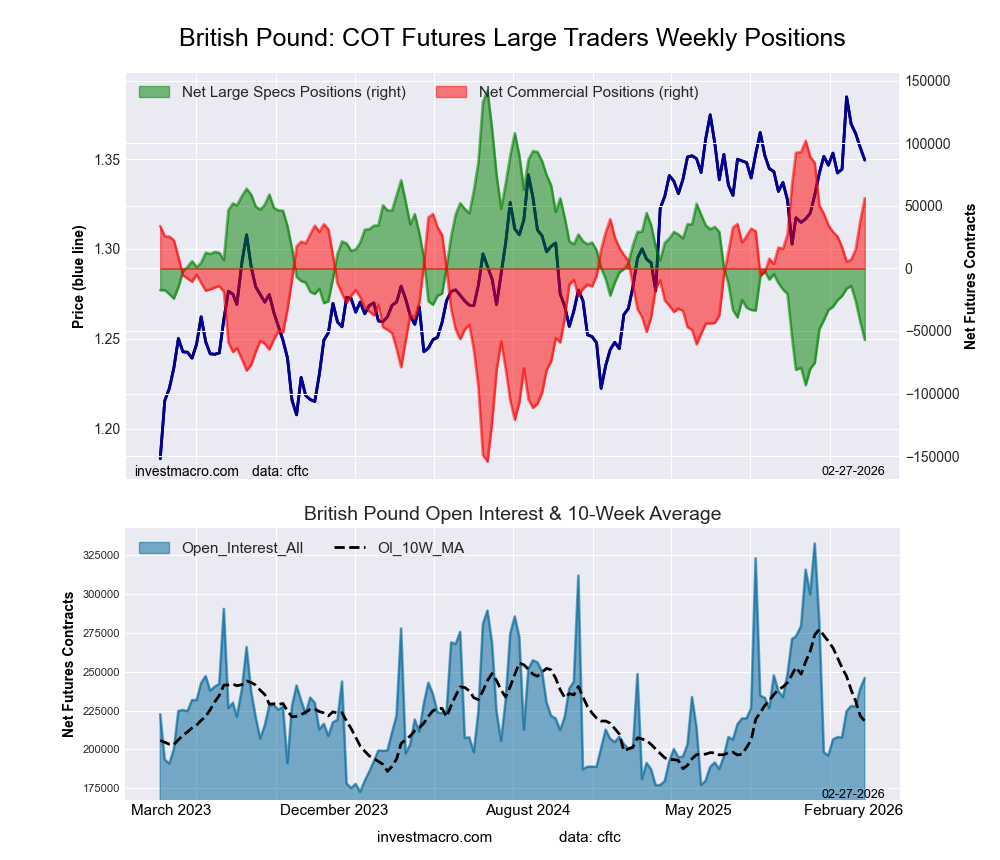 The British Pound Sterling large speculator standing this week came in at a net position of -57,072 contracts in the data reported through Tuesday. This was a weekly fall of -14,668 contracts from the previous week which had a total of -42,404 net contracts.
This week’s current strength score (the trader positioning range over the past three years, measured from 0 to 100) shows the speculators are currently Bearish-Extreme with a score of 15.4 percent. The commercials are Bullish-Extreme with a score of 82.1 percent and the small traders (not shown in chart) are Bullish with a score of 55.6 percent.
Price Trend-Following Model: Uptrend
Our weekly trend-following model classifies the current market price position as: Uptrend.
| BRITISH POUND Statistics | SPECULATORS | COMMERCIALS | SMALL TRADERS |
| – Percent of Open Interest Longs: | 27.3 | 55.2 | 11.9 |
| – Percent of Open Interest Shorts: | 50.5 | 32.4 | 11.5 |
| – Net Position: | -57,072 | 56,176 | 896 |
| – Gross Longs: | 67,213 | 135,804 | 29,236 |
| – Gross Shorts: | 124,285 | 79,628 | 28,340 |
| – Long to Short Ratio: | 0.5 to 1 | 1.7 to 1 | 1.0 to 1 |
| NET POSITION TREND: | |||
| – Strength Index Score (3 Year Range Pct): | 15.4 | 82.1 | 55.6 |
| – Strength Index Reading (3 Year Range): | Bearish-Extreme | Bullish-Extreme | Bullish |
| NET POSITION MOVEMENT INDEX: | |||
| – 6-Week Change in Strength Index: | -13.5 | 12.0 | 2.9 |
Japanese Yen Futures:
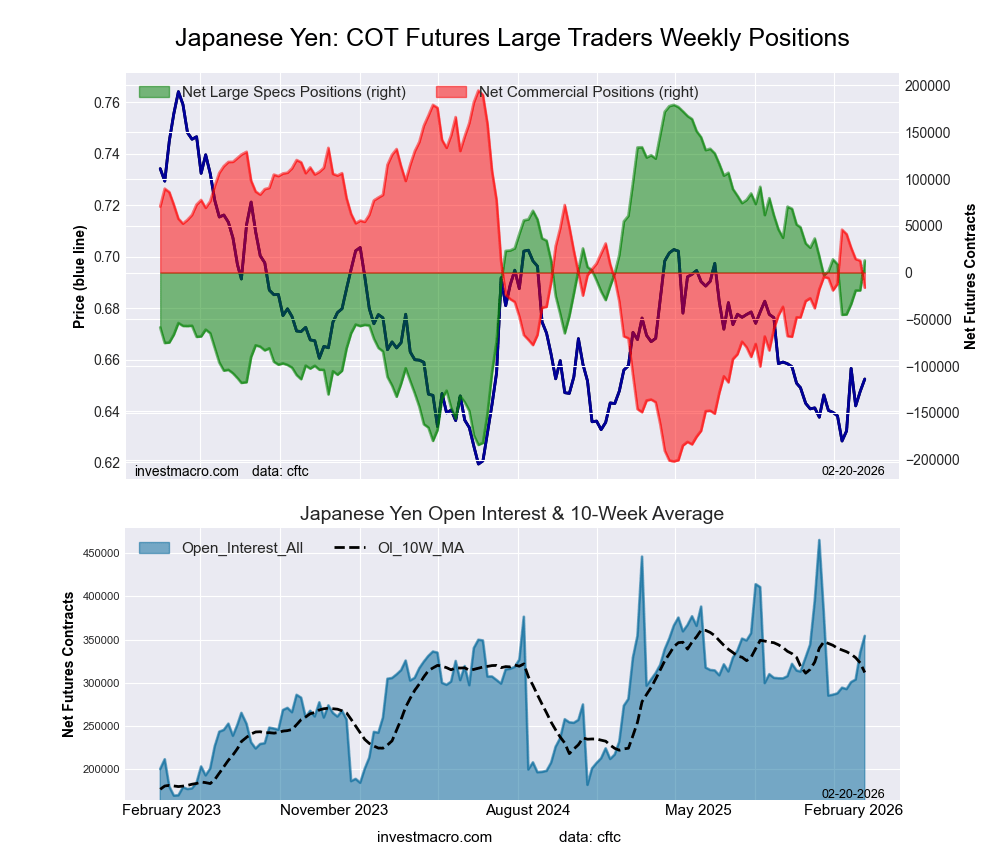
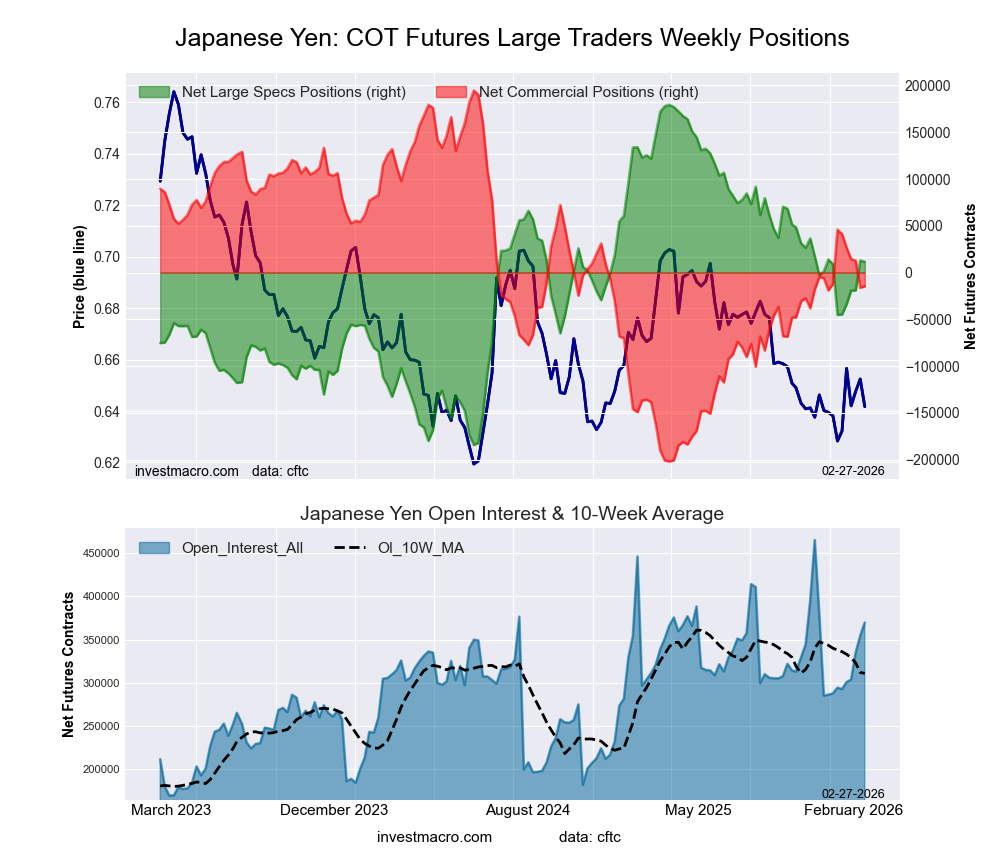 The Japanese Yen large speculator standing this week came in at a net position of 11,539 contracts in the data reported through Tuesday. This was a weekly fall of -1,416 contracts from the previous week which had a total of 12,955 net contracts.
This week’s current strength score (the trader positioning range over the past three years, measured from 0 to 100) shows the speculators are currently Bullish with a score of 53.9 percent. The commercials are Bearish with a score of 47.2 percent and the small traders (not shown in chart) are Bearish with a score of 45.1 percent.
Price Trend-Following Model: Downtrend
Our weekly trend-following model classifies the current market price position as: Downtrend.
| JAPANESE YEN Statistics | SPECULATORS | COMMERCIALS | SMALL TRADERS |
| – Percent of Open Interest Longs: | 40.4 | 38.4 | 10.5 |
| – Percent of Open Interest Shorts: | 37.3 | 42.4 | 9.7 |
| – Net Position: | 11,539 | -14,729 | 3,190 |
| – Gross Longs: | 149,364 | 141,918 | 38,952 |
| – Gross Shorts: | 137,825 | 156,647 | 35,762 |
| – Long to Short Ratio: | 1.1 to 1 | 0.9 to 1 | 1.1 to 1 |
| NET POSITION TREND: | |||
| – Strength Index Score (3 Year Range Pct): | 53.9 | 47.2 | 45.1 |
| – Strength Index Reading (3 Year Range): | Bullish | Bearish | Bearish |
| NET POSITION MOVEMENT INDEX: | |||
| – 6-Week Change in Strength Index: | 15.6 | -15.3 | 9.9 |
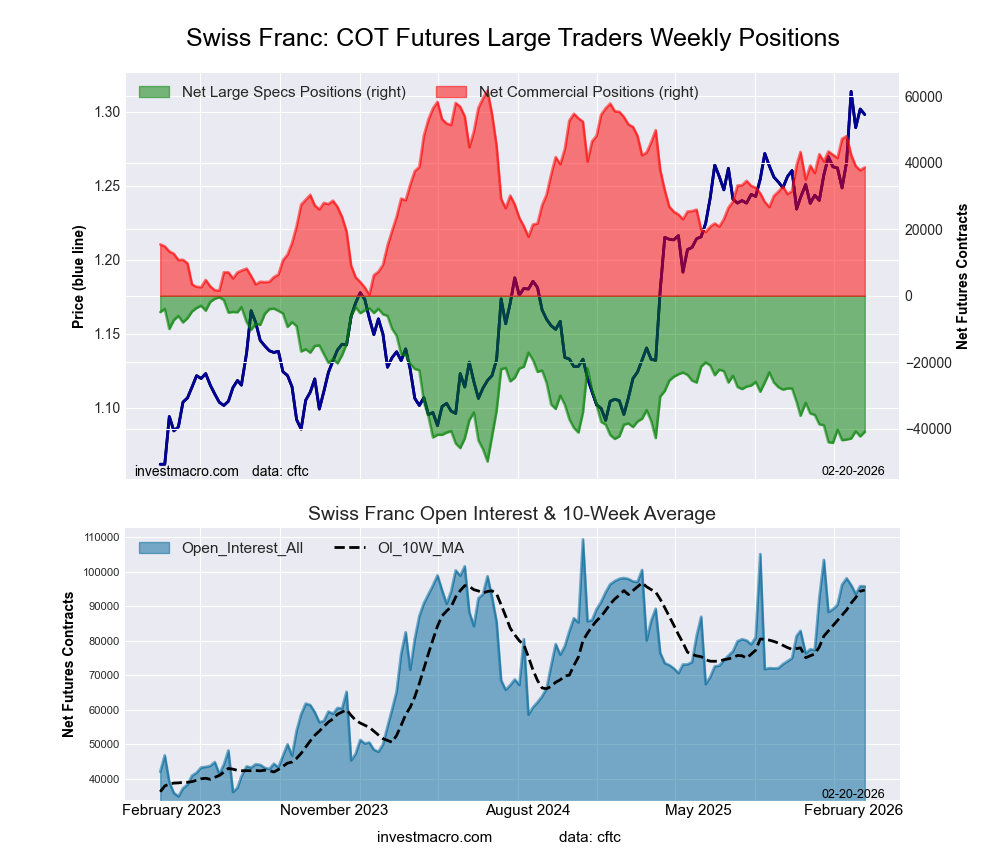
Swiss Franc Futures:
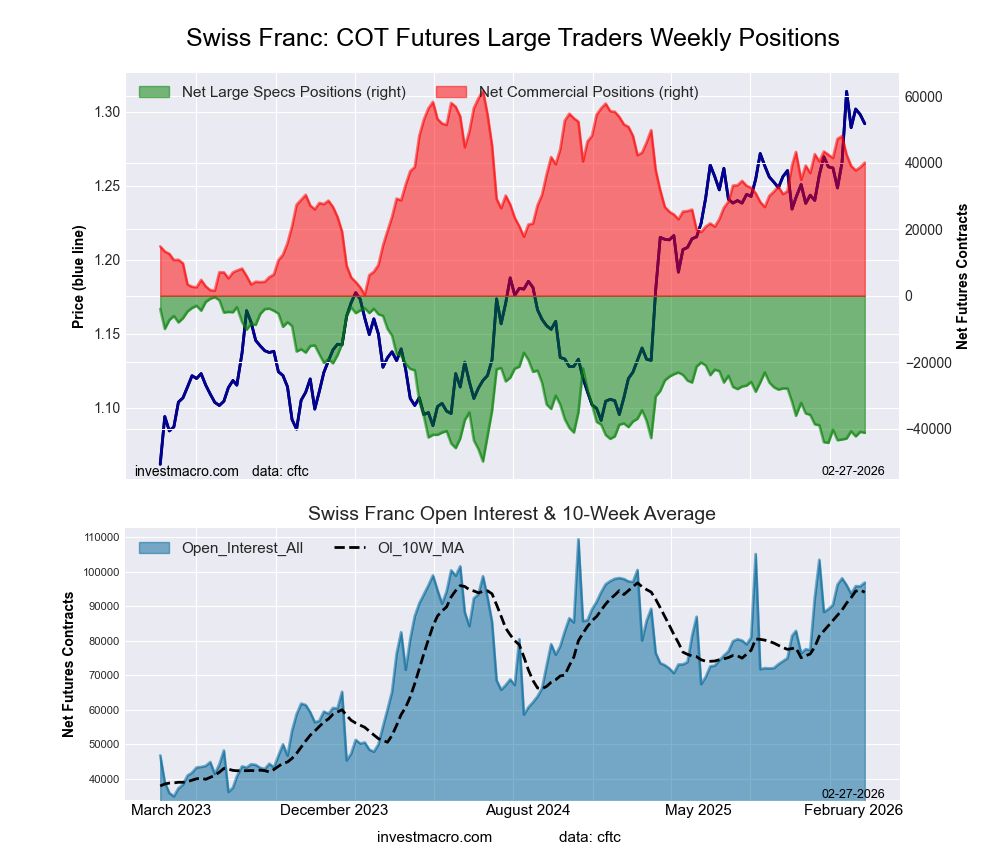 The Swiss Franc large speculator standing this week came in at a net position of -41,186 contracts in the data reported through Tuesday. This was a weekly reduction of -305 contracts from the previous week which had a total of -40,881 net contracts.
This week’s current strength score (the trader positioning range over the past three years, measured from 0 to 100) shows the speculators are currently Bearish-Extreme with a score of 17.4 percent. The commercials are Bullish with a score of 64.7 percent and the small traders (not shown in chart) are Bullish-Extreme with a score of 83.8 percent.
Price Trend-Following Model: Strong Uptrend
Our weekly trend-following model classifies the current market price position as: Strong Uptrend.
| SWISS FRANC Statistics | SPECULATORS | COMMERCIALS | SMALL TRADERS |
| – Percent of Open Interest Longs: | 11.9 | 69.0 | 19.0 |
| – Percent of Open Interest Shorts: | 54.4 | 27.6 | 17.8 |
| – Net Position: | -41,186 | 40,007 | 1,179 |
| – Gross Longs: | 11,525 | 66,778 | 18,411 |
| – Gross Shorts: | 52,711 | 26,771 | 17,232 |
| – Long to Short Ratio: | 0.2 to 1 | 2.5 to 1 | 1.1 to 1 |
| NET POSITION TREND: | |||
| – Strength Index Score (3 Year Range Pct): | 17.4 | 64.7 | 83.8 |
| – Strength Index Reading (3 Year Range): | Bearish-Extreme | Bullish | Bullish-Extreme |
| NET POSITION MOVEMENT INDEX: | |||
| – 6-Week Change in Strength Index: | 4.5 | -11.7 | 21.0 |
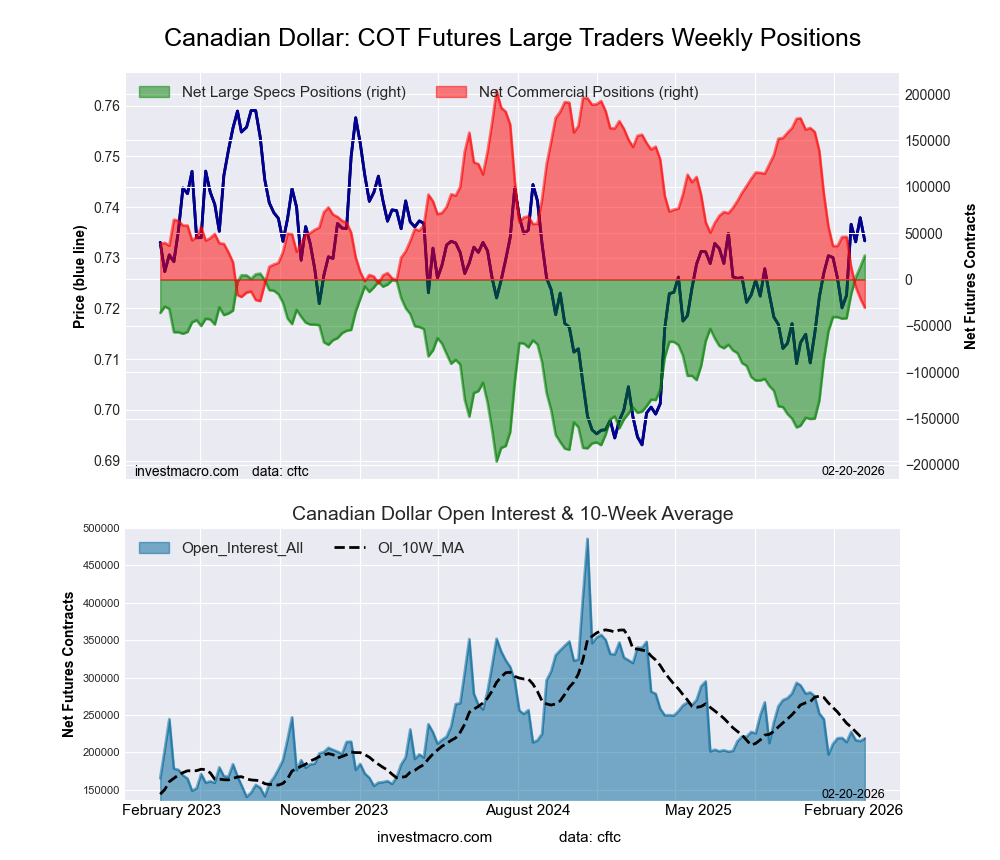
Canadian Dollar Futures:
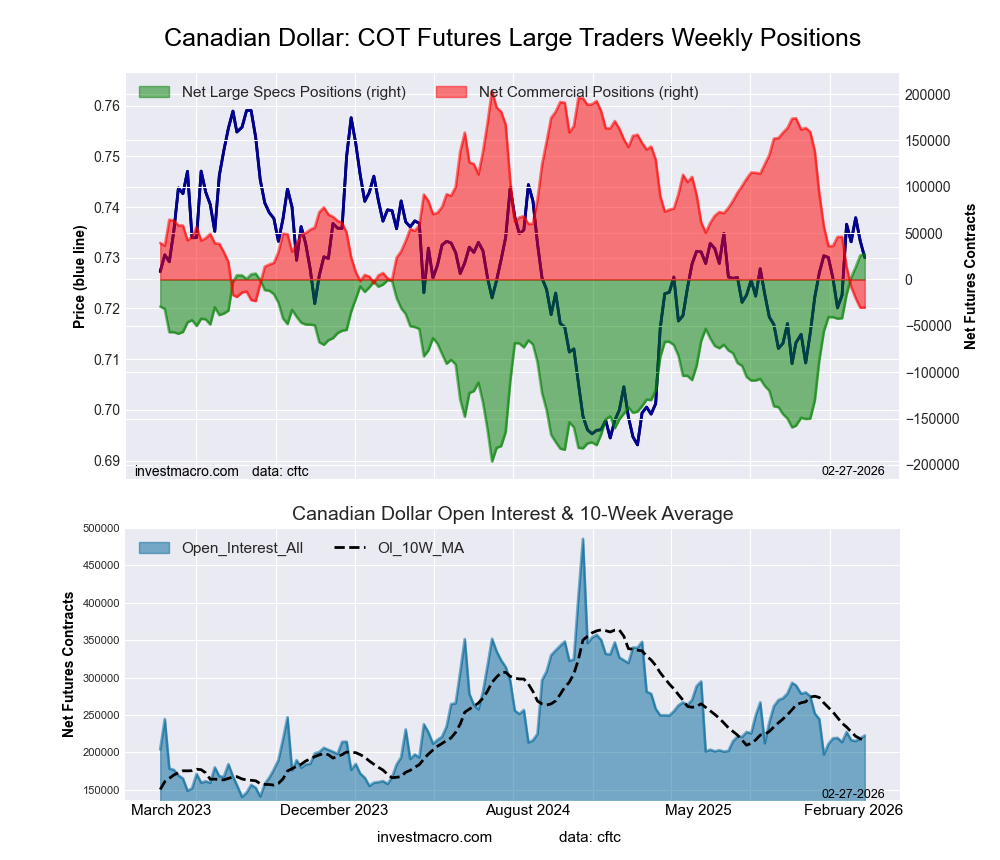 The Canadian Dollar large speculator standing this week came in at a net position of 27,578 contracts in the data reported through Tuesday. This was a weekly lift of 1,752 contracts from the previous week which had a total of 25,826 net contracts.
This week’s current strength score (the trader positioning range over the past three years, measured from 0 to 100) shows the speculators are currently Bullish-Extreme with a score of 100.0 percent. The commercials are Bearish-Extreme with a score of 0.0 percent and the small traders (not shown in chart) are Bullish with a score of 52.8 percent.
Price Trend-Following Model: Uptrend
Our weekly trend-following model classifies the current market price position as: Uptrend.
| CANADIAN DOLLAR Statistics | SPECULATORS | COMMERCIALS | SMALL TRADERS |
| – Percent of Open Interest Longs: | 41.7 | 42.3 | 13.6 |
| – Percent of Open Interest Shorts: | 29.3 | 55.9 | 12.4 |
| – Net Position: | 27,578 | -30,260 | 2,682 |
| – Gross Longs: | 92,812 | 94,074 | 30,230 |
| – Gross Shorts: | 65,234 | 124,334 | 27,548 |
| – Long to Short Ratio: | 1.4 to 1 | 0.8 to 1 | 1.1 to 1 |
| NET POSITION TREND: | |||
| – Strength Index Score (3 Year Range Pct): | 100.0 | 0.0 | 52.8 |
| – Strength Index Reading (3 Year Range): | Bullish-Extreme | Bearish-Extreme | Bullish |
| NET POSITION MOVEMENT INDEX: | |||
| – 6-Week Change in Strength Index: | 31.2 | -32.5 | 17.4 |
Australian Dollar Futures:
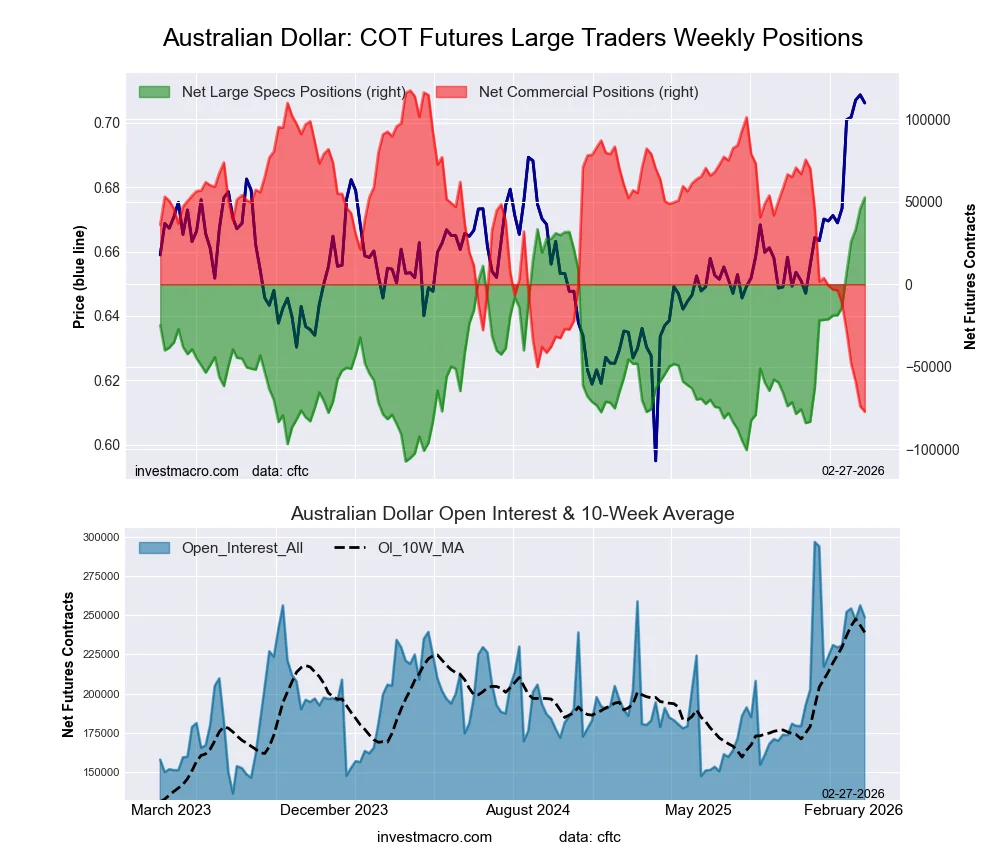 The Australian Dollar large speculator standing this week came in at a net position of 52,644 contracts in the data reported through Tuesday. This was a weekly increase of 6,713 contracts from the previous week which had a total of 45,931 net contracts.
This week’s current strength score (the trader positioning range over the past three years, measured from 0 to 100) shows the speculators are currently Bullish-Extreme with a score of 100.0 percent. The commercials are Bearish-Extreme with a score of 0.0 percent and the small traders (not shown in chart) are Bullish-Extreme with a score of 92.7 percent.
Price Trend-Following Model: Strong Uptrend
Our weekly trend-following model classifies the current market price position as: Strong Uptrend.
| AUSTRALIAN DOLLAR Statistics | SPECULATORS | COMMERCIALS | SMALL TRADERS |
| – Percent of Open Interest Longs: | 48.9 | 30.3 | 17.1 |
| – Percent of Open Interest Shorts: | 27.8 | 61.4 | 7.2 |
| – Net Position: | 52,644 | -77,313 | 24,669 |
| – Gross Longs: | 121,661 | 75,380 | 42,604 |
| – Gross Shorts: | 69,017 | 152,693 | 17,935 |
| – Long to Short Ratio: | 1.8 to 1 | 0.5 to 1 | 2.4 to 1 |
| NET POSITION TREND: | |||
| – Strength Index Score (3 Year Range Pct): | 100.0 | 0.0 | 92.7 |
| – Strength Index Reading (3 Year Range): | Bullish-Extreme | Bearish-Extreme | Bullish-Extreme |
| NET POSITION MOVEMENT INDEX: | |||
| – 6-Week Change in Strength Index: | 44.6 | -37.8 | 4.7 |
New Zealand Dollar Futures:
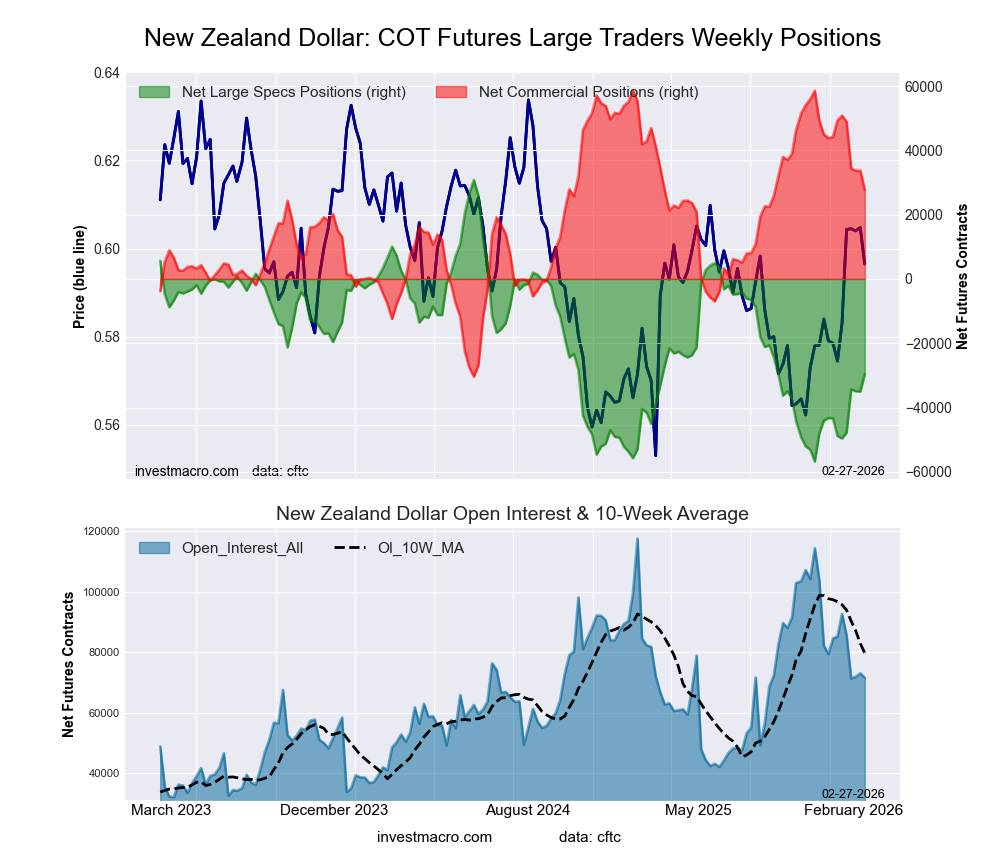 The New Zealand Dollar large speculator standing this week came in at a net position of -29,567 contracts in the data reported through Tuesday. This was a weekly boost of 5,446 contracts from the previous week which had a total of -35,013 net contracts.
This week’s current strength score (the trader positioning range over the past three years, measured from 0 to 100) shows the speculators are currently Bearish with a score of 31.1 percent. The commercials are Bullish with a score of 65.2 percent and the small traders (not shown in chart) are Bullish with a score of 77.2 percent.
Price Trend-Following Model: Strong Uptrend
Our weekly trend-following model classifies the current market price position as: Strong Uptrend.
| NEW ZEALAND DOLLAR Statistics | SPECULATORS | COMMERCIALS | SMALL TRADERS |
| – Percent of Open Interest Longs: | 19.4 | 70.2 | 7.0 |
| – Percent of Open Interest Shorts: | 60.7 | 31.6 | 4.3 |
| – Net Position: | -29,567 | 27,657 | 1,910 |
| – Gross Longs: | 13,839 | 50,226 | 5,009 |
| – Gross Shorts: | 43,406 | 22,569 | 3,099 |
| – Long to Short Ratio: | 0.3 to 1 | 2.2 to 1 | 1.6 to 1 |
| NET POSITION TREND: | |||
| – Strength Index Score (3 Year Range Pct): | 31.1 | 65.2 | 77.2 |
| – Strength Index Reading (3 Year Range): | Bearish | Bullish | Bullish |
| NET POSITION MOVEMENT INDEX: | |||
| – 6-Week Change in Strength Index: | 22.0 | -24.4 | 31.5 |
Mexican Peso Futures:
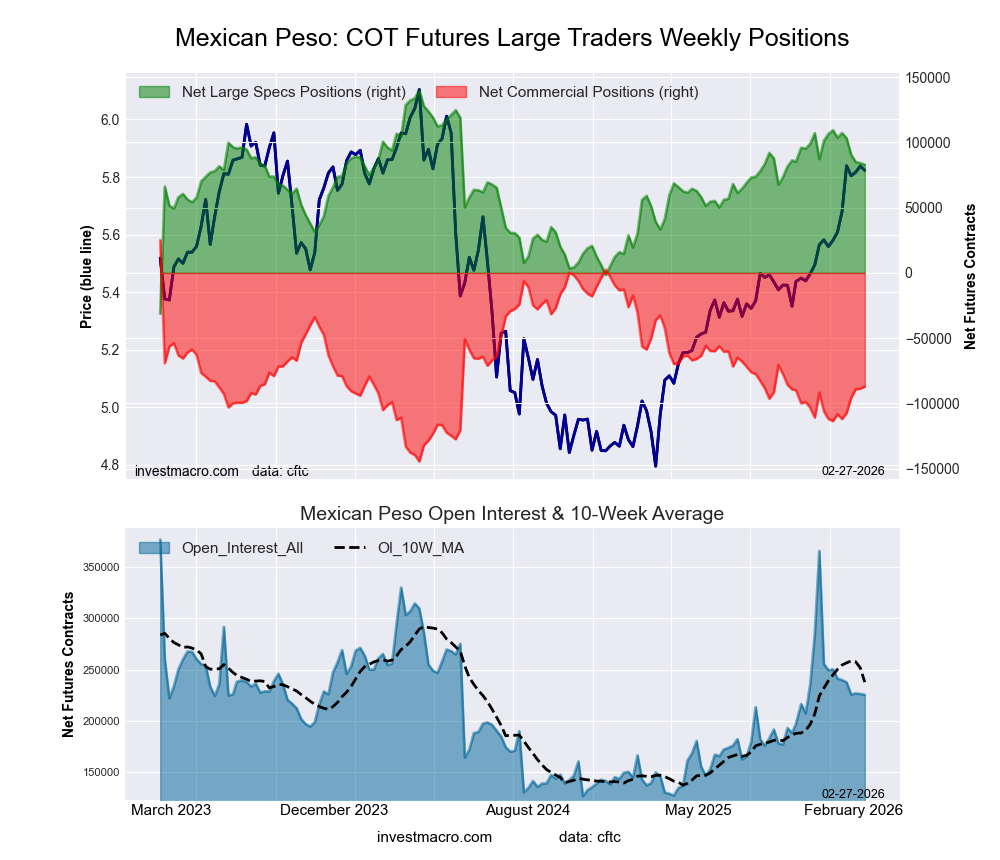 The Mexican Peso large speculator standing this week came in at a net position of 82,880 contracts in the data reported through Tuesday. This was a weekly lowering of -1,242 contracts from the previous week which had a total of 84,122 net contracts.
This week’s current strength score (the trader positioning range over the past three years, measured from 0 to 100) shows the speculators are currently Bullish with a score of 66.8 percent. The commercials are Bearish with a score of 33.8 percent and the small traders (not shown in chart) are Bearish with a score of 46.3 percent.
Price Trend-Following Model: Uptrend
Our weekly trend-following model classifies the current market price position as: Uptrend.
| MEXICAN PESO Statistics | SPECULATORS | COMMERCIALS | SMALL TRADERS |
| – Percent of Open Interest Longs: | 55.9 | 37.7 | 3.1 |
| – Percent of Open Interest Shorts: | 19.1 | 76.3 | 1.3 |
| – Net Position: | 82,880 | -87,127 | 4,247 |
| – Gross Longs: | 126,009 | 85,018 | 7,071 |
| – Gross Shorts: | 43,129 | 172,145 | 2,824 |
| – Long to Short Ratio: | 2.9 to 1 | 0.5 to 1 | 2.5 to 1 |
| NET POSITION TREND: | |||
| – Strength Index Score (3 Year Range Pct): | 66.8 | 33.8 | 46.3 |
| – Strength Index Reading (3 Year Range): | Bullish | Bearish | Bearish |
| NET POSITION MOVEMENT INDEX: | |||
| – 6-Week Change in Strength Index: | -12.1 | 12.4 | -2.1 |
Brazilian Real Futures:
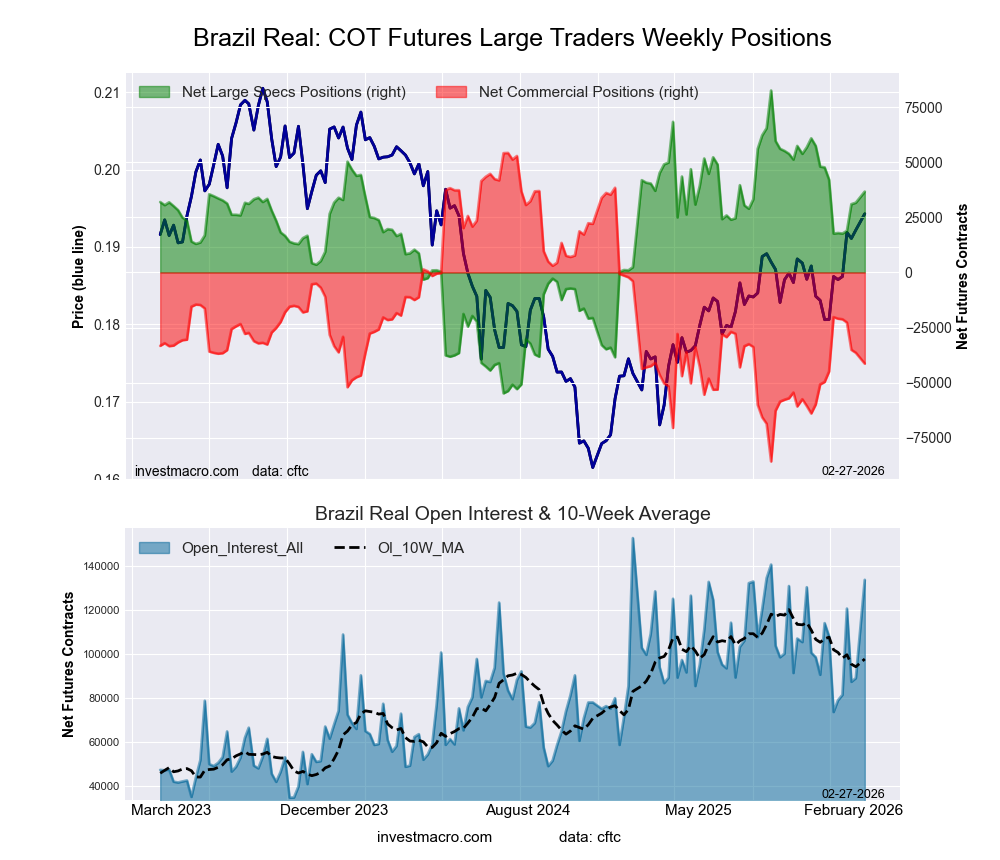 The Brazilian Real large speculator standing this week came in at a net position of 36,674 contracts in the data reported through Tuesday. This was a weekly rise of 2,012 contracts from the previous week which had a total of 31,643 net contracts.
This week’s current strength score (the trader positioning range over the past three years, measured from 0 to 100) shows the speculators are currently Bullish with a score of 66.6 percent. The commercials are Bearish with a score of 31.7 percent and the small traders (not shown in chart) are Bearish with a score of 47.5 percent.
Price Trend-Following Model: Strong Uptrend
Our weekly trend-following model classifies the current market price position as: Strong Uptrend.
| BRAZIL REAL Statistics | SPECULATORS | COMMERCIALS | SMALL TRADERS |
| – Percent of Open Interest Longs: | 53.5 | 38.4 | 4.3 |
| – Percent of Open Interest Shorts: | 26.0 | 69.4 | 0.8 |
| – Net Position: | 36,674 | -41,394 | 4,720 |
| – Gross Longs: | 71,431 | 51,277 | 5,780 |
| – Gross Shorts: | 34,757 | 92,671 | 1,060 |
| – Long to Short Ratio: | 2.1 to 1 | 0.6 to 1 | 5.5 to 1 |
| NET POSITION TREND: | |||
| – Strength Index Score (3 Year Range Pct): | 66.6 | 31.7 | 47.5 |
| – Strength Index Reading (3 Year Range): | Bullish | Bearish | Bearish |
| NET POSITION MOVEMENT INDEX: | |||
| – 6-Week Change in Strength Index: | 13.7 | -14.6 | 9.0 |
Bitcoin Futures:
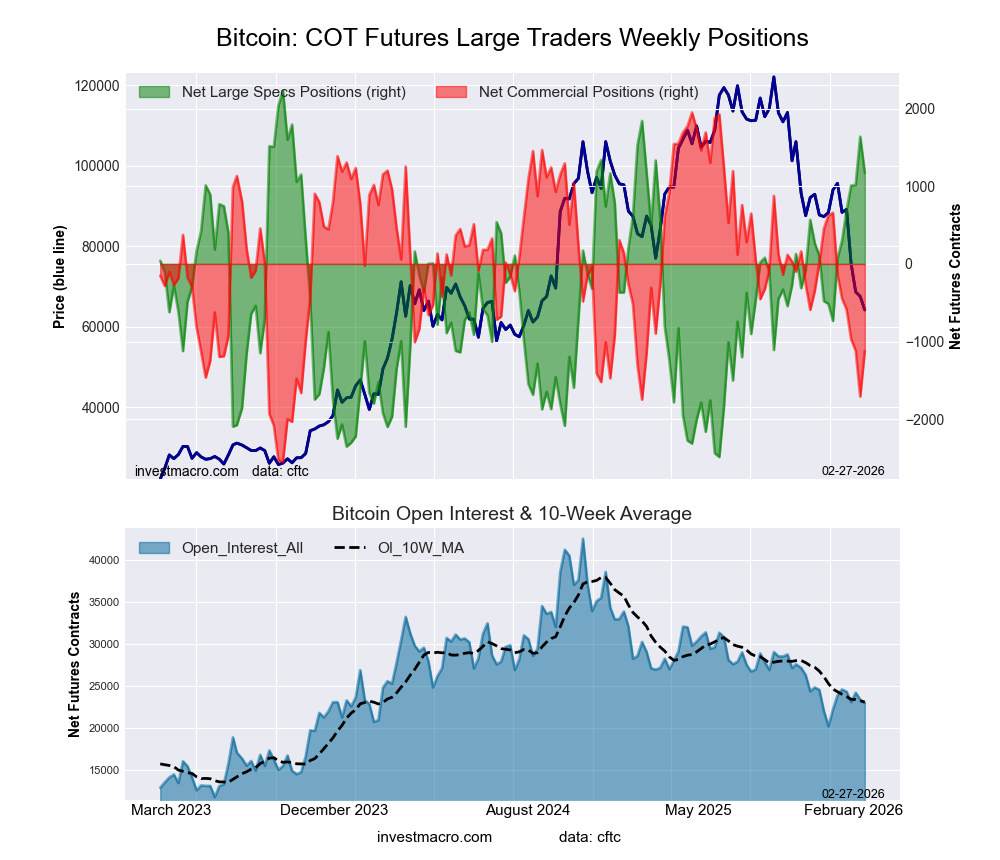 The Bitcoin large speculator standing this week came in at a net position of 1,172 contracts in the data reported through Tuesday. This was a weekly reduction of -466 contracts from the previous week which had a total of 1,638 net contracts.
This week’s current strength score (the trader positioning range over the past three years, measured from 0 to 100) shows the speculators are currently Bullish with a score of 77.5 percent. The commercials are Bearish with a score of 31.7 percent and the small traders (not shown in chart) are Bearish with a score of 34.6 percent.
Price Trend-Following Model: Strong Downtrend
Our weekly trend-following model classifies the current market price position as: Strong Downtrend.
| BITCOIN Statistics | SPECULATORS | COMMERCIALS | SMALL TRADERS |
| – Percent of Open Interest Longs: | 71.6 | 2.1 | 5.1 |
| – Percent of Open Interest Shorts: | 66.5 | 7.0 | 5.3 |
| – Net Position: | 1,172 | -1,120 | -52 |
| – Gross Longs: | 16,410 | 485 | 1,162 |
| – Gross Shorts: | 15,238 | 1,605 | 1,214 |
| – Long to Short Ratio: | 1.1 to 1 | 0.3 to 1 | 1.0 to 1 |
| NET POSITION TREND: | |||
| – Strength Index Score (3 Year Range Pct): | 77.5 | 31.7 | 34.6 |
| – Strength Index Reading (3 Year Range): | Bullish | Bearish | Bearish |
| NET POSITION MOVEMENT INDEX: | |||
| – 6-Week Change in Strength Index: | 23.4 | -22.0 | -6.1 |
Article By InvestMacro – Receive our weekly COT Newsletter
*COT Report: The COT data, released weekly to the public each Friday, is updated through the most recent Tuesday (data is 3 days old) and shows a quick view of how large speculators or non-commercials (for-profit traders) were positioned in the futures markets.
The CFTC categorizes trader positions according to commercial hedgers (traders who use futures contracts for hedging as part of the business), non-commercials (large traders who speculate to realize trading profits) and nonreportable traders (usually small traders/speculators) as well as their open interest (contracts open in the market at time of reporting). See CFTC criteria here.