By InvestMacro | COT | Data Tables | COT Leaders | Downloads | COT Newsletter
Here are the latest charts and statistics for the Commitment of Traders (COT) data published by the Commodities Futures Trading Commission (CFTC).
The latest COT data is updated through Tuesday December 7th 2021 and shows a quick view of how large traders (for-profit speculators and commercial entities) were positioned in the futures markets. All currency positions are in direct relation to the US dollar where, for example, a bet for the euro is a bet that the euro will rise versus the dollar while a bet against the euro will be a bet that the euro will decline versus the dollar.
Highlighting this week’s COT currency data was the further retreat of bearish bets in the Japanese yen futures contracts. Yen speculators cut back on their bearish bets for a second straight week this week and for the fourth time in the past five weeks. Over this five-week time-frame, yen bets have improved by a total of +44,543 contracts, going from -105,351 net positions on November 9th to -63,081 net positions this week. This recent improvement in yen positions has taken place very sharply as bets have gained by at least +12,000 contracts in three out of the past four weeks. Yen open interest has also been sharply falling as open interest contracts have dropped by -46,927 contracts over the past three weeks – suggesting a reversal could be underway as the shorts are liquidating their positions (-41,532 contracts past 3 weeks) at a faster rate than the longs (-11,487 contracts past 3 weeks).
Joining the yen (15,785 contracts) with positive changes this week were the Euro (14,941 contracts), Brazil real (8,218 contracts), Swiss franc (2,129 contracts), British pound sterling (622 contracts), New Zealand dollar (78 contracts), Canadian dollar (4,717 contracts), Russian ruble (162 contracts) and Bitcoin (783 contracts).
The currencies with declining bets were the US Dollar Index (-1,014 contracts), Australian dollar (-1,607 contracts), Mexican peso (-4,379 contracts) and Bitcoin (783 contracts).
| Dec-07-2021 | OI | OI-Index | Spec-Net | Spec-Index | Com-Net | COM-Index | Smalls-Net | Smalls-Index |
|---|
| USD Index | 59,994 | 89 | 34,865 | 86 | -40,206 | 8 | 5,341 | 75 |
| EUR | 716,213 | 90 | -8,299 | 32 | -20,175 | 70 | 28,474 | 22 |
| GBP | 238,310 | 63 | -38,277 | 46 | 54,624 | 62 | -16,347 | 22 |
| JPY | 205,970 | 59 | -63,081 | 28 | 80,497 | 76 | -17,416 | 12 |
| CHF | 51,229 | 30 | -12,053 | 49 | 20,346 | 54 | -8,293 | 39 |
| CAD | 155,078 | 34 | -9,358 | 47 | 6,137 | 55 | 3,221 | 52 |
| AUD | 212,150 | 92 | -81,792 | 8 | 98,874 | 93 | -17,082 | 11 |
| NZD | 55,975 | 55 | 10,708 | 89 | -8,875 | 17 | -1,833 | 31 |
| MXN | 200,173 | 48 | -64,126 | 0 | 65,233 | 100 | -1,107 | 38 |
| RUB | 59,970 | 70 | 13,799 | 46 | -15,565 | 50 | 1,766 | 83 |
| BRL | 25,487 | 20 | -5,624 | 61 | 5,835 | 41 | -211 | 64 |
| Bitcoin | 13,242 | 75 | -908 | 82 | 117 | 0 | 791 | 31 |
US Dollar Index Futures:
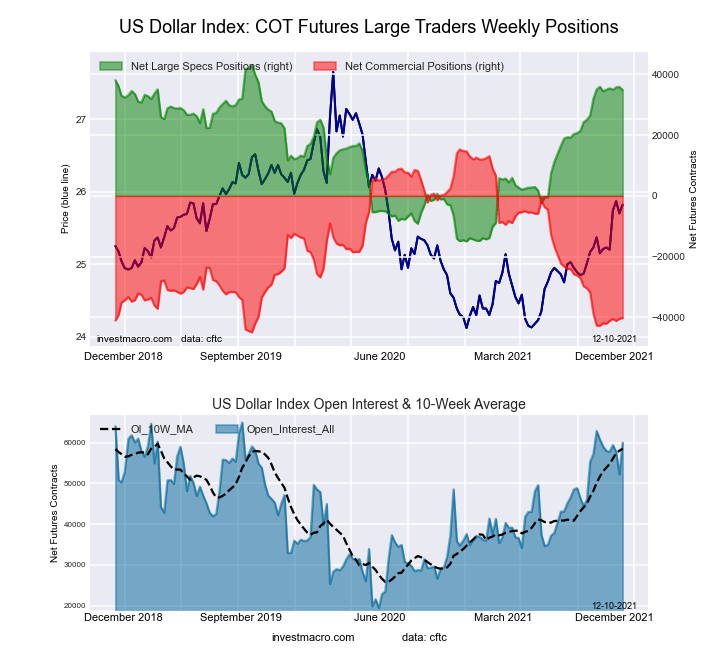 The US Dollar Index large speculator standing this week equaled a net position of 34,865 contracts in the data reported through Tuesday. This was a weekly decrease of -1,014 contracts from the previous week which had a total of 35,879 net contracts.
This week’s current strength score (the trader positioning range over the past three years, measured from 0 to 100) shows the speculators are currently Bullish-Extreme with a score of 85.9 percent. The commercials are Bearish-Extreme with a score of 7.8 percent and the small traders (not shown in chart) are Bullish with a score of 75.0 percent.
| US DOLLAR INDEX Statistics | SPECULATORS | COMMERCIALS | SMALL TRADERS |
| – Percent of Open Interest Longs: | 71.8 | 6.3 | 12.8 |
| – Percent of Open Interest Shorts: | 13.7 | 73.3 | 3.9 |
| – Net Position: | 34,865 | -40,206 | 5,341 |
| – Gross Longs: | 43,058 | 3,775 | 7,699 |
| – Gross Shorts: | 8,193 | 43,981 | 2,358 |
| – Long to Short Ratio: | 5.3 to 1 | 0.1 to 1 | 3.3 to 1 |
| NET POSITION TREND: | | | |
| – Strength Index Score (3 Year Range Pct): | 85.9 | 7.8 | 75.0 |
| – Strength Index Reading (3 Year Range): | Bullish-Extreme | Bearish-Extreme | Bullish |
| NET POSITION MOVEMENT INDEX: | | | |
| – 6-Week Change in Strength Index: | 0.7 | 2.9 | -23.5 |
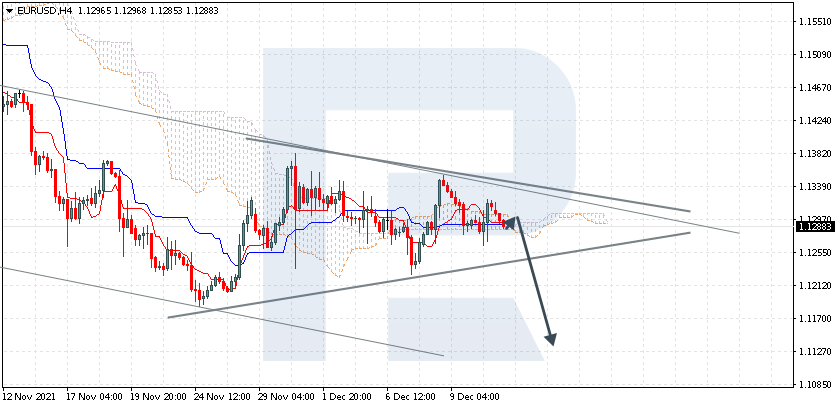
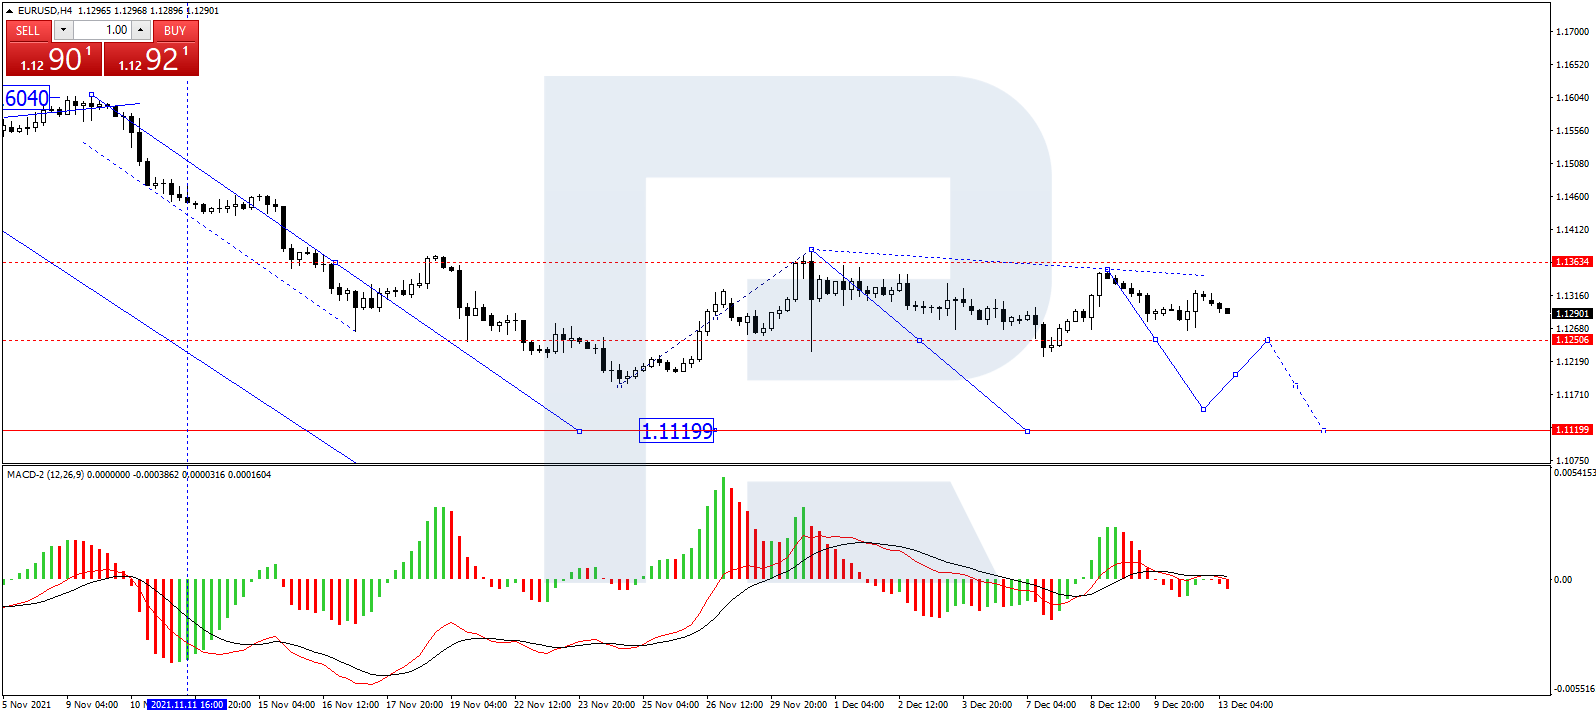
Euro Currency Futures:
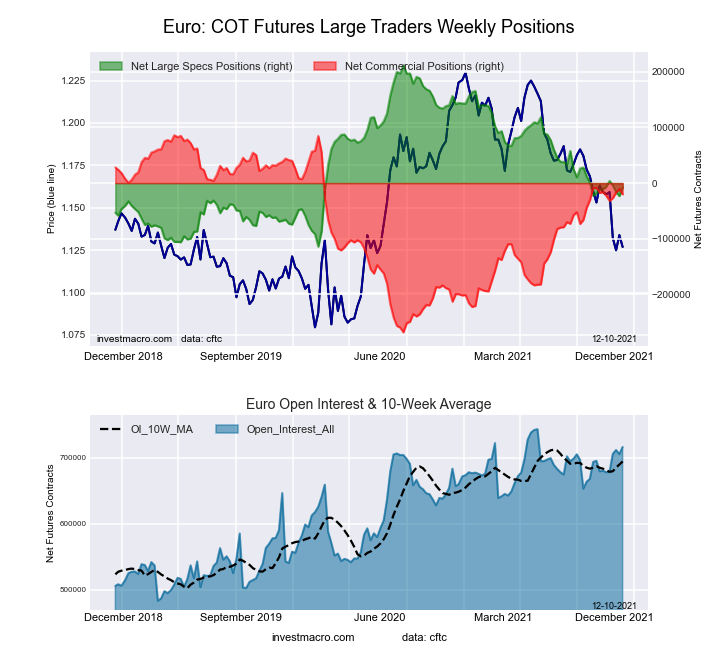 The Euro Currency large speculator standing this week equaled a net position of -8,299 contracts in the data reported through Tuesday. This was a weekly boost of 14,941 contracts from the previous week which had a total of -23,240 net contracts.
This week’s current strength score (the trader positioning range over the past three years, measured from 0 to 100) shows the speculators are currently Bearish with a score of 32.5 percent. The commercials are Bullish with a score of 70.0 percent and the small traders (not shown in chart) are Bearish with a score of 21.6 percent.
| EURO Currency Statistics | SPECULATORS | COMMERCIALS | SMALL TRADERS |
| – Percent of Open Interest Longs: | 27.2 | 58.5 | 12.1 |
| – Percent of Open Interest Shorts: | 28.4 | 61.3 | 8.1 |
| – Net Position: | -8,299 | -20,175 | 28,474 |
| – Gross Longs: | 194,869 | 418,656 | 86,435 |
| – Gross Shorts: | 203,168 | 438,831 | 57,961 |
| – Long to Short Ratio: | 1.0 to 1 | 1.0 to 1 | 1.5 to 1 |
| NET POSITION TREND: | | | |
| – Strength Index Score (3 Year Range Pct): | 32.5 | 70.0 | 21.6 |
| – Strength Index Reading (3 Year Range): | Bearish | Bullish | Bearish |
| NET POSITION MOVEMENT INDEX: | | | |
| – 6-Week Change in Strength Index: | 0.9 | -1.1 | 1.6 |
British Pound Sterling Futures:
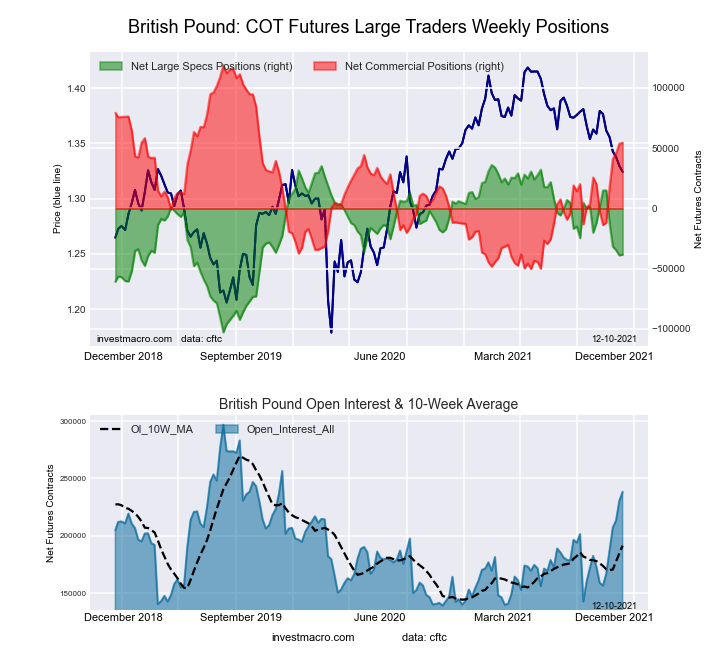 The British Pound Sterling large speculator standing this week equaled a net position of -38,277 contracts in the data reported through Tuesday. This was a weekly increase of 622 contracts from the previous week which had a total of -38,899 net contracts.
This week’s current strength score (the trader positioning range over the past three years, measured from 0 to 100) shows the speculators are currently Bearish with a score of 46.4 percent. The commercials are Bullish with a score of 62.0 percent and the small traders (not shown in chart) are Bearish with a score of 21.8 percent.
| BRITISH POUND Statistics | SPECULATORS | COMMERCIALS | SMALL TRADERS |
| – Percent of Open Interest Longs: | 20.5 | 67.3 | 10.0 |
| – Percent of Open Interest Shorts: | 36.6 | 44.3 | 16.8 |
| – Net Position: | -38,277 | 54,624 | -16,347 |
| – Gross Longs: | 48,950 | 160,312 | 23,763 |
| – Gross Shorts: | 87,227 | 105,688 | 40,110 |
| – Long to Short Ratio: | 0.6 to 1 | 1.5 to 1 | 0.6 to 1 |
| NET POSITION TREND: | | | |
| – Strength Index Score (3 Year Range Pct): | 46.4 | 62.0 | 21.8 |
| – Strength Index Reading (3 Year Range): | Bearish | Bullish | Bearish |
| NET POSITION MOVEMENT INDEX: | | | |
| – 6-Week Change in Strength Index: | -38.4 | 40.4 | -31.2 |
Japanese Yen Futures:
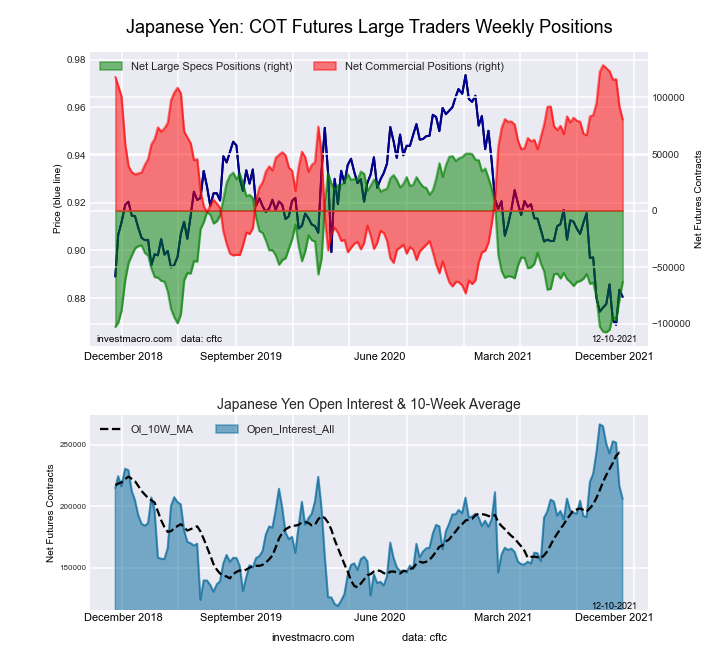 The Japanese Yen large speculator standing this week equaled a net position of -63,081 contracts in the data reported through Tuesday. This was a weekly advance of 15,785 contracts from the previous week which had a total of -78,866 net contracts.
This week’s current strength score (the trader positioning range over the past three years, measured from 0 to 100) shows the speculators are currently Bearish with a score of 28.2 percent. The commercials are Bullish with a score of 76.2 percent and the small traders (not shown in chart) are Bearish-Extreme with a score of 12.1 percent.
| JAPANESE YEN Statistics | SPECULATORS | COMMERCIALS | SMALL TRADERS |
| – Percent of Open Interest Longs: | 6.4 | 79.5 | 9.1 |
| – Percent of Open Interest Shorts: | 37.0 | 40.5 | 17.5 |
| – Net Position: | -63,081 | 80,497 | -17,416 |
| – Gross Longs: | 13,148 | 163,847 | 18,654 |
| – Gross Shorts: | 76,229 | 83,350 | 36,070 |
| – Long to Short Ratio: | 0.2 to 1 | 2.0 to 1 | 0.5 to 1 |
| NET POSITION TREND: | | | |
| – Strength Index Score (3 Year Range Pct): | 28.2 | 76.2 | 12.1 |
| – Strength Index Reading (3 Year Range): | Bearish | Bullish | Bearish-Extreme |
| NET POSITION MOVEMENT INDEX: | | | |
| – 6-Week Change in Strength Index: | 27.8 | -23.8 | 8.9 |
Swiss Franc Futures:
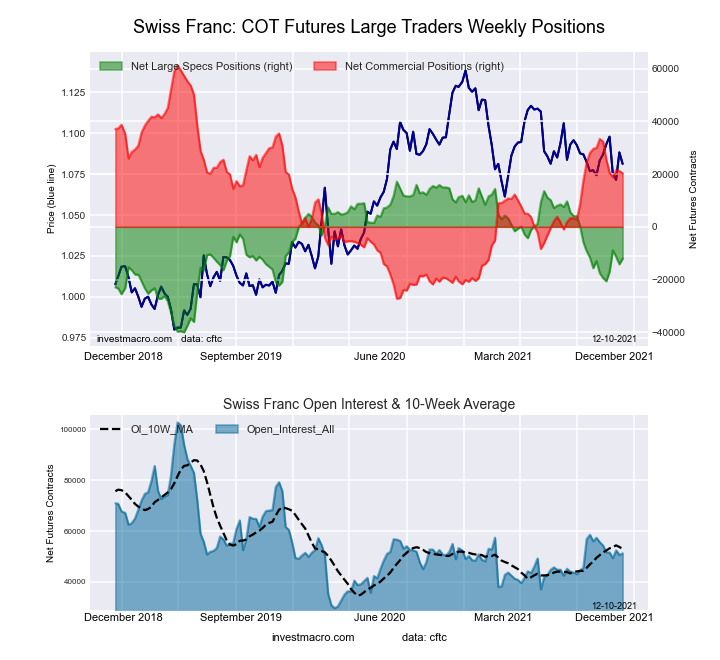 The Swiss Franc large speculator standing this week equaled a net position of -12,053 contracts in the data reported through Tuesday. This was a weekly rise of 2,129 contracts from the previous week which had a total of -14,182 net contracts.
This week’s current strength score (the trader positioning range over the past three years, measured from 0 to 100) shows the speculators are currently Bearish with a score of 48.9 percent. The commercials are Bullish with a score of 53.7 percent and the small traders (not shown in chart) are Bearish with a score of 38.9 percent.
| SWISS FRANC Statistics | SPECULATORS | COMMERCIALS | SMALL TRADERS |
| – Percent of Open Interest Longs: | 5.5 | 65.5 | 22.8 |
| – Percent of Open Interest Shorts: | 29.1 | 25.8 | 39.0 |
| – Net Position: | -12,053 | 20,346 | -8,293 |
| – Gross Longs: | 2,838 | 33,542 | 11,696 |
| – Gross Shorts: | 14,891 | 13,196 | 19,989 |
| – Long to Short Ratio: | 0.2 to 1 | 2.5 to 1 | 0.6 to 1 |
| NET POSITION TREND: | | | |
| – Strength Index Score (3 Year Range Pct): | 48.9 | 53.7 | 38.9 |
| – Strength Index Reading (3 Year Range): | Bearish | Bullish | Bearish |
| NET POSITION MOVEMENT INDEX: | | | |
| – 6-Week Change in Strength Index: | 12.8 | -13.6 | 13.7 |
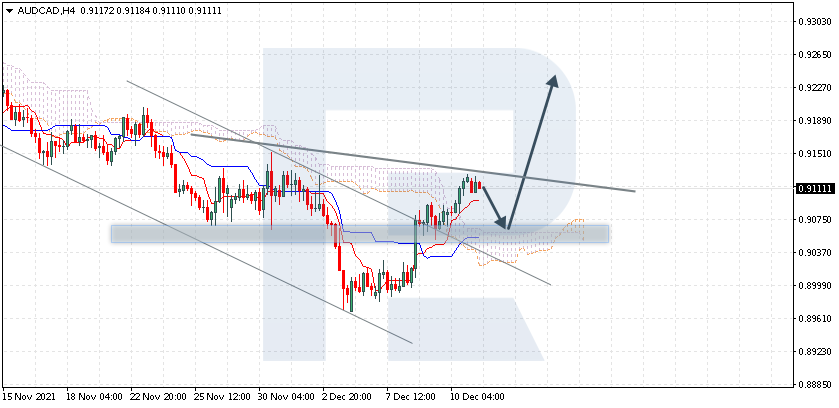
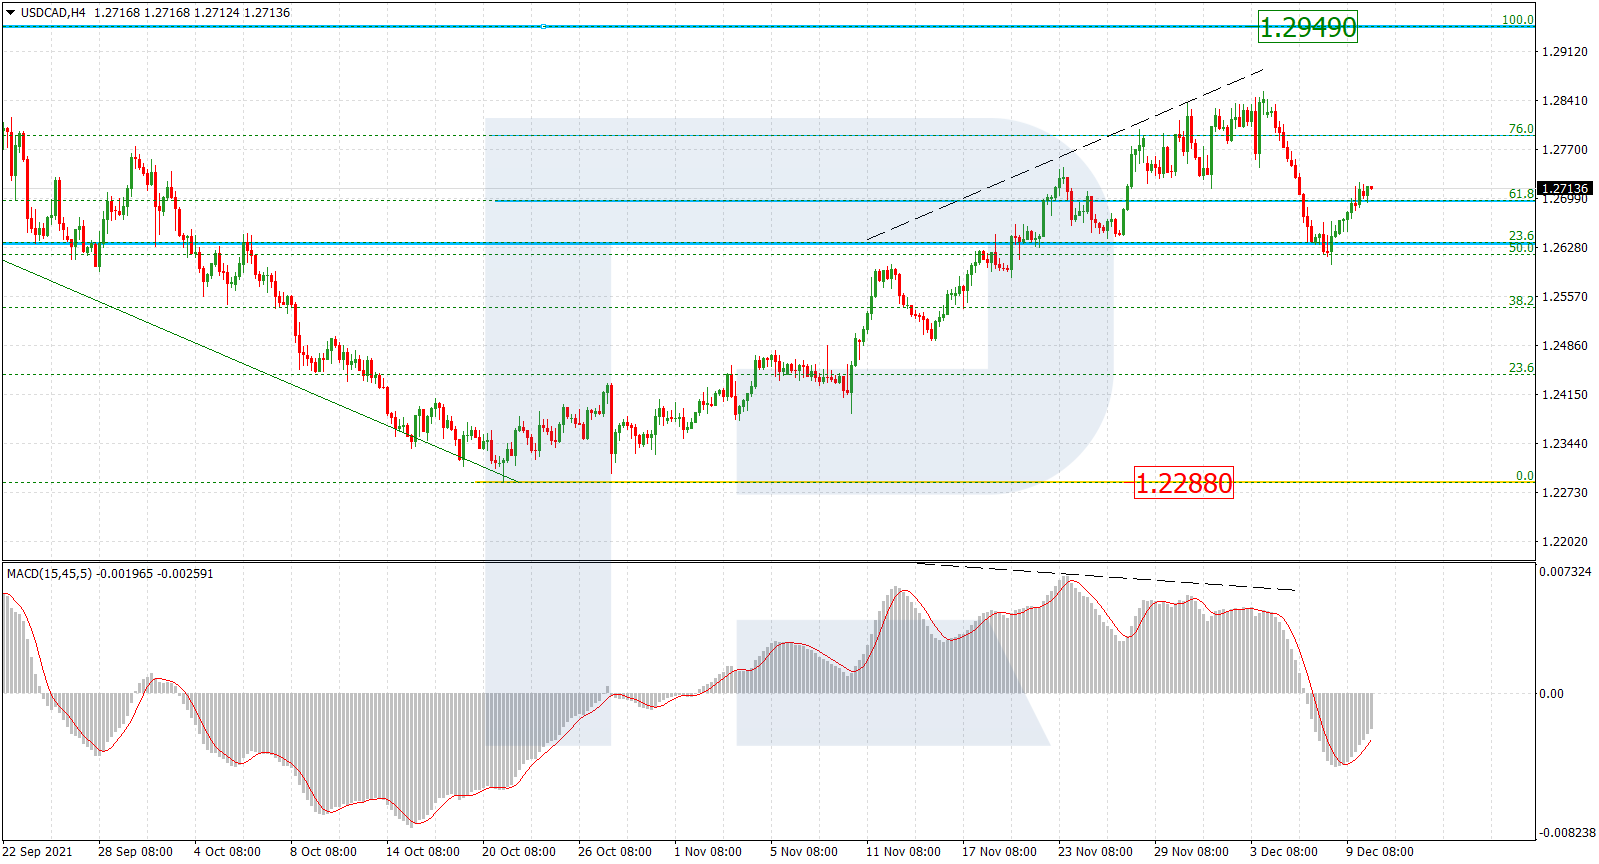
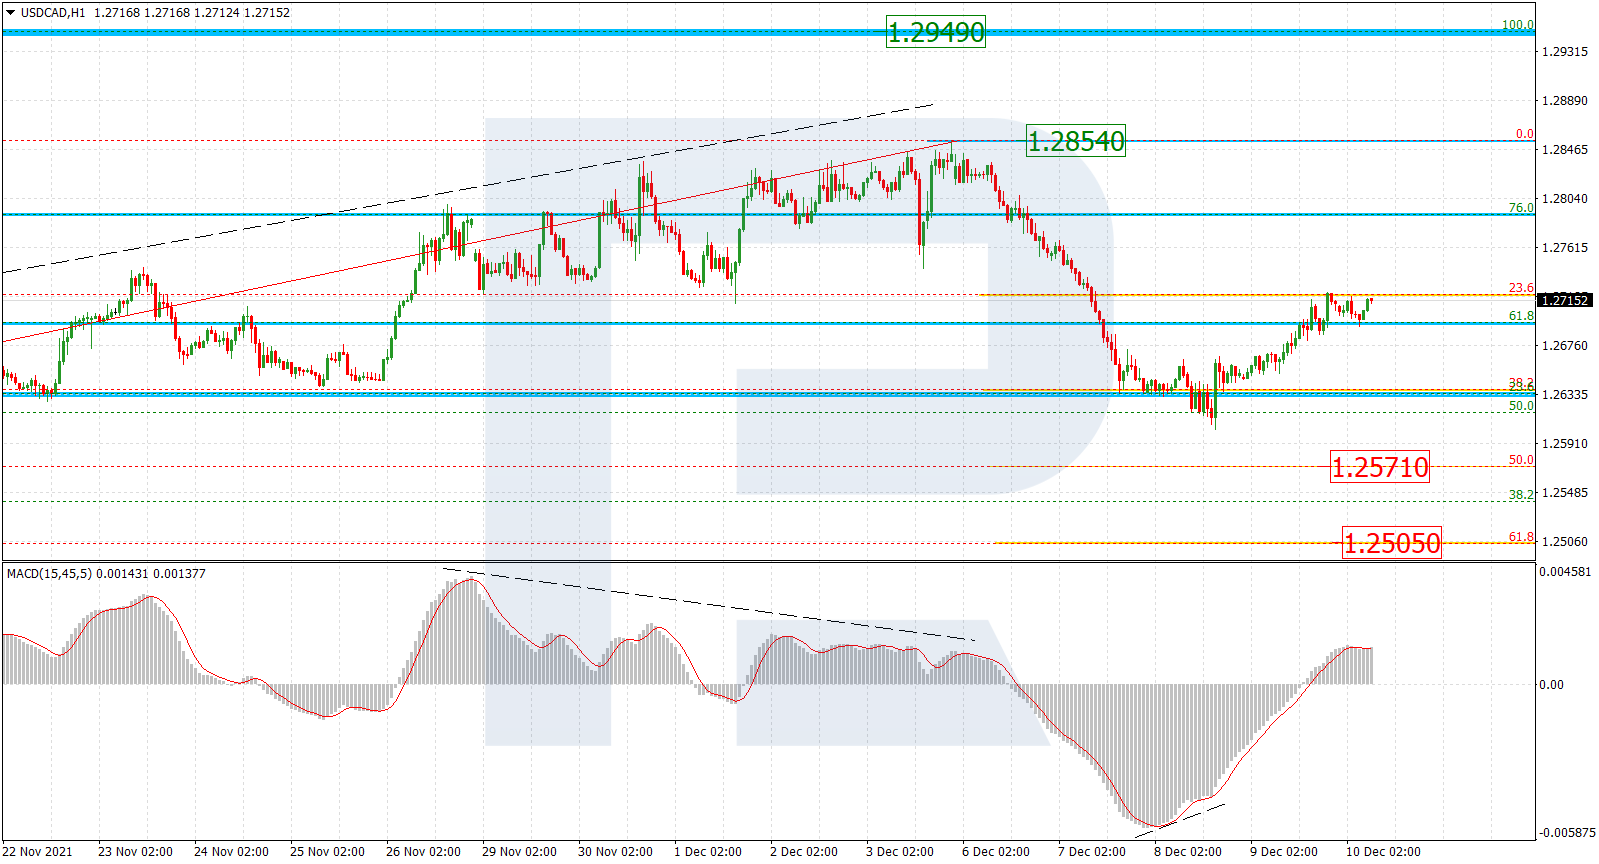
Canadian Dollar Futures:
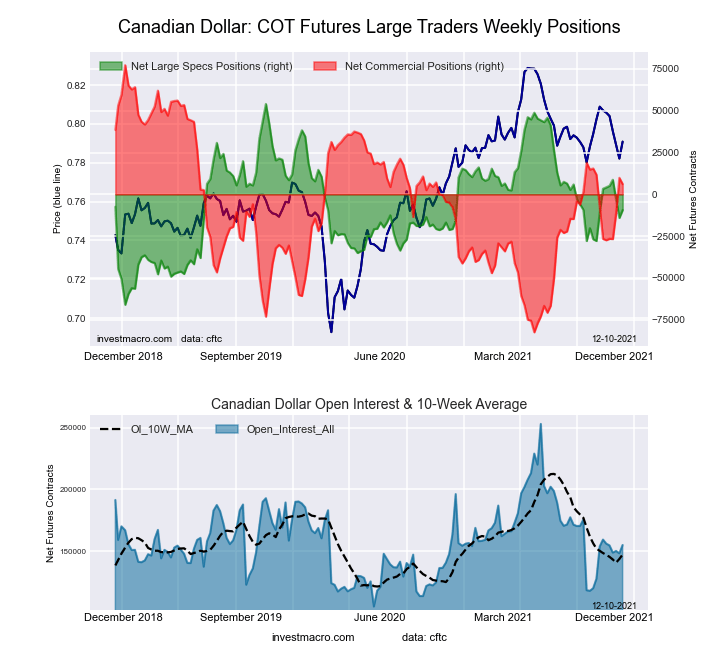 The Canadian Dollar large speculator standing this week equaled a net position of -9,358 contracts in the data reported through Tuesday. This was a weekly boost of 4,717 contracts from the previous week which had a total of -14,075 net contracts.
This week’s current strength score (the trader positioning range over the past three years, measured from 0 to 100) shows the speculators are currently Bearish with a score of 47.2 percent. The commercials are Bullish with a score of 55.5 percent and the small traders (not shown in chart) are Bullish with a score of 51.7 percent.
| CANADIAN DOLLAR Statistics | SPECULATORS | COMMERCIALS | SMALL TRADERS |
| – Percent of Open Interest Longs: | 26.5 | 47.1 | 20.0 |
| – Percent of Open Interest Shorts: | 32.5 | 43.1 | 17.9 |
| – Net Position: | -9,358 | 6,137 | 3,221 |
| – Gross Longs: | 41,095 | 72,984 | 31,046 |
| – Gross Shorts: | 50,453 | 66,847 | 27,825 |
| – Long to Short Ratio: | 0.8 to 1 | 1.1 to 1 | 1.1 to 1 |
| NET POSITION TREND: | | | |
| – Strength Index Score (3 Year Range Pct): | 47.2 | 55.5 | 51.7 |
| – Strength Index Reading (3 Year Range): | Bearish | Bullish | Bullish |
| NET POSITION MOVEMENT INDEX: | | | |
| – 6-Week Change in Strength Index: | -10.6 | 20.5 | -30.3 |
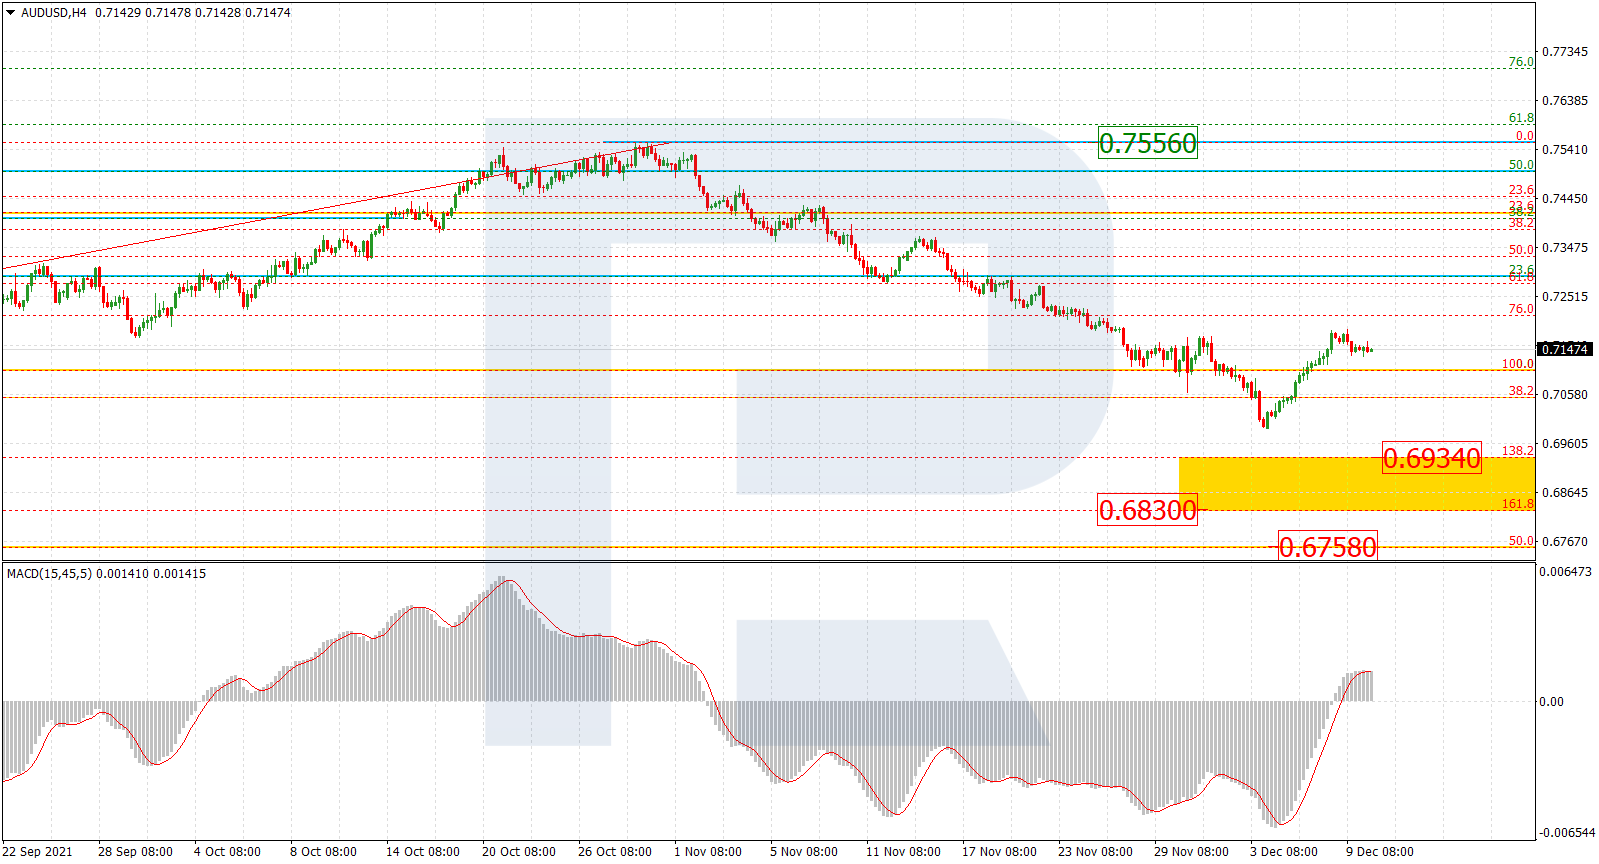
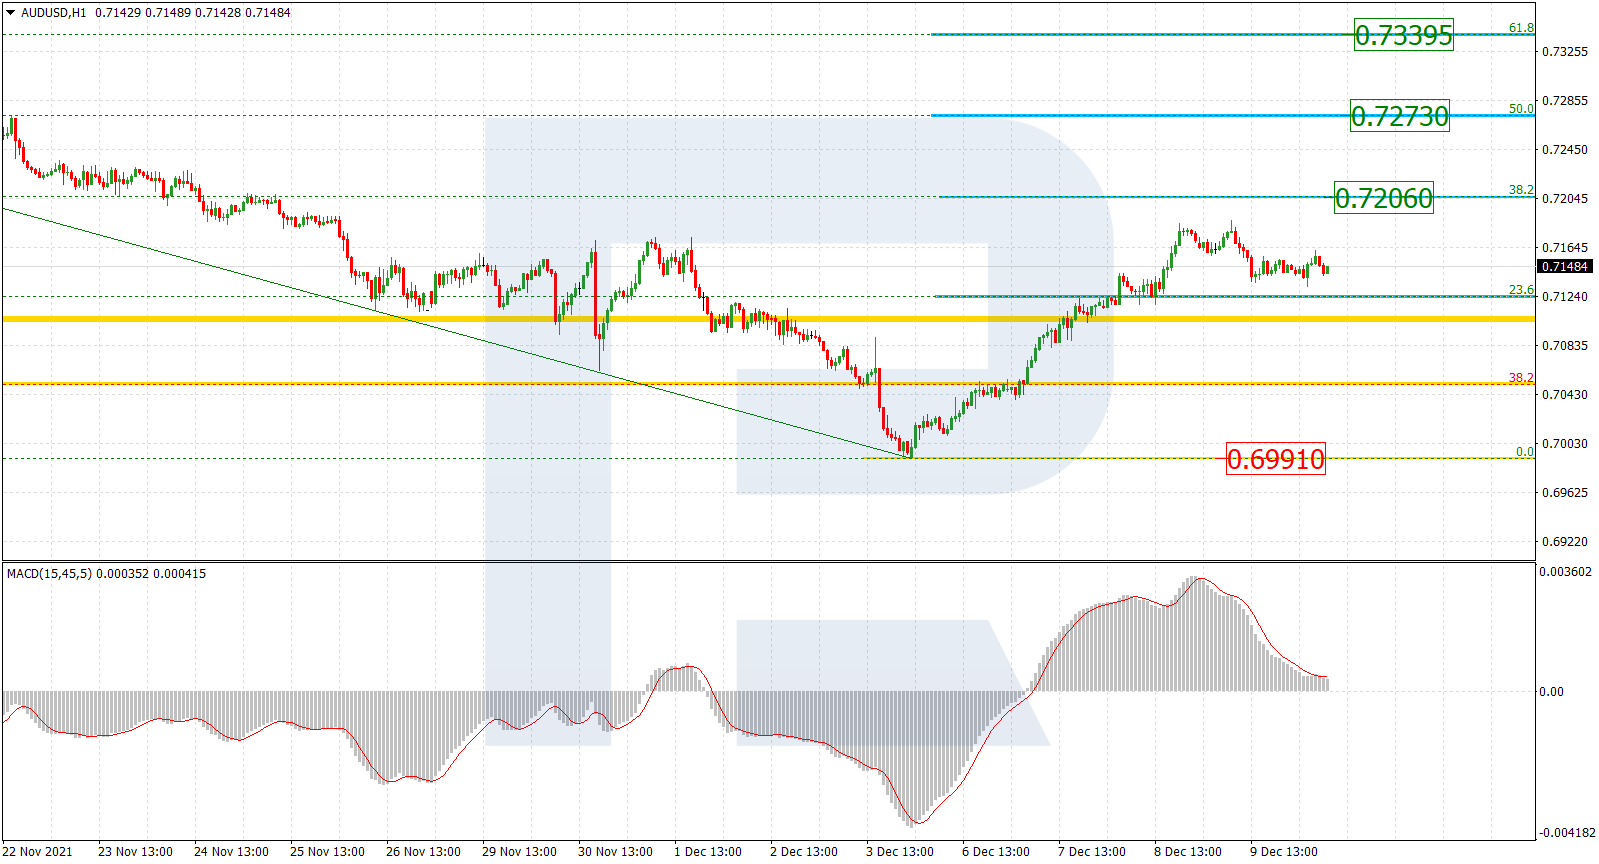
Australian Dollar Futures:
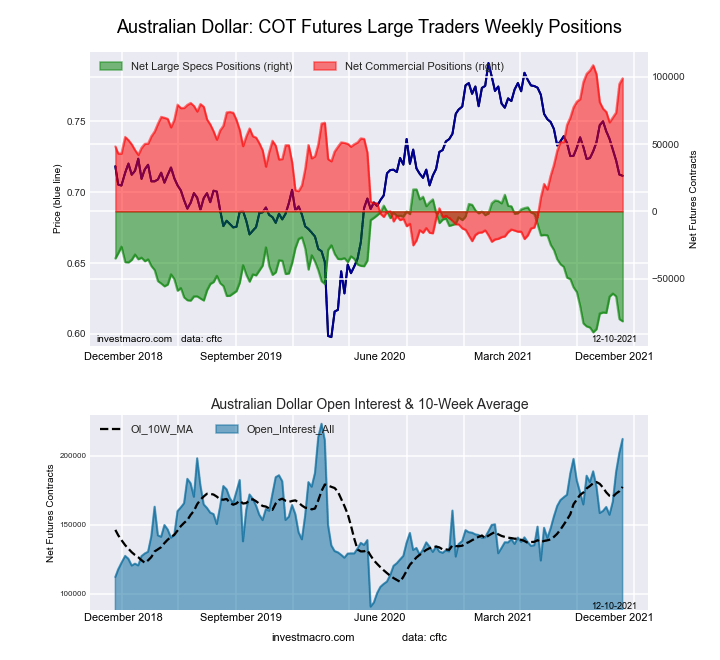 The Australian Dollar large speculator standing this week equaled a net position of -81,792 contracts in the data reported through Tuesday. This was a weekly decline of -1,607 contracts from the previous week which had a total of -80,185 net contracts.
This week’s current strength score (the trader positioning range over the past three years, measured from 0 to 100) shows the speculators are currently Bearish-Extreme with a score of 7.7 percent. The commercials are Bullish-Extreme with a score of 92.7 percent and the small traders (not shown in chart) are Bearish-Extreme with a score of 10.8 percent.
| AUSTRALIAN DOLLAR Statistics | SPECULATORS | COMMERCIALS | SMALL TRADERS |
| – Percent of Open Interest Longs: | 15.7 | 72.0 | 9.3 |
| – Percent of Open Interest Shorts: | 54.3 | 25.4 | 17.4 |
| – Net Position: | -81,792 | 98,874 | -17,082 |
| – Gross Longs: | 33,380 | 152,842 | 19,776 |
| – Gross Shorts: | 115,172 | 53,968 | 36,858 |
| – Long to Short Ratio: | 0.3 to 1 | 2.8 to 1 | 0.5 to 1 |
| NET POSITION TREND: | | | |
| – Strength Index Score (3 Year Range Pct): | 7.7 | 92.7 | 10.8 |
| – Strength Index Reading (3 Year Range): | Bearish-Extreme | Bullish-Extreme | Bearish-Extreme |
| NET POSITION MOVEMENT INDEX: | | | |
| – 6-Week Change in Strength Index: | -6.2 | 16.8 | -38.8 |
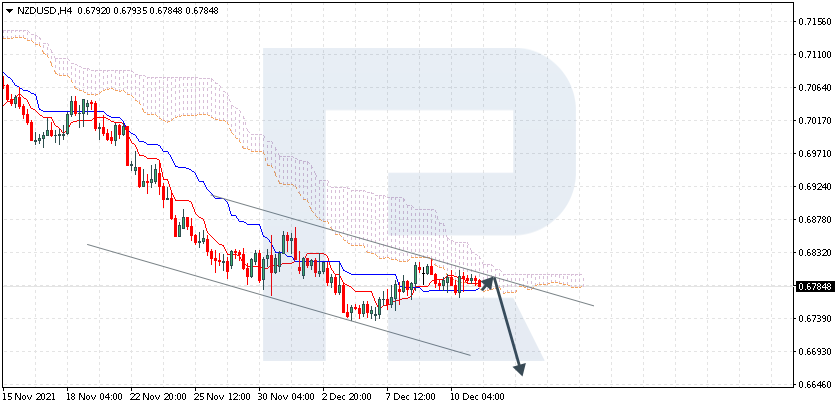
New Zealand Dollar Futures:
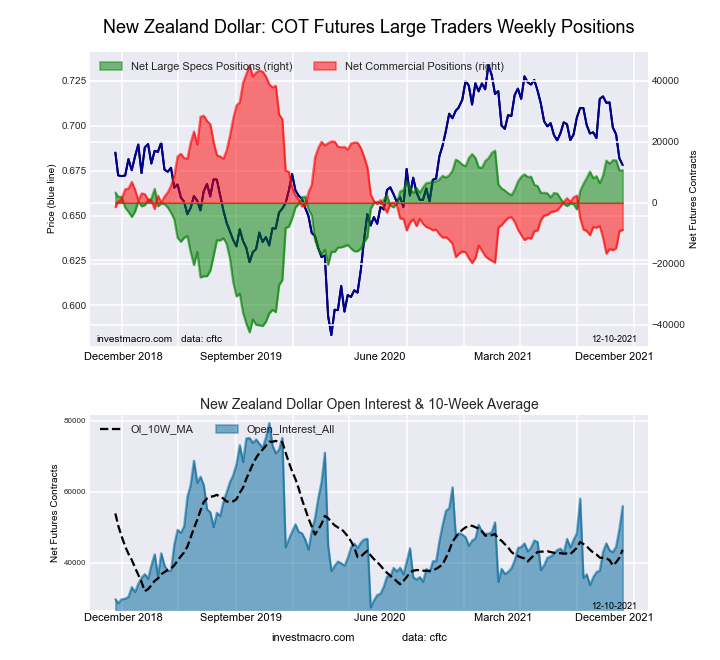 The New Zealand Dollar large speculator standing this week equaled a net position of 10,708 contracts in the data reported through Tuesday. This was a weekly increase of 78 contracts from the previous week which had a total of 10,630 net contracts.
This week’s current strength score (the trader positioning range over the past three years, measured from 0 to 100) shows the speculators are currently Bullish-Extreme with a score of 89.2 percent. The commercials are Bearish-Extreme with a score of 16.7 percent and the small traders (not shown in chart) are Bearish with a score of 30.8 percent.
| NEW ZEALAND DOLLAR Statistics | SPECULATORS | COMMERCIALS | SMALL TRADERS |
| – Percent of Open Interest Longs: | 57.0 | 27.0 | 5.7 |
| – Percent of Open Interest Shorts: | 37.8 | 42.9 | 9.0 |
| – Net Position: | 10,708 | -8,875 | -1,833 |
| – Gross Longs: | 31,881 | 15,123 | 3,194 |
| – Gross Shorts: | 21,173 | 23,998 | 5,027 |
| – Long to Short Ratio: | 1.5 to 1 | 0.6 to 1 | 0.6 to 1 |
| NET POSITION TREND: | | | |
| – Strength Index Score (3 Year Range Pct): | 89.2 | 16.7 | 30.8 |
| – Strength Index Reading (3 Year Range): | Bullish-Extreme | Bearish-Extreme | Bearish |
| NET POSITION MOVEMENT INDEX: | | | |
| – 6-Week Change in Strength Index: | 3.0 | 4.0 | -50.4 |
Mexican Peso Futures:
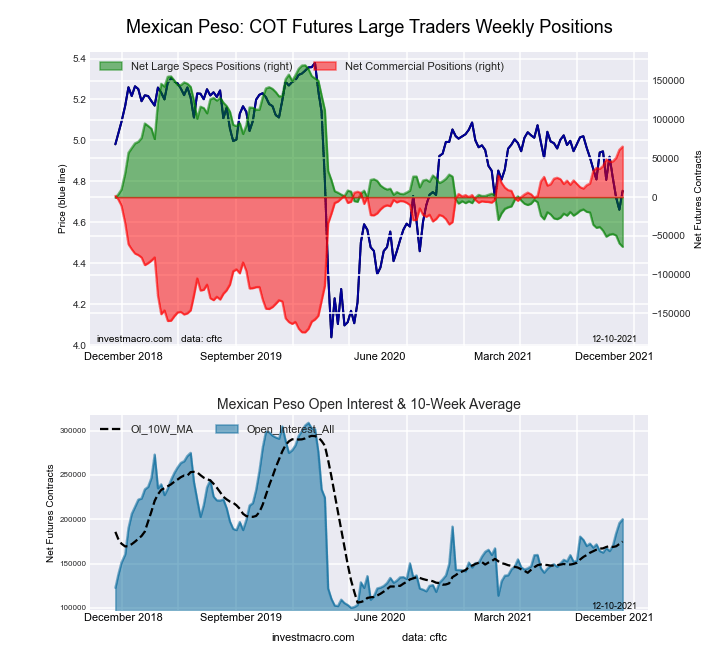 The Mexican Peso large speculator standing this week equaled a net position of -64,126 contracts in the data reported through Tuesday. This was a weekly decline of -4,379 contracts from the previous week which had a total of -59,747 net contracts.
This week’s current strength score (the trader positioning range over the past three years, measured from 0 to 100) shows the speculators are currently Bearish-Extreme with a score of 0.0 percent. The commercials are Bullish-Extreme with a score of 100.0 percent and the small traders (not shown in chart) are Bearish with a score of 38.3 percent.
| MEXICAN PESO Statistics | SPECULATORS | COMMERCIALS | SMALL TRADERS |
| – Percent of Open Interest Longs: | 35.4 | 60.2 | 2.4 |
| – Percent of Open Interest Shorts: | 67.4 | 27.6 | 3.0 |
| – Net Position: | -64,126 | 65,233 | -1,107 |
| – Gross Longs: | 70,791 | 120,494 | 4,820 |
| – Gross Shorts: | 134,917 | 55,261 | 5,927 |
| – Long to Short Ratio: | 0.5 to 1 | 2.2 to 1 | 0.8 to 1 |
| NET POSITION TREND: | | | |
| – Strength Index Score (3 Year Range Pct): | 0.0 | 100.0 | 38.3 |
| – Strength Index Reading (3 Year Range): | Bearish-Extreme | Bullish-Extreme | Bearish |
| NET POSITION MOVEMENT INDEX: | | | |
| – 6-Week Change in Strength Index: | -8.9 | 10.5 | -17.9 |
Brazilian Real Futures:
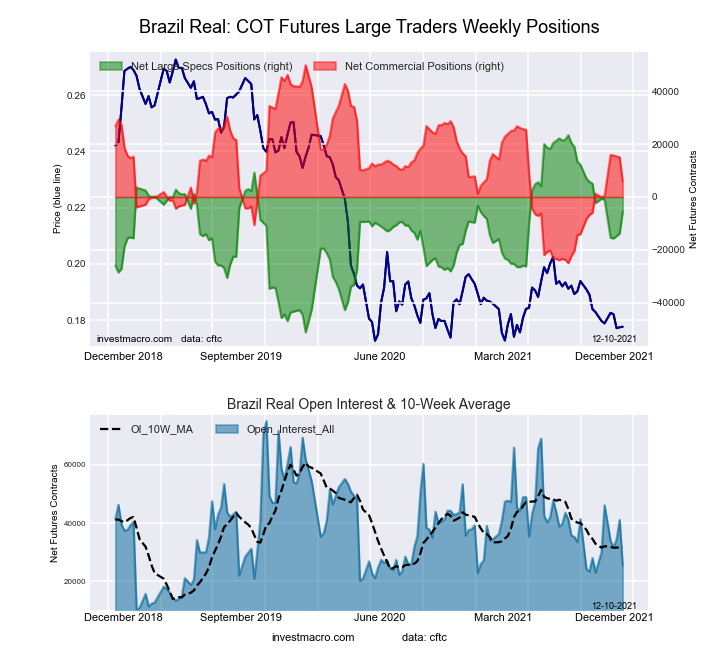 The Brazilian Real large speculator standing this week equaled a net position of -5,624 contracts in the data reported through Tuesday. This was a weekly increase of 8,218 contracts from the previous week which had a total of -13,842 net contracts.
This week’s current strength score (the trader positioning range over the past three years, measured from 0 to 100) shows the speculators are currently Bullish with a score of 61.1 percent. The commercials are Bearish with a score of 41.2 percent and the small traders (not shown in chart) are Bullish with a score of 64.3 percent.
| BRAZIL REAL Statistics | SPECULATORS | COMMERCIALS | SMALL TRADERS |
| – Percent of Open Interest Longs: | 31.3 | 57.8 | 10.2 |
| – Percent of Open Interest Shorts: | 53.4 | 34.9 | 11.0 |
| – Net Position: | -5,624 | 5,835 | -211 |
| – Gross Longs: | 7,978 | 14,739 | 2,590 |
| – Gross Shorts: | 13,602 | 8,904 | 2,801 |
| – Long to Short Ratio: | 0.6 to 1 | 1.7 to 1 | 0.9 to 1 |
| NET POSITION TREND: | | | |
| – Strength Index Score (3 Year Range Pct): | 61.1 | 41.2 | 64.3 |
| – Strength Index Reading (3 Year Range): | Bullish | Bearish | Bullish |
| NET POSITION MOVEMENT INDEX: | | | |
| – 6-Week Change in Strength Index: | -6.3 | 7.2 | -8.3 |
Russian Ruble Futures:
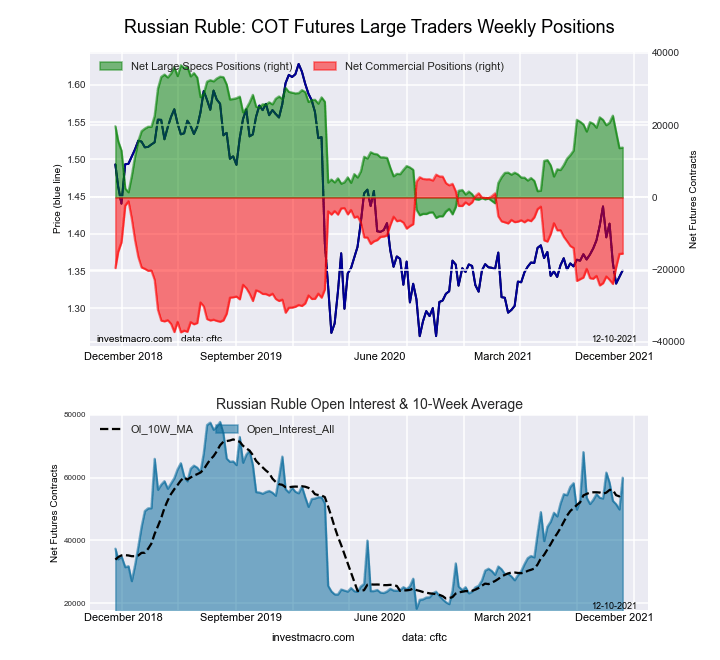 The Russian Ruble large speculator standing this week equaled a net position of 13,799 contracts in the data reported through Tuesday. This was a weekly lift of 162 contracts from the previous week which had a total of 13,637 net contracts.
This week’s current strength score (the trader positioning range over the past three years, measured from 0 to 100) shows the speculators are currently Bearish with a score of 46.1 percent. The commercials are Bearish with a score of 49.9 percent and the small traders (not shown in chart) are Bullish-Extreme with a score of 82.5 percent.
| RUSSIAN RUBLE Statistics | SPECULATORS | COMMERCIALS | SMALL TRADERS |
| – Percent of Open Interest Longs: | 31.7 | 62.0 | 5.1 |
| – Percent of Open Interest Shorts: | 8.7 | 88.0 | 2.1 |
| – Net Position: | 13,799 | -15,565 | 1,766 |
| – Gross Longs: | 19,031 | 37,193 | 3,054 |
| – Gross Shorts: | 5,232 | 52,758 | 1,288 |
| – Long to Short Ratio: | 3.6 to 1 | 0.7 to 1 | 2.4 to 1 |
| NET POSITION TREND: | | | |
| – Strength Index Score (3 Year Range Pct): | 46.1 | 49.9 | 82.5 |
| – Strength Index Reading (3 Year Range): | Bearish | Bearish | Bullish-Extreme |
| NET POSITION MOVEMENT INDEX: | | | |
| – 6-Week Change in Strength Index: | -18.1 | 18.7 | -13.6 |
Bitcoin Futures:
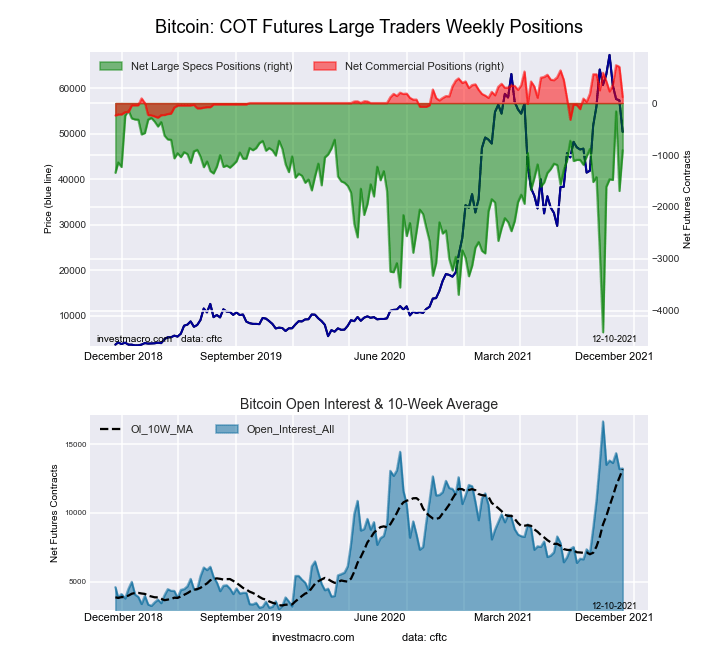 The Bitcoin large speculator standing this week equaled a net position of -908 contracts in the data reported through Tuesday. This was a weekly boost of 783 contracts from the previous week which had a total of -1,691 net contracts.
This week’s current strength score (the trader positioning range over the past three years, measured from 0 to 100) shows the speculators are currently Bullish-Extreme with a score of 82.1 percent. The commercials are Bearish with a score of 41.7 percent and the small traders (not shown in chart) are Bearish with a score of 30.9 percent.
| BITCOIN Statistics | SPECULATORS | COMMERCIALS | SMALL TRADERS |
| – Percent of Open Interest Longs: | 72.3 | 3.5 | 12.6 |
| – Percent of Open Interest Shorts: | 79.2 | 2.6 | 6.6 |
| – Net Position: | -908 | 117 | 791 |
| – Gross Longs: | 9,580 | 457 | 1,668 |
| – Gross Shorts: | 10,488 | 340 | 877 |
| – Long to Short Ratio: | 0.9 to 1 | 1.3 to 1 | 1.9 to 1 |
| NET POSITION TREND: | | | |
| – Strength Index Score (3 Year Range Pct): | 82.1 | 41.7 | 30.9 |
| – Strength Index Reading (3 Year Range): | Bullish-Extreme | Bearish | Bearish |
| NET POSITION MOVEMENT INDEX: | | | |
| – 6-Week Change in Strength Index: | 82.1 | -44.4 | -69.1 |
Article By InvestMacro – Receive our weekly COT Reports by Email
*COT Report: The COT data, released weekly to the public each Friday, is updated through the most recent Tuesday (data is 3 days old) and shows a quick view of how large speculators or non-commercials (for-profit traders) were positioned in the futures markets.
The CFTC categorizes trader positions according to commercial hedgers (traders who use futures contracts for hedging as part of the business), non-commercials (large traders who speculate to realize trading profits) and nonreportable traders (usually small traders/speculators) as well as their open interest (contracts open in the market at time of reporting).See CFTC criteria here.


