Archive for Forex and Currency News – Page 191

GBPJPY To Complete The Price Adjustment Within The Fourth Wave

By Orbex

GBPJPY

In the long term, the GBPJPY currency pair is most likely moving within a cycle impulse. Now the third part of this impulse, wave III is under development.

The second half of the powerful impulse wave III is visible in the 1H timeframe. And the decline in the bearish correction of the primary degree may end soon. This correction takes the form of an intermediate triple zigzag.

Most likely, the price will fall to the previous low of 148.89. This was marked by the minor sub-wave W, and then we can expect a price increase in the primary wave ⑤. In turn, this wave may take the form of either an impulse or an ending diagonal.

The entire primary wave ⑤ could complete its pattern near 167.74. At that level, it will be at 61.8% of wave ③.

GBPJPY

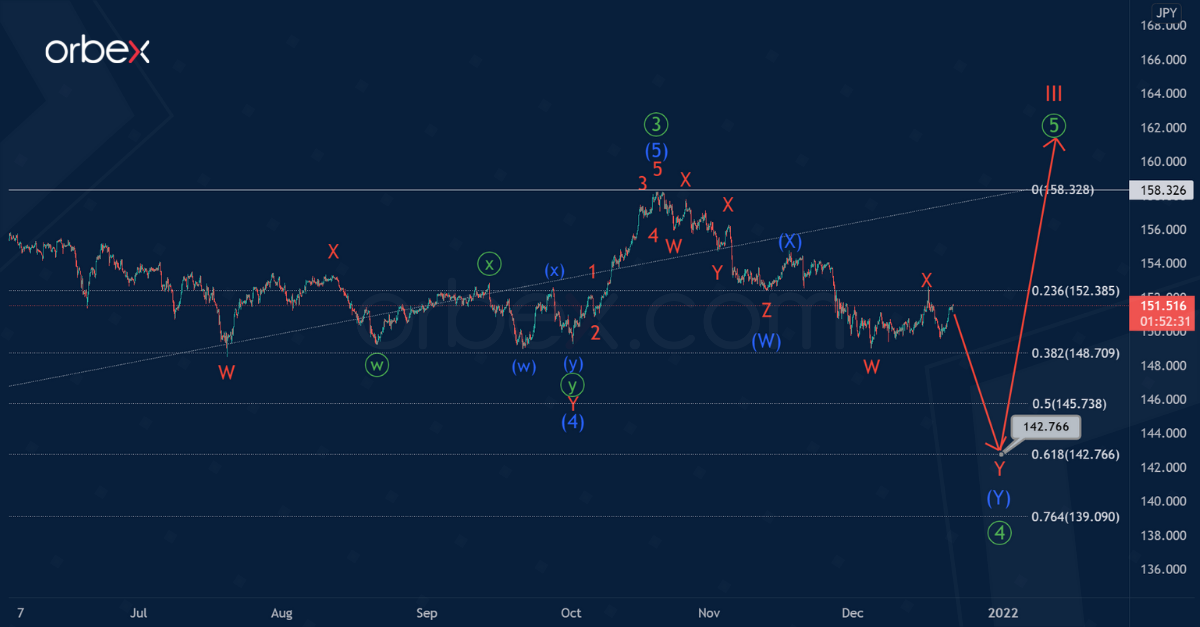
An alternative scenario suggests that the formation of the primary correction ④ may continue for a longer time than in the first variant. It may take the form of an intermediate double zigzag (W)-(X)-(Y).

The last actionary wave (Y) of the intermediate degree can take the form of a double combination and consist of minor sub-waves W-X-Y.

In this scenario, market participants may observe a bearish price movement within the final minor wave Y to the level of 142.76.

At that level, wave ④ will be at 61.8% along the Fibonacci lines of impulse ③.


Orbex-LogoArticle by Orbex

Orbex is a fully licensed broker that was established in 2011. Founded with a mission to serve its traders responsibly and provides traders with access to the world’s largest and most liquid financial markets. www.orbex.com

Intraday Market Analysis – Gold In Limited Pullback

By Orbex

XAUUSD seeks support

XAUUSD

Gold softens as the US dollar edged higher. A surge above 1788 and then 1808 has prompted the bears to cover.

The precious metal is looking for support after the breakout stalled with an overextended RSI. A bearish MA cross may weigh on short-term sentiment.

The base of the initial breakout around 1770 is a key support. A deeper correction would lead to the daily support at 1753, a critical level to keep the rebound relevant. Gold may climb towards 1850 if the bulls succeed in pushing above 1814.

USDCAD consolidates gains

USDCAD

The Canadian dollar recouped some losses after better-than-expected retail sales. A break above the major daily resistance at 1.2930 has put the bulls back in control of the direction.

The RSI’s repeated overbought situation may cause a temporary pullback. Trend followers would be looking to jump in at a better price. 1.2880 is the closest support.

Sentiment would remain upbeat as long as price action is above 1.2770. A rally above the intermediate resistance at 1.2960 may trigger an extended rally towards 1.3200.

UK 100 makes a bullish attempt

FTSE 100

The FTSE 100 recovered some ground after the Omicron sell-off. The index has found solid buying at 7110.

An oversold RSI has attracted a buying-the-dips crowd. A tentative break above 7300 suggests strong interest in keeping the market afloat. A bullish MA cross could lead to an acceleration on the upside.

7385 is a major hurdle on the daily chart. Its breach could cause a runaway rally and resume the uptrend. On the downside, 7250 is the first support, and 7110 is the second line of defense in case of weakness.


Orbex-LogoArticle by Orbex

Orbex is a fully licensed broker that was established in 2011. Founded with a mission to serve its traders responsibly and provides traders with access to the world’s largest and most liquid financial markets. www.orbex.com

Forex Technical Analysis & Forecast 22.12.2021

Article By RoboForex.com

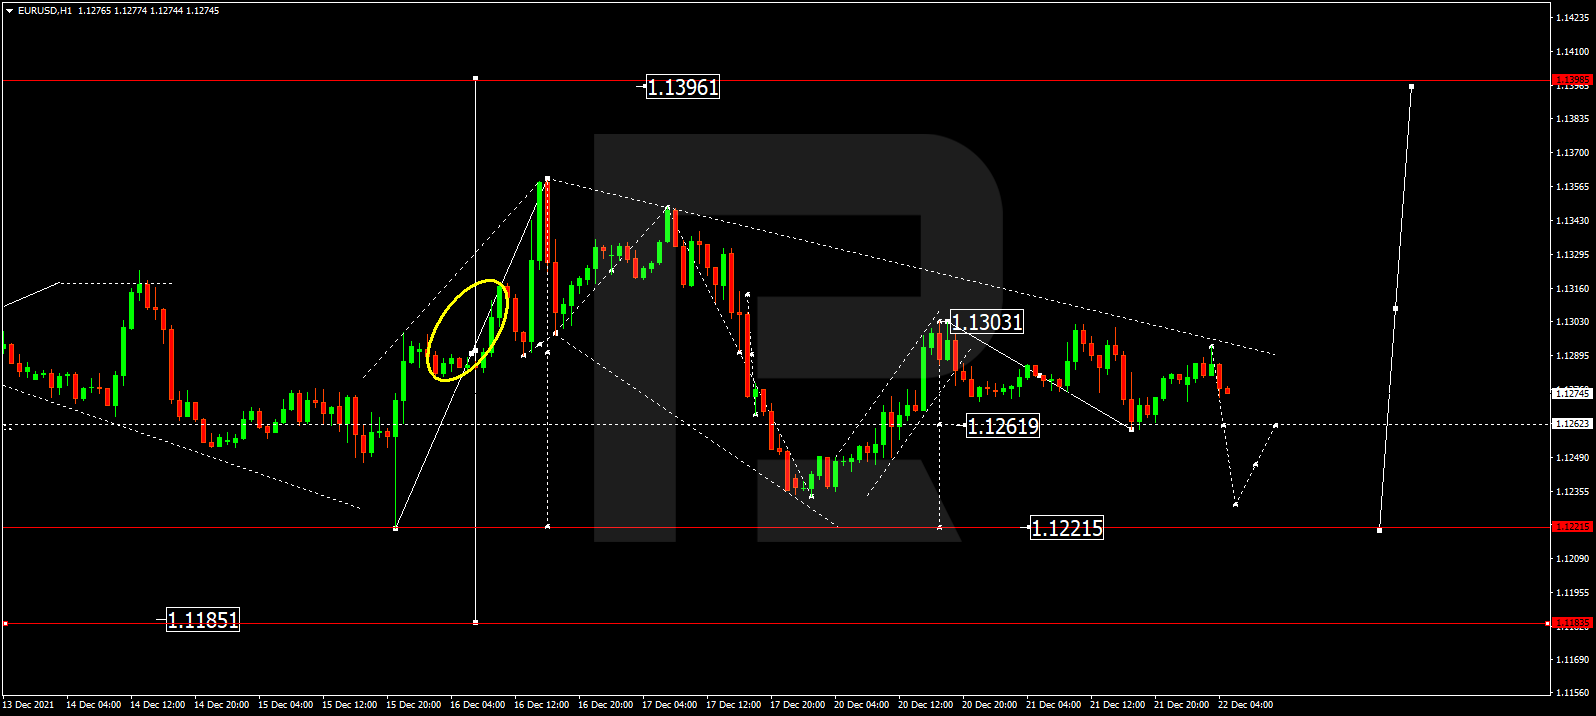
EURUSD, “Euro vs US Dollar”

EURUSD continues falling. Possibly, today the pair may break 1.1262 and then reach 1.1230. After that, the instrument may start a new growth to test 1.1262 from below and then resume trading downwards with the target at 1.1221.

EURUSD
Risk Warning: the result of previous trading operations do not guarantee the same results in the future

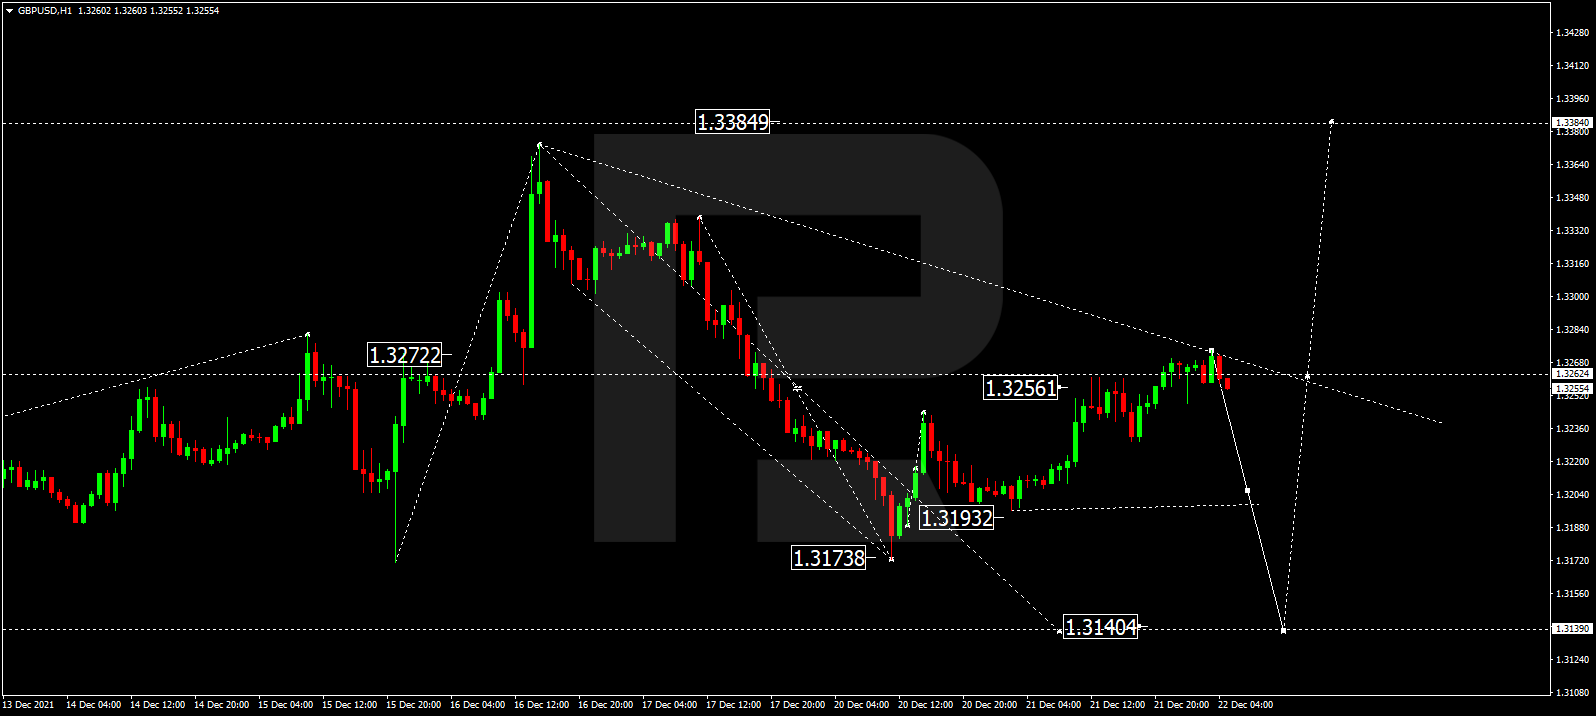
GBPUSD, “Great Britain Pound vs US Dollar”

GBPUSD has finished the correctional structure at 1.3262. Today, the pair may resume falling to break 1.3193 and then continue trading downwards with the target at 1.3140.

GBPUSD
Risk Warning: the result of previous trading operations do not guarantee the same results in the future

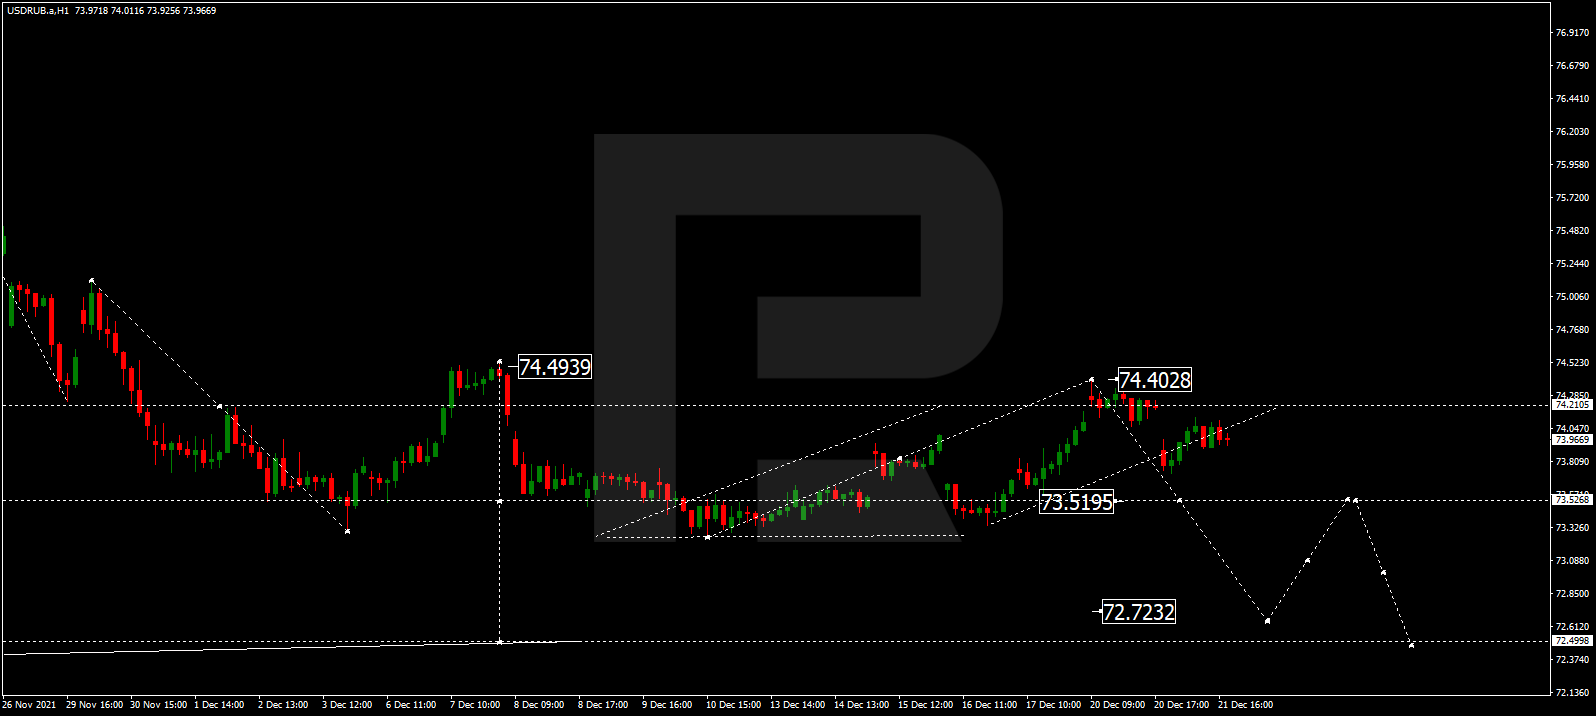
USDRUB, “US Dollar vs Russian Ruble”

USDRUB continues trading downwards to reach 73.51. Later, the market may break this level and continue falling towards 72.72 or even reach the target at 72.40.

USDRUB
Risk Warning: the result of previous trading operations do not guarantee the same results in the future

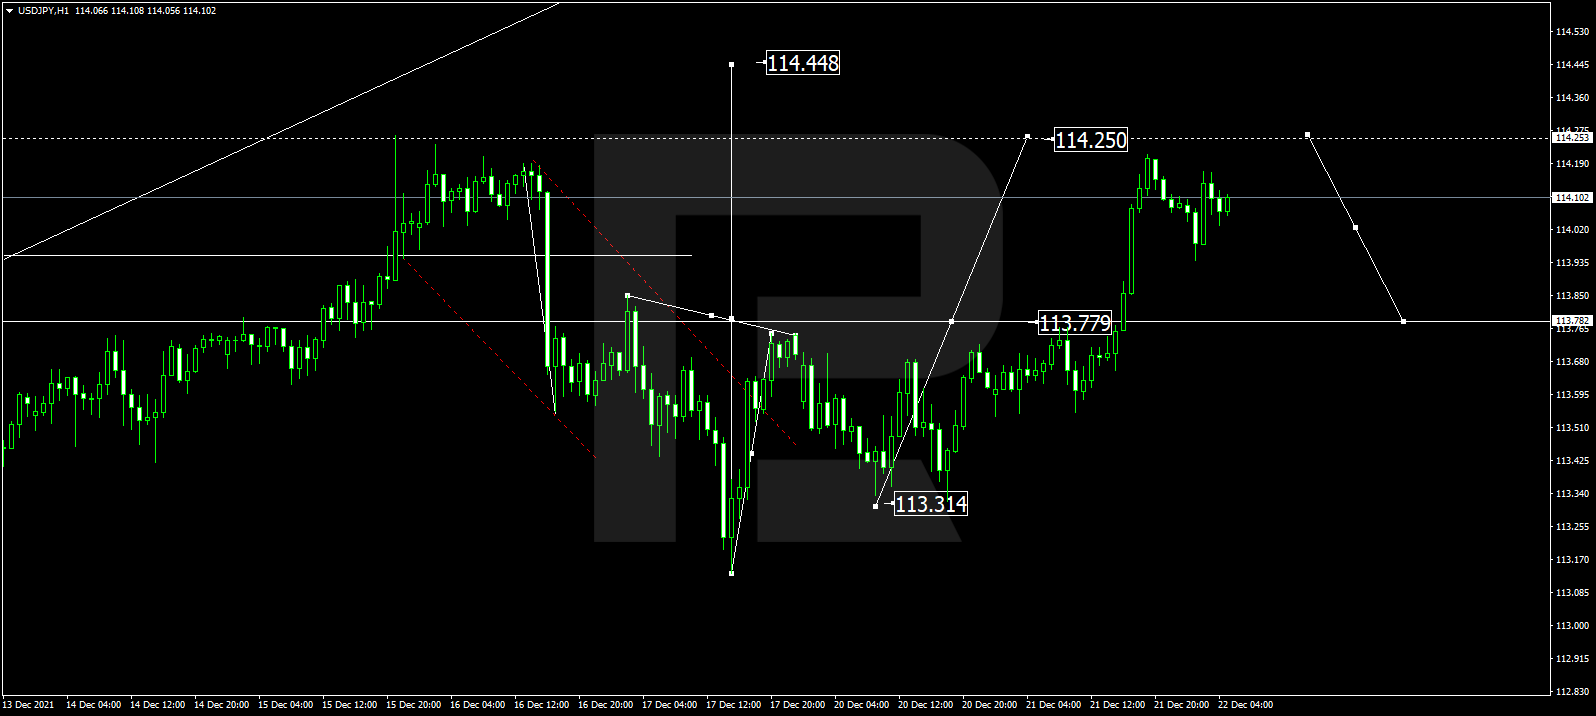
USDJPY, “US Dollar vs Japanese Yen”

USDJPY continues growing towards 114.25 and may later start a new correction to reach 113.77. After that, the instrument may resume trading upwards with the target at 114.44.

USDJPY
Risk Warning: the result of previous trading operations do not guarantee the same results in the future

USDCHF, “US Dollar vs Swiss Franc”

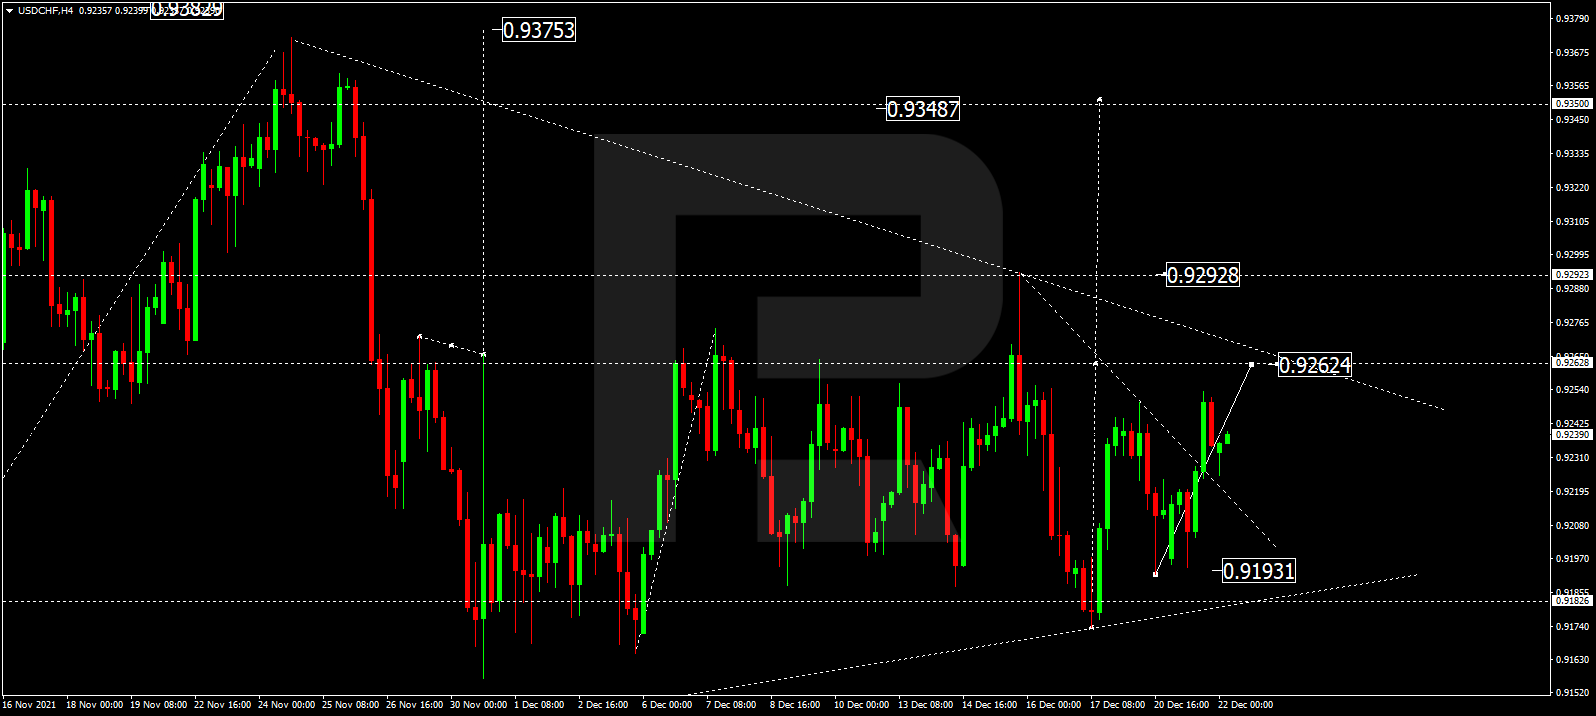
USDCHF continues growing to break 0.9262. Later, the market may form one more ascending structure with the short-term target at 0.9350.

USDCHF
Risk Warning: the result of previous trading operations do not guarantee the same results in the future

AUDUSD, “Australian Dollar vs US Dollar”

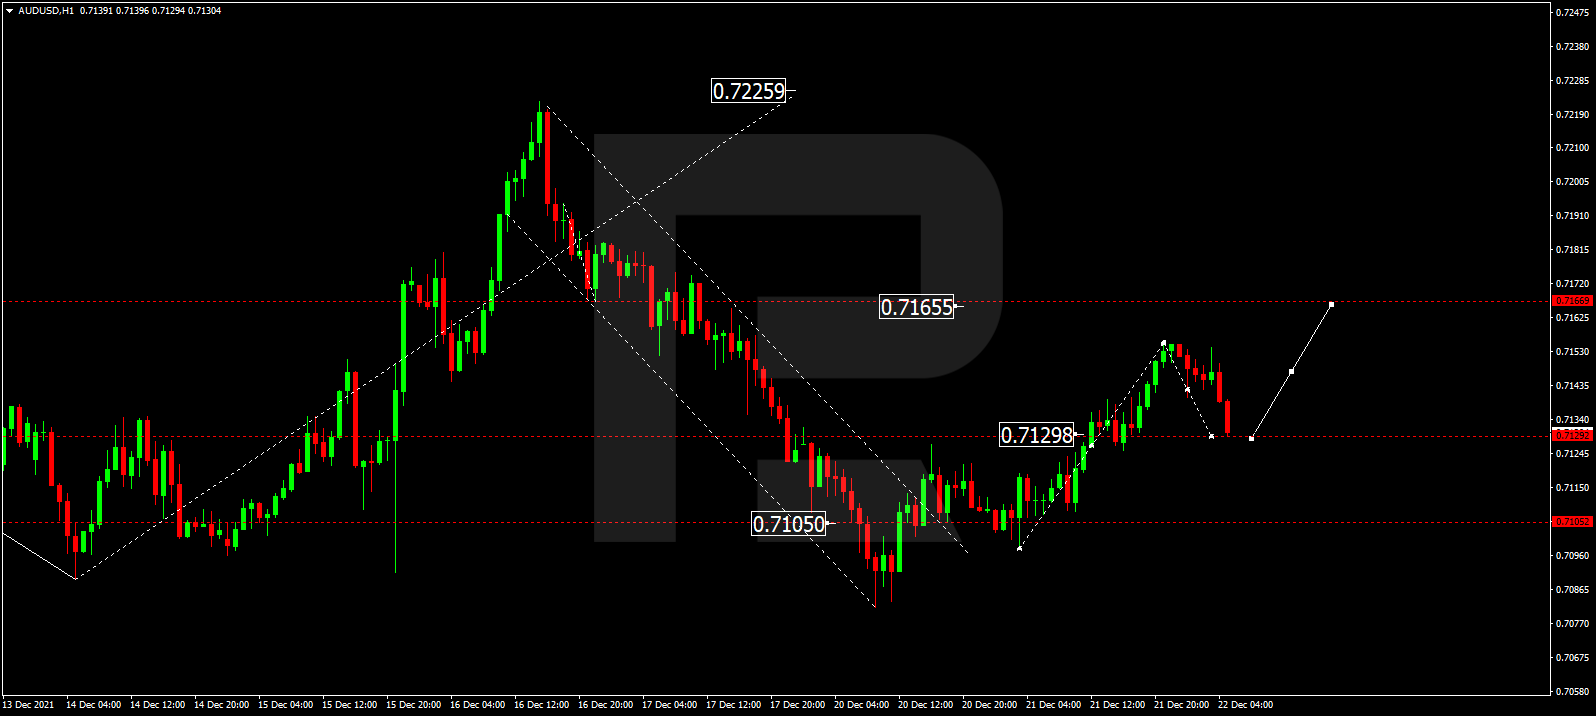
AUDUSD has finished the ascending structure at 0.7155; right now, it is falling to reach 0.7129. Later, the market may start a new growth with the target at 0.7166.

AUDUSD
Risk Warning: the result of previous trading operations do not guarantee the same results in the future

BRENT

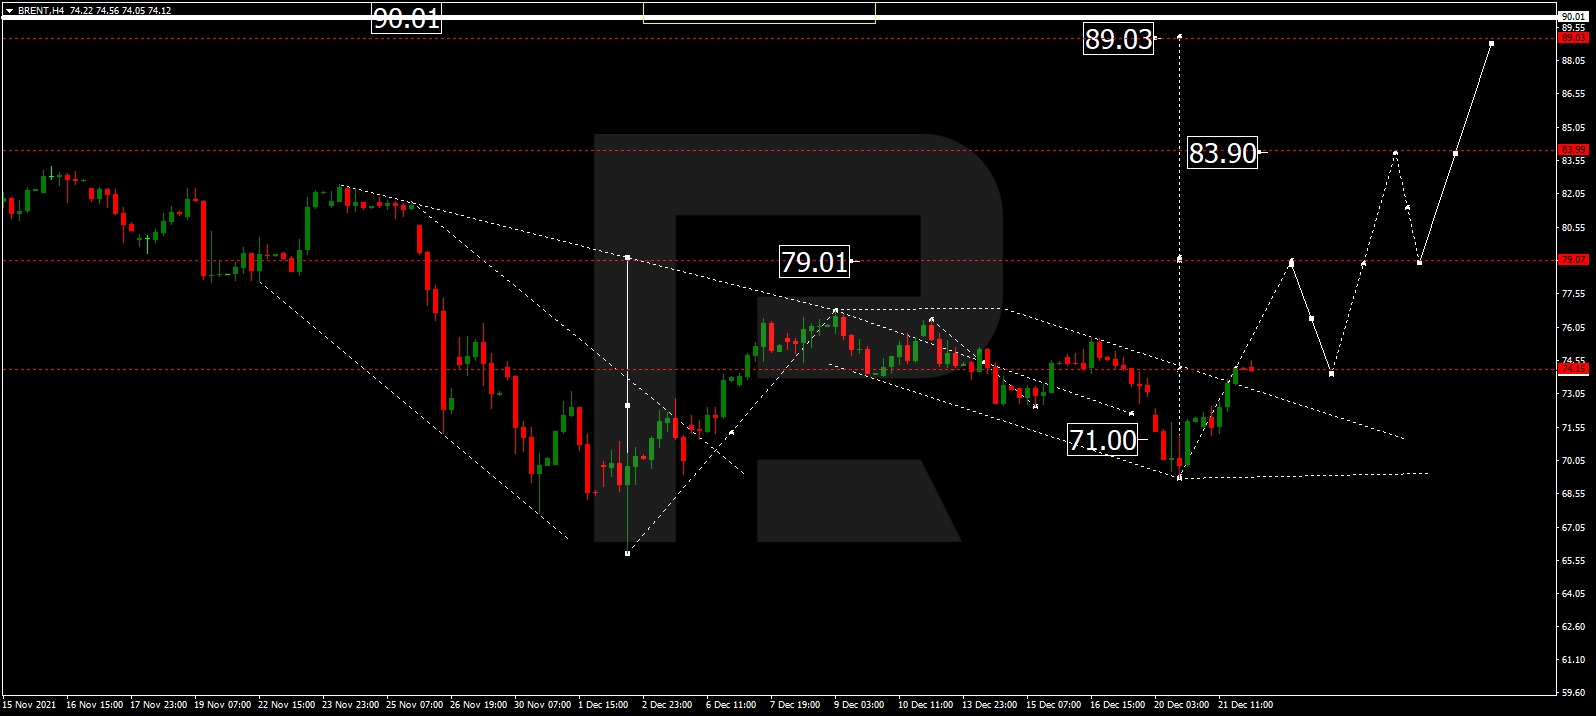
Brent has finished the ascending structure at 74.50. Possibly, today the asset may consolidate around this level. If later the price breaks the range to the upside, the market may resume growing with the first target at 79.07. After that, the instrument may start a new correction to reach 74.00.

BRENT
Risk Warning: the result of previous trading operations do not guarantee the same results in the future

XAUUSD, “Gold vs US Dollar”

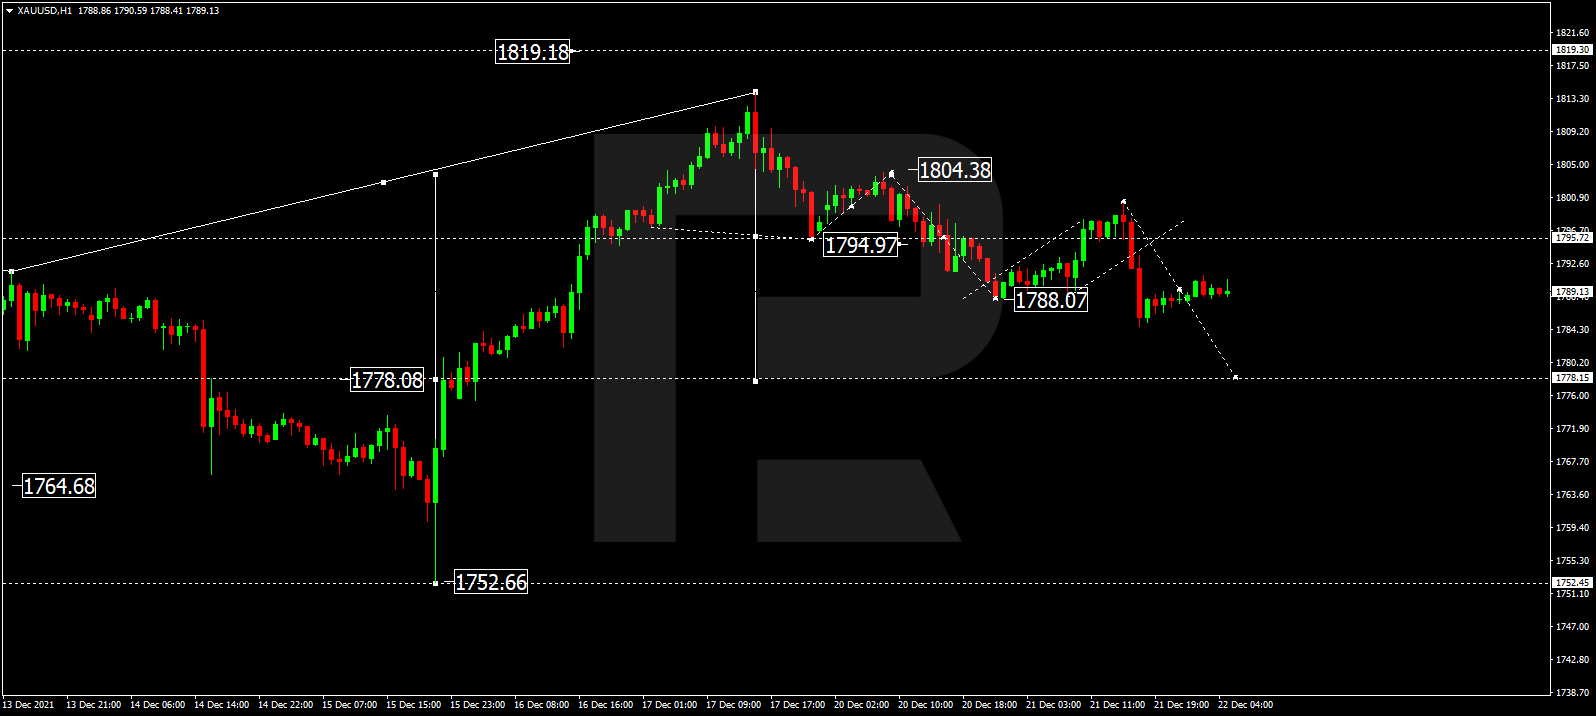
After completing the ascending structure at 1800.00, Gold is expected to start another decline to reach 1778.15. Later, the market may resume growing to break 1800.00 and then form one more ascending wave with the target at 1820.00.

GOLD
Risk Warning: the result of previous trading operations do not guarantee the same results in the future

S&P 500

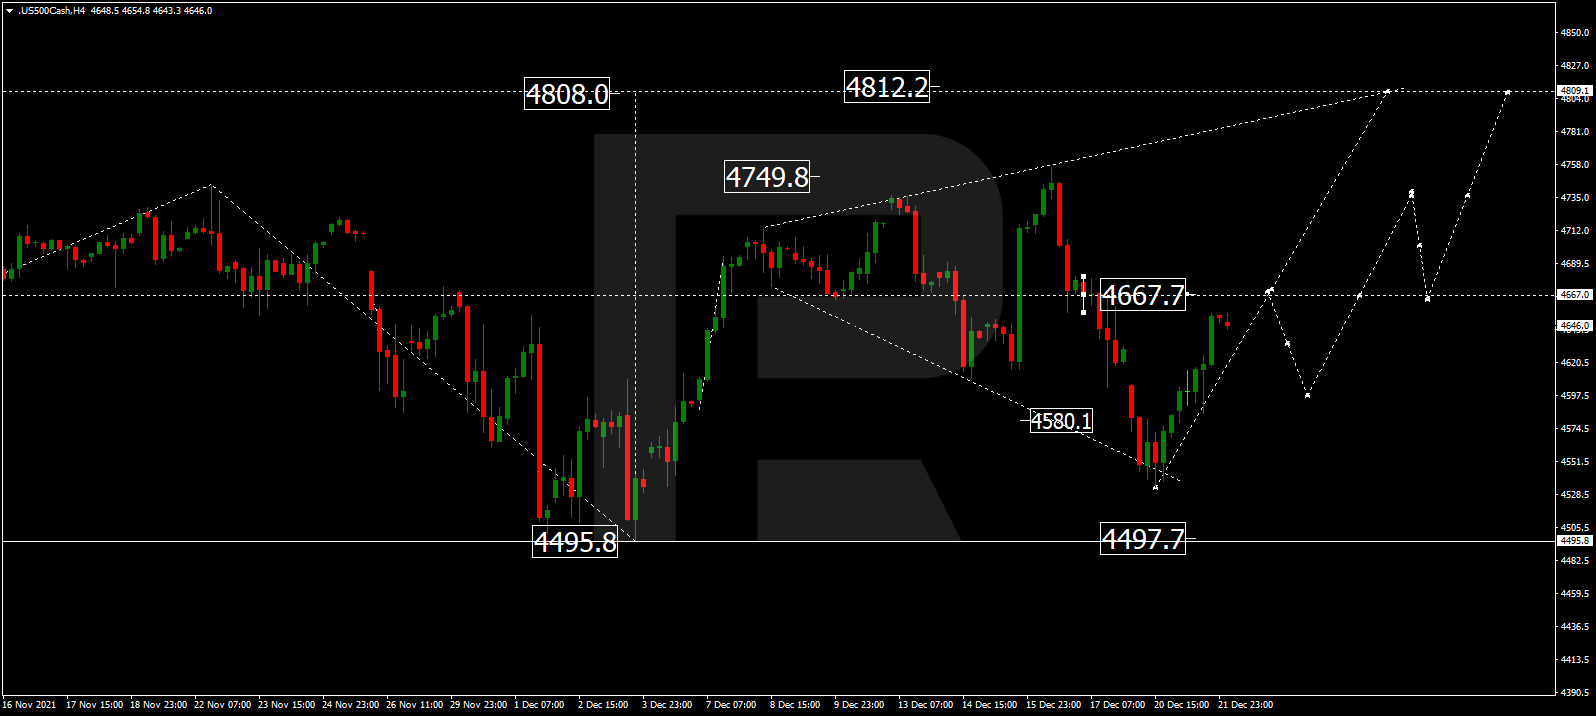
The S&P index is growing towards 4667.7 and may later correct to reach 4597.0. After that, the instrument may form one more ascending wave to break 4735.0 and then continue trading upwards with the target at 4800.0.

S&P 500

Article By RoboForex.com

Attention!
Forecasts presented in this section only reflect the author’s private opinion and should not be considered as guidance for trading. RoboForex LP bears no responsibility for trading results based on trading recommendations described in these analytical reviews.

Murrey Math Lines 22.12.2021 (USDJPY, USDCAD)

Article By RoboForex.com

USDJPY, “US Dollar vs. Japanese Yen”

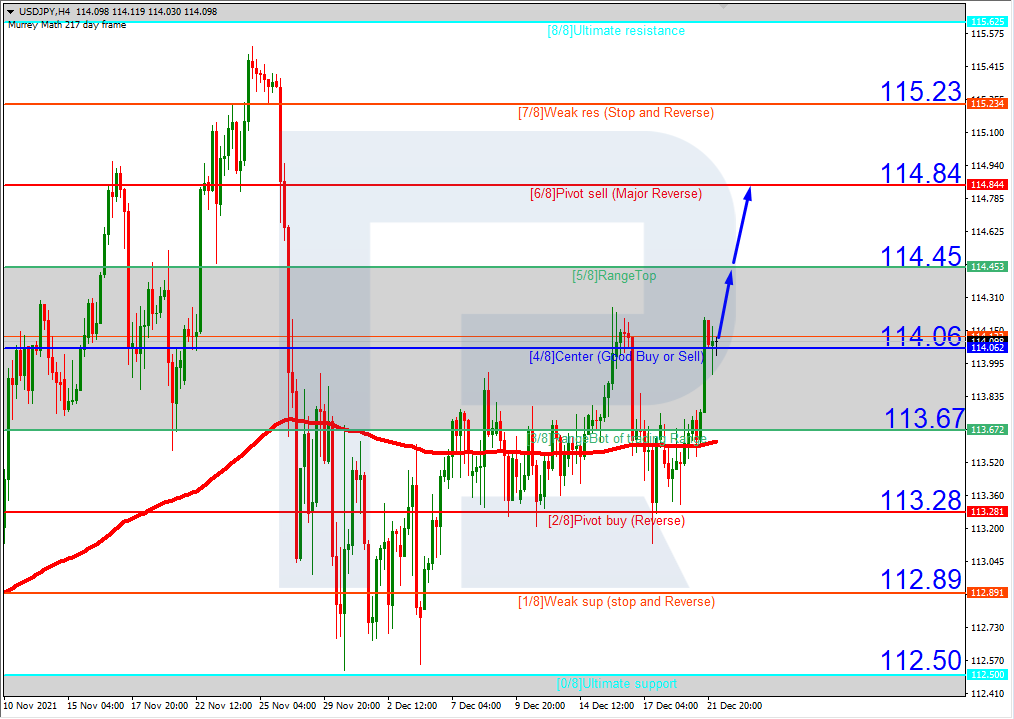
In the H4 chart, USDJPY is trading above the 200-day Moving Average, thus indicating a possible ascending tendency. In this case, the price is expected to test 5/8, break it, and continue growing to reach the resistance at 6/8. However, this scenario may no longer be valid if the price breaks 4/8 to the downside. After that, the instrument may reverse and fall towards the support at 3/8.

USDJPYH4
Risk Warning: the result of previous trading operations do not guarantee the same results in the future

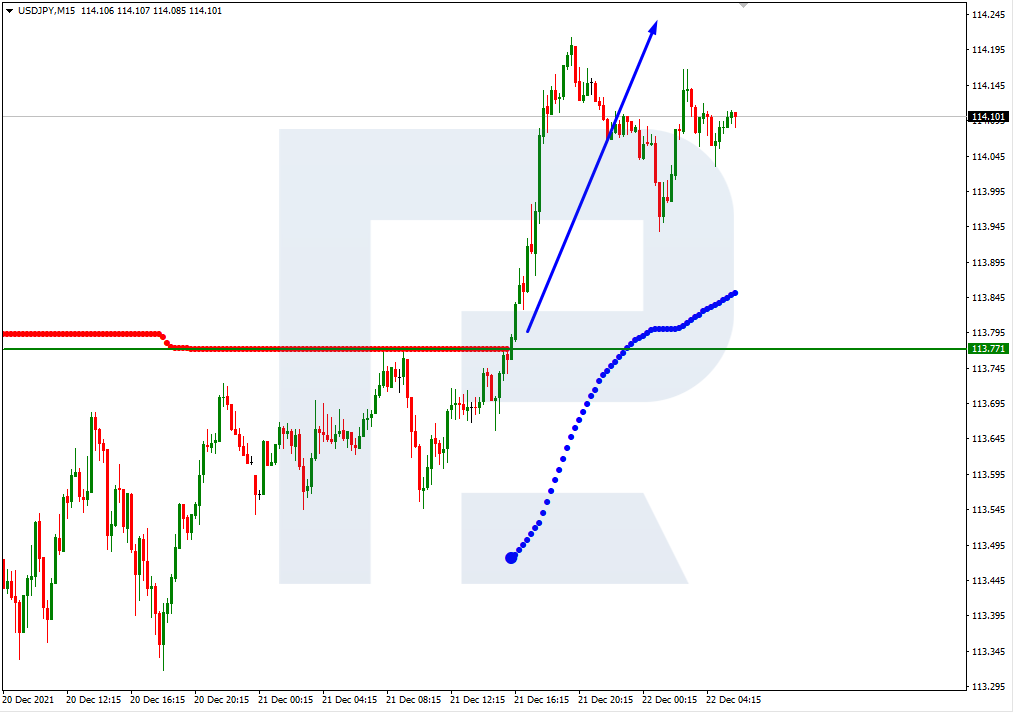
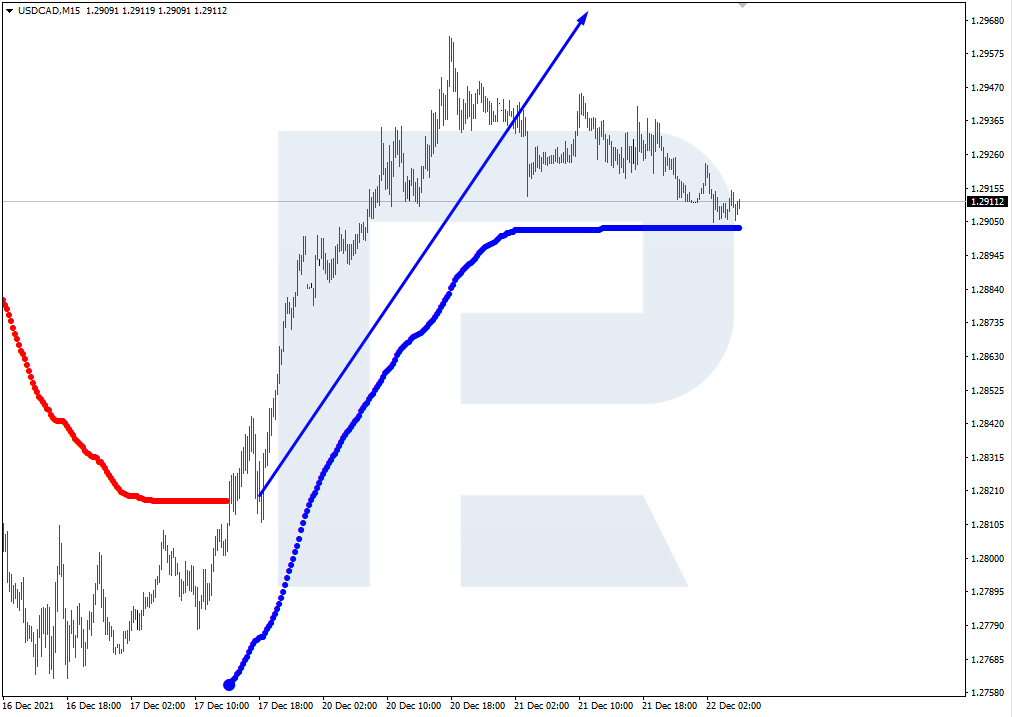
As we can see in the M15 chart, the pair has broken the upside line of the VoltyChannel indicator and, as a result, may continue growing.

USDJPY_M15
Risk Warning: the result of previous trading operations do not guarantee the same results in the future

USDCAD, “US Dollar vs Canadian Dollar”

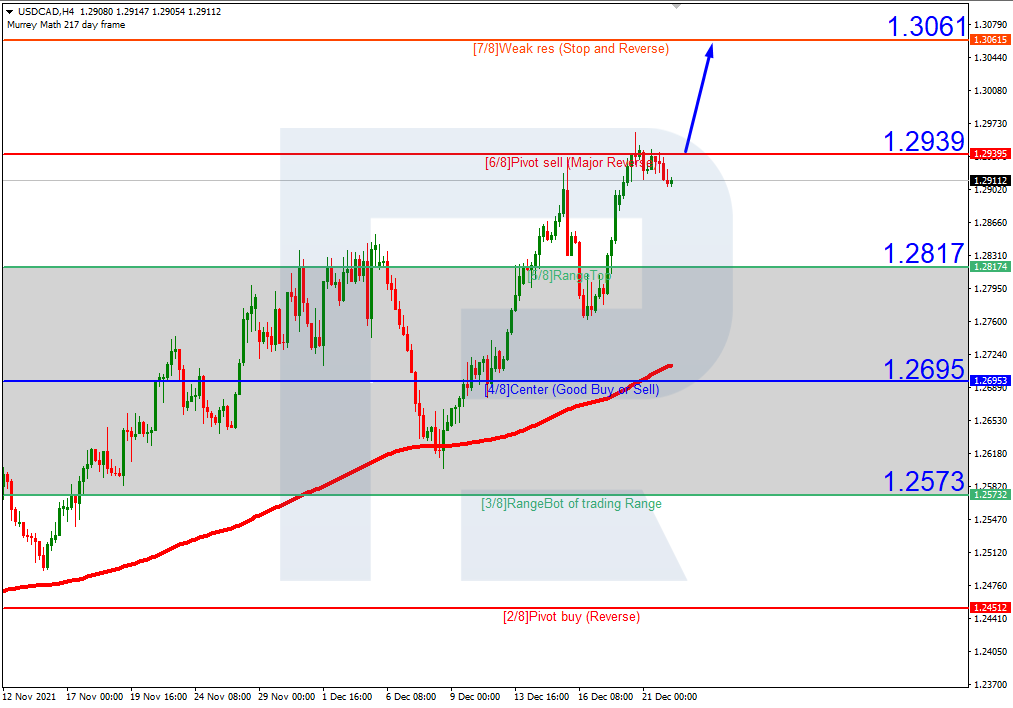
In the H4 chart, USDCAD is trading above the 200-day Moving Average, thus indicating an ascending tendency. In this case, the price is expected to test 6/8, break it, and continue growing towards the resistance at 7/8. Still, this scenario may no longer be valid if the price breaks the support at 5/8 to the downside. After that, the instrument may correct downwards to reach 4/8.

USDCAD_H4
Risk Warning: the result of previous trading operations do not guarantee the same results in the future

As we can see in the M15 chart, the pair has broken the upside line of the VoltyChannel indicator and, as a result, may continue trading upwards.

USDCAD_M15

Article By RoboForex.com

Attention!
Forecasts presented in this section only reflect the author’s private opinion and should not be considered as guidance for trading. RoboForex LP bears no responsibility for trading results based on trading recommendations described in these analytical reviews.

The Analytical Overview of the Main Currency Pairs on 2021.12.22

by JustForex

The EUR/USD currency pair

Technical indicators of the currency pair:
  • Prev Open: 1.1277
  • Prev Close: 1.1285
  • % chg. over the last day: +0.07%

The ECB balance sheet continues to grow steadily. Yesterday, the balance reached a new absolute record of €8,511.5 trillion. However, it should be noted that the increase was by €14.8 billion against the increase of €26.7 billion a week earlier, which indicates a temporary volume contraction. This could provide short-term support for the European currency.

Trading recommendations
  • Support levels: 1.1243, 1.1230, 1.1168
  • Resistance levels: 1.1323, 1.1360, 1.1436, 1.1535, 1.1613, 1.1667, 1.1717

From a technical point of view, the EUR/USD on the hour time frame is still bearish. The MACD indicator has become inactive. The price is trading in the corridors, both on the higher time frames and on the lower ones. These are complex conditions for trading. It is better to consider sell deals from the resistance level of 1.1323. Buy trades can be considered on the lower time frames from the support level of 1.1243, but only with additional confirmation.

Alternative scenario: if the price breaks out through the 1.1360 resistance level and fixes above, the mid-term uptrend will likely resume.

EUR/USD
News feed for 2021.12.22:
  • – US GDP (q/q) at 15:30 (GMT+2);
  • – US CB Consumer Confidence (m/m) at 17:00 (GMT+2);
  • – US Existing Home Sales (m/m) at 17:00 (GMT+2);
  • – US Crude Oil Inventories (m/m) at 17:30 (GMT+2).

The GBP/USD currency pair

Technical indicators of the currency pair:
  • Prev Open: 1.3207
  • Prev Close: 1.3268
  • % chg. over the last day: +0.46%

The British currency is supported by rising oil prices as well as the monetary policy of the Bank of England, which has already raised the interest rate and intends to start reducing its stimulus program as the wave of “Omicron” decreases.

Trading recommendations
  • Support levels: 1.3220
  • Resistance levels: 1.3272, 1.3301, 1.3365, 1.3434, 1.3507, 1.3575, 1.3685

On the hourly time frame, the trend on GBP/USD is still bullish. The price is trading near the moving average. The MACD indicator is in the positive zone with no signs of reversal. Under such market conditions, traders should consider buy positions from the 1.3220 support level but only with additional confirmation in the form of a buyers’ initiative. Sell trades can be considered from the resistance level of 1.3301.

Alternative scenario: if the price breaks down through the 1.3189 support level and consolidates below, the bearish scenario will likely resume.

GBP/USD
News feed for 2021.12.22:
  • – UK GDP (q/q) at 09:00 (GMT+2).

The USD/JPY currency pair

Technical indicators of the currency pair:
  • Prev Open: 113.54
  • Prev Close: 114.08
  • % chg. over the last day: +0.47%

The minutes of the monetary policy meeting of the Bank of Japan showed that, in general, the weakening yen is having a positive effect on the Japanese economy. From a fundamental point of view, the situation on the USD/JPY currency pair remains the same. The monetary policy of the Bank of Japan is aimed at active economic stimulation, while the US Federal Reserve, on the contrary, accelerated the reduction of the quantitative easing program last week. Such a situation is in favor of further growth of USD/JPY quotes.

Trading recommendations
  • Support levels: 113.95, 113.76, 113.30, 112.62, 112.30
  • Resistance levels: 114.17, 115.15, 115.50

The global trend on the USD/JPY currency pair is bearish. But the price has once again reached the priority change level, and this time the sellers’ reaction is much weaker. The probability of breakout is increasing. Buy positions should be considered from the 113.30 support level, but with additional confirmation in the form of a buyers’ initiative or after the price breaks out the priority change level. Sell positions should be considered if the price makes a false breakout of 114.17 level and returns back to the wide corridor with the 113.30-114.17 price range.

Alternative scenario: if the price rises above 114.17, the uptrend will likely resume.

USD/JPY
News feed for 2021.12.22:
  • – Japan BoJ Monetary Policy Statement at 01:50 (GMT+2).

The USD/CAD currency pair

Technical indicators of the currency pair:
  • Prev Open: 1.2936
  • Prev Close: 1.2912
  • % chg. over the last day: -0.19%

Positive retail sales data and rising oil prices are now supporting the Canadian currency. Currently, the dollar index is stable as concerns about the Omicron strain are easing. From the fundamental point of view, this situation leads to the fact that the USD/CAD quotes do not have a single dynamic.

Trading recommendations
  • Support levels: 1.2828, 1.2721, 1.2677, 1.2638
  • Resistance levels: 1.2918, 1.2951

From a technical point of view, the USD/CAD currency pair trend is bullish. The MACD indicator has become inactive. Under such market conditions, it is better to look for buy deals from the support levels near the moving average on the lower time frames. Sell deals should be considered from the resistance level of 1.2918, but with additional confirmation in the form of a sellers’ initiative.

Alternative scenario: if the price breaks down through the 1.2783 support level and fixes below, the downtrend will likely resume.

USD/CAD
News feed for 2021.12.22:
  • – US Crude Oil Inventories (m/m) at 17:30 (GMT+2).

by JustForex


This article reflects a personal opinion and should not be interpreted as an investment advice, and/or offer, and/or a persistent request for carrying out financial transactions, and/or a guarantee, and/or a forecast of future events.

World stock indices are growing amid renewed investors’ appetite for risk

by JustForex

The US stock indices closed with strong growth yesterday. The rebound was observed in almost all sectors except Healthcare and Consumer Defensive. Separately, it should be noted about the confidence increase in the companies of the tourist industry. By the end of the trading day, the Dow Jones index (US30) gained 1.6%, S&P 500 (US500) added 1.78%, while Nasdaq (US100) jumped by 2.4%.

Micron shares led to the gain among chipmakers, jumping by 10.5%. The company reported better-than-forecast quarterly results. The earnings forecast for the current quarter also beats Wall Street expectations. The companies’ positive reports help ease some of the investors’ concerns about broader supply chain constraints in the face of high inflation.

On Tuesday, US President Joe Biden said that he does not intend to impose a national quarantine, emphasizing testing and vaccinations. Starting next month, the White House will make 500 million tests available to everyone for free. Military doctors and nurses may be involved to help overcrowded hospitals cope with the winter surge.

European stock indices also closed in the green area yesterday. The British FTSE 100 (UK100), German DAX (DE30), and French CAC 40 (FR40) increased by 1.4%. Spanish IBEX 35 (ES35) jumped by 1.8%. The market was supported by reducing concerns about the Omicron variant, as future vaccines will be effective against the new strain. The price of gas in Europe for the first time exceeded $2,000.

Meanwhile, the price of natural gas futures, on the contrary, has been decreasing for three weeks. However, the reason for the rise in gas prices in Europe is due to the stoppage of Gazprom’s key pipeline, as well as a drop in temperatures in the region. The UK GDP increased by 1.1% in Q3; a 1.3% growth was expected.

The Turkish lira strengthened sharply amid government support measures to protect local currency savings from exchange rate fluctuations. On Tuesday, Turkey’s central bank said it would support the conversion of foreign-currency deposit accounts into lira deposits. Resident individuals who already have a foreign currency deposit account will be eligible for benefits if they convert their accounts into Turkish lira term deposit accounts. At the moment, more than half of the savings of local residents are in foreign currencies and gold due to the loss of confidence in the lira after a sharp depreciation. Over the past two days, the Turkish currency increased by 30%.

Crude oil prices also rose yesterday as risk appetite returned to the markets, helped by easing concerns over the Omicron strain. Crude oil inventories data will be released today. Analysts believe the government data will show a 2.6 million barrel drop in crude oil inventories from the previous week. The supply shortage may cause oil prices to rise further.

The Asian stock indices supported the overall growth dynamics yesterday. At the same time, the indices continued to rise at the opening of trading today. Japan’s Nikkei stock index (JP225) increased by 1.6% yesterday. News of Monday’s enactment of an extra budget to fund the Japanese government’s economic stimulus package aimed at mitigating the effects of Covid-19 also seemed to support the domestic stock market. Hong Kong’s Hang Seng Index (HK5) increased by 0.2%. Hong Kong’s consumer price index rose to 1.8% on an annualized basis. Compared to the previous month, the increase was 0.1%. Hong Hao, a head of research at BOCOM International, said that Chinese investors were more focused on potential supply chain problems caused by COVID outbreaks than on inflation indicators. One major Chinese port was closed as a result of the Omicron outbreak yesterday.

Main market quotes:

S&P 500 (F) (US500) 4,649.23 +81.21 (+1.78%)

Dow Jones (US30) 35,492.70 +560.54 (+1.60%)

DAX (DE40) 15,447.44 +207.77 (+1.36%)

FTSE 100 (UK100) 7,297.41 +99.38 (+1.38%)

USD Index 96.59 +0.10 (+0.10%)

Important events for today:
  • – Japan BoJ Monetary Policy Statement at 01:50 (GMT+2);
  • – UK GDP (q/q) at 09:00 (GMT+2);
  • – US GDP (q/q) at 15:30 (GMT+2);
  • – US CB Consumer Confidence (m/m) at 17:00 (GMT+2);
  • – US Existing Home Sales (m/m) at 17:00 (GMT+2);
  • – US Crude Oil Inventories (m/m) at 17:30 (GMT+2).

by JustForex


This article reflects a personal opinion and should not be interpreted as an investment advice, and/or offer, and/or a persistent request for carrying out financial transactions, and/or a guarantee, and/or a forecast of future events.
Ichimoku Cloud Analysis 21.12.2021 (GBPUSD, NZDUSD, USDJPY)

Article By RoboForex.com

GBPUSD, “Great Britain Pound vs US Dollar”

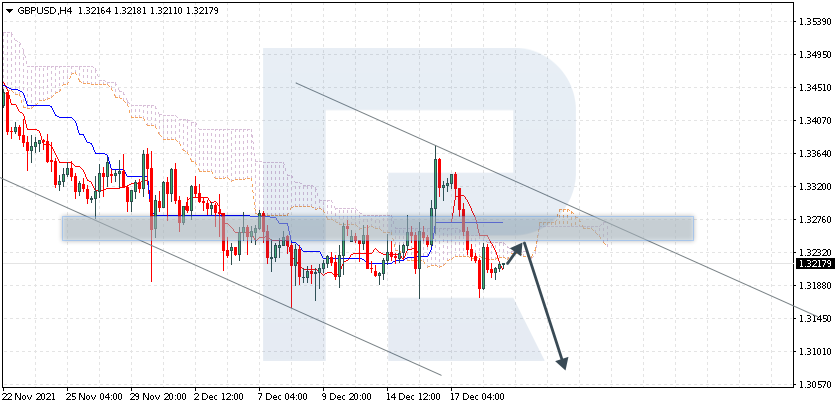
GBPUSD is trading at 1.3217; the instrument is moving below Ichimoku Cloud, thus indicating a descending tendency. The markets could indicate that the price may test the cloud’s upside border at 1.3235 and then resume moving downwards to reach 1.3075. Another signal in favour of a further downtrend will be a rebound from the resistance level. However, the bearish scenario may no longer be valid if the price breaks the cloud’s upside border and fixes above 1.3320. In this case, the pair may continue growing towards 1.3415.

GBPUSD
Risk Warning: the result of previous trading operations do not guarantee the same results in the future

NZDUSD, “New Zealand Dollar vs US Dollar”

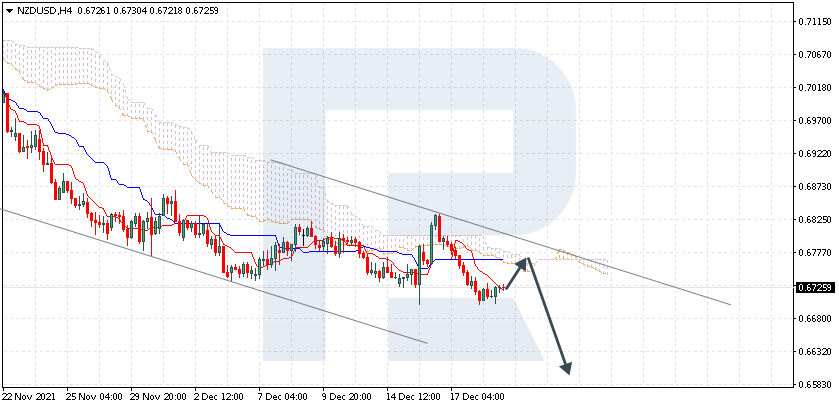
NZDUSD is trading at 0.6725; the instrument is moving below Ichimoku Cloud, thus indicating a descending tendency. The markets could indicate that the price may test the cloud’s upside border at 0.6765 and then resume moving downwards to reach 0.6605. Another signal in favour of a further downtrend will be a rebound from the descending channel’s upside border. However, the bearish scenario may no longer be valid if the price breaks the cloud’s upside border and fixes above 0.6825. In this case, the pair may continue growing towards 0.6915.

NZDUSD
Risk Warning: the result of previous trading operations do not guarantee the same results in the future

USDJPY, “US Dollar vs Japanese Yen”

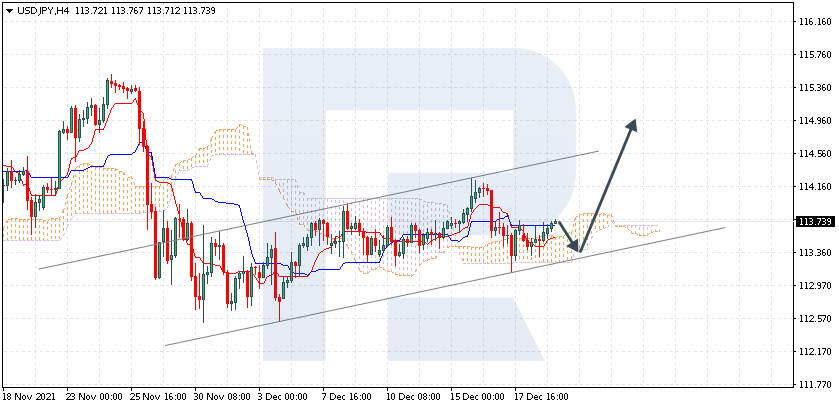
USDJPY is trading at 113.73; the instrument is moving above Ichimoku Cloud, thus indicating an ascending tendency. The markets could indicate that the price may test the cloud’s downside border at 113.35 and then resume moving upwards to reach 114.95. Another signal in favour of a further uptrend will be a rebound from the rising channel’s downside border. However, the bullish scenario may no longer be valid if the price breaks the cloud’s downside border and fixes below 112.95. In this case, the pair may continue falling towards 112.05.

USDJPY

Article By RoboForex.com

Attention!
Forecasts presented in this section only reflect the author’s private opinion and should not be considered as guidance for trading. RoboForex LP bears no responsibility for trading results based on trading recommendations described in these analytical reviews.

Japanese Candlesticks Analysis 21.12.2021 (XAUUSD, NZDUSD, GBPUSD)

Article By RoboForex.com

XAUUSD, “Gold vs US Dollar”

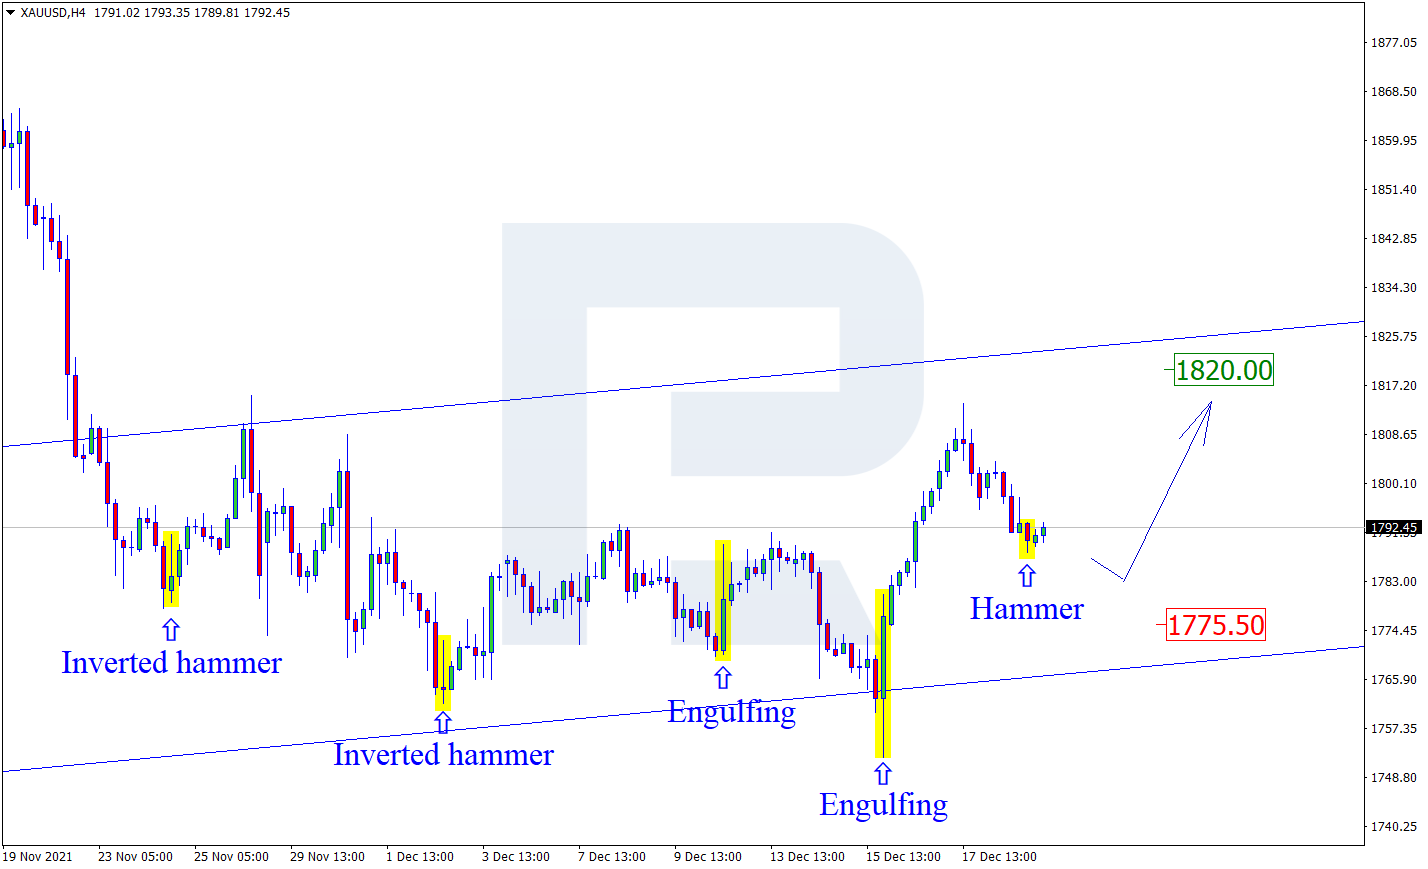
As we can see in the H4 chart, the asset is still trading upwards. After forming a Hammer reversal pattern not far from the support level, XAUUSD may reverse and continue forming its rising impulse. In this case, the upside target may be the resistance area at 1820.00. At the same time, an opposite scenario implies that the price may correct towards 1775.00 first and then resume trading upwards.

XAUUSD
Risk Warning: the result of previous trading operations do not guarantee the same results in the future

NZDUSD, “New Zealand vs US Dollar”

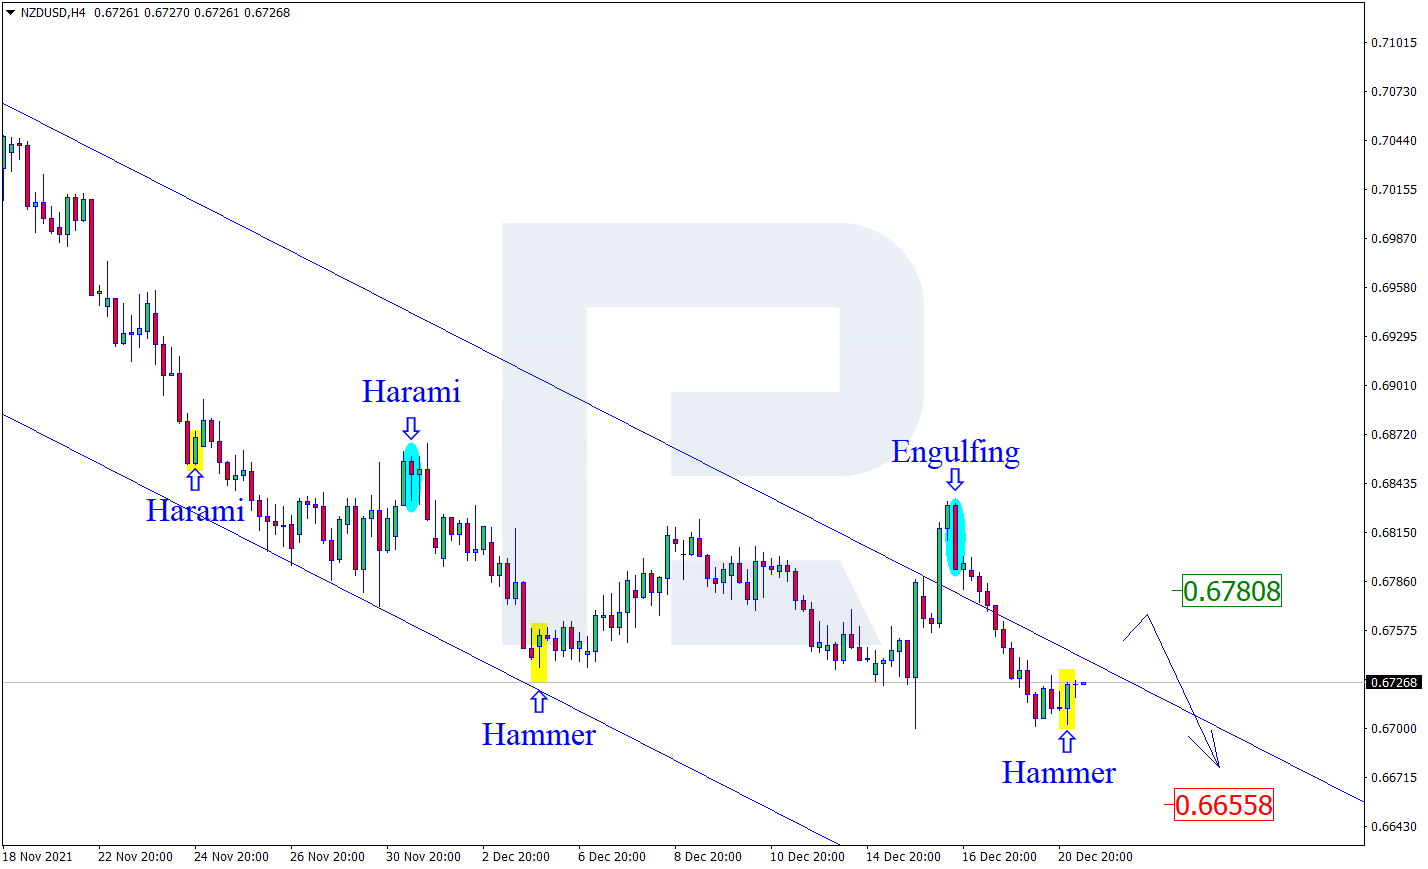
As we can see in the H4 chart, NZDUSD has formed a Hammer reversal pattern close to the support area. At the moment, the asset may reverse in the form of a new correctional impulse towards the resistance level. In this case, the upside target may be at 0.6780. After that, the asset may rebound from the level and resume moving downwards. However, an alternative scenario implies that the price may continue falling to reach 0.6655 without any corrections towards the resistance level.

NZDUSD
Risk Warning: the result of previous trading operations do not guarantee the same results in the future

GBPUSD, “Great Britain Pound vs US Dollar”

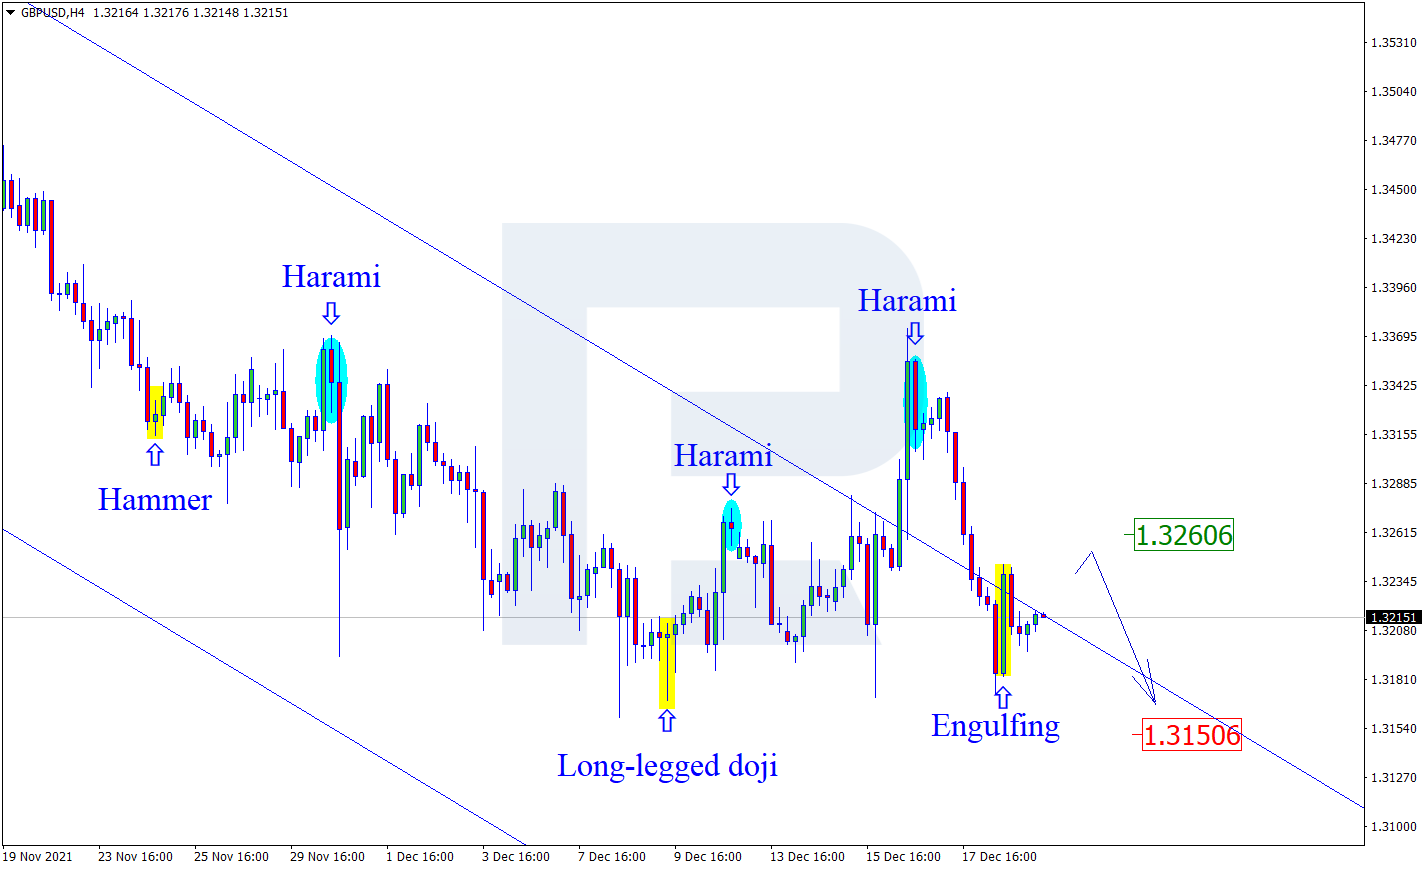
As we can see in the H4 chart, GBPUSD has formed an Engulfing reversal pattern near the support area. At the moment, the pair may reverse and start a new correctional wave. In this case, the upside correctional target may be at 1.3260. After testing the resistance level, the market may rebound from it and resume trading downwards. Still, there might be an alternative scenario, according to which the asset may continue falling to reach 1.3150 without any corrections towards the resistance level.

GBPUSD

Article By RoboForex.com

Attention!
Forecasts presented in this section only reflect the author’s private opinion and should not be considered as guidance for trading. RoboForex LP bears no responsibility for trading results based on trading recommendations described in these analytical reviews.

The Analytical Overview of the Main Currency Pairs on 2021.12.21

by JustForex

The EUR/USD currency pair

Technical indicators of the currency pair:
  • Prev Open: 1.1236
  • Prev Close: 1.1276
  • % chg. over the last day: +0.36%

Electricity prices in Europe increased to record levels due to the cold weather on Monday. Also, there is a rising incidence of disease in the region. Bundesbank predicts that the German economy may contract this quarter due to the Omicron strain. At the moment, the ECB is not taking any decisive steps to tighten monetary policy, so there are no fundamental reasons for the European currency to grow.

Trading recommendations
  • Support levels: 1.1243, 1.1230, 1.1168
  • Resistance levels: 1.1323, 1.1360, 1.1436, 1.1535, 1.1613, 1.1667, 1.1717

From a technical point of view, the EUR/USD on the hour time frame is still bearish. The MACD indicator has become inactive. Under such market conditions, traders should consider sell positions from the resistance level of 1.1323. Buy trades can be considered on the lower time frames from the support level of 1.1243, but only with additional confirmation.

Alternative scenario: if the price breaks out through the 1.1360 resistance level and fixes above, the mid-term uptrend will likely resume.

EUR/USD
There is no news feed for today.

The GBP/USD currency pair

Technical indicators of the currency pair:
  • Prev Open: 1.3238
  • Prev Close: 1.3208
  • % chg. over the last day: -0.23%

The UK reported 91,743 new Covid-19 cases on Monday, compared to 82,886 the day before. The country has already imposed strict restrictions, and the government is ready to tighten even more if necessary. The British pound may be supported by oil quotes growth, as well as the monetary policy of the Bank of England, which has already raised the interest rate last week.

Trading recommendations
  • Support levels: 1.3189
  • Resistance levels: 1.3272, 1.3301, 1.3365, 1.3434, 1.3507, 1.3575, 1.3685

On the hourly time frame, the GBP/USD trend is still bullish. The price reached the priority change level yesterday, but the buyers defended their positions. The MACD indicator has become inactive. Under such market conditions, traders should consider buy positions from the priority change level but only with additional confirmation in the form of a new buyers’ initiative. Sell trades can be considered from the resistance levels near the moving average.

Alternative scenario: if the price breaks down through the 1.3189 support level and consolidates below, the bearish scenario will likely resume.

GBP/USD
There is no news feed for today.

The USD/JPY currency pair

Technical indicators of the currency pair:
  • Prev Open: 113.61
  • Prev Close: 113.62
  • % chg. over the last day: +0.00%

From a fundamental point of view, the situation on the USD/JPY currency pair remains the same. The monetary policy of the Bank of Japan is aimed at active economic stimulation, while the US Federal Reserve, on the contrary, accelerated the reduction of the quantitative easing program last week. Such a situation is in favor of further growth of USD/JPY quotes.

Trading recommendations
  • Support levels: 113.30, 112.62, 112.30
  • Resistance levels: 113.95, 114.17, 115.15, 115.50

The global trend on the USD/JPY currency pair is bearish. The price is trading in a wide corridor. Under such market conditions, traders are best to look for sell positions from the resistance level of 113.95, but with additional confirmation. Buy positions should be considered from the 113.30 support level, but with additional confirmation in the form of a buyers’ initiative or after the price breaks out the priority change level.

Alternative scenario: if the price rises above 114.17, the uptrend will likely resume.

USD/JPY
There is no news feed for today.

The USD/CAD currency pair

Technical indicators of the currency pair:
  • Prev Open: 1.2889
  • Prev Close: 1.2943
  • % chg. over the last day: +0.42%

The Canadian dollar is a commodity currency, so it is highly correlated with both the dollar index and oil prices. Now the dollar index has fundamental support from the US Federal Reserve, while oil prices have been declining because of the Omicron strain, which negatively impacts fuel demand. However, analysts expect oil prices to recover soon, which could lead to a temporary strengthening of the Canadian dollar and a decrease in USD/CAD quotes.

Trading recommendations
  • Support levels: 1.2918, 1.2828, 1.2721, 1.2677, 1.2638
  • Resistance levels: 1.2951

From a technical point of view, the trend of the USD/CAD currency pair is bullish. The MACD indicator is in the positive zone, but there are the first signs of divergence. Under such market conditions, it’s better to look for buy deals from the support levels near the moving average on the lower time frames. Sell deals should be considered after the price returns below the level of 1.2918, but with additional confirmation in the form of a sellers’ initiative.

Alternative scenario: if the price breaks down through the 1.2766 support level and fixes below, the downtrend will likely resume.

USD/CAD
News feed for 2021.12.21:
  • – Canada Retail Sales (m/m) at 15:30 (GMT+2).

by JustForex


This article reflects a personal opinion and should not be interpreted as an investment advice, and/or offer, and/or a persistent request for carrying out financial transactions, and/or a guarantee, and/or a forecast of future events.

Intraday Market Analysis – AUD Struggles To Bounce

By Orbex

AUDUSD sees limited rebound

AUDUSD

The Australian dollar softens over dovish RBA meeting minutes. The pair has met stiff selling pressure near the 30-day moving average (0.7220).

On the hourly chart, a bearish MA cross and a break below 0.7100 indicate weakness in the latest rebound. An oversold RSI may cause a brief rally, but the bears may sell into strength around 0.7160.

0.7050 at the base of the initial breakout is an important support. A lack of bids could send the Aussie to 0.6990 with the reversal attempt at stake.

XAGUSD to test demand area

XAGUSD

Silver drops as the US dollar inched higher across the board. A bullish RSI divergence suggests a loss of momentum in the sell-off.

Then the recent surge has broken above multiple levels of resistance, prompting the short side to cover some of their bets. However, the bulls may need to defend their gains after the initial push overextended.

The demand zone between last September’s low (21.40) and 21.80 is critical in keeping the rebound valid. 22.65 is now a fresh resistance before a full-blown recovery could materialize.

US 30 struggles for support

DJIA

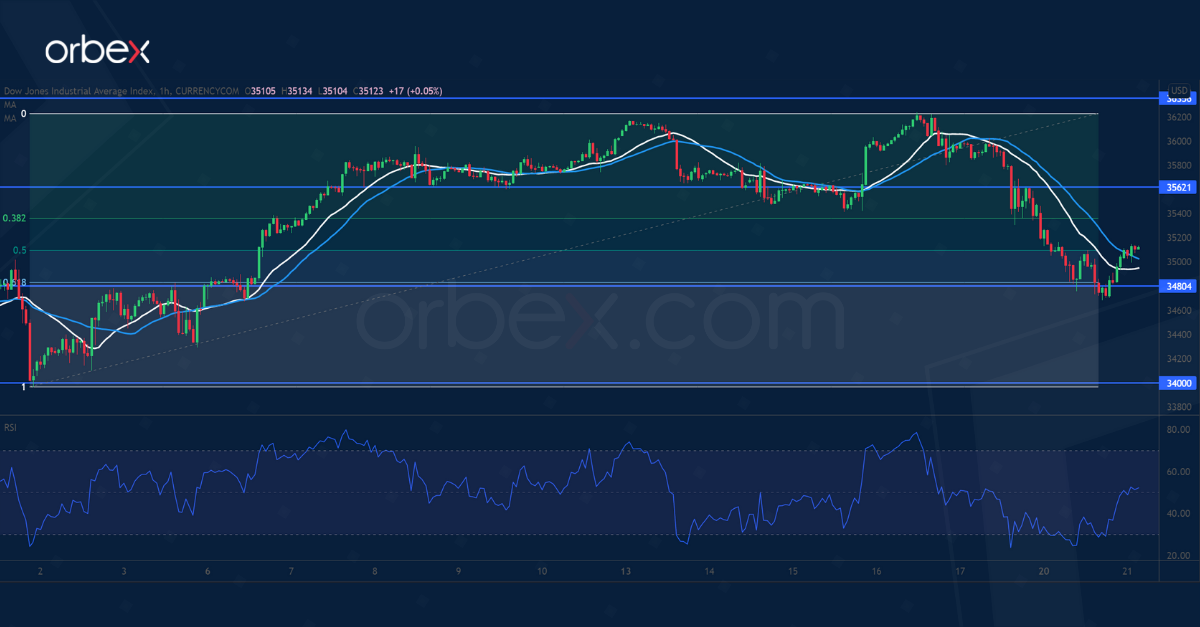
The Dow Jones retreated as major countries imposed curfews ahead of the holiday season. Following a double top under 36200, a drop below 35450 has broken buyers’ attempt to resume the rally.

The index is struggling to hold above the base of the December recovery (34800) which coincides with the 61.8% Fibonacci retracement level of the rally from 34000.

Buyers will need to lift 35620 before they could attract followers’ attention. 34000 is the daily support to safeguard the bullish bias in the medium-term.


Orbex-LogoArticle by Orbex
Orbex is a fully licensed broker that was established in 2011. Founded with a mission to serve its traders responsibly and provides traders with access to the world’s largest and most liquid financial markets. www.orbex.com