By InvestMacro | COT | Data Tables | COT Leaders | Downloads | COT Newsletter
Here are the latest charts and statistics for the Commitment of Traders (COT) data published by the Commodities Futures Trading Commission (CFTC). The latest release was delayed by the CFTC due to the New Year’s holiday.
The latest COT data is updated through Tuesday December 28th 2021 and shows a quick view of how large traders (for-profit speculators and commercial entities) were positioned in the futures markets. All currency positions are in direct relation to the US dollar where, for example, a bet for the euro is a bet that the euro will rise versus the dollar while a bet against the euro will be a bet that the euro will decline versus the dollar.
Highlighting the COT currency data was the continued strong run of bullish bets in the US Dollar Index currency futures contracts. Dollar Index speculator bets rose for the second straight week last week and for the fifteenth time out of the past nineteen weeks. The Dollar Index speculator bets not only closed out the year at their highest standing of 2021 but the bullish bets ascended to the highest level of the past one hundred and fifteen weeks, dating back to October 22nd of 2019. The Dollar Index’s current strength index score (comparing current speculator level to the range of the past 3 years) remains in an extreme bullish level with a score of 89.2 percent.
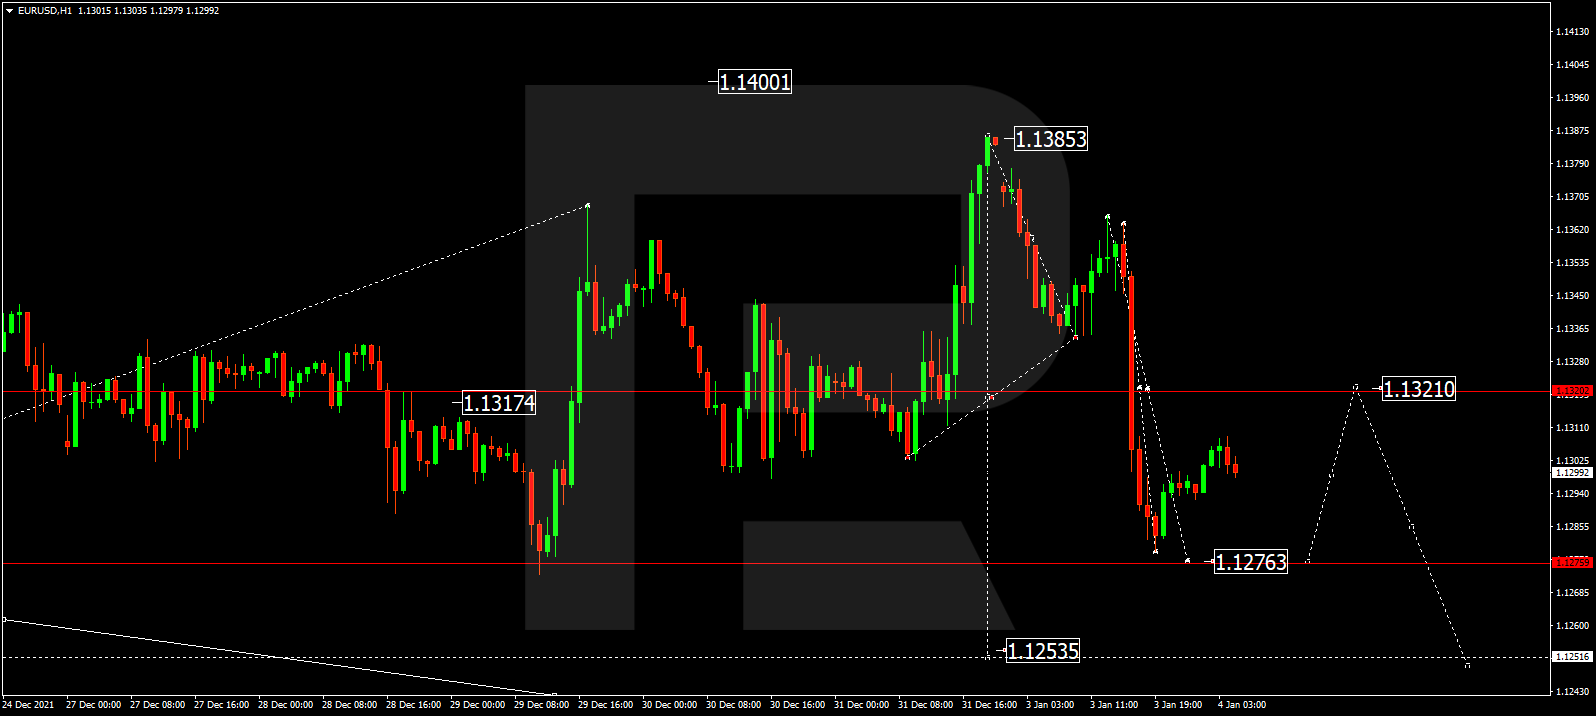
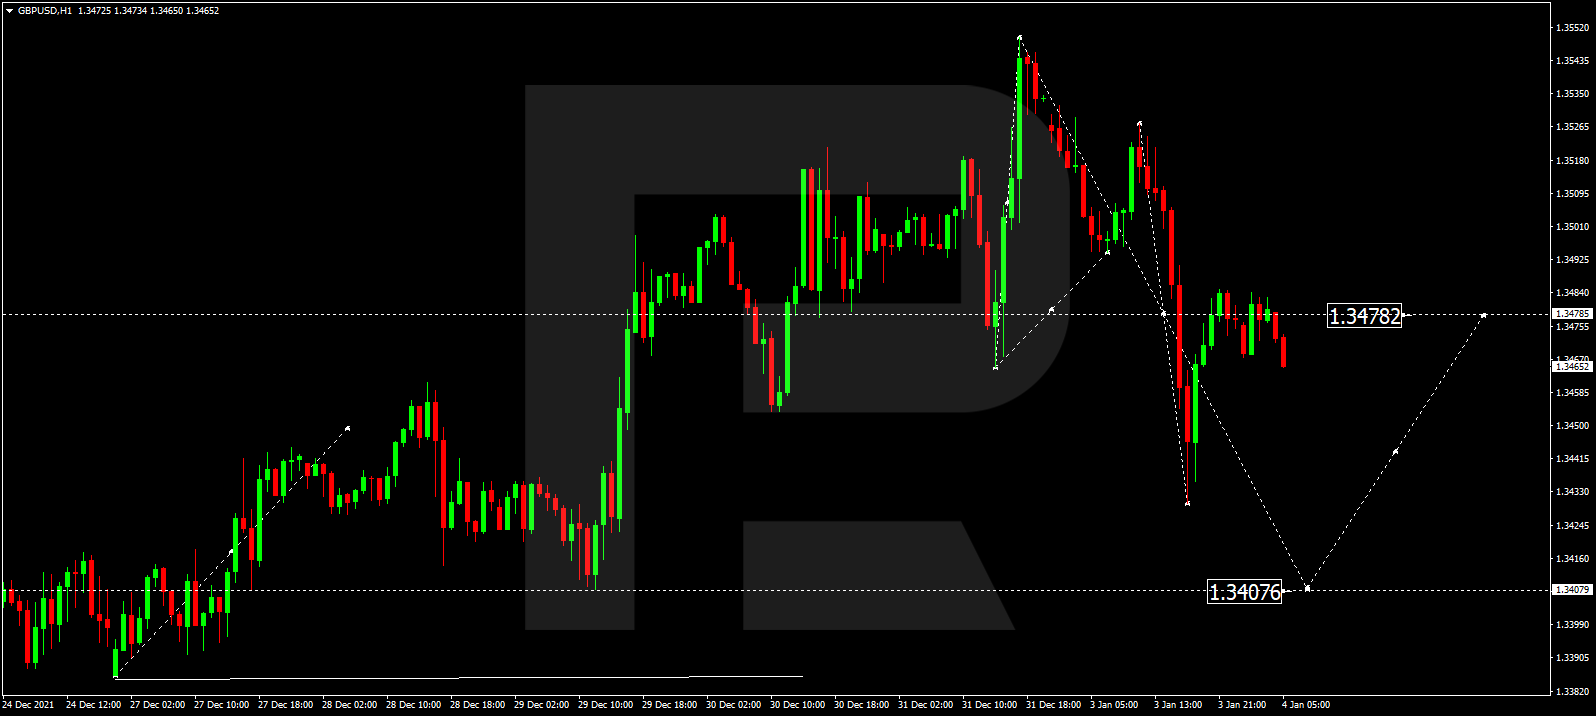
Joining the US Dollar Index (1,674 contracts) with positive changes last week were the Euro (3,528 contracts), Brazil real (1,261 contracts), British pound sterling (6,967 contracts) and Bitcoin (336 contracts).
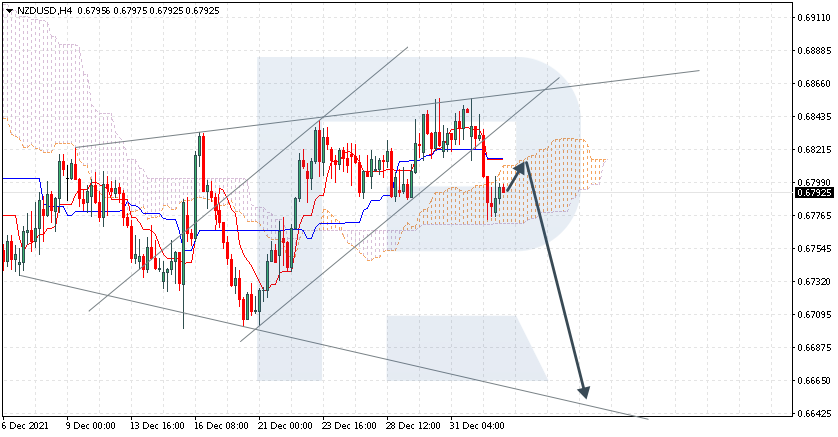
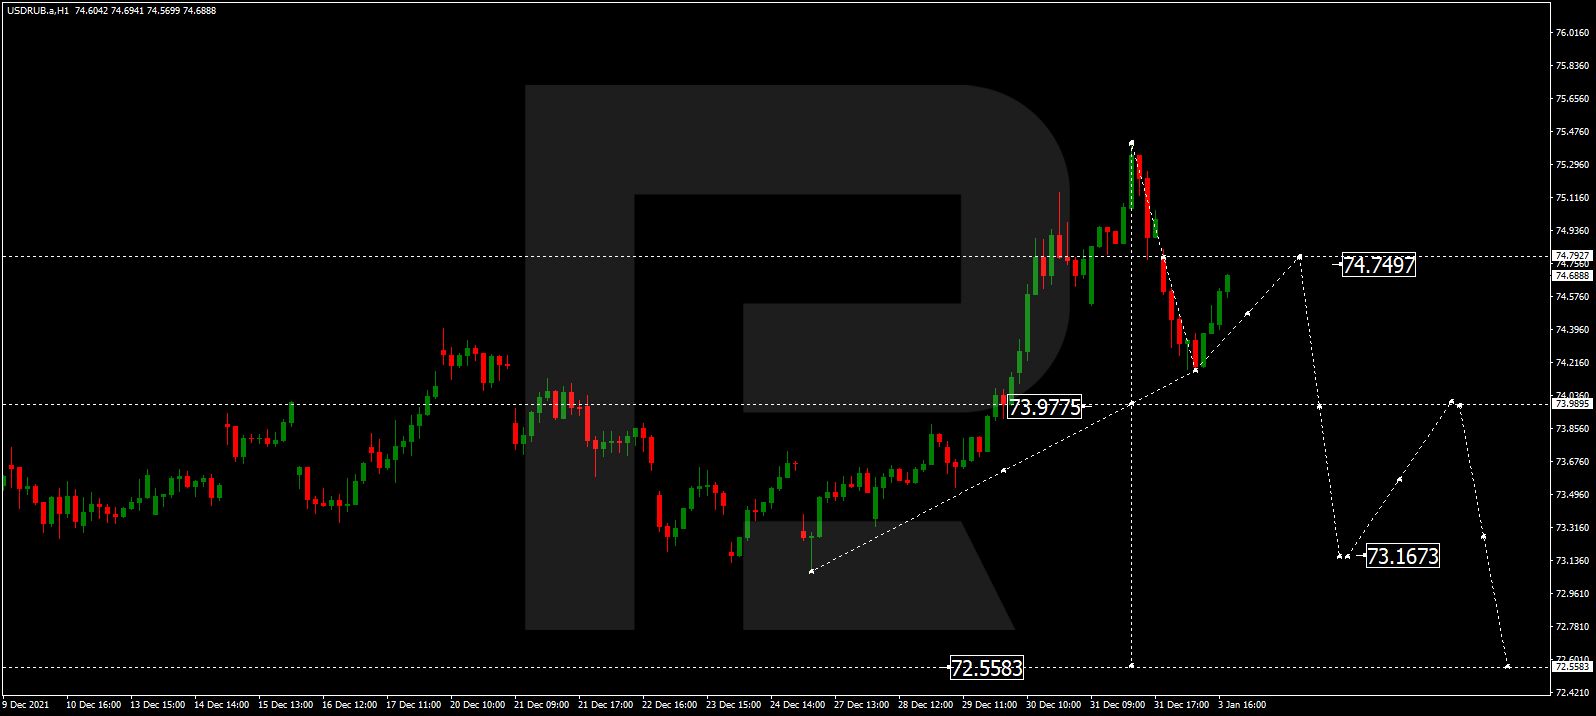
The currencies with declining bets were the Japanese yen (-816 contracts), Swiss franc (-1,491 contracts), Australian dollar (-1,387 contracts), New Zealand dollar (-2,285 contracts), Canadian dollar (-457 contracts), Russian ruble (-157 contracts) and the Mexican peso (-4,216 contracts).
| Dec-28-2021 | OI | OI-Index | Spec-Net | Spec-Index | Com-Net | COM-Index | Smalls-Net | Smalls-Index |
|---|
| USD Index | 57,892 | 85 | 36,789 | 89 | -42,461 | 4 | 5,672 | 79 |
| EUR | 673,273 | 73 | -6,634 | 33 | -18,533 | 70 | 25,167 | 16 |
| GBP | 205,378 | 42 | -50,719 | 37 | 60,101 | 65 | -9,382 | 36 |
| JPY | 203,814 | 58 | -53,102 | 34 | 72,364 | 72 | -19,262 | 8 |
| CHF | 40,122 | 14 | -10,718 | 51 | 15,226 | 48 | -4,508 | 50 |
| CAD | 138,692 | 23 | -10,334 | 46 | 7,167 | 56 | 3,167 | 36 |
| AUD | 183,152 | 70 | -81,741 | 8 | 99,476 | 93 | -17,735 | 9 |
| NZD | 41,862 | 28 | -8,421 | 57 | 10,100 | 46 | -1,679 | 33 |
| MXN | 102,418 | 4 | -9,008 | 24 | 8,334 | 76 | 674 | 46 |
| RUB | 47,726 | 50 | 8,464 | 33 | -9,886 | 63 | 1,422 | 73 |
| BRL | 37,384 | 39 | -5,286 | 62 | 5,493 | 41 | -207 | 64 |
| Bitcoin | 12,468 | 69 | -542 | 91 | -224 | 0 | 766 | 30 |
US Dollar Index Futures:
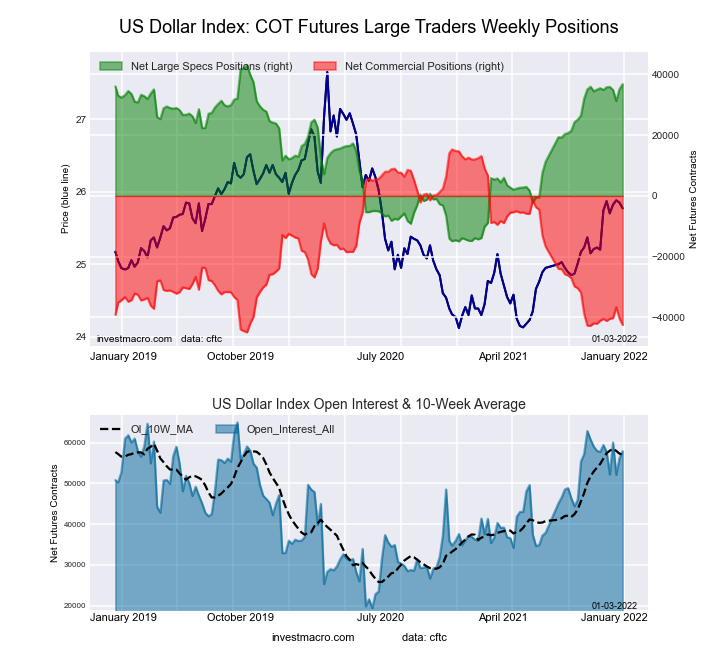 The US Dollar Index large speculator standing this week totaled a net position of 36,789 contracts in the data reported through Tuesday. This was a weekly lift of 1,674 contracts from the previous week which had a total of 35,115 net contracts.
This week’s current strength score (the trader positioning range over the past three years, measured from 0 to 100) shows the speculators are currently Bullish-Extreme with a score of 89.2 percent. The commercials are Bearish-Extreme with a score of 4.0 percent and the small traders (not shown in chart) are Bullish with a score of 78.6 percent.
| US DOLLAR INDEX Statistics | SPECULATORS | COMMERCIALS | SMALL TRADERS |
| – Percent of Open Interest Longs: | 81.5 | 3.6 | 12.9 |
| – Percent of Open Interest Shorts: | 17.9 | 77.0 | 3.1 |
| – Net Position: | 36,789 | -42,461 | 5,672 |
| – Gross Longs: | 47,169 | 2,102 | 7,471 |
| – Gross Shorts: | 10,380 | 44,563 | 1,799 |
| – Long to Short Ratio: | 4.5 to 1 | 0.0 to 1 | 4.2 to 1 |
| NET POSITION TREND: | | | |
| – Strength Index Score (3 Year Range Pct): | 89.2 | 4.0 | 78.6 |
| – Strength Index Reading (3 Year Range): | Bullish-Extreme | Bearish-Extreme | Bullish |
| NET POSITION MOVEMENT INDEX: | | | |
| – 6-Week Change in Strength Index: | 3.2 | -3.3 | 1.4 |
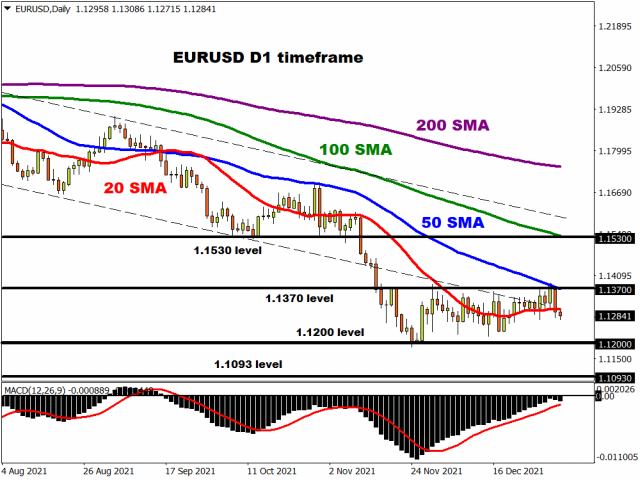
Euro Currency Futures:
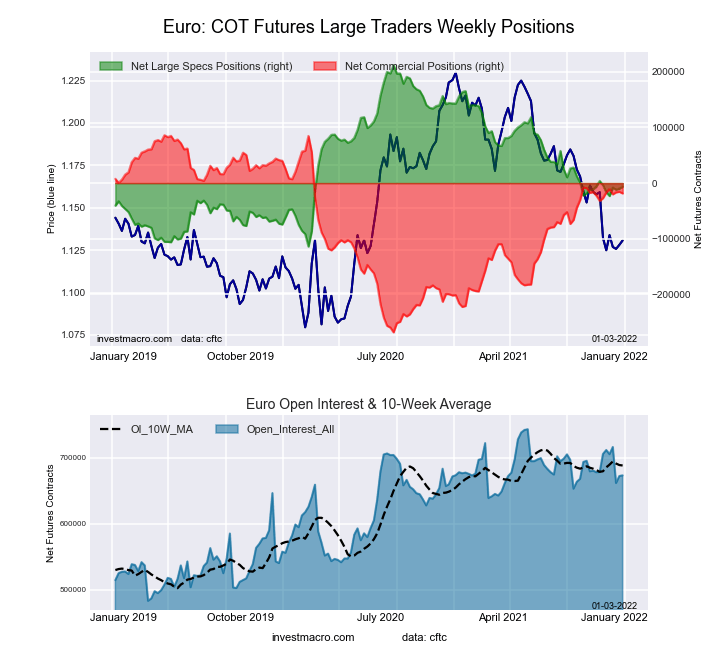 The Euro Currency large speculator standing this week totaled a net position of -6,634 contracts in the data reported through Tuesday. This was a weekly gain of 3,528 contracts from the previous week which had a total of -10,162 net contracts.
This week’s current strength score (the trader positioning range over the past three years, measured from 0 to 100) shows the speculators are currently Bearish with a score of 33.0 percent. The commercials are Bullish with a score of 70.5 percent and the small traders (not shown in chart) are Bearish-Extreme with a score of 16.1 percent.
| EURO Currency Statistics | SPECULATORS | COMMERCIALS | SMALL TRADERS |
| – Percent of Open Interest Longs: | 29.5 | 57.2 | 11.4 |
| – Percent of Open Interest Shorts: | 30.5 | 59.9 | 7.7 |
| – Net Position: | -6,634 | -18,533 | 25,167 |
| – Gross Longs: | 198,617 | 384,857 | 76,739 |
| – Gross Shorts: | 205,251 | 403,390 | 51,572 |
| – Long to Short Ratio: | 1.0 to 1 | 1.0 to 1 | 1.5 to 1 |
| NET POSITION TREND: | | | |
| – Strength Index Score (3 Year Range Pct): | 33.0 | 70.5 | 16.1 |
| – Strength Index Reading (3 Year Range): | Bearish | Bullish | Bearish-Extreme |
| NET POSITION MOVEMENT INDEX: | | | |
| – 6-Week Change in Strength Index: | -0.9 | 2.4 | -9.3 |
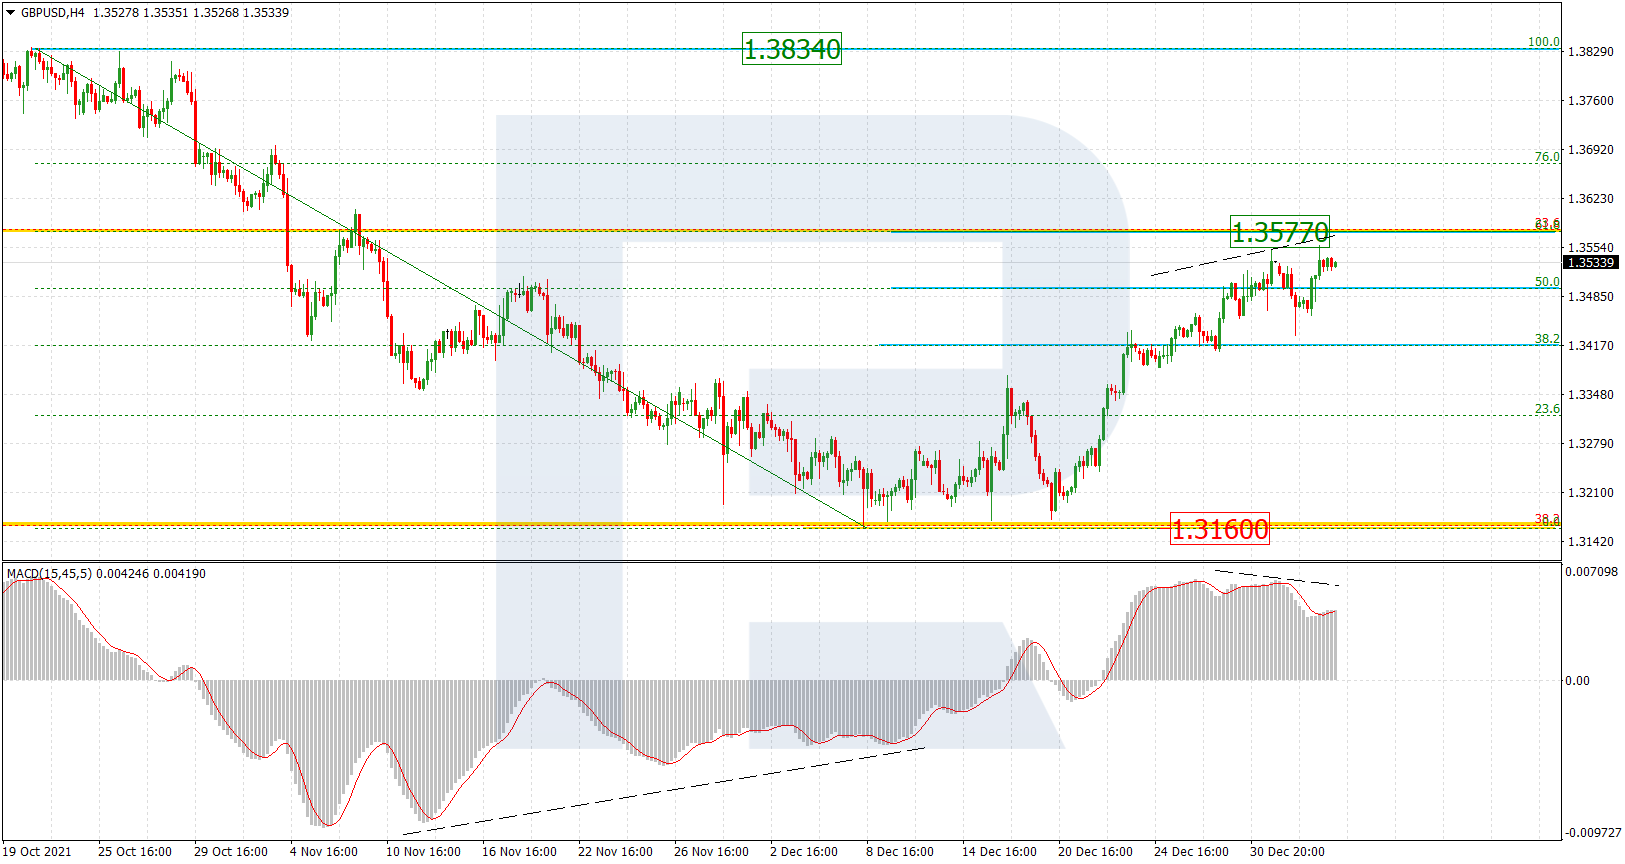
British Pound Sterling Futures:
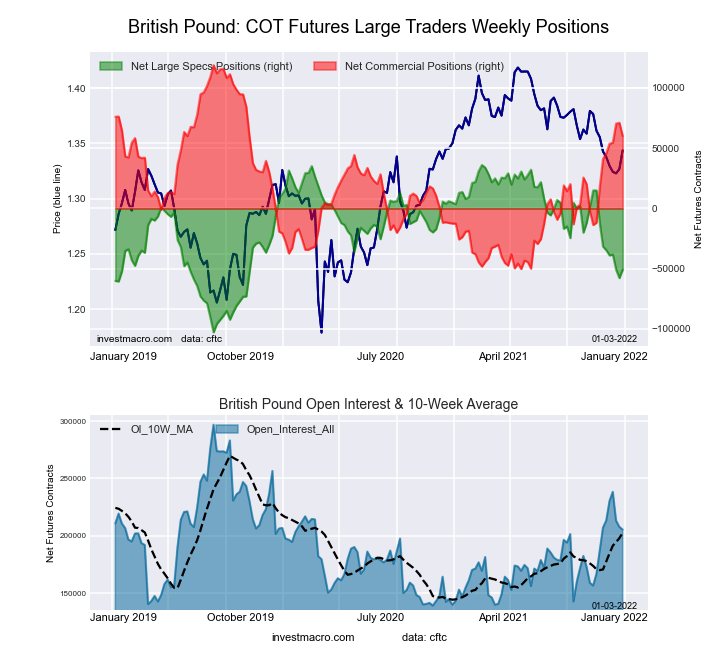 The British Pound Sterling large speculator standing this week totaled a net position of -50,719 contracts in the data reported through Tuesday. This was a weekly lift of 6,967 contracts from the previous week which had a total of -57,686 net contracts.
This week’s current strength score (the trader positioning range over the past three years, measured from 0 to 100) shows the speculators are currently Bearish with a score of 37.5 percent. The commercials are Bullish with a score of 65.2 percent and the small traders (not shown in chart) are Bearish with a score of 36.2 percent.
| BRITISH POUND Statistics | SPECULATORS | COMMERCIALS | SMALL TRADERS |
| – Percent of Open Interest Longs: | 11.2 | 76.4 | 10.8 |
| – Percent of Open Interest Shorts: | 35.9 | 47.1 | 15.4 |
| – Net Position: | -50,719 | 60,101 | -9,382 |
| – Gross Longs: | 23,093 | 156,875 | 22,191 |
| – Gross Shorts: | 73,812 | 96,774 | 31,573 |
| – Long to Short Ratio: | 0.3 to 1 | 1.6 to 1 | 0.7 to 1 |
| NET POSITION TREND: | | | |
| – Strength Index Score (3 Year Range Pct): | 37.5 | 65.2 | 36.2 |
| – Strength Index Reading (3 Year Range): | Bearish | Bullish | Bearish |
| NET POSITION MOVEMENT INDEX: | | | |
| – 6-Week Change in Strength Index: | -13.8 | 11.2 | 0.4 |
Japanese Yen Futures:
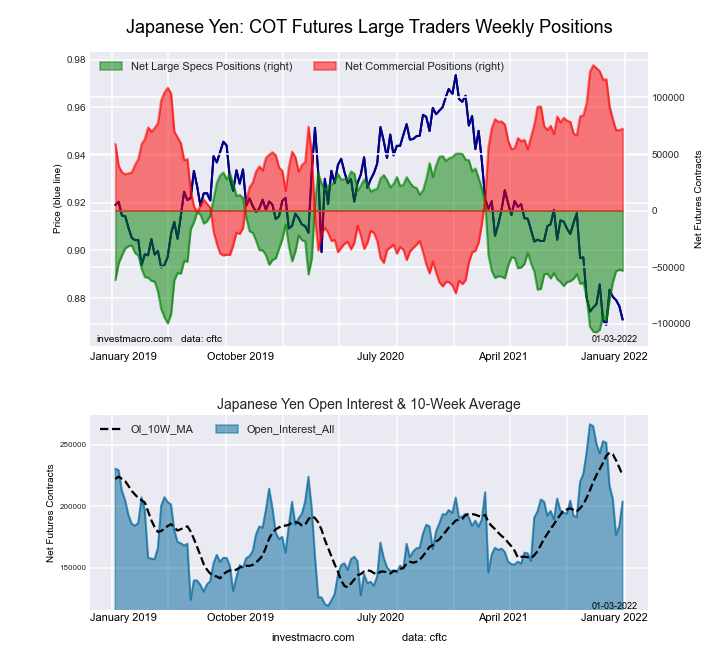 The Japanese Yen large speculator standing this week totaled a net position of -53,102 contracts in the data reported through Tuesday. This was a weekly fall of -816 contracts from the previous week which had a total of -52,286 net contracts.
This week’s current strength score (the trader positioning range over the past three years, measured from 0 to 100) shows the speculators are currently Bearish with a score of 34.5 percent. The commercials are Bullish with a score of 72.1 percent and the small traders (not shown in chart) are Bearish-Extreme with a score of 8.1 percent.
| JAPANESE YEN Statistics | SPECULATORS | COMMERCIALS | SMALL TRADERS |
| – Percent of Open Interest Longs: | 15.9 | 73.9 | 8.1 |
| – Percent of Open Interest Shorts: | 42.0 | 38.4 | 17.6 |
| – Net Position: | -53,102 | 72,364 | -19,262 |
| – Gross Longs: | 32,475 | 150,647 | 16,525 |
| – Gross Shorts: | 85,577 | 78,283 | 35,787 |
| – Long to Short Ratio: | 0.4 to 1 | 1.9 to 1 | 0.5 to 1 |
| NET POSITION TREND: | | | |
| – Strength Index Score (3 Year Range Pct): | 34.5 | 72.1 | 8.1 |
| – Strength Index Reading (3 Year Range): | Bearish | Bullish | Bearish-Extreme |
| NET POSITION MOVEMENT INDEX: | | | |
| – 6-Week Change in Strength Index: | 25.3 | -21.5 | 7.3 |
Swiss Franc Futures:
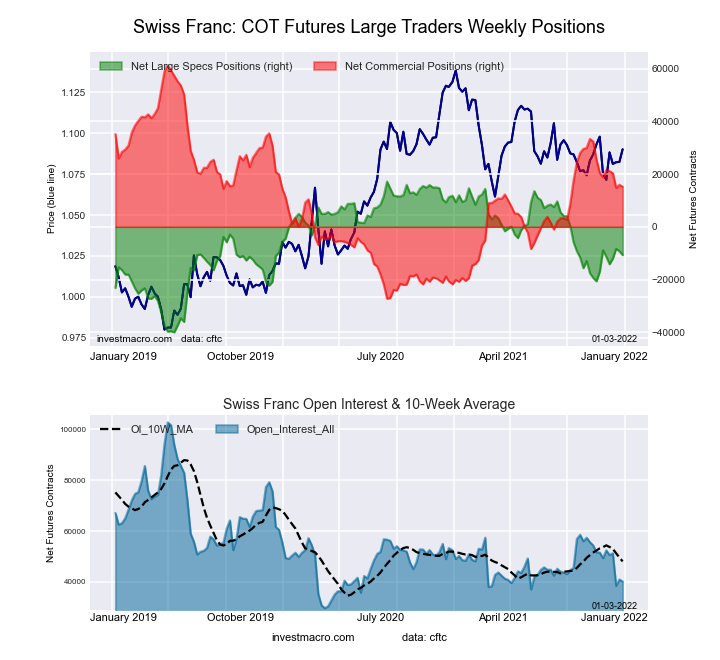 The Swiss Franc large speculator standing this week totaled a net position of -10,718 contracts in the data reported through Tuesday. This was a weekly reduction of -1,491 contracts from the previous week which had a total of -9,227 net contracts.
This week’s current strength score (the trader positioning range over the past three years, measured from 0 to 100) shows the speculators are currently Bullish with a score of 51.2 percent. The commercials are Bearish with a score of 48.0 percent and the small traders (not shown in chart) are Bullish with a score of 50.0 percent.
| SWISS FRANC Statistics | SPECULATORS | COMMERCIALS | SMALL TRADERS |
| – Percent of Open Interest Longs: | 2.6 | 65.5 | 31.4 |
| – Percent of Open Interest Shorts: | 29.3 | 27.6 | 42.7 |
| – Net Position: | -10,718 | 15,226 | -4,508 |
| – Gross Longs: | 1,043 | 26,286 | 12,618 |
| – Gross Shorts: | 11,761 | 11,060 | 17,126 |
| – Long to Short Ratio: | 0.1 to 1 | 2.4 to 1 | 0.7 to 1 |
| NET POSITION TREND: | | | |
| – Strength Index Score (3 Year Range Pct): | 51.2 | 48.0 | 50.0 |
| – Strength Index Reading (3 Year Range): | Bullish | Bearish | Bullish |
| NET POSITION MOVEMENT INDEX: | | | |
| – 6-Week Change in Strength Index: | -3.2 | -4.0 | 15.7 |
Canadian Dollar Futures:
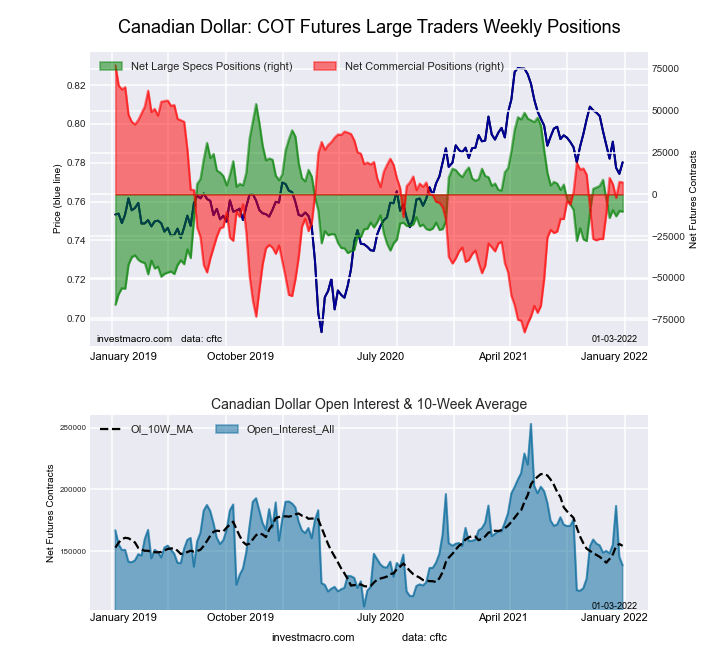 The Canadian Dollar large speculator standing this week totaled a net position of -10,334 contracts in the data reported through Tuesday. This was a weekly reduction of -457 contracts from the previous week which had a total of -9,877 net contracts.
This week’s current strength score (the trader positioning range over the past three years, measured from 0 to 100) shows the speculators are currently Bearish with a score of 46.4 percent. The commercials are Bullish with a score of 56.1 percent and the small traders (not shown in chart) are Bearish with a score of 36.1 percent.
| CANADIAN DOLLAR Statistics | SPECULATORS | COMMERCIALS | SMALL TRADERS |
| – Percent of Open Interest Longs: | 30.7 | 45.2 | 21.6 |
| – Percent of Open Interest Shorts: | 38.1 | 40.1 | 19.3 |
| – Net Position: | -10,334 | 7,167 | 3,167 |
| – Gross Longs: | 42,528 | 62,717 | 29,912 |
| – Gross Shorts: | 52,862 | 55,550 | 26,745 |
| – Long to Short Ratio: | 0.8 to 1 | 1.1 to 1 | 1.1 to 1 |
| NET POSITION TREND: | | | |
| – Strength Index Score (3 Year Range Pct): | 46.4 | 56.1 | 36.1 |
| – Strength Index Reading (3 Year Range): | Bearish | Bullish | Bearish |
| NET POSITION MOVEMENT INDEX: | | | |
| – 6-Week Change in Strength Index: | -15.9 | 21.2 | -29.5 |
Australian Dollar Futures:
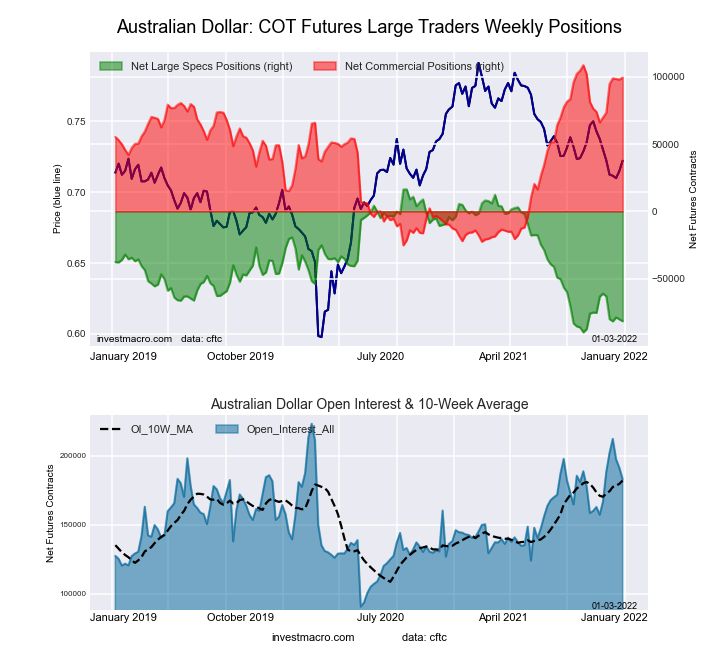 The Australian Dollar large speculator standing this week totaled a net position of -81,741 contracts in the data reported through Tuesday. This was a weekly decline of -1,387 contracts from the previous week which had a total of -80,354 net contracts.
This week’s current strength score (the trader positioning range over the past three years, measured from 0 to 100) shows the speculators are currently Bearish-Extreme with a score of 7.7 percent. The commercials are Bullish-Extreme with a score of 93.1 percent and the small traders (not shown in chart) are Bearish-Extreme with a score of 9.2 percent.
| AUSTRALIAN DOLLAR Statistics | SPECULATORS | COMMERCIALS | SMALL TRADERS |
| – Percent of Open Interest Longs: | 9.2 | 79.9 | 9.2 |
| – Percent of Open Interest Shorts: | 53.8 | 25.5 | 18.8 |
| – Net Position: | -81,741 | 99,476 | -17,735 |
| – Gross Longs: | 16,885 | 146,266 | 16,785 |
| – Gross Shorts: | 98,626 | 46,790 | 34,520 |
| – Long to Short Ratio: | 0.2 to 1 | 3.1 to 1 | 0.5 to 1 |
| NET POSITION TREND: | | | |
| – Strength Index Score (3 Year Range Pct): | 7.7 | 93.1 | 9.2 |
| – Strength Index Reading (3 Year Range): | Bearish-Extreme | Bullish-Extreme | Bearish-Extreme |
| NET POSITION MOVEMENT INDEX: | | | |
| – 6-Week Change in Strength Index: | -19.4 | 22.1 | -22.0 |
New Zealand Dollar Futures:
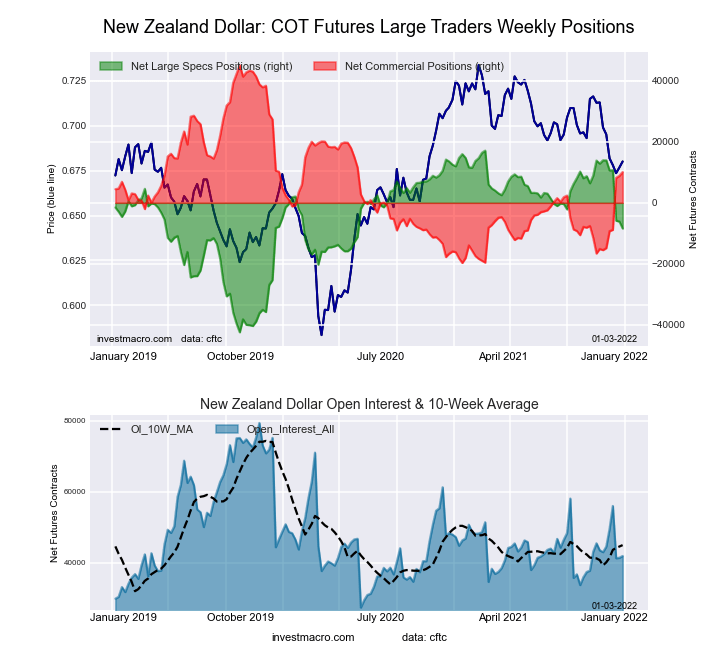 The New Zealand Dollar large speculator standing this week totaled a net position of -8,421 contracts in the data reported through Tuesday. This was a weekly decrease of -2,285 contracts from the previous week which had a total of -6,136 net contracts.
This week’s current strength score (the trader positioning range over the past three years, measured from 0 to 100) shows the speculators are currently Bullish with a score of 57.1 percent. The commercials are Bearish with a score of 46.0 percent and the small traders (not shown in chart) are Bearish with a score of 32.6 percent.
| NEW ZEALAND DOLLAR Statistics | SPECULATORS | COMMERCIALS | SMALL TRADERS |
| – Percent of Open Interest Longs: | 26.8 | 64.7 | 7.2 |
| – Percent of Open Interest Shorts: | 46.9 | 40.6 | 11.2 |
| – Net Position: | -8,421 | 10,100 | -1,679 |
| – Gross Longs: | 11,231 | 27,097 | 3,025 |
| – Gross Shorts: | 19,652 | 16,997 | 4,704 |
| – Long to Short Ratio: | 0.6 to 1 | 1.6 to 1 | 0.6 to 1 |
| NET POSITION TREND: | | | |
| – Strength Index Score (3 Year Range Pct): | 57.1 | 46.0 | 32.6 |
| – Strength Index Reading (3 Year Range): | Bullish | Bearish | Bearish |
| NET POSITION MOVEMENT INDEX: | | | |
| – 6-Week Change in Strength Index: | -37.6 | 39.5 | -37.0 |
Mexican Peso Futures:
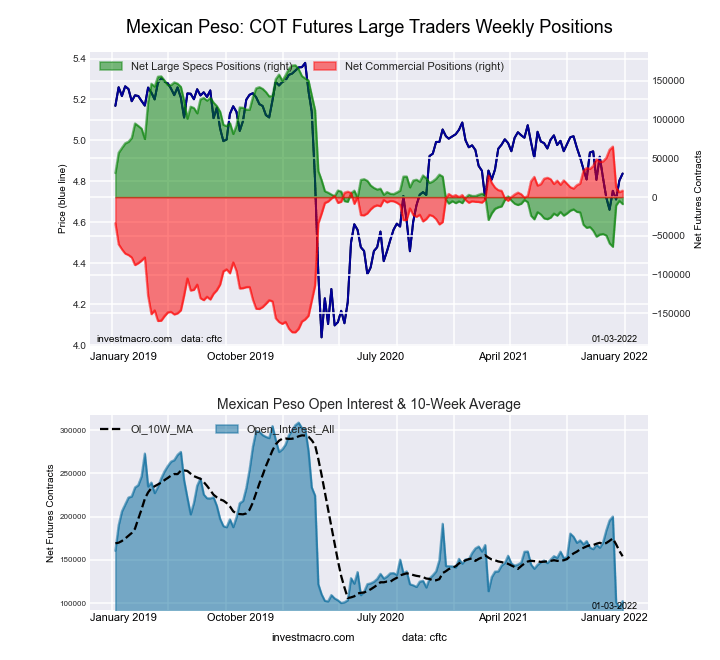 The Mexican Peso large speculator standing this week totaled a net position of -9,008 contracts in the data reported through Tuesday. This was a weekly decline of -4,216 contracts from the previous week which had a total of -4,792 net contracts.
This week’s current strength score (the trader positioning range over the past three years, measured from 0 to 100) shows the speculators are currently Bearish with a score of 23.5 percent. The commercials are Bullish with a score of 76.3 percent and the small traders (not shown in chart) are Bearish with a score of 45.9 percent.
| MEXICAN PESO Statistics | SPECULATORS | COMMERCIALS | SMALL TRADERS |
| – Percent of Open Interest Longs: | 32.8 | 62.0 | 4.7 |
| – Percent of Open Interest Shorts: | 41.6 | 53.9 | 4.0 |
| – Net Position: | -9,008 | 8,334 | 674 |
| – Gross Longs: | 33,561 | 63,529 | 4,815 |
| – Gross Shorts: | 42,569 | 55,195 | 4,141 |
| – Long to Short Ratio: | 0.8 to 1 | 1.2 to 1 | 1.2 to 1 |
| NET POSITION TREND: | | | |
| – Strength Index Score (3 Year Range Pct): | 23.5 | 76.3 | 45.9 |
| – Strength Index Reading (3 Year Range): | Bearish | Bullish | Bearish |
| NET POSITION MOVEMENT INDEX: | | | |
| – 6-Week Change in Strength Index: | 16.5 | -15.8 | -3.6 |
Brazilian Real Futures:
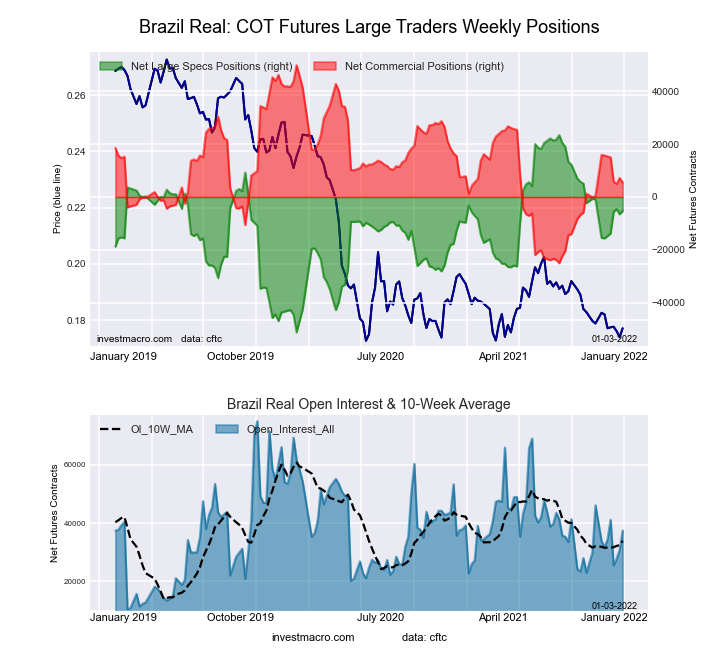 The Brazilian Real large speculator standing this week totaled a net position of -5,286 contracts in the data reported through Tuesday. This was a weekly boost of 1,261 contracts from the previous week which had a total of -6,547 net contracts.
This week’s current strength score (the trader positioning range over the past three years, measured from 0 to 100) shows the speculators are currently Bullish with a score of 61.5 percent. The commercials are Bearish with a score of 40.7 percent and the small traders (not shown in chart) are Bullish with a score of 64.3 percent.
| BRAZIL REAL Statistics | SPECULATORS | COMMERCIALS | SMALL TRADERS |
| – Percent of Open Interest Longs: | 37.4 | 54.0 | 6.8 |
| – Percent of Open Interest Shorts: | 51.5 | 39.3 | 7.4 |
| – Net Position: | -5,286 | 5,493 | -207 |
| – Gross Longs: | 13,973 | 20,203 | 2,542 |
| – Gross Shorts: | 19,259 | 14,710 | 2,749 |
| – Long to Short Ratio: | 0.7 to 1 | 1.4 to 1 | 0.9 to 1 |
| NET POSITION TREND: | | | |
| – Strength Index Score (3 Year Range Pct): | 61.5 | 40.7 | 64.3 |
| – Strength Index Reading (3 Year Range): | Bullish | Bearish | Bullish |
| NET POSITION MOVEMENT INDEX: | | | |
| – 6-Week Change in Strength Index: | 13.9 | -13.7 | -2.0 |
Russian Ruble Futures:
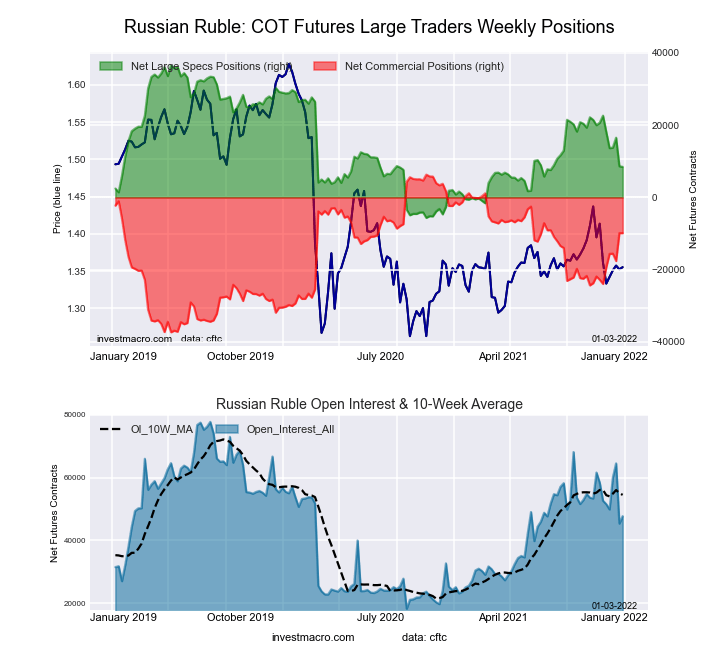 The Russian Ruble large speculator standing this week totaled a net position of 8,464 contracts in the data reported through Tuesday. This was a weekly decrease of -157 contracts from the previous week which had a total of 8,621 net contracts.
This week’s current strength score (the trader positioning range over the past three years, measured from 0 to 100) shows the speculators are currently Bearish with a score of 33.4 percent. The commercials are Bullish with a score of 62.9 percent and the small traders (not shown in chart) are Bullish with a score of 73.2 percent.
| RUSSIAN RUBLE Statistics | SPECULATORS | COMMERCIALS | SMALL TRADERS |
| – Percent of Open Interest Longs: | 43.9 | 51.4 | 4.7 |
| – Percent of Open Interest Shorts: | 26.2 | 72.1 | 1.7 |
| – Net Position: | 8,464 | -9,886 | 1,422 |
| – Gross Longs: | 20,953 | 24,545 | 2,228 |
| – Gross Shorts: | 12,489 | 34,431 | 806 |
| – Long to Short Ratio: | 1.7 to 1 | 0.7 to 1 | 2.8 to 1 |
| NET POSITION TREND: | | | |
| – Strength Index Score (3 Year Range Pct): | 33.4 | 62.9 | 73.2 |
| – Strength Index Reading (3 Year Range): | Bearish | Bullish | Bullish |
| NET POSITION MOVEMENT INDEX: | | | |
| – 6-Week Change in Strength Index: | -33.5 | 32.2 | 3.0 |
Bitcoin Futures:
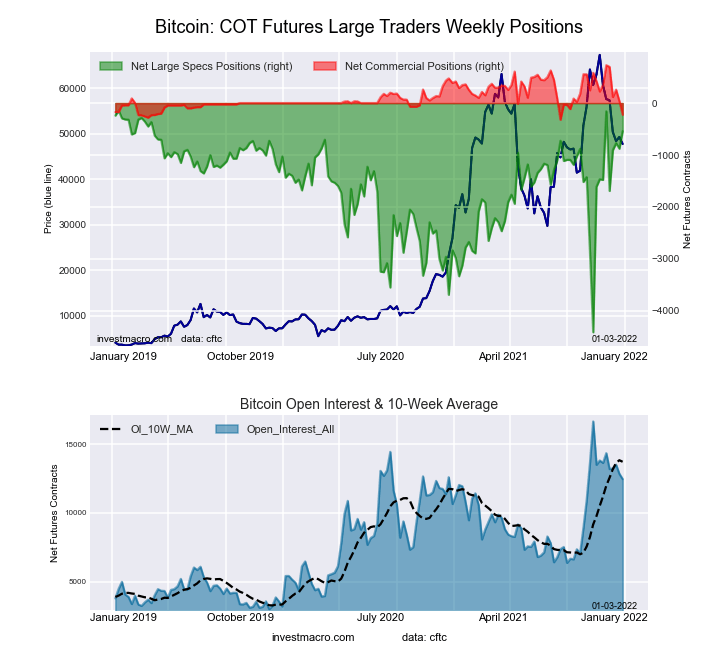 The Bitcoin large speculator standing this week totaled a net position of -542 contracts in the data reported through Tuesday. This was a weekly lift of 336 contracts from the previous week which had a total of -878 net contracts.
This week’s current strength score (the trader positioning range over the past three years, measured from 0 to 100) shows the speculators are currently Bullish-Extreme with a score of 90.6 percent. The commercials are Bearish-Extreme with a score of 9.2 percent and the small traders (not shown in chart) are Bearish with a score of 30.4 percent.
| BITCOIN Statistics | SPECULATORS | COMMERCIALS | SMALL TRADERS |
| – Percent of Open Interest Longs: | 70.0 | 3.5 | 12.9 |
| – Percent of Open Interest Shorts: | 74.4 | 5.3 | 6.7 |
| – Net Position: | -542 | -224 | 766 |
| – Gross Longs: | 8,729 | 434 | 1,606 |
| – Gross Shorts: | 9,271 | 658 | 840 |
| – Long to Short Ratio: | 0.9 to 1 | 0.7 to 1 | 1.9 to 1 |
| NET POSITION TREND: | | | |
| – Strength Index Score (3 Year Range Pct): | 90.6 | 9.2 | 30.4 |
| – Strength Index Reading (3 Year Range): | Bullish-Extreme | Bearish-Extreme | Bearish |
| NET POSITION MOVEMENT INDEX: | | | |
| – 6-Week Change in Strength Index: | 21.9 | -55.3 | -8.1 |
Article By InvestMacro – Receive our weekly COT Reports by Email
*COT Report: The COT data, released weekly to the public each Friday, is updated through the most recent Tuesday (data is 3 days old) and shows a quick view of how large speculators or non-commercials (for-profit traders) were positioned in the futures markets.
The CFTC categorizes trader positions according to commercial hedgers (traders who use futures contracts for hedging as part of the business), non-commercials (large traders who speculate to realize trading profits) and nonreportable traders (usually small traders/speculators) as well as their open interest (contracts open in the market at time of reporting).See CFTC criteria here.


 By
By 


