
By InvestMacro | COT | Data Tables | COT Leaders | Downloads | COT Newsletter
Here are the latest charts and statistics for the Commitment of Traders (COT) data published by the Commodities Futures Trading Commission (CFTC).
The latest COT data is updated through Tuesday January 4th 2022 and shows a quick view of how large traders (for-profit speculators and commercial entities) were positioned in the futures markets. All currency positions are in direct relation to the US dollar where, for example, a bet for the euro is a bet that the euro will rise versus the dollar while a bet against the euro will be a bet that the euro will decline versus the dollar.
Highlighting the COT currency data is the continued strength in the US Dollar Index futures bets. Speculators raised their bullish bets in the Dollar Index for a third consecutive week and for the seventh time in the past ten weeks. Since turning bullish on July 6th, Dollar Index bullish bets have had positive weekly gains in twenty-two out of the past twenty-seven weeks. This positive sentiment has brought the overall speculator standing (current total of +39,078 contracts) to the highest level since October 8th of 2019, a span of 117 weeks. The current speculator strength score (current level compared to past three years of data, above 80 is bullish-extreme, below 20 is bearish-extreme) for the Dollar Index is currently at 93.2 percent for a bullish-extreme reading.
Joining the US Dollar Index (2,289 contracts) with positive changes this week were the Euro (5,080 contracts), Brazil real (4,210 contracts), Swiss franc (1,189 contracts) and the British pound sterling (11,548 contracts).
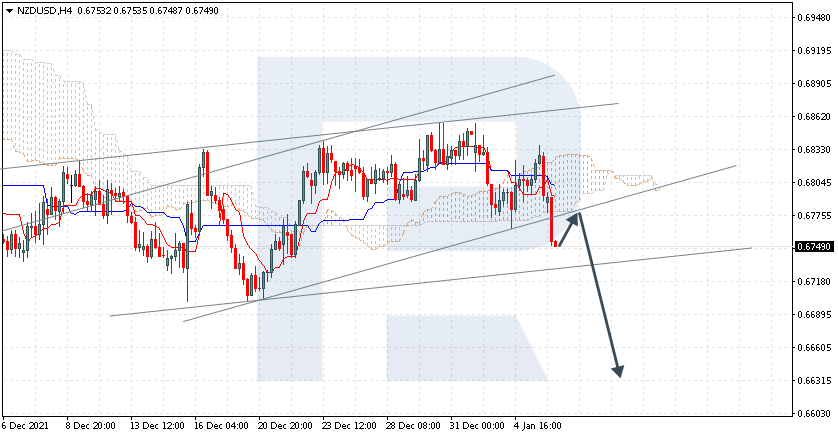
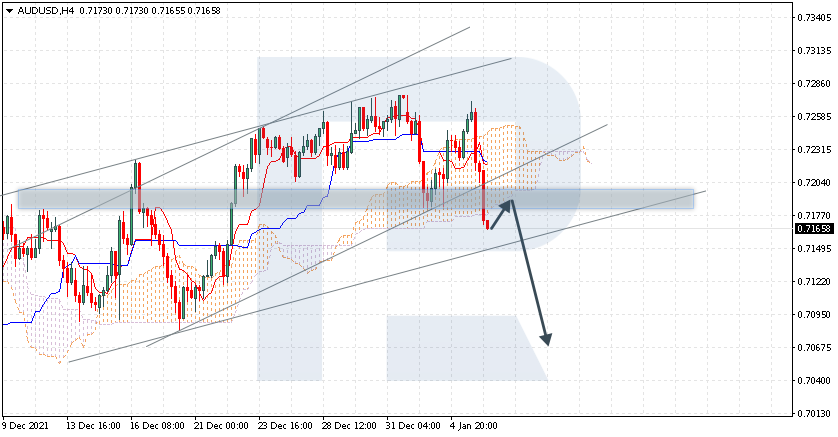
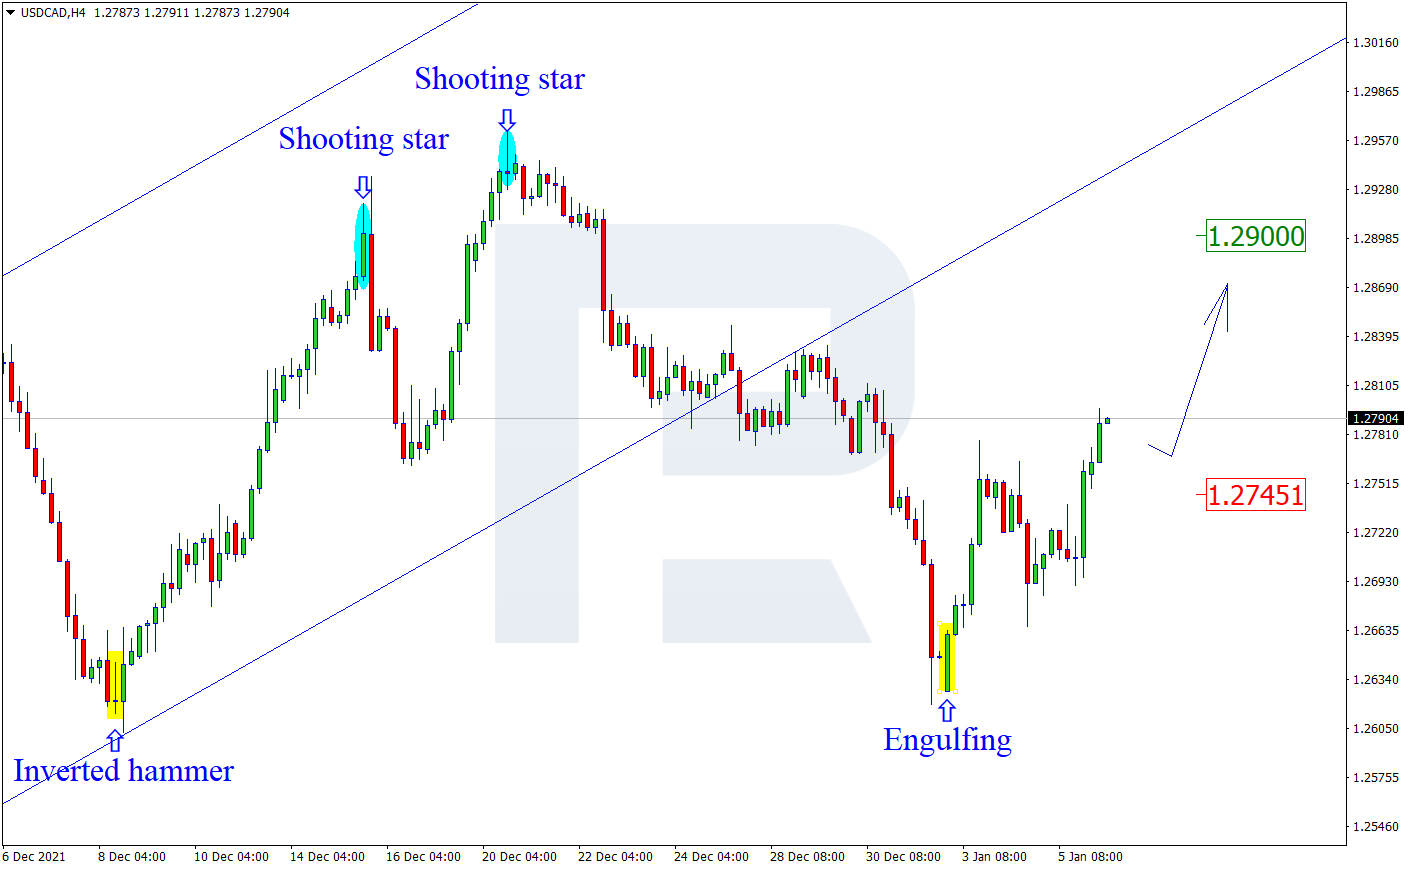
The currencies with declining speculator bets were the yen (-9,160 contracts), Australian dollar (-7,625 contracts), New Zealand dollar (-424 contracts), Canadian dollar (-691 contracts), Russian ruble (-1,135 contracts) and Bitcoin (-62 contracts) and the Mexican peso (-482 contracts).
| Jan-04-2022 | OI | OI-Index | Spec-Net | Spec-Index | Com-Net | COM-Index | Smalls-Net | Smalls-Index |
|---|---|---|---|---|---|---|---|---|
| USD Index | 58,089 | 85 | 39,078 | 93 | -44,717 | 0 | 5,639 | 78 |
| EUR | 678,218 | 75 | -1,554 | 35 | -26,458 | 68 | 28,012 | 21 |
| GBP | 200,007 | 39 | -39,171 | 46 | 49,516 | 59 | -10,345 | 34 |
| JPY | 234,068 | 78 | -62,262 | 29 | 84,744 | 78 | -22,482 | 1 |
| CHF | 42,251 | 17 | -9,529 | 53 | 14,628 | 47 | -5,099 | 48 |
| CAD | 135,633 | 20 | -11,025 | 43 | 8,542 | 62 | 2,483 | 35 |
| AUD | 180,107 | 68 | -89,366 | 1 | 100,809 | 94 | -11,443 | 25 |
| NZD | 40,302 | 25 | -8,845 | 56 | 10,335 | 46 | -1,490 | 35 |
| MXN | 119,748 | 12 | -9,490 | 23 | 7,127 | 76 | 2,363 | 53 |
| RUB | 47,674 | 49 | 7,329 | 31 | -8,873 | 65 | 1,544 | 76 |
| BRL | 28,218 | 24 | -1,076 | 67 | 1,284 | 35 | -208 | 64 |
| Bitcoin | 10,563 | 55 | -604 | 89 | -93 | 0 | 697 | 29 |
US Dollar Index Futures:
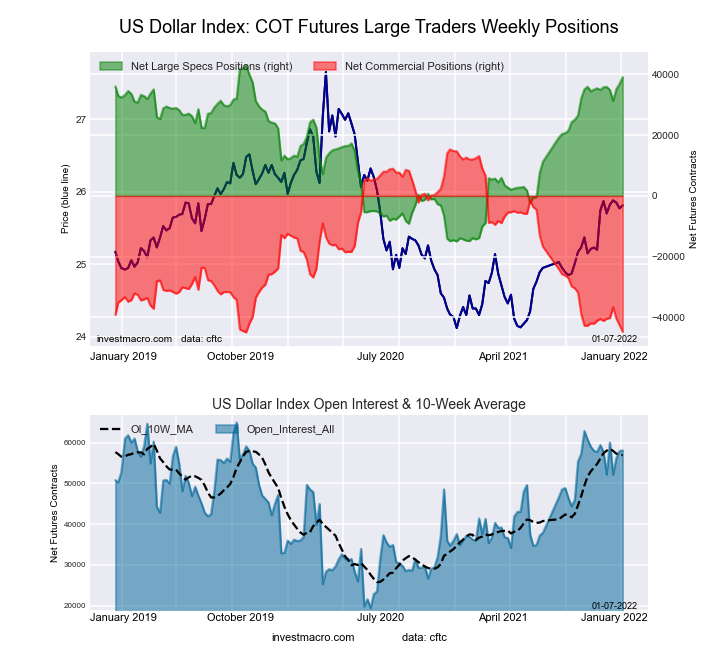 The US Dollar Index large speculator standing this week was a net position of 39,078 contracts in the data reported through Tuesday. This was a weekly lift of 2,289 contracts from the previous week which had a total of 36,789 net contracts.
This week’s current strength score (the trader positioning range over the past three years, measured from 0 to 100) shows the speculators are currently Bullish-Extreme with a score of 93.2 percent. The commercials are Bearish-Extreme with a score of 0.3 percent and the small traders (not shown in chart) are Bullish with a score of 78.2 percent.
| US DOLLAR INDEX Statistics | SPECULATORS | COMMERCIALS | SMALL TRADERS |
| – Percent of Open Interest Longs: | 82.2 | 2.9 | 13.0 |
| – Percent of Open Interest Shorts: | 14.9 | 79.9 | 3.3 |
| – Net Position: | 39,078 | -44,717 | 5,639 |
| – Gross Longs: | 47,750 | 1,692 | 7,571 |
| – Gross Shorts: | 8,672 | 46,409 | 1,932 |
| – Long to Short Ratio: | 5.5 to 1 | 0.0 to 1 | 3.9 to 1 |
| NET POSITION TREND: | |||
| – Strength Index Score (3 Year Range Pct): | 93.2 | 0.3 | 78.2 |
| – Strength Index Reading (3 Year Range): | Bullish-Extreme | Bearish-Extreme | Bullish |
| NET POSITION MOVEMENT INDEX: | |||
| – 6-Week Change in Strength Index: | 5.7 | -5.9 | 2.9 |
Euro Currency Futures:
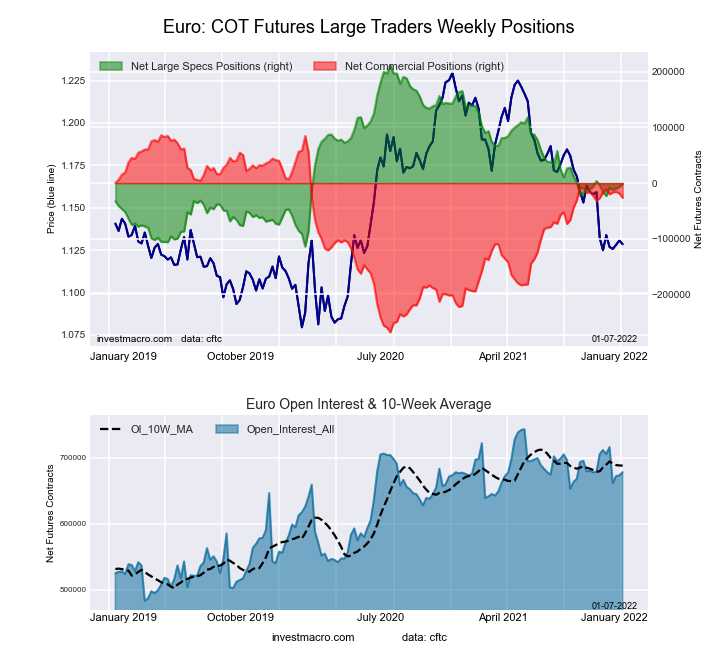 The Euro Currency large speculator standing this week was a net position of -1,554 contracts in the data reported through Tuesday. This was a weekly increase of 5,080 contracts from the previous week which had a total of -6,634 net contracts.
This week’s current strength score (the trader positioning range over the past three years, measured from 0 to 100) shows the speculators are currently Bearish with a score of 34.5 percent. The commercials are Bullish with a score of 68.2 percent and the small traders (not shown in chart) are Bearish with a score of 20.8 percent.
| EURO Currency Statistics | SPECULATORS | COMMERCIALS | SMALL TRADERS |
| – Percent of Open Interest Longs: | 29.4 | 57.3 | 11.9 |
| – Percent of Open Interest Shorts: | 29.6 | 61.2 | 7.8 |
| – Net Position: | -1,554 | -26,458 | 28,012 |
| – Gross Longs: | 199,073 | 388,742 | 81,029 |
| – Gross Shorts: | 200,627 | 415,200 | 53,017 |
| – Long to Short Ratio: | 1.0 to 1 | 0.9 to 1 | 1.5 to 1 |
| NET POSITION TREND: | |||
| – Strength Index Score (3 Year Range Pct): | 34.5 | 68.2 | 20.8 |
| – Strength Index Reading (3 Year Range): | Bearish | Bullish | Bearish |
| NET POSITION MOVEMENT INDEX: | |||
| – 6-Week Change in Strength Index: | 4.6 | -2.7 | -8.7 |
British Pound Sterling Futures:
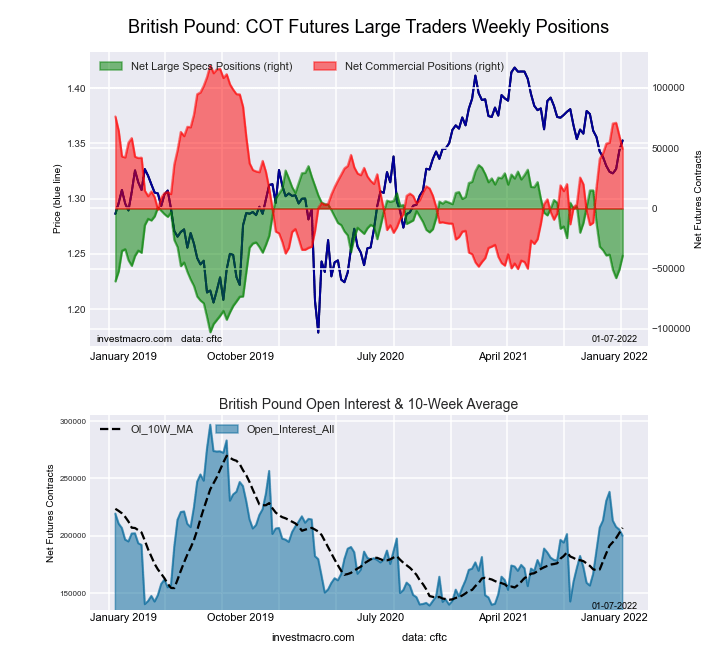 The British Pound Sterling large speculator standing this week was a net position of -39,171 contracts in the data reported through Tuesday. This was a weekly advance of 11,548 contracts from the previous week which had a total of -50,719 net contracts.
This week’s current strength score (the trader positioning range over the past three years, measured from 0 to 100) shows the speculators are currently Bearish with a score of 45.8 percent. The commercials are Bullish with a score of 59.0 percent and the small traders (not shown in chart) are Bearish with a score of 34.2 percent.
| BRITISH POUND Statistics | SPECULATORS | COMMERCIALS | SMALL TRADERS |
| – Percent of Open Interest Longs: | 13.0 | 75.2 | 10.3 |
| – Percent of Open Interest Shorts: | 32.6 | 50.4 | 15.5 |
| – Net Position: | -39,171 | 49,516 | -10,345 |
| – Gross Longs: | 25,980 | 150,332 | 20,573 |
| – Gross Shorts: | 65,151 | 100,816 | 30,918 |
| – Long to Short Ratio: | 0.4 to 1 | 1.5 to 1 | 0.7 to 1 |
| NET POSITION TREND: | |||
| – Strength Index Score (3 Year Range Pct): | 45.8 | 59.0 | 34.2 |
| – Strength Index Reading (3 Year Range): | Bearish | Bullish | Bearish |
| NET POSITION MOVEMENT INDEX: | |||
| – 6-Week Change in Strength Index: | -3.3 | 2.2 | 1.8 |
Japanese Yen Futures:
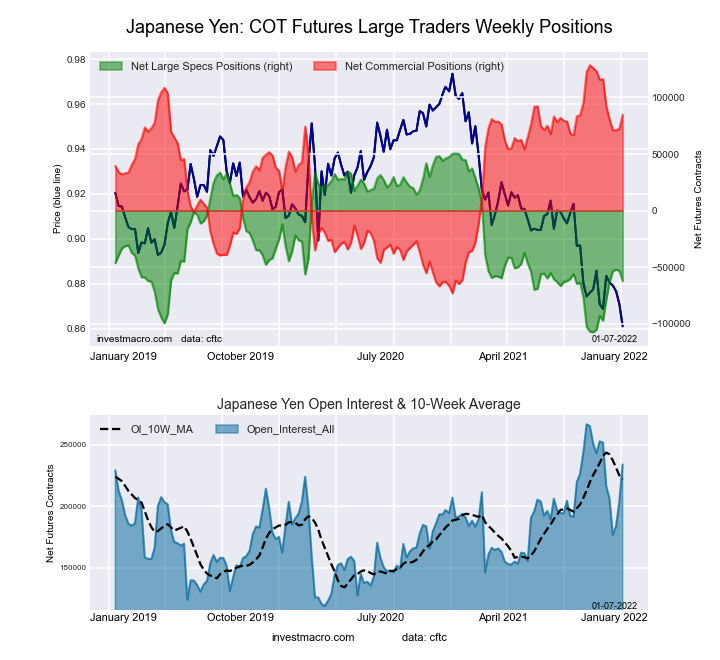 The Japanese Yen large speculator standing this week was a net position of -62,262 contracts in the data reported through Tuesday. This was a weekly fall of -9,160 contracts from the previous week which had a total of -53,102 net contracts.
This week’s current strength score (the trader positioning range over the past three years, measured from 0 to 100) shows the speculators are currently Bearish with a score of 28.7 percent. The commercials are Bullish with a score of 78.3 percent and the small traders (not shown in chart) are Bearish-Extreme with a score of 1.1 percent.
| JAPANESE YEN Statistics | SPECULATORS | COMMERCIALS | SMALL TRADERS |
| – Percent of Open Interest Longs: | 17.4 | 72.9 | 7.8 |
| – Percent of Open Interest Shorts: | 44.0 | 36.7 | 17.4 |
| – Net Position: | -62,262 | 84,744 | -22,482 |
| – Gross Longs: | 40,816 | 170,537 | 18,339 |
| – Gross Shorts: | 103,078 | 85,793 | 40,821 |
| – Long to Short Ratio: | 0.4 to 1 | 2.0 to 1 | 0.4 to 1 |
| NET POSITION TREND: | |||
| – Strength Index Score (3 Year Range Pct): | 28.7 | 78.3 | 1.1 |
| – Strength Index Reading (3 Year Range): | Bearish | Bullish | Bearish-Extreme |
| NET POSITION MOVEMENT INDEX: | |||
| – 6-Week Change in Strength Index: | 22.1 | -15.6 | -7.6 |
Swiss Franc Futures:
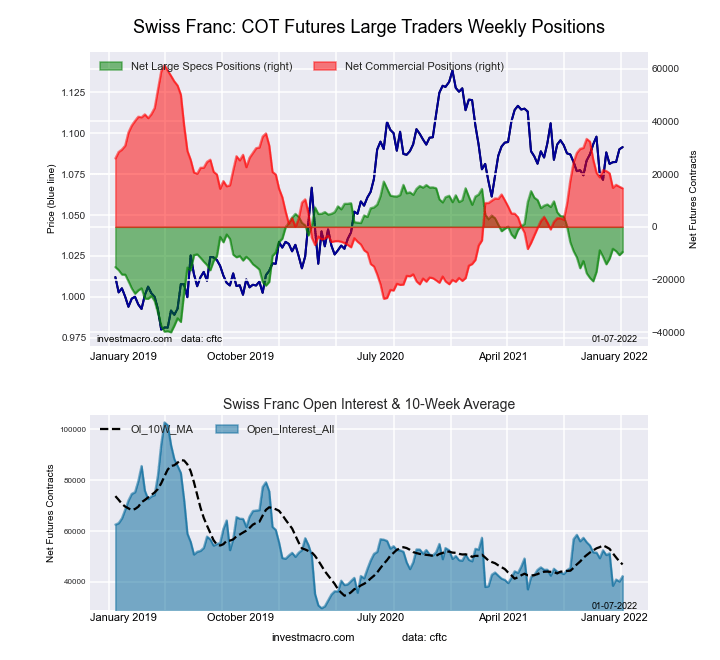 The Swiss Franc large speculator standing this week was a net position of -9,529 contracts in the data reported through Tuesday. This was a weekly advance of 1,189 contracts from the previous week which had a total of -10,718 net contracts.
This week’s current strength score (the trader positioning range over the past three years, measured from 0 to 100) shows the speculators are currently Bullish with a score of 53.3 percent. The commercials are Bearish with a score of 47.3 percent and the small traders (not shown in chart) are Bearish with a score of 48.3 percent.
| SWISS FRANC Statistics | SPECULATORS | COMMERCIALS | SMALL TRADERS |
| – Percent of Open Interest Longs: | 10.7 | 62.0 | 27.1 |
| – Percent of Open Interest Shorts: | 33.2 | 27.4 | 39.2 |
| – Net Position: | -9,529 | 14,628 | -5,099 |
| – Gross Longs: | 4,510 | 26,204 | 11,466 |
| – Gross Shorts: | 14,039 | 11,576 | 16,565 |
| – Long to Short Ratio: | 0.3 to 1 | 2.3 to 1 | 0.7 to 1 |
| NET POSITION TREND: | |||
| – Strength Index Score (3 Year Range Pct): | 53.3 | 47.3 | 48.3 |
| – Strength Index Reading (3 Year Range): | Bullish | Bearish | Bearish |
| NET POSITION MOVEMENT INDEX: | |||
| – 6-Week Change in Strength Index: | 3.2 | -7.8 | 14.8 |
Canadian Dollar Futures:
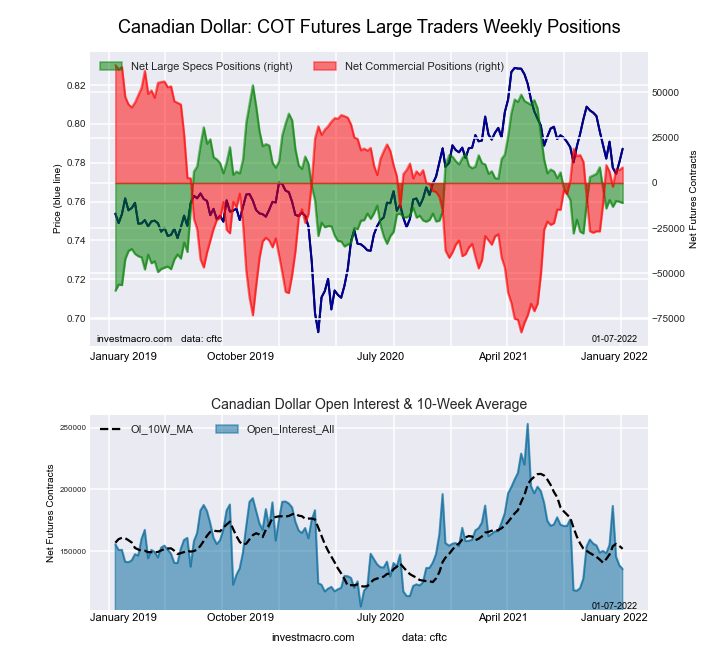 The Canadian Dollar large speculator standing this week was a net position of -11,025 contracts in the data reported through Tuesday. This was a weekly reduction of -691 contracts from the previous week which had a total of -10,334 net contracts.
This week’s current strength score (the trader positioning range over the past three years, measured from 0 to 100) shows the speculators are currently Bearish with a score of 42.7 percent. The commercials are Bullish with a score of 61.7 percent and the small traders (not shown in chart) are Bearish with a score of 34.7 percent.
| CANADIAN DOLLAR Statistics | SPECULATORS | COMMERCIALS | SMALL TRADERS |
| – Percent of Open Interest Longs: | 30.9 | 45.1 | 20.4 |
| – Percent of Open Interest Shorts: | 39.0 | 38.8 | 18.6 |
| – Net Position: | -11,025 | 8,542 | 2,483 |
| – Gross Longs: | 41,905 | 61,198 | 27,649 |
| – Gross Shorts: | 52,930 | 52,656 | 25,166 |
| – Long to Short Ratio: | 0.8 to 1 | 1.2 to 1 | 1.1 to 1 |
| NET POSITION TREND: | |||
| – Strength Index Score (3 Year Range Pct): | 42.7 | 61.7 | 34.7 |
| – Strength Index Reading (3 Year Range): | Bearish | Bullish | Bearish |
| NET POSITION MOVEMENT INDEX: | |||
| – 6-Week Change in Strength Index: | -6.9 | 13.5 | -24.0 |
Australian Dollar Futures:
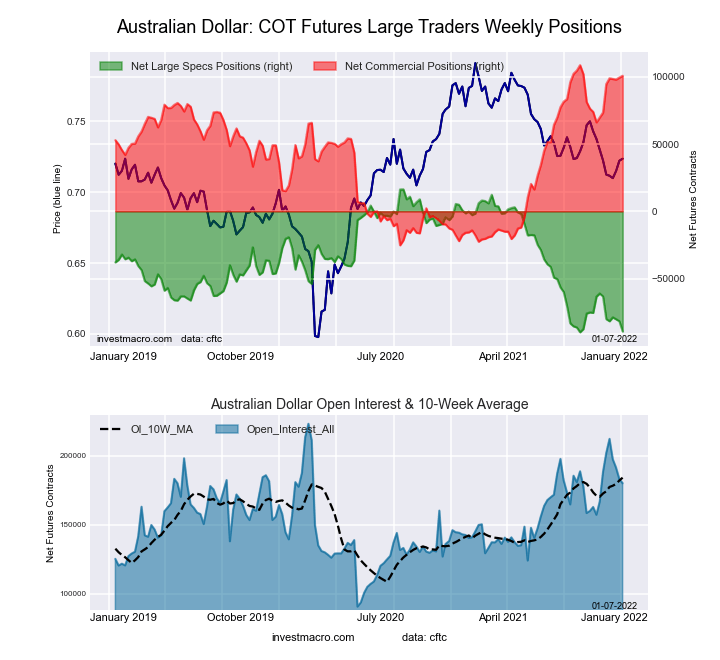 The Australian Dollar large speculator standing this week was a net position of -89,366 contracts in the data reported through Tuesday. This was a weekly decline of -7,625 contracts from the previous week which had a total of -81,741 net contracts.
This week’s current strength score (the trader positioning range over the past three years, measured from 0 to 100) shows the speculators are currently Bearish-Extreme with a score of 0.6 percent. The commercials are Bullish-Extreme with a score of 94.1 percent and the small traders (not shown in chart) are Bearish with a score of 24.5 percent.
| AUSTRALIAN DOLLAR Statistics | SPECULATORS | COMMERCIALS | SMALL TRADERS |
| – Percent of Open Interest Longs: | 7.0 | 81.0 | 10.0 |
| – Percent of Open Interest Shorts: | 56.6 | 25.0 | 16.4 |
| – Net Position: | -89,366 | 100,809 | -11,443 |
| – Gross Longs: | 12,632 | 145,915 | 18,060 |
| – Gross Shorts: | 101,998 | 45,106 | 29,503 |
| – Long to Short Ratio: | 0.1 to 1 | 3.2 to 1 | 0.6 to 1 |
| NET POSITION TREND: | |||
| – Strength Index Score (3 Year Range Pct): | 0.6 | 94.1 | 24.5 |
| – Strength Index Reading (3 Year Range): | Bearish-Extreme | Bullish-Extreme | Bearish |
| NET POSITION MOVEMENT INDEX: | |||
| – 6-Week Change in Strength Index: | -24.5 | 20.4 | -3.1 |
New Zealand Dollar Futures:
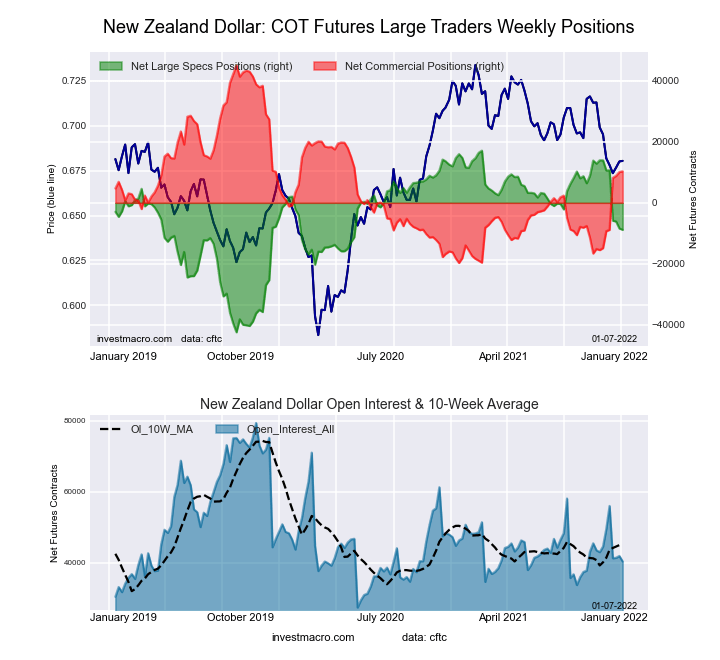 The New Zealand Dollar large speculator standing this week was a net position of -8,845 contracts in the data reported through Tuesday. This was a weekly fall of -424 contracts from the previous week which had a total of -8,421 net contracts.
This week’s current strength score (the trader positioning range over the past three years, measured from 0 to 100) shows the speculators are currently Bullish with a score of 56.4 percent. The commercials are Bearish with a score of 46.3 percent and the small traders (not shown in chart) are Bearish with a score of 34.8 percent.
| NEW ZEALAND DOLLAR Statistics | SPECULATORS | COMMERCIALS | SMALL TRADERS |
| – Percent of Open Interest Longs: | 23.4 | 67.5 | 7.4 |
| – Percent of Open Interest Shorts: | 45.3 | 41.9 | 11.1 |
| – Net Position: | -8,845 | 10,335 | -1,490 |
| – Gross Longs: | 9,417 | 27,208 | 3,000 |
| – Gross Shorts: | 18,262 | 16,873 | 4,490 |
| – Long to Short Ratio: | 0.5 to 1 | 1.6 to 1 | 0.7 to 1 |
| NET POSITION TREND: | |||
| – Strength Index Score (3 Year Range Pct): | 56.4 | 46.3 | 34.8 |
| – Strength Index Reading (3 Year Range): | Bullish | Bearish | Bearish |
| NET POSITION MOVEMENT INDEX: | |||
| – 6-Week Change in Strength Index: | -38.2 | 38.8 | -27.6 |
Mexican Peso Futures:
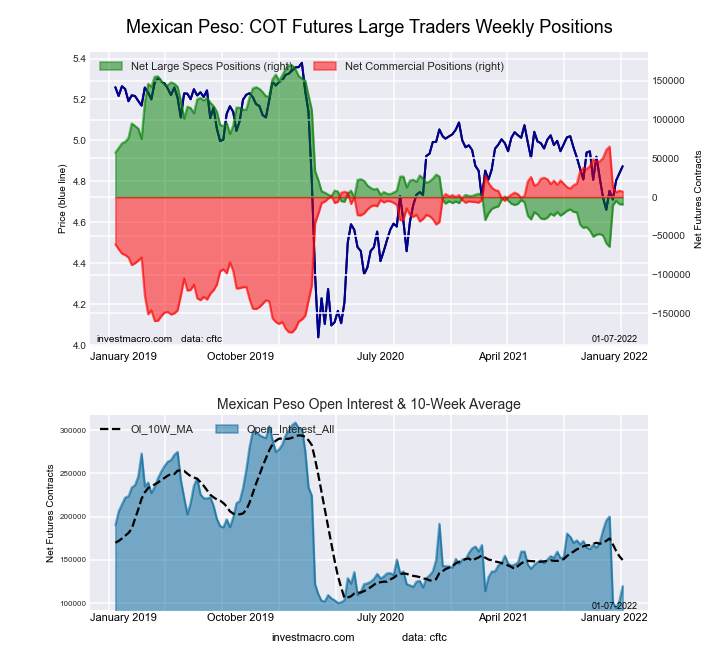 The Mexican Peso large speculator standing this week was a net position of -9,490 contracts in the data reported through Tuesday. This was a weekly decrease of -482 contracts from the previous week which had a total of -9,008 net contracts.
This week’s current strength score (the trader positioning range over the past three years, measured from 0 to 100) shows the speculators are currently Bearish with a score of 23.3 percent. The commercials are Bullish with a score of 75.8 percent and the small traders (not shown in chart) are Bullish with a score of 53.0 percent.
| MEXICAN PESO Statistics | SPECULATORS | COMMERCIALS | SMALL TRADERS |
| – Percent of Open Interest Longs: | 37.5 | 57.3 | 4.9 |
| – Percent of Open Interest Shorts: | 45.4 | 51.3 | 2.9 |
| – Net Position: | -9,490 | 7,127 | 2,363 |
| – Gross Longs: | 44,876 | 68,595 | 5,860 |
| – Gross Shorts: | 54,366 | 61,468 | 3,497 |
| – Long to Short Ratio: | 0.8 to 1 | 1.1 to 1 | 1.7 to 1 |
| NET POSITION TREND: | |||
| – Strength Index Score (3 Year Range Pct): | 23.3 | 75.8 | 53.0 |
| – Strength Index Reading (3 Year Range): | Bearish | Bullish | Bullish |
| NET POSITION MOVEMENT INDEX: | |||
| – 6-Week Change in Strength Index: | 17.0 | -18.1 | 14.8 |
Brazilian Real Futures:
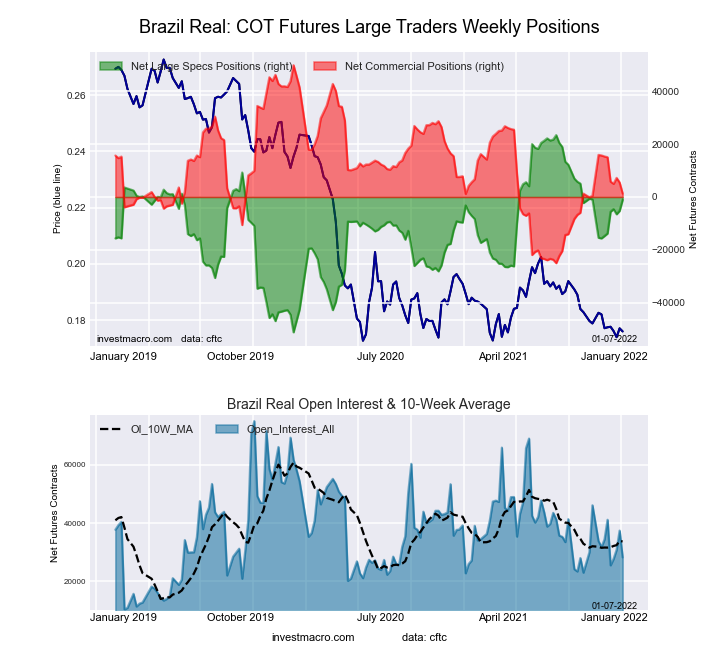 The Brazilian Real large speculator standing this week was a net position of -1,076 contracts in the data reported through Tuesday. This was a weekly boost of 4,210 contracts from the previous week which had a total of -5,286 net contracts.
This week’s current strength score (the trader positioning range over the past three years, measured from 0 to 100) shows the speculators are currently Bullish with a score of 67.2 percent. The commercials are Bearish with a score of 35.1 percent and the small traders (not shown in chart) are Bullish with a score of 64.3 percent.
| BRAZIL REAL Statistics | SPECULATORS | COMMERCIALS | SMALL TRADERS |
| – Percent of Open Interest Longs: | 38.2 | 52.4 | 9.4 |
| – Percent of Open Interest Shorts: | 42.0 | 47.8 | 10.2 |
| – Net Position: | -1,076 | 1,284 | -208 |
| – Gross Longs: | 10,776 | 14,785 | 2,657 |
| – Gross Shorts: | 11,852 | 13,501 | 2,865 |
| – Long to Short Ratio: | 0.9 to 1 | 1.1 to 1 | 0.9 to 1 |
| NET POSITION TREND: | |||
| – Strength Index Score (3 Year Range Pct): | 67.2 | 35.1 | 64.3 |
| – Strength Index Reading (3 Year Range): | Bullish | Bearish | Bullish |
| NET POSITION MOVEMENT INDEX: | |||
| – 6-Week Change in Strength Index: | 18.4 | -18.8 | 4.2 |
Russian Ruble Futures:
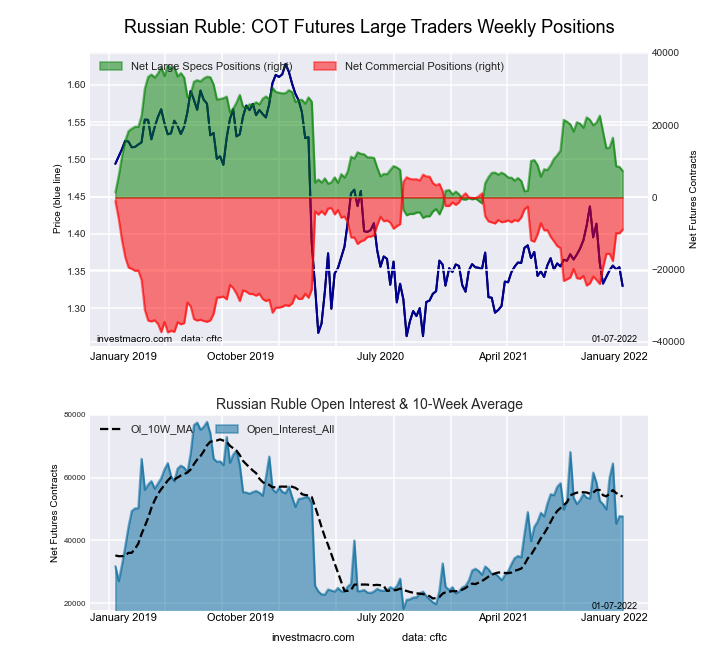 The Russian Ruble large speculator standing this week was a net position of 7,329 contracts in the data reported through Tuesday. This was a weekly decrease of -1,135 contracts from the previous week which had a total of 8,464 net contracts.
This week’s current strength score (the trader positioning range over the past three years, measured from 0 to 100) shows the speculators are currently Bearish with a score of 30.7 percent. The commercials are Bullish with a score of 65.2 percent and the small traders (not shown in chart) are Bullish with a score of 76.5 percent.
| RUSSIAN RUBLE Statistics | SPECULATORS | COMMERCIALS | SMALL TRADERS |
| – Percent of Open Interest Longs: | 40.9 | 53.7 | 5.4 |
| – Percent of Open Interest Shorts: | 25.5 | 72.3 | 2.1 |
| – Net Position: | 7,329 | -8,873 | 1,544 |
| – Gross Longs: | 19,490 | 25,610 | 2,557 |
| – Gross Shorts: | 12,161 | 34,483 | 1,013 |
| – Long to Short Ratio: | 1.6 to 1 | 0.7 to 1 | 2.5 to 1 |
| NET POSITION TREND: | |||
| – Strength Index Score (3 Year Range Pct): | 30.7 | 65.2 | 76.5 |
| – Strength Index Reading (3 Year Range): | Bearish | Bullish | Bullish |
| NET POSITION MOVEMENT INDEX: | |||
| – 6-Week Change in Strength Index: | -25.4 | 24.0 | 7.7 |
Bitcoin Futures:
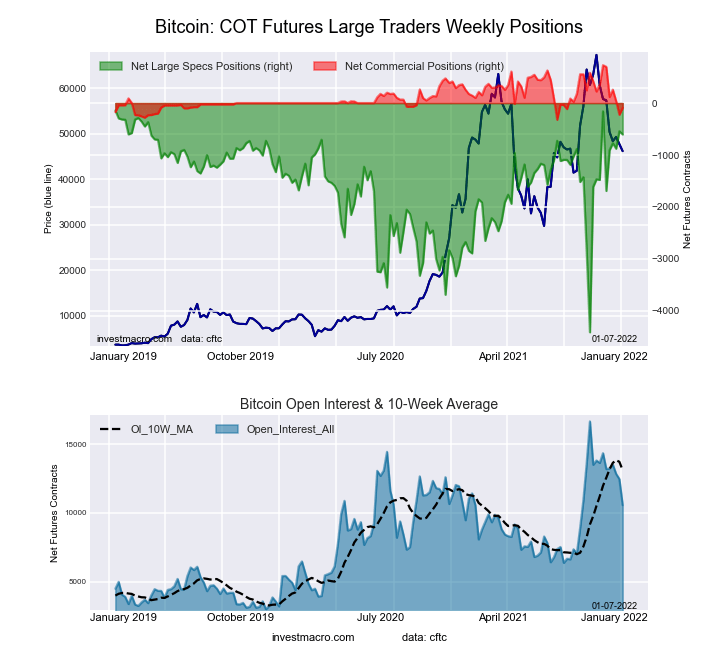 The Bitcoin large speculator standing this week was a net position of -604 contracts in the data reported through Tuesday. This was a weekly decline of -62 contracts from the previous week which had a total of -542 net contracts.
This week’s current strength score (the trader positioning range over the past three years, measured from 0 to 100) shows the speculators are currently Bullish-Extreme with a score of 89.2 percent. The commercials are Bearish with a score of 21.7 percent and the small traders (not shown in chart) are Bearish with a score of 28.8 percent.
| BITCOIN Statistics | SPECULATORS | COMMERCIALS | SMALL TRADERS |
| – Percent of Open Interest Longs: | 73.5 | 4.1 | 14.2 |
| – Percent of Open Interest Shorts: | 79.2 | 5.0 | 7.6 |
| – Net Position: | -604 | -93 | 697 |
| – Gross Longs: | 7,767 | 437 | 1,498 |
| – Gross Shorts: | 8,371 | 530 | 801 |
| – Long to Short Ratio: | 0.9 to 1 | 0.8 to 1 | 1.9 to 1 |
| NET POSITION TREND: | |||
| – Strength Index Score (3 Year Range Pct): | 89.2 | 21.7 | 28.8 |
| – Strength Index Reading (3 Year Range): | Bullish-Extreme | Bearish | Bearish |
| NET POSITION MOVEMENT INDEX: | |||
| – 6-Week Change in Strength Index: | -10.4 | -78.3 | 28.8 |
Article By InvestMacro – Receive our weekly COT Reports by Email
*COT Report: The COT data, released weekly to the public each Friday, is updated through the most recent Tuesday (data is 3 days old) and shows a quick view of how large speculators or non-commercials (for-profit traders) were positioned in the futures markets.
The CFTC categorizes trader positions according to commercial hedgers (traders who use futures contracts for hedging as part of the business), non-commercials (large traders who speculate to realize trading profits) and nonreportable traders (usually small traders/speculators) as well as their open interest (contracts open in the market at time of reporting).See CFTC criteria here.


