By InvestMacro | COT | Data Tables | COT Leaders | Downloads | COT Newsletter
Here are the latest charts and statistics for the Commitment of Traders (COT) data published by the Commodities Futures Trading Commission (CFTC).
The latest COT data is updated through Tuesday January 11th 2022 and shows a quick view of how large traders (for-profit speculators and commercial entities) were positioned in the futures markets. All currency positions are in direct relation to the US dollar where, for example, a bet for the euro is a bet that the euro will rise versus the dollar while a bet against the euro will be a bet that the euro will decline versus the dollar.
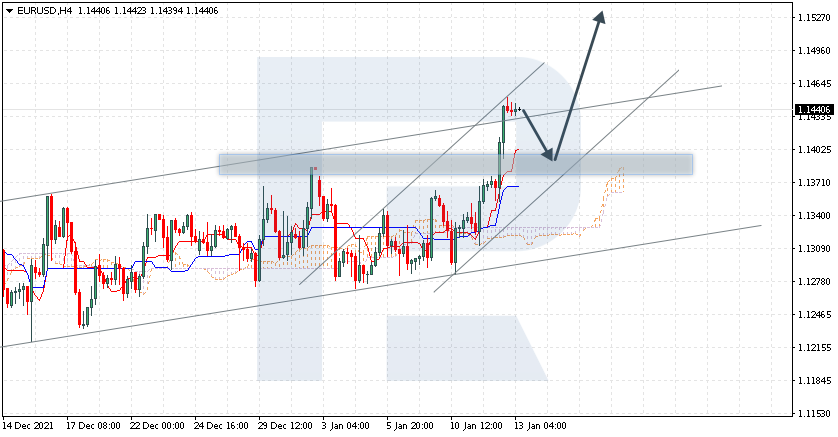
Highlighting the COT currency data is the bounce back into bullish territory for the Euro in the currency futures contracts. Euro speculators boosted their bets for a fourth consecutive week this week and brought the overall speculator position into its first bullish standing in the past nine weeks (the current net position is now +6,005 contracts). Euro bets had spent from March 2020 through September 2021 in bullish territory with the Euro price reaching as high as 1.2350 before faltering. Speculator bets dropped into bearish territory in October as the euro was in the middle of a downtrend that reached a low of approximately 1.12 on November 24th. Since then, the euro has climbed back above 1.14 and the speculator positions have tipped their toes back into bullish territory. Could a bullish trend change follow?
Joining the Euro (7,559 contracts) with positive changes this week were the Swiss franc (1,869 contracts), British pound sterling (10,005 contracts), New Zealand dollar (241 contracts), Canadian dollar (3,649 contracts), Russian ruble (2,288 contracts), Bitcoin (227 contracts) and the Mexican peso (5,039 contracts).
The currencies with declining bets were the US Dollar Index (-1,186 contracts), yen (-25,263 contracts), Australian dollar (-2,120 contracts) and the Brazil real (-9,736 contracts).
| Jan-11-2022 | OI | OI-Index | Spec-Net | Spec-Index | Com-Net | COM-Index | Smalls-Net | Smalls-Index |
|---|
| USD Index | 57,218 | 83 | 37,892 | 91 | -44,146 | 1 | 6,254 | 85 |
| EUR | 682,293 | 77 | 6,005 | 37 | -33,390 | 66 | 27,385 | 20 |
| GBP | 200,493 | 39 | -29,166 | 53 | 38,032 | 52 | -8,866 | 37 |
| JPY | 234,005 | 78 | -87,525 | 13 | 108,392 | 90 | -20,867 | 5 |
| CHF | 42,713 | 18 | -7,660 | 57 | 15,599 | 48 | -7,939 | 40 |
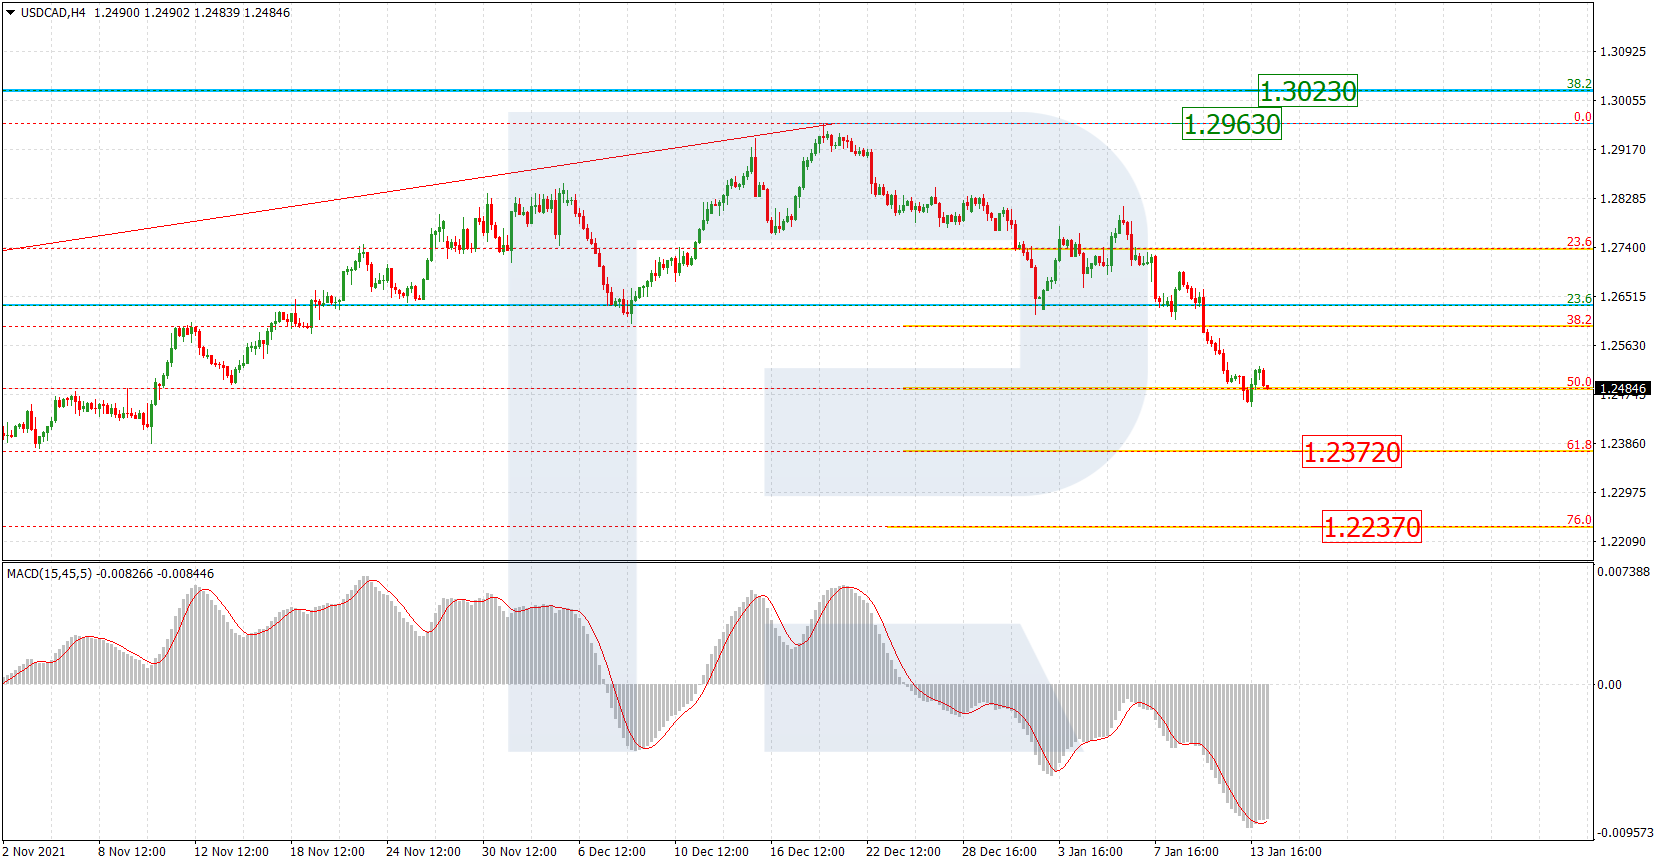
| CAD | 138,571 | 22 | -7,376 | 44 | 1,996 | 58 | 5,380 | 40 |
| AUD | 185,453 | 72 | -91,486 | 0 | 103,609 | 96 | -12,123 | 23 |
| NZD | 42,066 | 28 | -8,604 | 57 | 10,304 | 46 | -1,700 | 32 |
| MXN | 127,155 | 15 | -4,451 | 25 | 1,238 | 73 | 3,213 | 57 |
| RUB | 44,981 | 45 | 9,617 | 36 | -11,074 | 60 | 1,457 | 74 |
| BRL | 31,087 | 29 | -10,812 | 54 | 10,848 | 48 | -36 | 66 |
| Bitcoin | 10,855 | 58 | -377 | 95 | -182 | 0 | 559 | 26 |
US Dollar Index Futures:
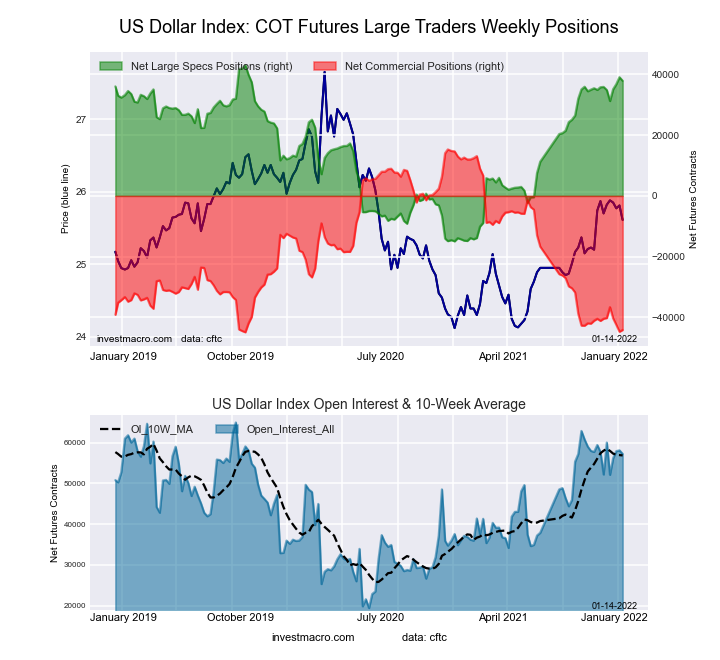 The US Dollar Index large speculator standing this week resulted in a net position of 37,892 contracts in the data reported through Tuesday. This was a weekly decrease of -1,186 contracts from the previous week which had a total of 39,078 net contracts.
This week’s current strength score (the trader positioning range over the past three years, measured from 0 to 100) shows the speculators are currently Bullish-Extreme with a score of 91.1 percent. The commercials are Bearish-Extreme with a score of 1.2 percent and the small traders (not shown in chart) are Bullish-Extreme with a score of 84.9 percent.
| US DOLLAR INDEX Statistics | SPECULATORS | COMMERCIALS | SMALL TRADERS |
| – Percent of Open Interest Longs: | 80.2 | 3.0 | 14.7 |
| – Percent of Open Interest Shorts: | 13.9 | 80.2 | 3.7 |
| – Net Position: | 37,892 | -44,146 | 6,254 |
| – Gross Longs: | 45,872 | 1,741 | 8,396 |
| – Gross Shorts: | 7,980 | 45,887 | 2,142 |
| – Long to Short Ratio: | 5.7 to 1 | 0.0 to 1 | 3.9 to 1 |
| NET POSITION TREND: | | | |
| – Strength Index Score (3 Year Range Pct): | 91.1 | 1.2 | 84.9 |
| – Strength Index Reading (3 Year Range): | Bullish-Extreme | Bearish-Extreme | Bullish-Extreme |
| NET POSITION MOVEMENT INDEX: | | | |
| – 6-Week Change in Strength Index: | 3.5 | -6.2 | 18.5 |
Euro Currency Futures:
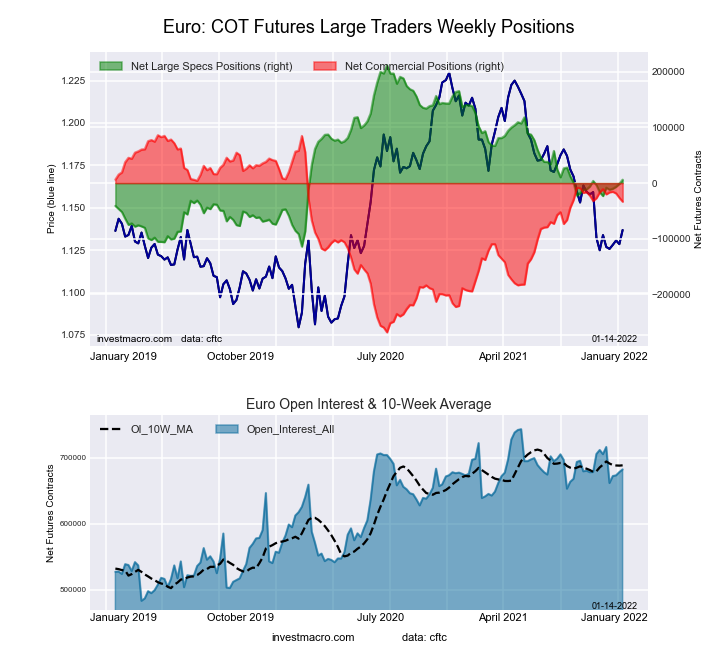 The Euro Currency large speculator standing this week resulted in a net position of 6,005 contracts in the data reported through Tuesday. This was a weekly gain of 7,559 contracts from the previous week which had a total of -1,554 net contracts.
This week’s current strength score (the trader positioning range over the past three years, measured from 0 to 100) shows the speculators are currently Bearish with a score of 36.8 percent. The commercials are Bullish with a score of 66.3 percent and the small traders (not shown in chart) are Bearish-Extreme with a score of 19.8 percent.
| EURO Currency Statistics | SPECULATORS | COMMERCIALS | SMALL TRADERS |
| – Percent of Open Interest Longs: | 30.0 | 57.0 | 11.7 |
| – Percent of Open Interest Shorts: | 29.1 | 61.9 | 7.7 |
| – Net Position: | 6,005 | -33,390 | 27,385 |
| – Gross Longs: | 204,361 | 389,191 | 79,993 |
| – Gross Shorts: | 198,356 | 422,581 | 52,608 |
| – Long to Short Ratio: | 1.0 to 1 | 0.9 to 1 | 1.5 to 1 |
| NET POSITION TREND: | | | |
| – Strength Index Score (3 Year Range Pct): | 36.8 | 66.3 | 19.8 |
| – Strength Index Reading (3 Year Range): | Bearish | Bullish | Bearish-Extreme |
| NET POSITION MOVEMENT INDEX: | | | |
| – 6-Week Change in Strength Index: | 9.0 | -6.4 | -11.1 |
British Pound Sterling Futures:
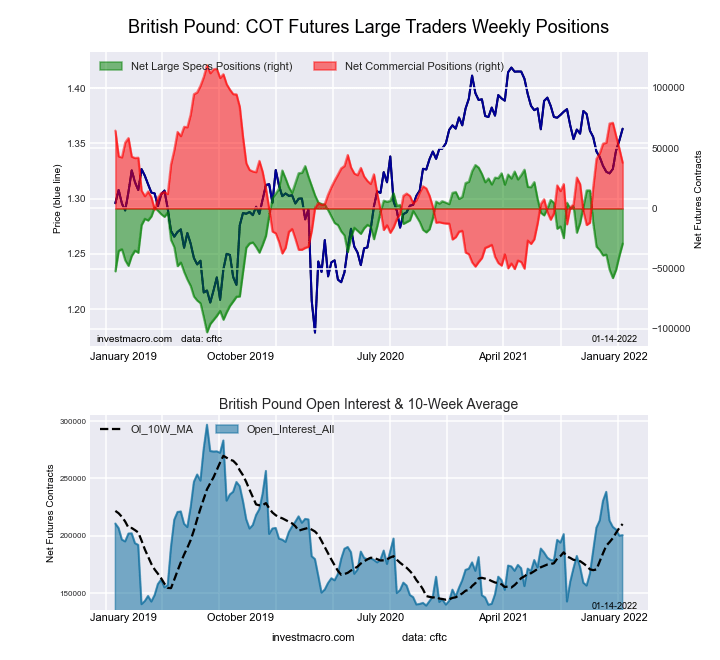 The British Pound Sterling large speculator standing this week resulted in a net position of -29,166 contracts in the data reported through Tuesday. This was a weekly rise of 10,005 contracts from the previous week which had a total of -39,171 net contracts.
This week’s current strength score (the trader positioning range over the past three years, measured from 0 to 100) shows the speculators are currently Bullish with a score of 53.0 percent. The commercials are Bullish with a score of 52.2 percent and the small traders (not shown in chart) are Bearish with a score of 37.3 percent.
| BRITISH POUND Statistics | SPECULATORS | COMMERCIALS | SMALL TRADERS |
| – Percent of Open Interest Longs: | 15.2 | 72.1 | 11.4 |
| – Percent of Open Interest Shorts: | 29.8 | 53.1 | 15.8 |
| – Net Position: | -29,166 | 38,032 | -8,866 |
| – Gross Longs: | 30,506 | 144,550 | 22,846 |
| – Gross Shorts: | 59,672 | 106,518 | 31,712 |
| – Long to Short Ratio: | 0.5 to 1 | 1.4 to 1 | 0.7 to 1 |
| NET POSITION TREND: | | | |
| – Strength Index Score (3 Year Range Pct): | 53.0 | 52.2 | 37.3 |
| – Strength Index Reading (3 Year Range): | Bullish | Bullish | Bearish |
| NET POSITION MOVEMENT INDEX: | | | |
| – 6-Week Change in Strength Index: | 7.0 | -9.3 | 12.4 |
Japanese Yen Futures:
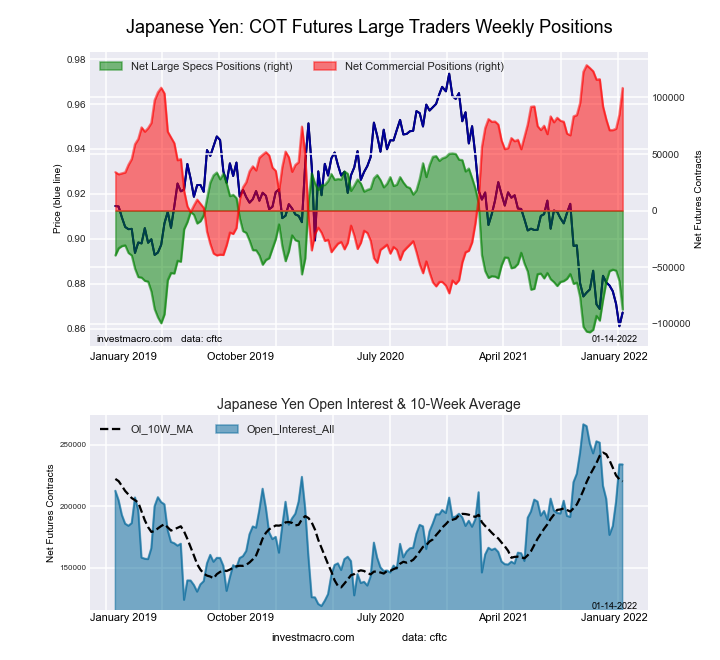 The Japanese Yen large speculator standing this week resulted in a net position of -87,525 contracts in the data reported through Tuesday. This was a weekly fall of -25,263 contracts from the previous week which had a total of -62,262 net contracts.
This week’s current strength score (the trader positioning range over the past three years, measured from 0 to 100) shows the speculators are currently Bearish-Extreme with a score of 12.7 percent. The commercials are Bullish-Extreme with a score of 90.0 percent and the small traders (not shown in chart) are Bearish-Extreme with a score of 4.6 percent.
| JAPANESE YEN Statistics | SPECULATORS | COMMERCIALS | SMALL TRADERS |
| – Percent of Open Interest Longs: | 9.6 | 81.1 | 7.5 |
| – Percent of Open Interest Shorts: | 47.0 | 34.7 | 16.5 |
| – Net Position: | -87,525 | 108,392 | -20,867 |
| – Gross Longs: | 22,364 | 189,708 | 17,631 |
| – Gross Shorts: | 109,889 | 81,316 | 38,498 |
| – Long to Short Ratio: | 0.2 to 1 | 2.3 to 1 | 0.5 to 1 |
| NET POSITION TREND: | | | |
| – Strength Index Score (3 Year Range Pct): | 12.7 | 90.0 | 4.6 |
| – Strength Index Reading (3 Year Range): | Bearish-Extreme | Bullish-Extreme | Bearish-Extreme |
| NET POSITION MOVEMENT INDEX: | | | |
| – 6-Week Change in Strength Index: | -5.5 | 8.1 | -16.8 |
Swiss Franc Futures:
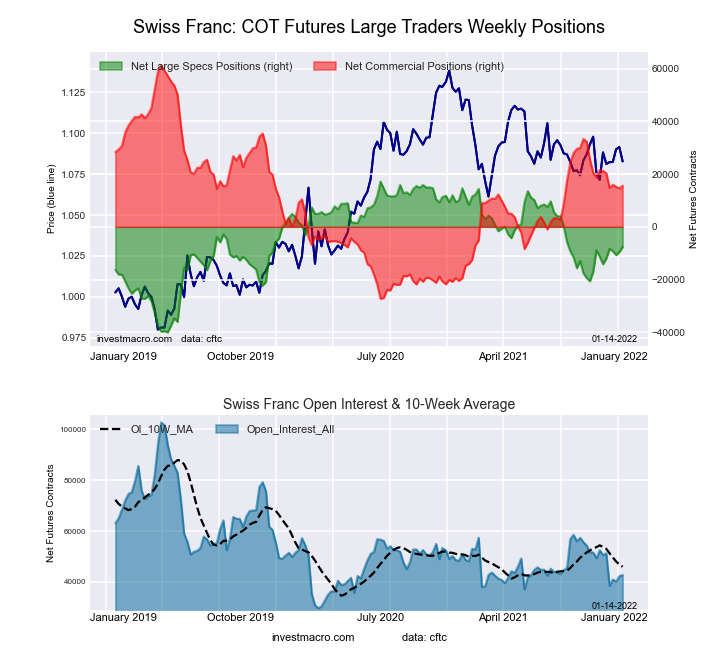 The Swiss Franc large speculator standing this week resulted in a net position of -7,660 contracts in the data reported through Tuesday. This was a weekly rise of 1,869 contracts from the previous week which had a total of -9,529 net contracts.
This week’s current strength score (the trader positioning range over the past three years, measured from 0 to 100) shows the speculators are currently Bullish with a score of 56.6 percent. The commercials are Bearish with a score of 48.4 percent and the small traders (not shown in chart) are Bearish with a score of 40.0 percent.
| SWISS FRANC Statistics | SPECULATORS | COMMERCIALS | SMALL TRADERS |
| – Percent of Open Interest Longs: | 10.7 | 65.3 | 23.7 |
| – Percent of Open Interest Shorts: | 28.6 | 28.8 | 42.3 |
| – Net Position: | -7,660 | 15,599 | -7,939 |
| – Gross Longs: | 4,571 | 27,897 | 10,124 |
| – Gross Shorts: | 12,231 | 12,298 | 18,063 |
| – Long to Short Ratio: | 0.4 to 1 | 2.3 to 1 | 0.6 to 1 |
| NET POSITION TREND: | | | |
| – Strength Index Score (3 Year Range Pct): | 56.6 | 48.4 | 40.0 |
| – Strength Index Reading (3 Year Range): | Bullish | Bearish | Bearish |
| NET POSITION MOVEMENT INDEX: | | | |
| – 6-Week Change in Strength Index: | 11.4 | -6.3 | -2.8 |
Canadian Dollar Futures:
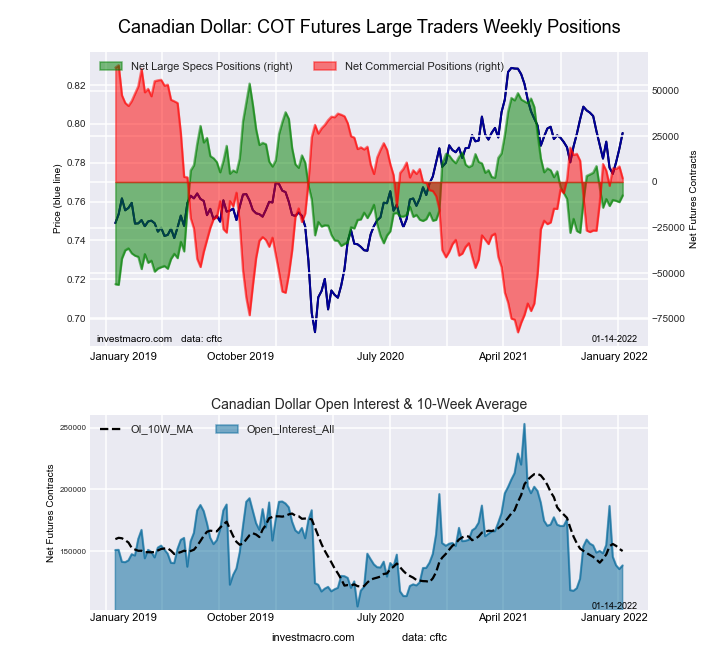 The Canadian Dollar large speculator standing this week resulted in a net position of -7,376 contracts in the data reported through Tuesday. This was a weekly gain of 3,649 contracts from the previous week which had a total of -11,025 net contracts.
This week’s current strength score (the trader positioning range over the past three years, measured from 0 to 100) shows the speculators are currently Bearish with a score of 44.4 percent. The commercials are Bullish with a score of 57.6 percent and the small traders (not shown in chart) are Bearish with a score of 40.5 percent.
| CANADIAN DOLLAR Statistics | SPECULATORS | COMMERCIALS | SMALL TRADERS |
| – Percent of Open Interest Longs: | 32.0 | 43.0 | 22.2 |
| – Percent of Open Interest Shorts: | 37.3 | 41.5 | 18.3 |
| – Net Position: | -7,376 | 1,996 | 5,380 |
| – Gross Longs: | 44,284 | 59,569 | 30,707 |
| – Gross Shorts: | 51,660 | 57,573 | 25,327 |
| – Long to Short Ratio: | 0.9 to 1 | 1.0 to 1 | 1.2 to 1 |
| NET POSITION TREND: | | | |
| – Strength Index Score (3 Year Range Pct): | 44.4 | 57.6 | 40.5 |
| – Strength Index Reading (3 Year Range): | Bearish | Bullish | Bearish |
| NET POSITION MOVEMENT INDEX: | | | |
| – 6-Week Change in Strength Index: | 6.1 | -5.4 | 2.3 |
Australian Dollar Futures:
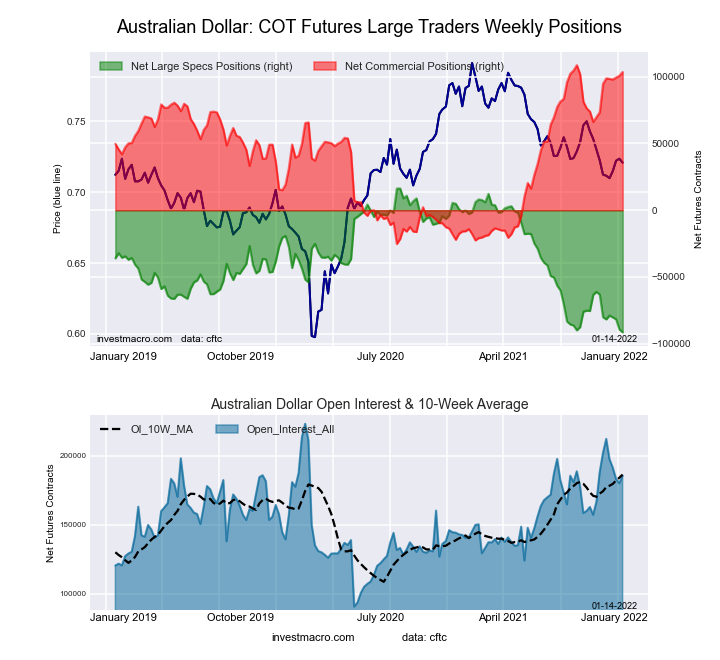 The Australian Dollar large speculator standing this week resulted in a net position of -91,486 contracts in the data reported through Tuesday. This was a weekly fall of -2,120 contracts from the previous week which had a total of -89,366 net contracts.
This week’s current strength score (the trader positioning range over the past three years, measured from 0 to 100) shows the speculators are currently Bearish-Extreme with a score of 0.0 percent. The commercials are Bullish-Extreme with a score of 96.2 percent and the small traders (not shown in chart) are Bearish with a score of 22.9 percent.
| AUSTRALIAN DOLLAR Statistics | SPECULATORS | COMMERCIALS | SMALL TRADERS |
| – Percent of Open Interest Longs: | 6.7 | 81.1 | 9.9 |
| – Percent of Open Interest Shorts: | 56.0 | 25.2 | 16.5 |
| – Net Position: | -91,486 | 103,609 | -12,123 |
| – Gross Longs: | 12,383 | 150,375 | 18,406 |
| – Gross Shorts: | 103,869 | 46,766 | 30,529 |
| – Long to Short Ratio: | 0.1 to 1 | 3.2 to 1 | 0.6 to 1 |
| NET POSITION TREND: | | | |
| – Strength Index Score (3 Year Range Pct): | 0.0 | 96.2 | 22.9 |
| – Strength Index Reading (3 Year Range): | Bearish-Extreme | Bullish-Extreme | Bearish |
| NET POSITION MOVEMENT INDEX: | | | |
| – 6-Week Change in Strength Index: | -10.5 | 6.6 | 5.9 |
New Zealand Dollar Futures:
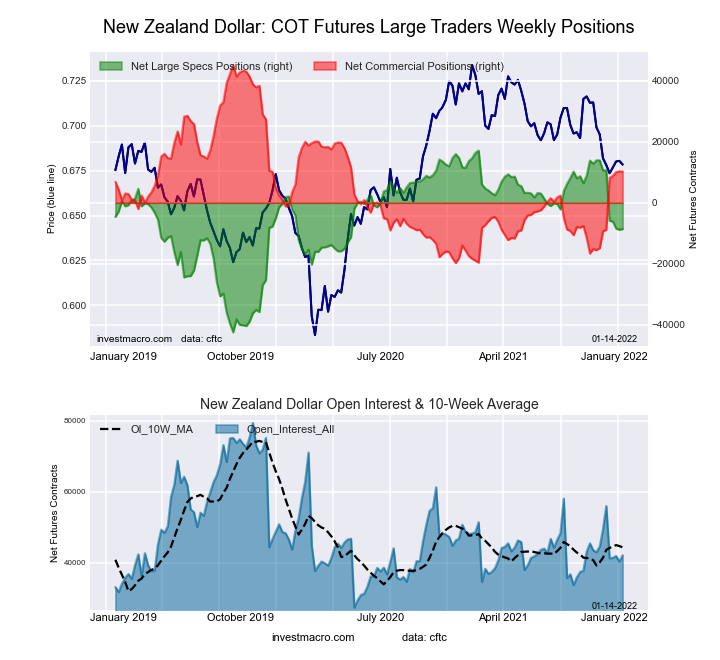 The New Zealand Dollar large speculator standing this week resulted in a net position of -8,604 contracts in the data reported through Tuesday. This was a weekly increase of 241 contracts from the previous week which had a total of -8,845 net contracts.
This week’s current strength score (the trader positioning range over the past three years, measured from 0 to 100) shows the speculators are currently Bullish with a score of 56.8 percent. The commercials are Bearish with a score of 46.3 percent and the small traders (not shown in chart) are Bearish with a score of 32.4 percent.
| NEW ZEALAND DOLLAR Statistics | SPECULATORS | COMMERCIALS | SMALL TRADERS |
| – Percent of Open Interest Longs: | 26.1 | 65.7 | 7.1 |
| – Percent of Open Interest Shorts: | 46.5 | 41.2 | 11.1 |
| – Net Position: | -8,604 | 10,304 | -1,700 |
| – Gross Longs: | 10,960 | 27,650 | 2,979 |
| – Gross Shorts: | 19,564 | 17,346 | 4,679 |
| – Long to Short Ratio: | 0.6 to 1 | 1.6 to 1 | 0.6 to 1 |
| NET POSITION TREND: | | | |
| – Strength Index Score (3 Year Range Pct): | 56.8 | 46.3 | 32.4 |
| – Strength Index Reading (3 Year Range): | Bullish | Bearish | Bearish |
| NET POSITION MOVEMENT INDEX: | | | |
| – 6-Week Change in Strength Index: | -32.3 | 30.2 | -4.3 |
Mexican Peso Futures:
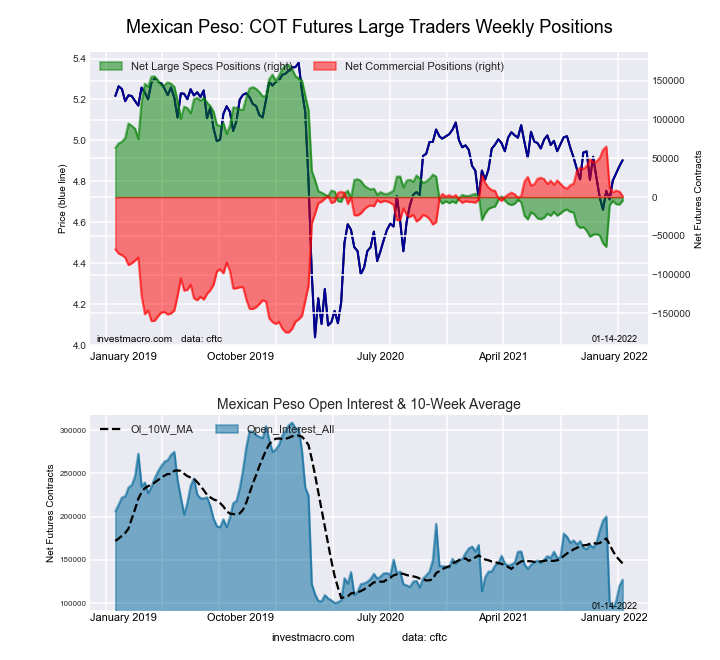 The Mexican Peso large speculator standing this week resulted in a net position of -4,451 contracts in the data reported through Tuesday. This was a weekly increase of 5,039 contracts from the previous week which had a total of -9,490 net contracts.
This week’s current strength score (the trader positioning range over the past three years, measured from 0 to 100) shows the speculators are currently Bearish with a score of 25.4 percent. The commercials are Bullish with a score of 73.3 percent and the small traders (not shown in chart) are Bullish with a score of 56.6 percent.
| MEXICAN PESO Statistics | SPECULATORS | COMMERCIALS | SMALL TRADERS |
| – Percent of Open Interest Longs: | 41.8 | 52.8 | 5.0 |
| – Percent of Open Interest Shorts: | 45.3 | 51.9 | 2.4 |
| – Net Position: | -4,451 | 1,238 | 3,213 |
| – Gross Longs: | 53,194 | 67,173 | 6,301 |
| – Gross Shorts: | 57,645 | 65,935 | 3,088 |
| – Long to Short Ratio: | 0.9 to 1 | 1.0 to 1 | 2.0 to 1 |
| NET POSITION TREND: | | | |
| – Strength Index Score (3 Year Range Pct): | 25.4 | 73.3 | 56.6 |
| – Strength Index Reading (3 Year Range): | Bearish | Bullish | Bullish |
| NET POSITION MOVEMENT INDEX: | | | |
| – 6-Week Change in Strength Index: | 23.6 | -25.0 | 19.4 |
Brazilian Real Futures:
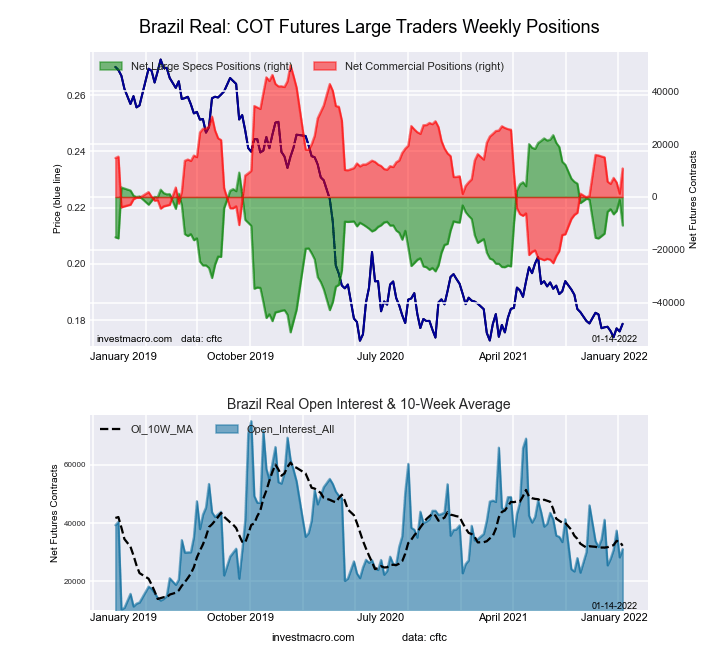 The Brazilian Real large speculator standing this week resulted in a net position of -10,812 contracts in the data reported through Tuesday. This was a weekly decrease of -9,736 contracts from the previous week which had a total of -1,076 net contracts.
This week’s current strength score (the trader positioning range over the past three years, measured from 0 to 100) shows the speculators are currently Bullish with a score of 54.2 percent. The commercials are Bearish with a score of 47.9 percent and the small traders (not shown in chart) are Bullish with a score of 66.4 percent.
| BRAZIL REAL Statistics | SPECULATORS | COMMERCIALS | SMALL TRADERS |
| – Percent of Open Interest Longs: | 23.5 | 66.9 | 8.8 |
| – Percent of Open Interest Shorts: | 58.3 | 32.0 | 8.9 |
| – Net Position: | -10,812 | 10,848 | -36 |
| – Gross Longs: | 7,312 | 20,801 | 2,721 |
| – Gross Shorts: | 18,124 | 9,953 | 2,757 |
| – Long to Short Ratio: | 0.4 to 1 | 2.1 to 1 | 1.0 to 1 |
| NET POSITION TREND: | | | |
| – Strength Index Score (3 Year Range Pct): | 54.2 | 47.9 | 66.4 |
| – Strength Index Reading (3 Year Range): | Bullish | Bearish | Bullish |
| NET POSITION MOVEMENT INDEX: | | | |
| – 6-Week Change in Strength Index: | 4.1 | -5.6 | 14.4 |
Russian Ruble Futures:
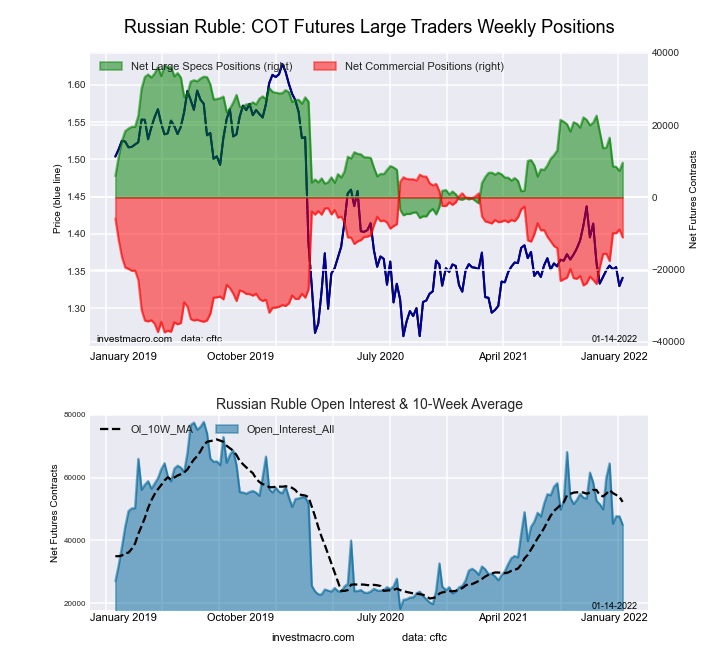 The Russian Ruble large speculator standing this week resulted in a net position of 9,617 contracts in the data reported through Tuesday. This was a weekly gain of 2,288 contracts from the previous week which had a total of 7,329 net contracts.
This week’s current strength score (the trader positioning range over the past three years, measured from 0 to 100) shows the speculators are currently Bearish with a score of 36.2 percent. The commercials are Bullish with a score of 60.2 percent and the small traders (not shown in chart) are Bullish with a score of 74.1 percent.
| RUSSIAN RUBLE Statistics | SPECULATORS | COMMERCIALS | SMALL TRADERS |
| – Percent of Open Interest Longs: | 42.7 | 52.0 | 5.2 |
| – Percent of Open Interest Shorts: | 21.3 | 76.6 | 2.0 |
| – Net Position: | 9,617 | -11,074 | 1,457 |
| – Gross Longs: | 19,191 | 23,402 | 2,357 |
| – Gross Shorts: | 9,574 | 34,476 | 900 |
| – Long to Short Ratio: | 2.0 to 1 | 0.7 to 1 | 2.6 to 1 |
| NET POSITION TREND: | | | |
| – Strength Index Score (3 Year Range Pct): | 36.2 | 60.2 | 74.1 |
| – Strength Index Reading (3 Year Range): | Bearish | Bullish | Bullish |
| NET POSITION MOVEMENT INDEX: | | | |
| – 6-Week Change in Strength Index: | -9.5 | 10.4 | -14.6 |
Bitcoin Futures:
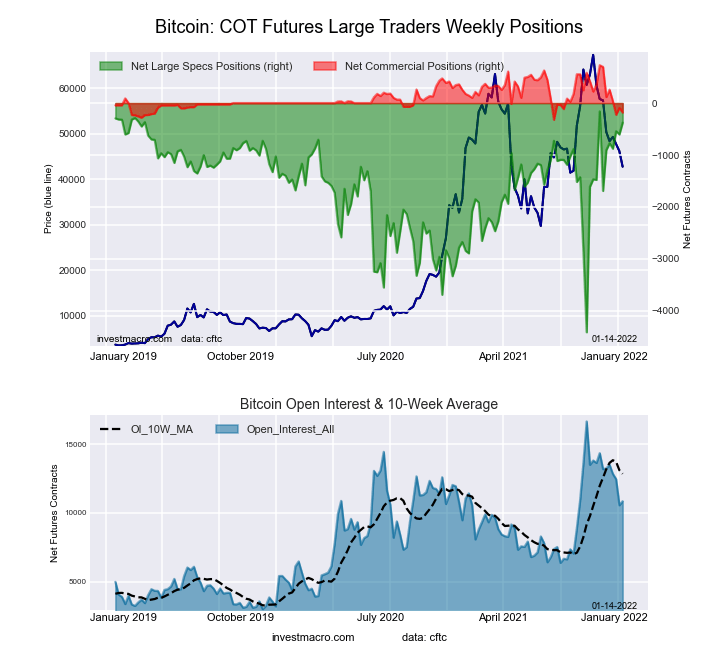 The Bitcoin large speculator standing this week resulted in a net position of -377 contracts in the data reported through Tuesday. This was a weekly boost of 227 contracts from the previous week which had a total of -604 net contracts.
This week’s current strength score (the trader positioning range over the past three years, measured from 0 to 100) shows the speculators are currently Bullish-Extreme with a score of 94.9 percent. The commercials are Bearish-Extreme with a score of 13.2 percent and the small traders (not shown in chart) are Bearish with a score of 25.6 percent.
| BITCOIN Statistics | SPECULATORS | COMMERCIALS | SMALL TRADERS |
| – Percent of Open Interest Longs: | 73.9 | 3.2 | 13.3 |
| – Percent of Open Interest Shorts: | 77.4 | 4.9 | 8.1 |
| – Net Position: | -377 | -182 | 559 |
| – Gross Longs: | 8,025 | 347 | 1,441 |
| – Gross Shorts: | 8,402 | 529 | 882 |
| – Long to Short Ratio: | 1.0 to 1 | 0.7 to 1 | 1.6 to 1 |
| NET POSITION TREND: | | | |
| – Strength Index Score (3 Year Range Pct): | 94.9 | 13.2 | 25.6 |
| – Strength Index Reading (3 Year Range): | Bullish-Extreme | Bearish-Extreme | Bearish |
| NET POSITION MOVEMENT INDEX: | | | |
| – 6-Week Change in Strength Index: | 30.9 | -83.7 | -9.9 |
Article By InvestMacro – Receive our weekly COT Reports by Email
*COT Report: The COT data, released weekly to the public each Friday, is updated through the most recent Tuesday (data is 3 days old) and shows a quick view of how large speculators or non-commercials (for-profit traders) were positioned in the futures markets.
The CFTC categorizes trader positions according to commercial hedgers (traders who use futures contracts for hedging as part of the business), non-commercials (large traders who speculate to realize trading profits) and nonreportable traders (usually small traders/speculators) as well as their open interest (contracts open in the market at time of reporting).See CFTC criteria here.


