Archive for Forex and Currency News – Page 181

GBPJPY Impulse Or Ending Diagonal?

By Orbex

GBPJPY

The GBPJPY currency pair is most likely moving within the cycle impulse, with wave III under development.

We can assume that the correction wave ④ of the primary degree ended at the end of December. This correction took the form of an intermediate triple zigzag.

Since then, we have observed a rise in the price in the primary wave ⑤. In turn, this takes the form of an intermediate 5-wave impulse (1)-(2)-(3)-(4)-(5).

The entire primary wave ⑤ can complete its pattern near 163.52. At that level, it will be at 61.8% of wave ③.
GBPJPY

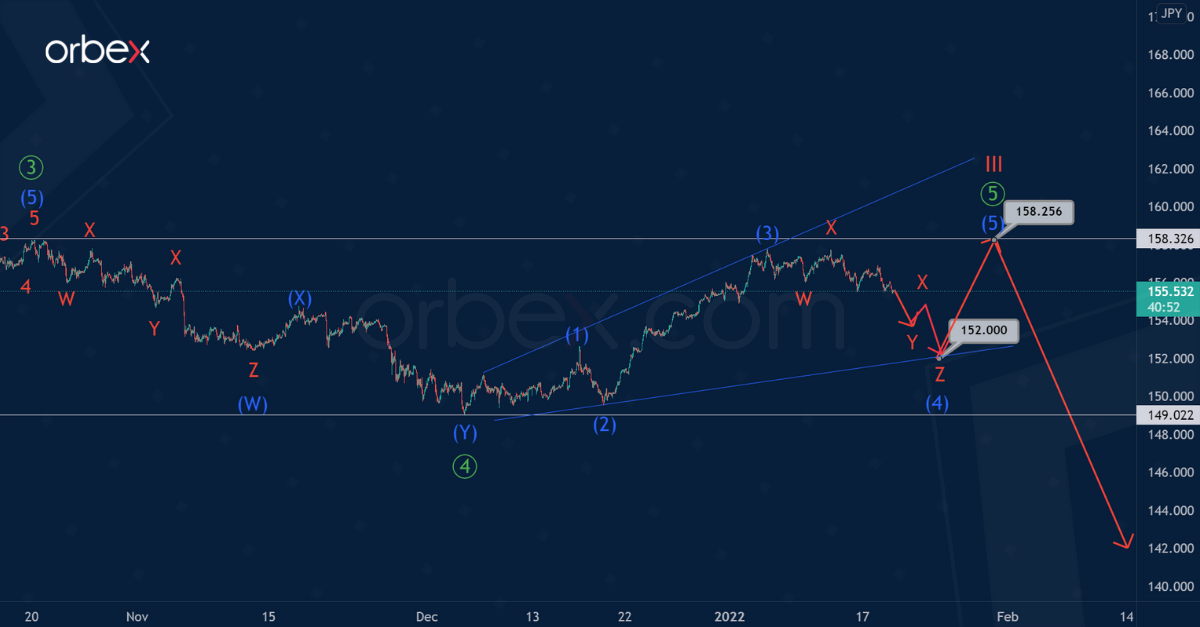
Alternatively, the primary wave ⑤ is not an impulse, but an ending diagonal in which an intermediate correction wave (4) is under construction.

Perhaps wave (4) will be a triple W-X-Y-X-Z zigzag of the minor degree, as shown in the chart. In the near future, prices could lower in the minor sub-waves Y-X-Z to the level of 152.00.

After reaching the specified price level, the price is likely to increase within the final intermediate wave (5) to the previous maximum of 158.25.


Orbex-LogoArticle by Orbex

Orbex is a fully licensed broker that was established in 2011. Founded with a mission to serve its traders responsibly and provides traders with access to the world’s largest and most liquid financial markets. www.orbex.com

Murrey Math Lines 19.01.2022 (USDJPY, USDCAD)

Article By RoboForex.com

USDJPY, “US Dollar vs. Japanese Yen”

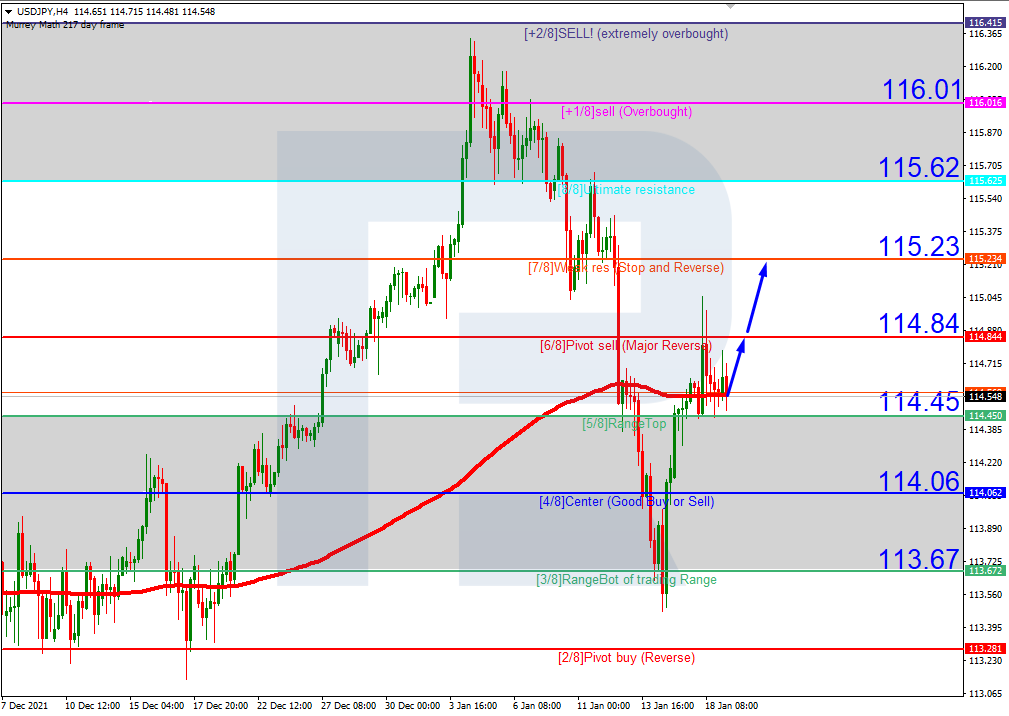
As we can see in the H4 chart, after breaking the 200-day Moving Average, USDJPY is trading above it, thus indicating a possible ascending tendency. In this case, the price is expected to test 6/8, break it, and then continue growing to reach the resistance at 7/8. However, this scenario may no longer be valid if the price breaks 5/8 to the downside. After that, the instrument may reverse and fall towards the support at 3/8.

USDJPYH4
Risk Warning: the result of previous trading operations do not guarantee the same results in the future

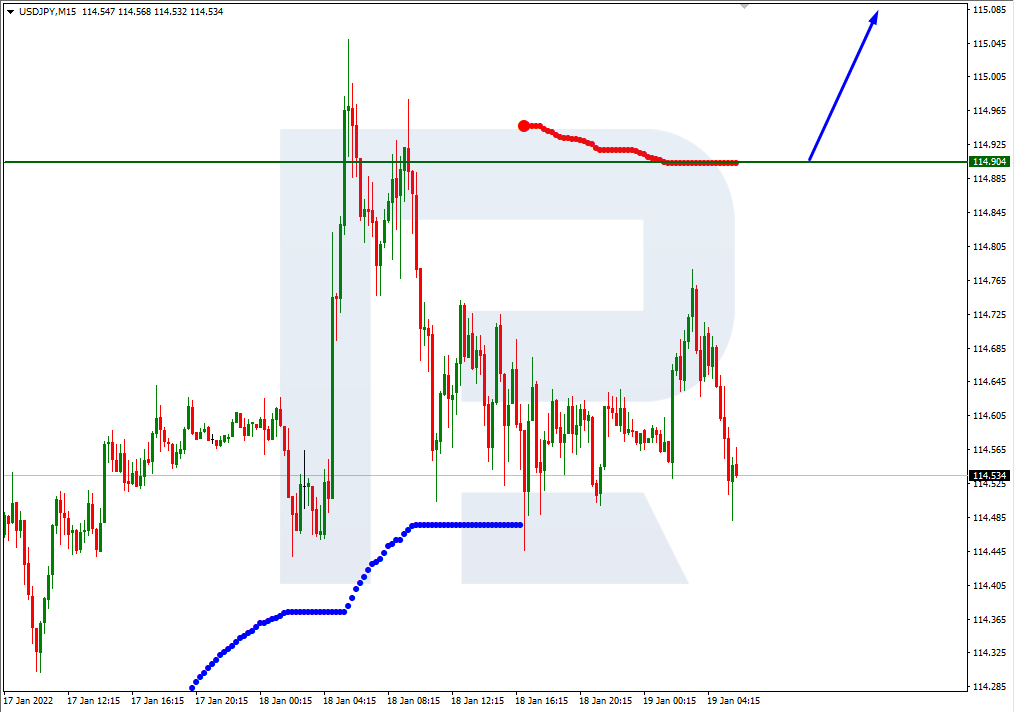
In the M15 chart, the pair may break the upside line of the VoltyChannel indicator and, as a result, continue growing.

USDJPY_M15
Risk Warning: the result of previous trading operations do not guarantee the same results in the future

USDCAD, “US Dollar vs Canadian Dollar”

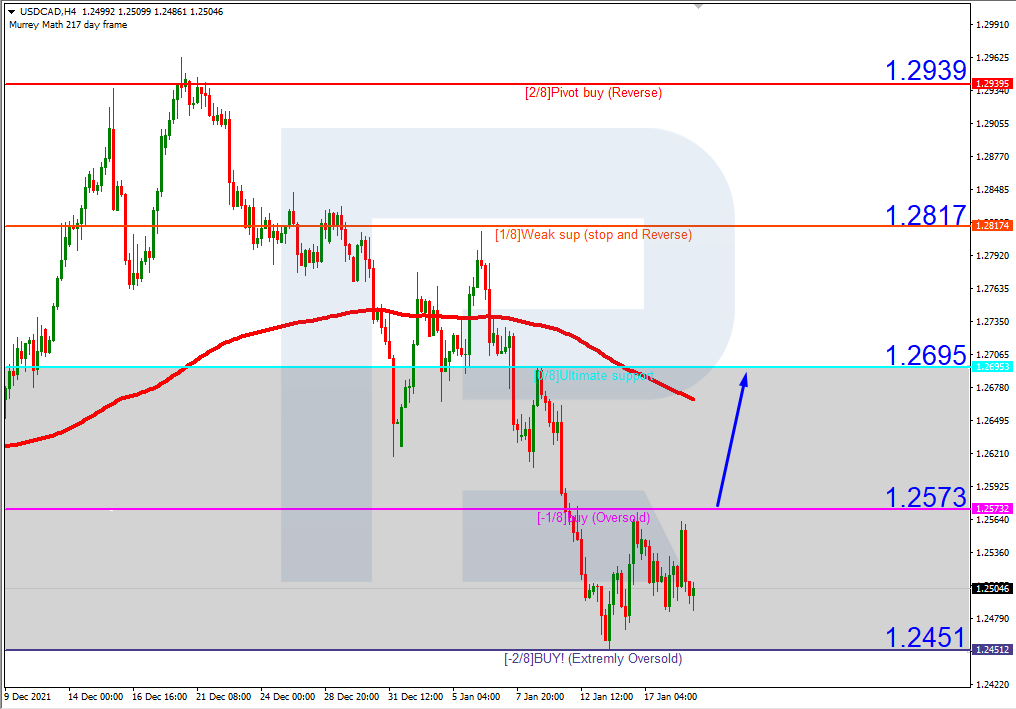
As we can see in the H4 chart, USDCAD is trading within the “oversold area”. In this case, the price is expected to test -1/8, break it, and continue growing towards the resistance at 0/8. Still, this scenario may no longer be valid if the price breaks the support at -2/8 to the downside. After that, the lines in the chart will be redrawn, thus helping us to define new downside targets.

USDCAD_H4
Risk Warning: the result of previous trading operations do not guarantee the same results in the future

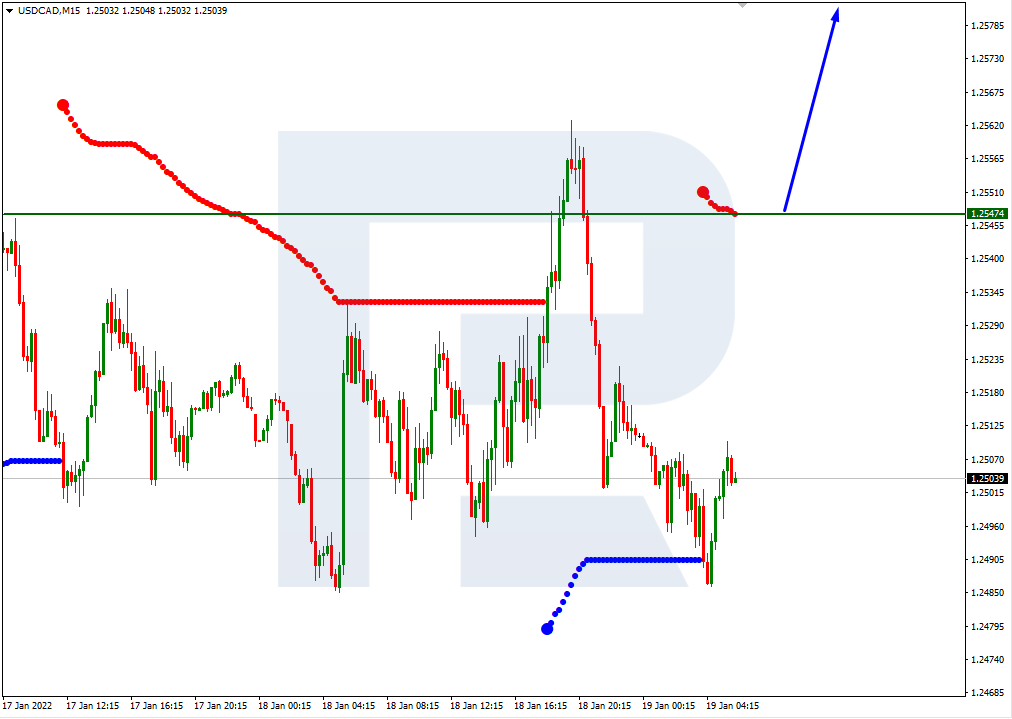
In the M15 chart, the pair may break the upside line of the VoltyChannel indicator and, as a result, continue trading downwards to reach 0/8 in the H4 chart.

USDCAD_M15

Article By RoboForex.com

Attention!
Forecasts presented in this section only reflect the author’s private opinion and should not be considered as guidance for trading. RoboForex LP bears no responsibility for trading results based on trading recommendations described in these analytical reviews.

Intraday Market Analysis – GBP Seeks Support

By Orbex

GBPUSD falls into correction

GBPUSD

The sterling fell back after a slowdown in Britain’s wage growth in November. Sentiment favors the pound after it rallied above the daily resistance at 1.3700.

However, an overbought RSI has cut back buyers’ appetite. A break below 1.3630 has prompted some traders to take profit, driving down the price.

As the RSI dips into the oversold zone, 1.3570 is the next support. A bearish breakout would send the pair to 1.3480 which sits on the 30-day moving average. 1.3660 is the immediate resistance when a rebound takes shape.

USDJPY struggles to bounce

USDJPY

The yen softened after the Bank of Japan signaled no shift in its ultra-loose monetary policy. The US dollar bounced off the critical floor at 113.50 from the daily chart.

A bullish RSI divergence revealed a deceleration in the downward impetus. The indicator’s oversold situation also attracted a number of bargain hunters.

A break above 114.70 suggests a strong interest in keeping the correction in check. 115.50 from the latest sell-off is a major hurdle and its breach could extend the rally to the recent peak at 116.30.

SPX 500 to test daily support

SPX 500

The S&P 500 extended losses over rising rate worries. The fall below 4640 invalidates the latest rebound and indicates that sentiment is still downbeat.

Below the psychological level of 4600, 4540 is a key support near last December’s lows on the daily chart. A bearish breakout would trigger a deeper correction towards 4400, the origin of the October rally.

An oversold RSI may cause a limited rebound. Nonetheless, the bulls need to clear offers around 4675 and then 4745 to gain momentum.


Orbex-LogoArticle by Orbex

Orbex is a fully licensed broker that was established in 2011. Founded with a mission to serve its traders responsibly and provides traders with access to the world’s largest and most liquid financial markets. www.orbex.com

The Analytical Overview of the Main Currency Pairs on 2022.01.19

by JustForex

The EUR/USD currency pair

Technical indicators of the currency pair:
  • Prev Open: 1.1406
  • Prev Close: 1.1327
  • % chg. over the last day: -0.70%

According to data from the ZEW Institute, economic sentiment in Germany and the Eurozone has improved significantly over the past month. At the same time, inflation expectations have declined. More than half of analysts expect inflation to decline in the region over the next six months. With a high probability, the ECB will not change its monetary policy before the end of the year, so the euro has no fundamental support, unlike the dollar index, where the US Federal Reserve will hike rates soon.

Trading recommendations
  • Support levels: 1.1320, 1.1305, 1.1288
  • Resistance levels: 1.1356, 1.1384, 1.1405

From a technical point of view, the EUR/USD on the hour time frame has changed to bearish. The price broke through the priority change level and consolidated lower. The MACD indicator became negative, with no signs of a reversal. Under such market conditions, it is better to consider sell trades from the resistance levels near the moving average, as the price has deviated strongly from the average values. Buy trades can be considered on the lower time frames from the support level of 1.1320 or 1.1305, but only with additional confirmation in the form of a buyers’ initiative.

Alternative scenario: if the price breaks out through the 1.1405 resistance level and fixes above, the mid-term uptrend will be renewed.

EUR/USD
News feed for 2022.01.19:
  • – German Consumer Price Index (m/m) at 09:00 (GMT+2);
  • – US Building Permits (m/m) at 15:30 (GMT+2).

The GBP/USD currency pair

Technical indicators of the currency pair:
  • Prev Open: 1.3642
  • Prev Close: 1.3597
  • % chg. over the last day: -0.33%

Labor market statistics showed that the UK was facing wage cuts. At the same time, the unemployment rate fell from 4.2% to 4.1%. Inflation data will be released today. Analysts expect inflation in December to rise to its highest level in a decade. The Bank of England has warned that inflation could peak close to 6% in April, up from the current level of 5.1%. Rising inflation will further increase the probability of an interest rate hike at the next Bank of England meeting.

Trading recommendations
  • Support levels: 1.3581, 1.3551, 1.3479
  • Resistance levels: 1.3620, 1.3661, 1.3689, 1.3715

On the hourly time frame, the GBP/USD trend has changed to bearish. The price broke through the priority change level and consolidated lower. The MACD indicator became negative, with no signs of a reversal. Under such market conditions, sell deals are best to look at from the resistance level of 1.3620 or 1.3661. Buy trades should be considered from the support level of 1.3580, but only with additional confirmation in the form of buyers’ initiative.

Alternative scenario: if the price breaks out through the 1.3661 resistance level and consolidates above, the bearish scenario will be broken.

GBP/USD
News feed for 2022.01.19:
  • – UK Consumer Price Index (m/m) at 09:00 (GMT+2);
  • – UK BoE Gov Bailey Speaks at 16:15 (GMT+2).

The USD/JPY currency pair

Technical indicators of the currency pair:
  • Prev Open: 114.59
  • Prev Close: 114.58
  • % chg. over the last day: -0.01%

Prime Minister Kishida intends to declare a state of emergency in certain regions of Japan from January 21 to February 13. This is likely to lead to a slowdown in economic activity. But the Japanese Yen is strengthening now due to investors returning to safe-haven currencies as traders start to fear another hawkish surprise from the Federal Reserve, which is expected to meet next week.

Trading recommendations
  • Support levels: 114.25, 113.99, 113.72
  • Resistance levels: 114.63, 115.04, 115.35, 115.64

The global trend on the USD/JPY currency pair is bearish. The sellers managed to protect the priority change level. Buy deals are best to look at the lower time frames from the nearest support levels. Sell trades can be considered from the resistance level of 114.63, but only with confirmation in the form of a sellers’ initiative, as the monetary policy of the Bank of Japan is now aimed at decreasing the Japanese yen.

Alternative scenario: if the price fixes above 115.04, the uptrend will likely resume.

USD/JPY
There is no news feed for today.

The USD/CAD currency pair

Technical indicators of the currency pair:
  • Prev Open: 1.2514
  • Prev Close: 1.2511
  • % chg. over the last day: -0.02%

The Canadian dollar is a commodity currency, so it depends not only on the monetary policy of the Bank of Canada but also on the oil prices and the dollar index. The price of Brent oil reached $88 per barrel for the first time since October 2014. Analysts point out that the demand for oil in the last three months was higher than previously expected. The fundamental situation is now in favor of the growth of oil prices. Therefore, with the Bank of Canada also set to hike rates, the Canadian dollar will be strong.

Trading recommendations
  • Support levels: 1.2490, 1.2427
  • Resistance levels: 1.2558, 1.2628, 1.2678, 1.2715

From a technical point of view, the USD/CAD currency pair is bearish. The price is now trading in a corridor with a range of 1.2490-1.2558. The MACD indicator has become inactive. Under such market conditions, it is better to look for buy deals from the level of 1.2490 on the lower time frames. It is better to consider sell deals from the upper border of the range of 1.2558.

Alternative scenario: if the price breaks through the 1.2575 resistance level and fixes above, the downtrend is likely to be broken.

USD/CAD
News feed for 2022.01.19:
  • – Canada Consumer Price Index (m/m) at 15:30 (GMT+2).

by JustForex


This article reflects a personal opinion and should not be interpreted as an investment advice, and/or offer, and/or a persistent request for carrying out financial transactions, and/or a guarantee, and/or a forecast of future events.

RoboForex Received 3 Awards at the Traders Union Awards 2021

January 18, 2022

Belize City, Belize

RoboForex, an international broker, received 3 awards at once within the frameworks of Traders Union Awards 2021. The company was recognised as the best in the following nominations – “BEST BROKER OF THE YEAR”, “BEST TRADERS UNION PARTNER”, and “MOST PROFITABLE BROKER”.

Annual voting was held by the Traders Union Awards from 1 to 30 December 2021. The nominees are brokerage companies, the best of which were chosen by over 200,000 participants of the Traders Union and visitors of its website.

Robert Stephenson, Chief Business Officer at RoboForex: “We’re very pleased that so many participants of the Traders Union highly appreciate our work and name us the best in several categories at once. We’ve won awards from the Traders Union on many occasions. The company takes incredible delight in this success because it means that the world’s biggest community of traders recognised us as the best among providers of financial services in the global market. We put a high value on this attention and are very thankful to our clients for their choice.”

The event is organized by the IAFT (Traders Union), which attracted a record number of the market participants, such as forex brokers and crypto exchanges, to become its partners. Awards received by the winners confirm their leading positions in the industry and recognition of the professional traders’ community.

About RoboForex

RoboForex is a company, which delivers brokerage services. The company provides traders, who work on financial markets, with access to its proprietary trading platforms. RoboForex Ltd has the brokerage license IFSC 000138/210. More detailed information about the Company’s products and activities can be found on the official website at roboforex.com.

XAGUSD Primary Triple Zigzag To End Near 28.74

By Orbex

XAGUSD

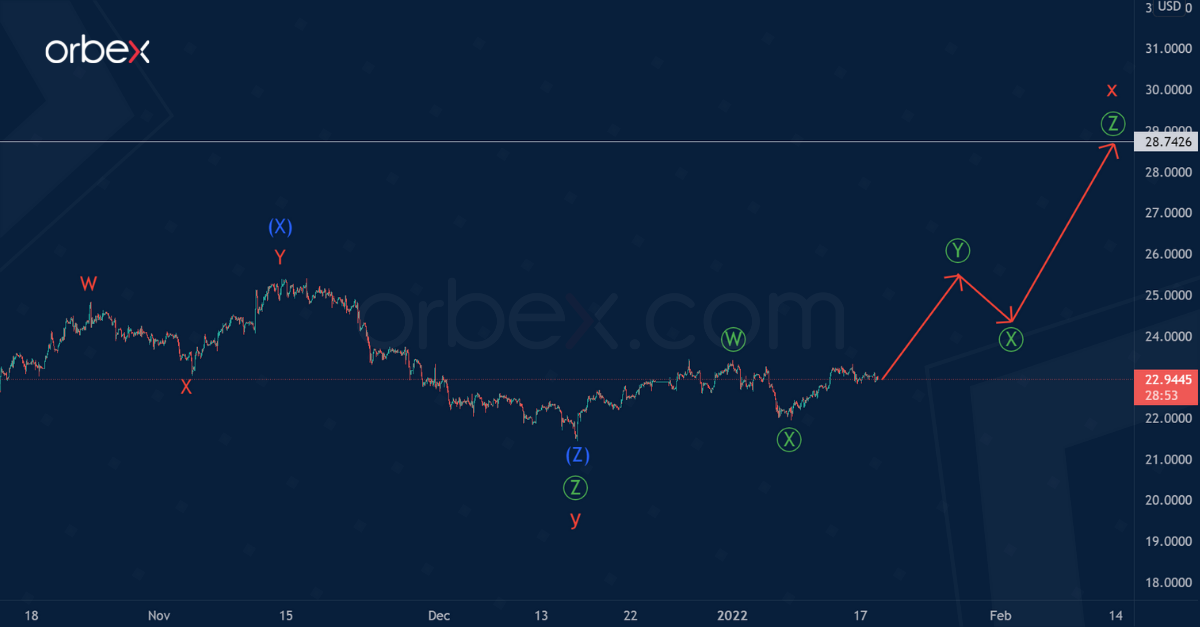
The XAGUSD structure suggests the development of a cycle triple zigzag w-x-y-x-z. In this chart, we see the final part of the bearish wave y. There is an assumption that in the second half of December, the price reached a peak, which means that the formation of the wave y has completely ended.

The cycle wave y took the form of a triple zigzag, where the last actionary wave Ⓩ is also a triple zigzag of a smaller wave level.

Consequently, in the upcoming trading weeks, we can expect an upward price movement and the development of a cycle intervening wave x. This wave can take the form of a primary triple zigzag.

Most likely, the price in wave x will rise to the previous maximum at 28.742.

XAGUSD

There is a possibility that the reactionary intervening wave x has ended. So, it is worth paying attention to the alternative option, in which we see a downward price movement and the formation of the actionary wave z.

Perhaps the wave z will be a simple zigzag of the primary degree. The impulse wave Ⓐ and the correction Ⓑ in the form of a double zigzag have already been built. Therefore, we are waiting for a drop in the primary impulse wave Ⓒ.

Most likely, the wave z will complete its pattern near 16.89. At that level, it will be at the 100% Fibonacci extension of wave y.


Orbex-LogoArticle by Orbex

Orbex is a fully licensed broker that was established in 2011. Founded with a mission to serve its traders responsibly and provides traders with access to the world’s largest and most liquid financial markets. www.orbex.com
Intraday Market Analysis – USD Recoups Some Losses

By Orbex

EURUSD seeks support

EURUSD

The euro retreated as short-term traders took profit. After a six-week-long consolidation, the euro soared above the supply area at 1.1380 and forced the bears to cover in mass.

As the dust settles, a bearish RSI divergence showed a lack of follow-up momentum. The current pullback is heading towards the origin of the breakout near 1.1355 which coincides with the 61.8% Fibonacci retracement level.

A rebound and then a close above 1.1480 would lead to a bullish reversal towards the daily resistance at 1.1600.

EURCAD tests major floor

EURCAD

The Canadian dollar inched higher supported by rising oil prices.

The pair has given up all gains from the December rally above the daily resistance at 1.4550. Sentiment is struggling to turn things around.

The RSI’s double bottom in the oversold area attracted some buying interest over the critical support at 1.4235. The bulls will need to push above 1.4360 before they could pull in enough bids for a reversal.

Otherwise, a bearish breakout could trigger a sell-off towards 1.4100.

GER 40 goes sideways

DAX

The Dax 40 consolidates as the eurozone’s finance ministers meet. The double top at the all-time high (16300) is a strong resistance to crack.

A break below 15860 has prompted some buyers to exit and reassess the situation. The current consolidation is a sign of market indecision in the short term.

A rise above the psychological level of 16000 has so far struggled to boost buyers’ confidence. This may only happen if the index reclaims 16050. On the downside, a fall below 15750 would send the price to 15500.


Orbex-LogoArticle by Orbex

Orbex is a fully licensed broker that was established in 2011. Founded with a mission to serve its traders responsibly and provides traders with access to the world’s largest and most liquid financial markets. www.orbex.com
Forex Technical Analysis & Forecast 18.01.2022

Article By RoboForex.com
EURUSD, “Euro vs US Dollar”

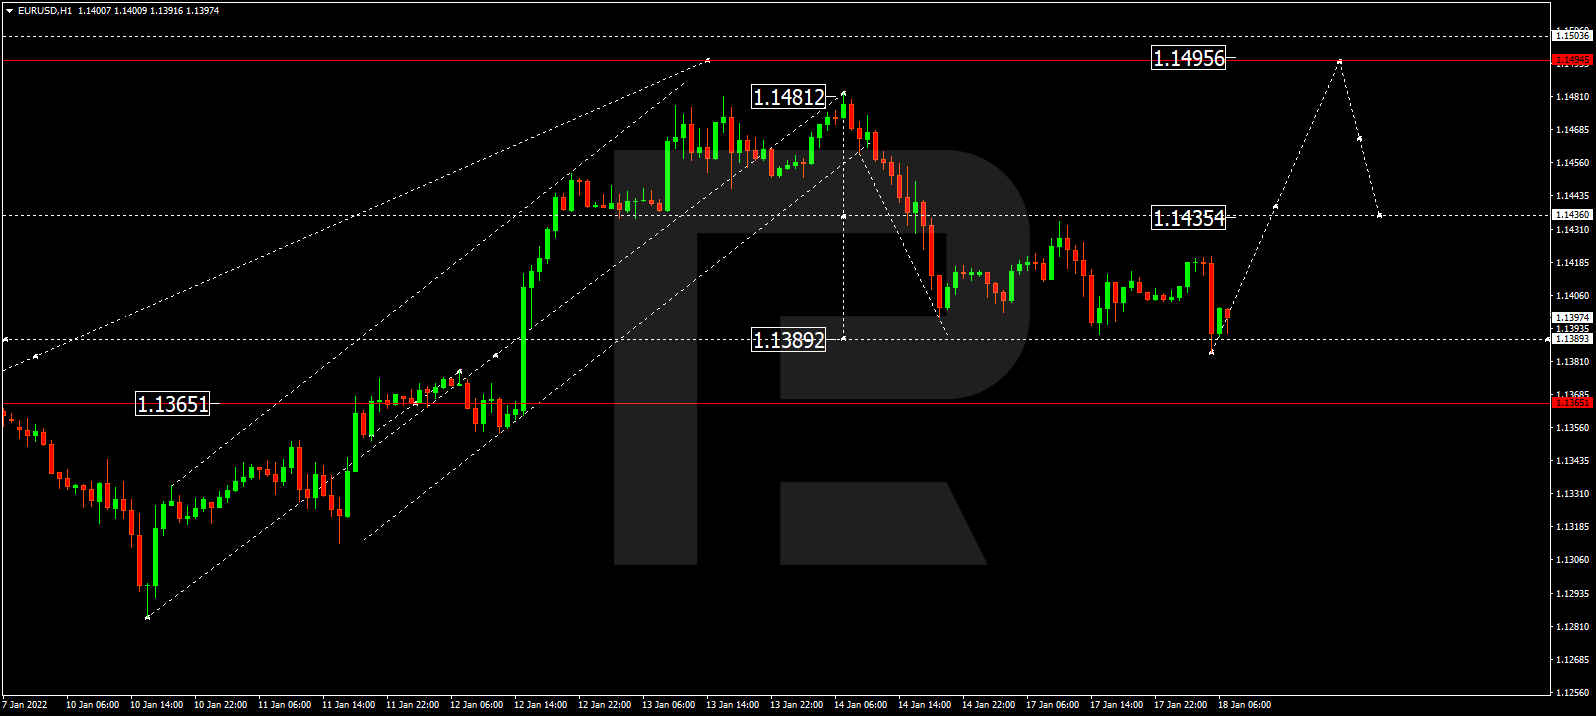
Having finished the correctional wave at 1.1380, EURUSD is expected to form one more ascending structure to break 1.1435 and then continue trading upwards with the target at 1.1495.

EURUSD
Risk Warning: the result of previous trading operations do not guarantee the same results in the future

GBPUSD, “Great Britain Pound vs US Dollar”

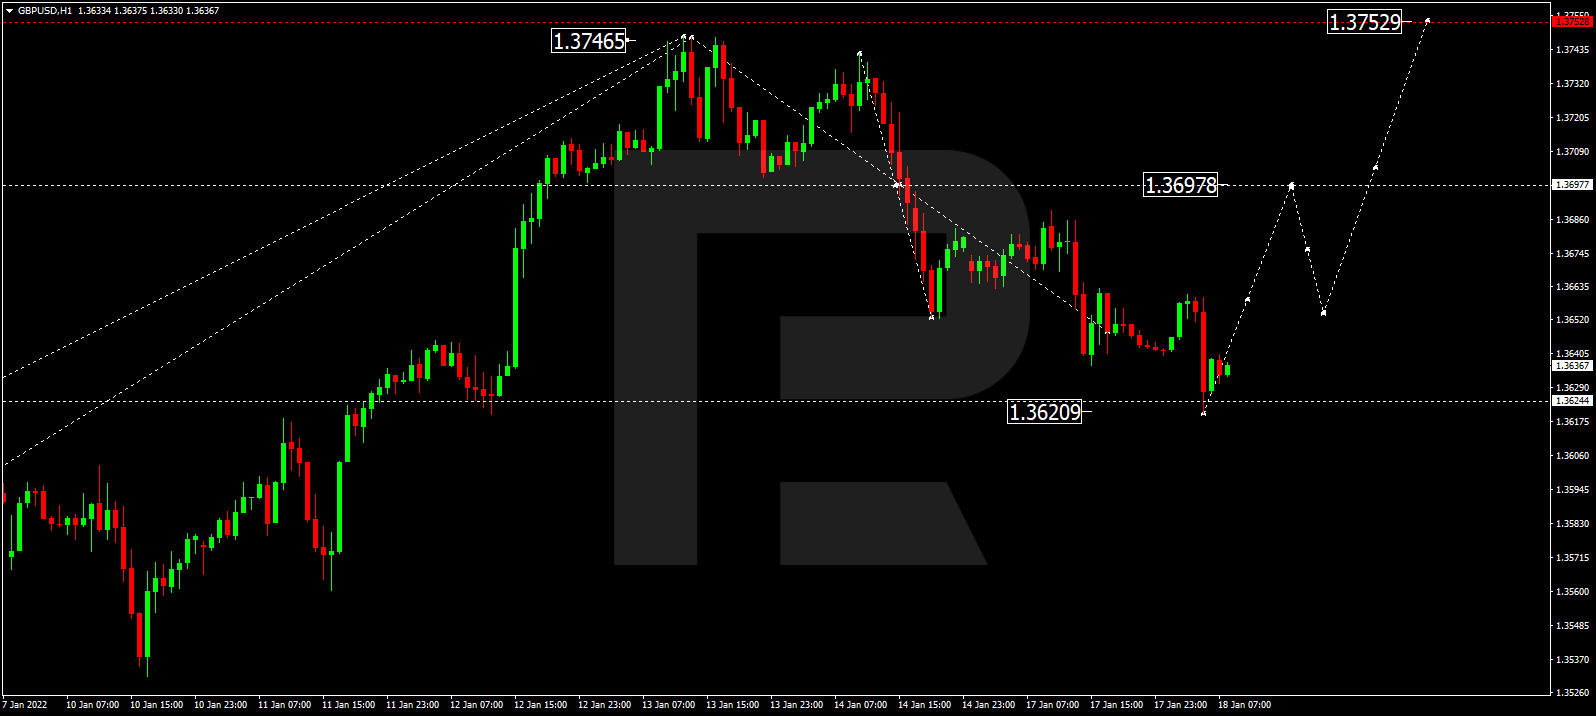
GBPUSD has completed the correctional wave at 1.3620. Possibly, today the pair may resume growing to break 1.3678 and then continue trading upwards with the target at 1.3752.

GBPUSD
Risk Warning: the result of previous trading operations do not guarantee the same results in the future

USDRUB, “US Dollar vs Russian Ruble”

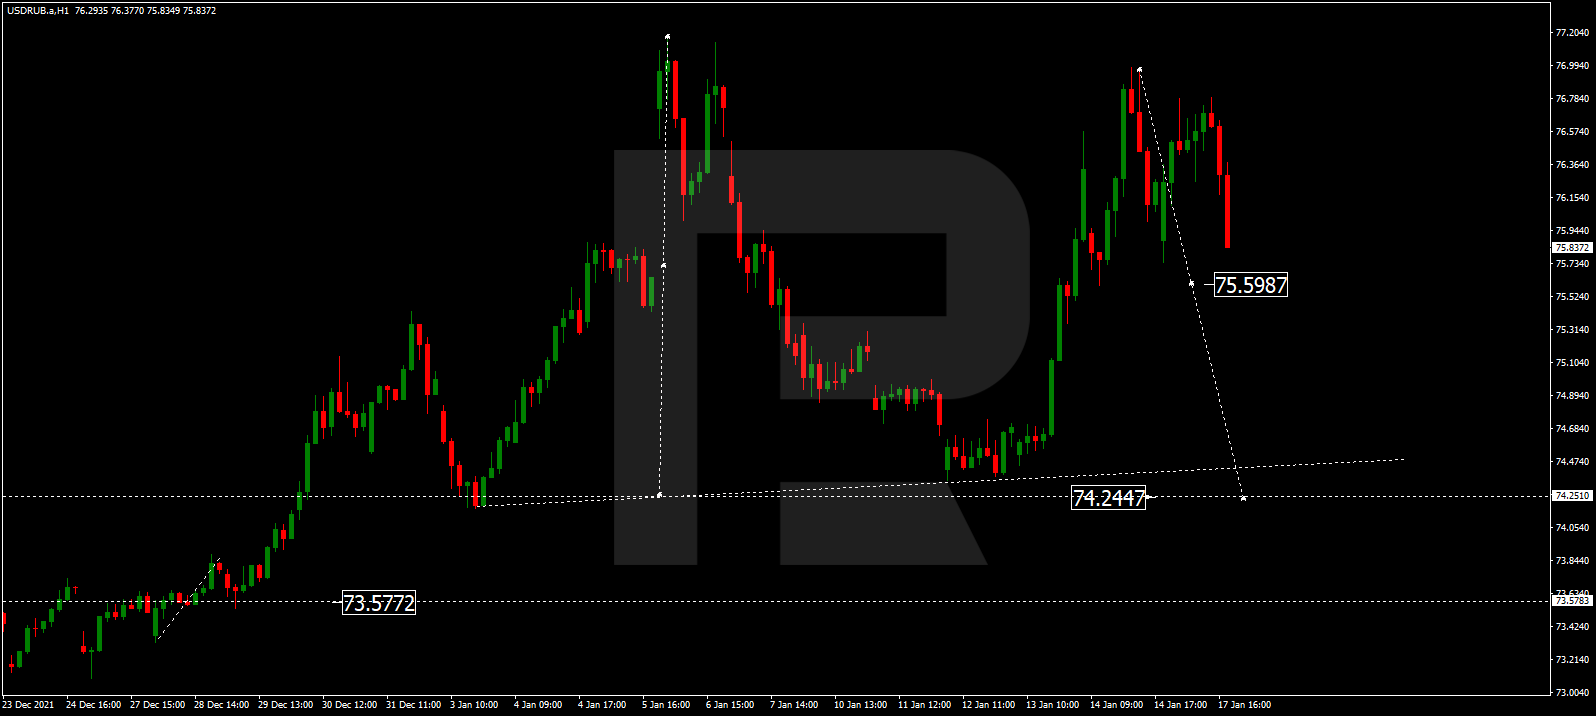
USDRUB is falling towards 75.59 and may later start another correction to reach 76.26. After that, the instrument may resume trading downwards with the short-term target at 74.40.

USDRUB
Risk Warning: the result of previous trading operations do not guarantee the same results in the future

USDJPY, “US Dollar vs Japanese Yen”

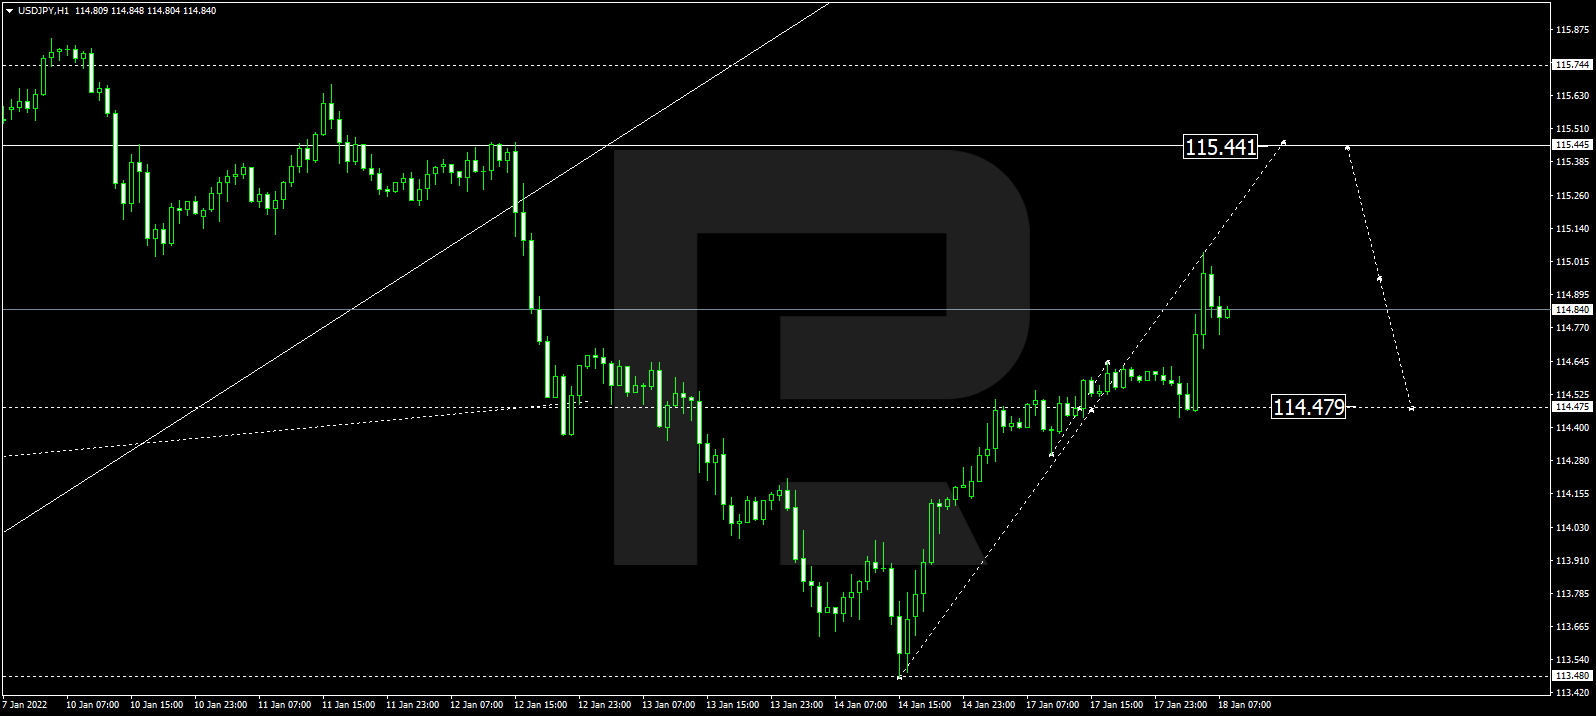
Having completed the ascending wave at 114.48 and formed a new consolidation range around this level, USDJPY has broken it to the upside and may later continue growing towards 115.44. After that, the instrument may start another correction with the target at 114.47.

USDJPY
Risk Warning: the result of previous trading operations do not guarantee the same results in the future

USDCHF, “US Dollar vs Swiss Franc”

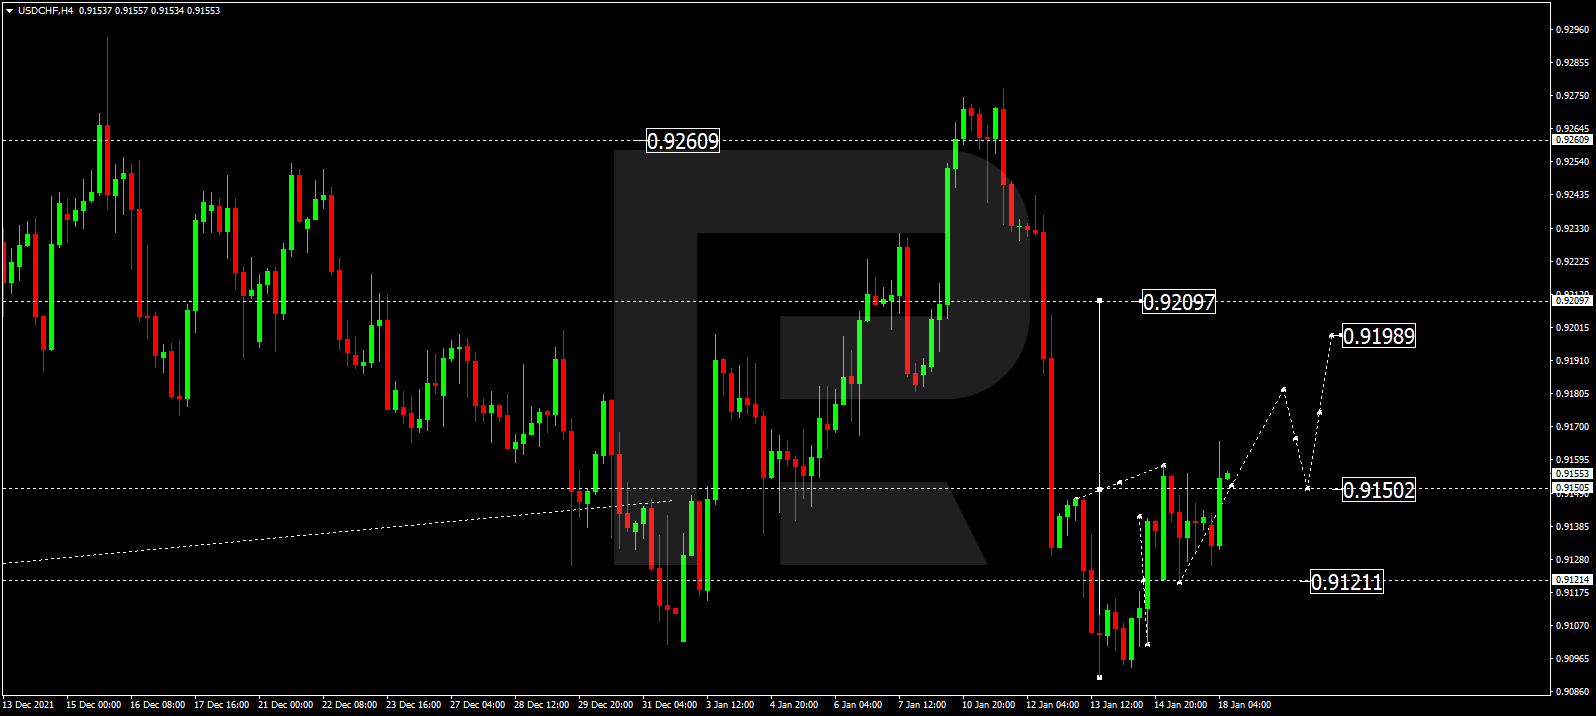
After rebounding from 0.9122, USDCHF is growing towards 0.9150. Today, the pair may break this level to the upside and then continue trading upwards with the target at 0.9180.

USDCHF
Risk Warning: the result of previous trading operations do not guarantee the same results in the future

AUDUSD, “Australian Dollar vs US Dollar”

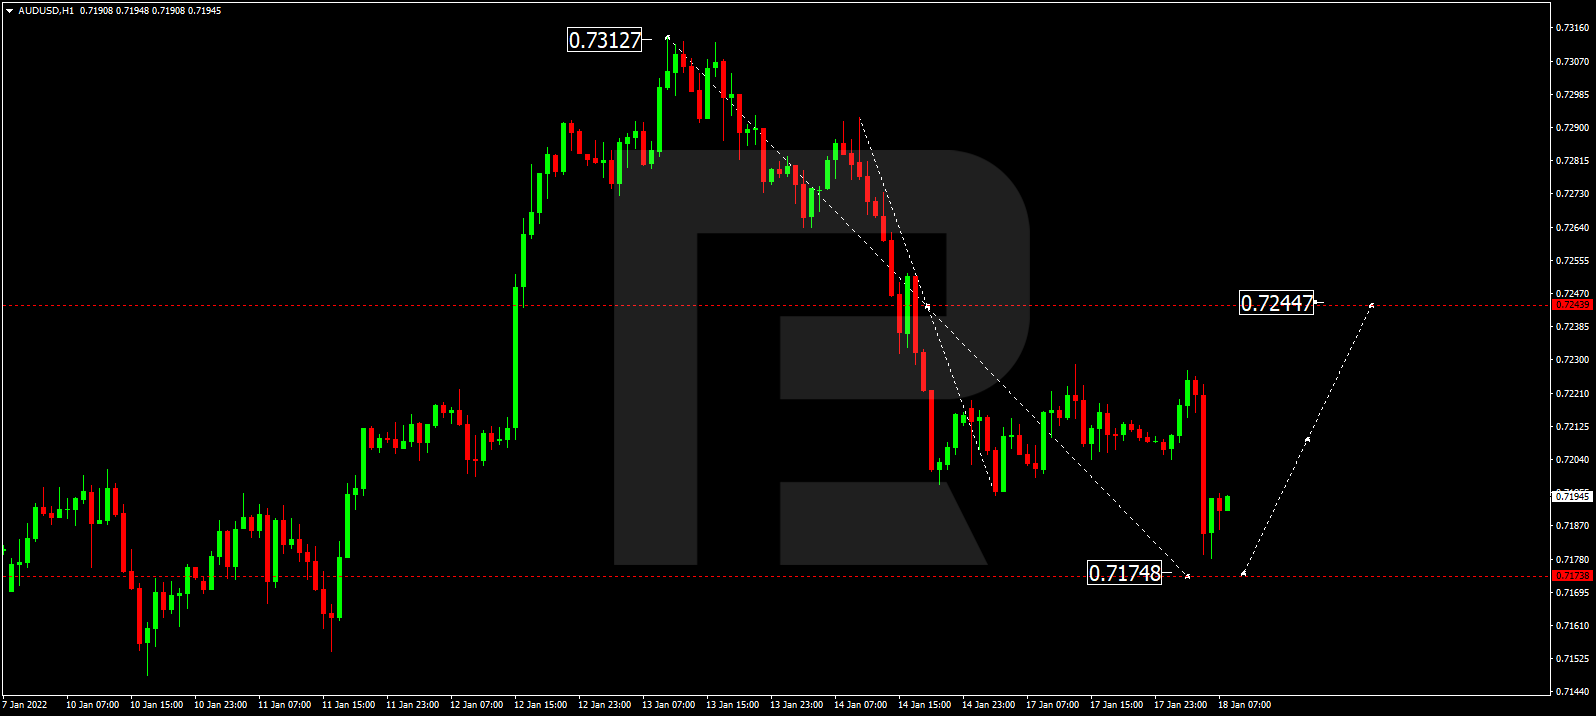
AUDUSD is correcting towards 0.7174. Later, the market may resume trading upwards with the target at 0.7244.

AUDUSD
Risk Warning: the result of previous trading operations do not guarantee the same results in the future

BRENT

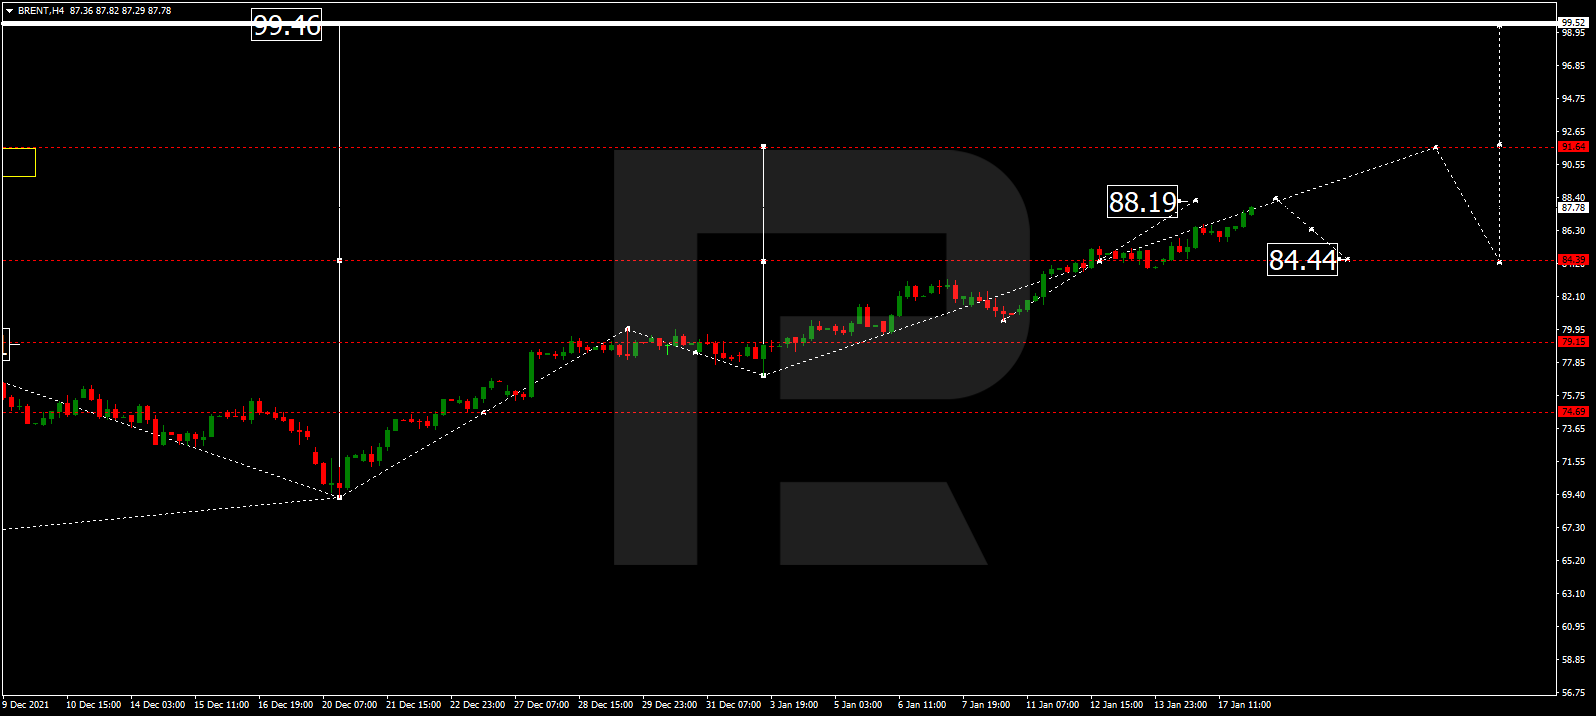
Brent continues growing towards 88.19. After that, the instrument may correct to reach 84.44 and then resume trading within the uptrend with the target at 90.00.

BRENT
Risk Warning: the result of previous trading operations do not guarantee the same results in the future

XAUUSD, “Gold vs US Dollar”

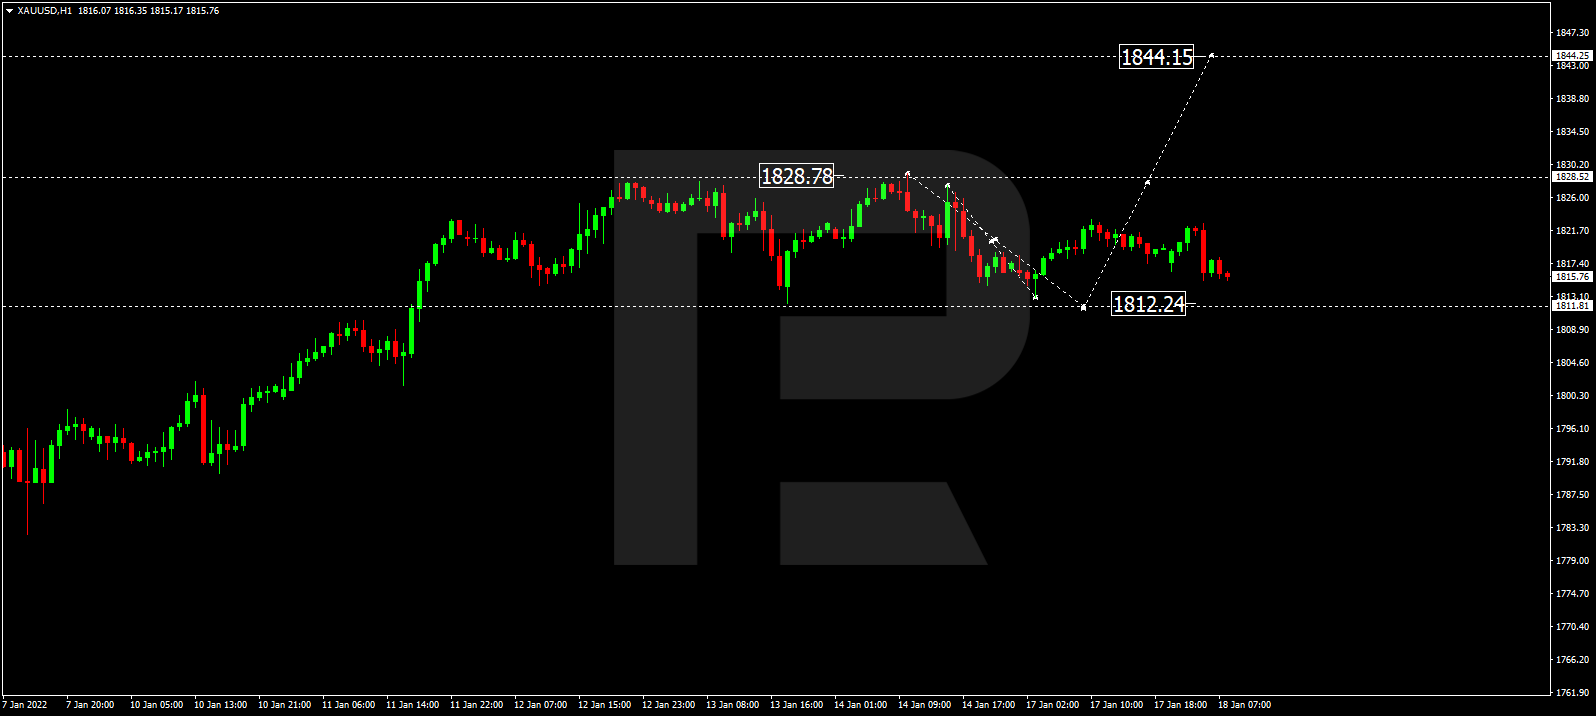
Gold is correcting and may soon reach 1812.24. Later, the market may start another growth to break 1828.78 and then continue trading upwards with the target at 1848.88.

GOLD
Risk Warning: the result of previous trading operations do not guarantee the same results in the future

S&P 500

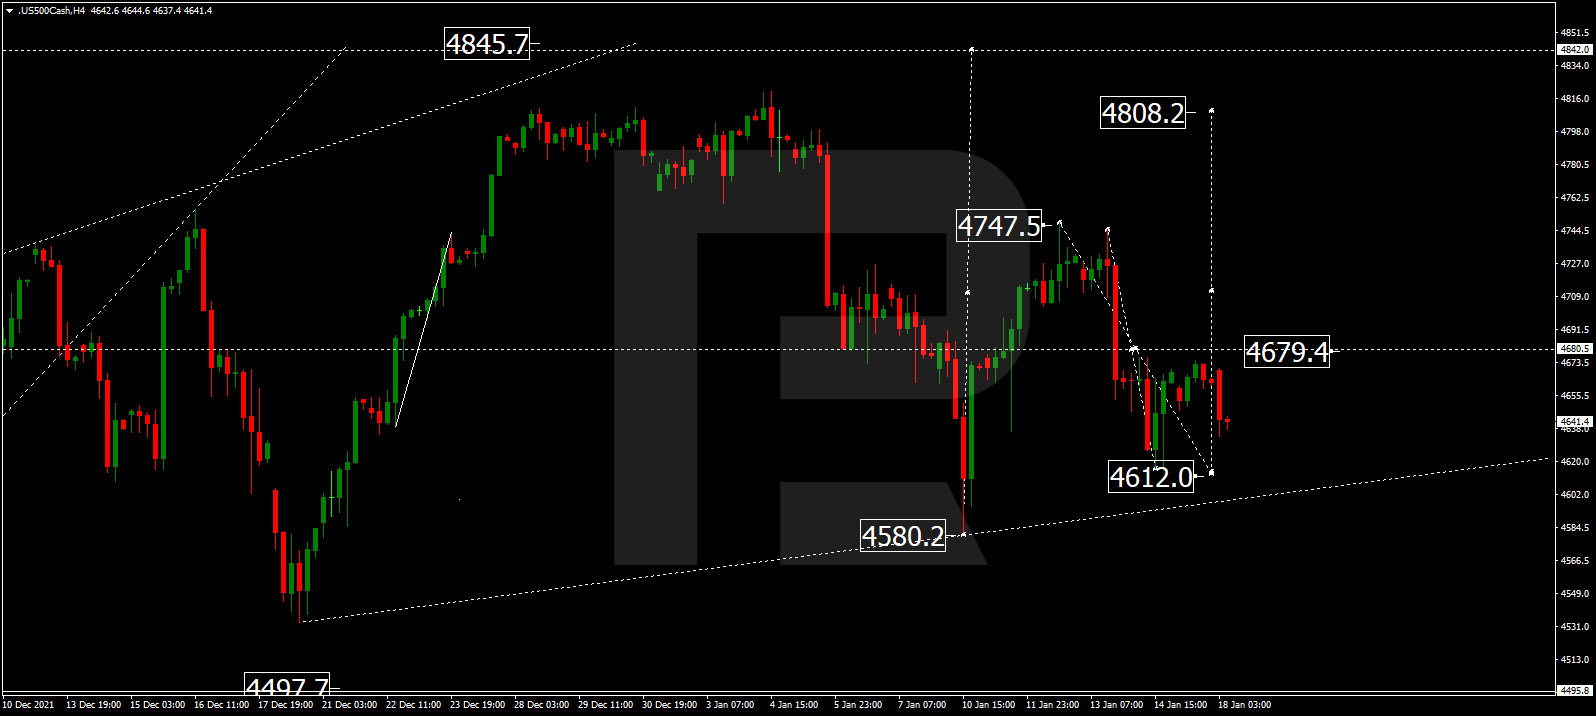
After completing the descending structure at 4615.5, the S&P index is expected to test 4679.4 from below and may later start a new decline towards 4612.0. After that, the instrument may form one more ascending structure to break 4700.0 and then continue trading upwards with the target at 4808.2.

S&P 500

Article By RoboForex.com

Attention!
Forecasts presented in this section only reflect the author’s private opinion and should not be considered as guidance for trading. RoboForex LP bears no responsibility for trading results based on trading recommendations described in these analytical reviews.

Japanese Candlesticks Analysis 18.01.2022 (EURUSD, USDJPY, EURGBP)

Article By RoboForex.com

EURUSD, “Euro vs US Dollar”

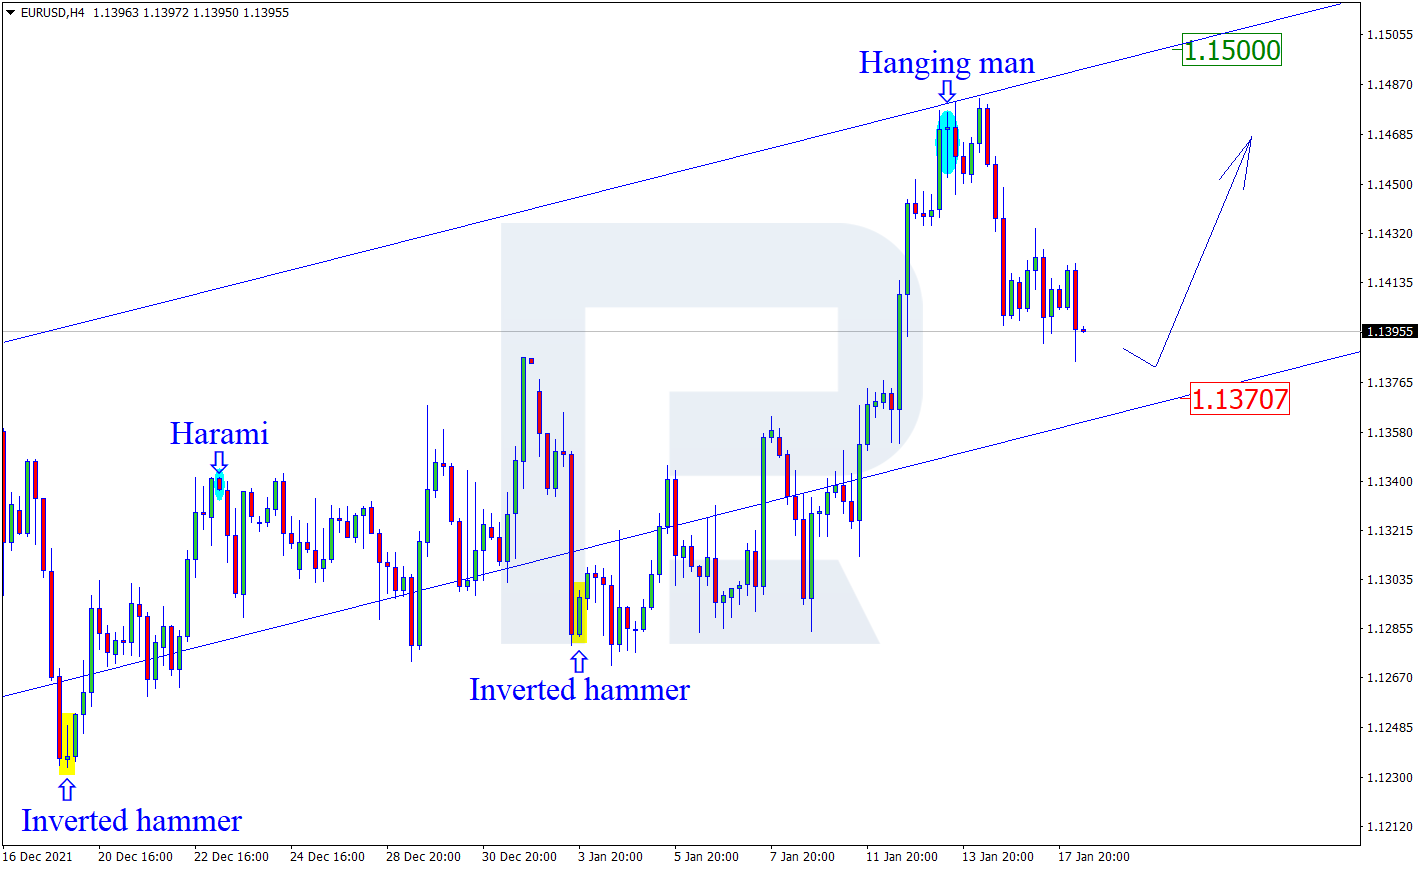
As we can see in the H4 chart, the asset has formed a Hanging Man reversal pattern close to the resistance level. At the moment, EURUSD is reversing and may form a new correctional impulse. In this case, the downside correctional target may be at 1.1370. However, an alternative scenario implies that the price may grow to reach 1.1500 and continue its ascending tendency without testing the support area.

EURUSD
Risk Warning: the result of previous trading operations do not guarantee the same results in the future

USDJPY, “US Dollar vs Japanese Yen”

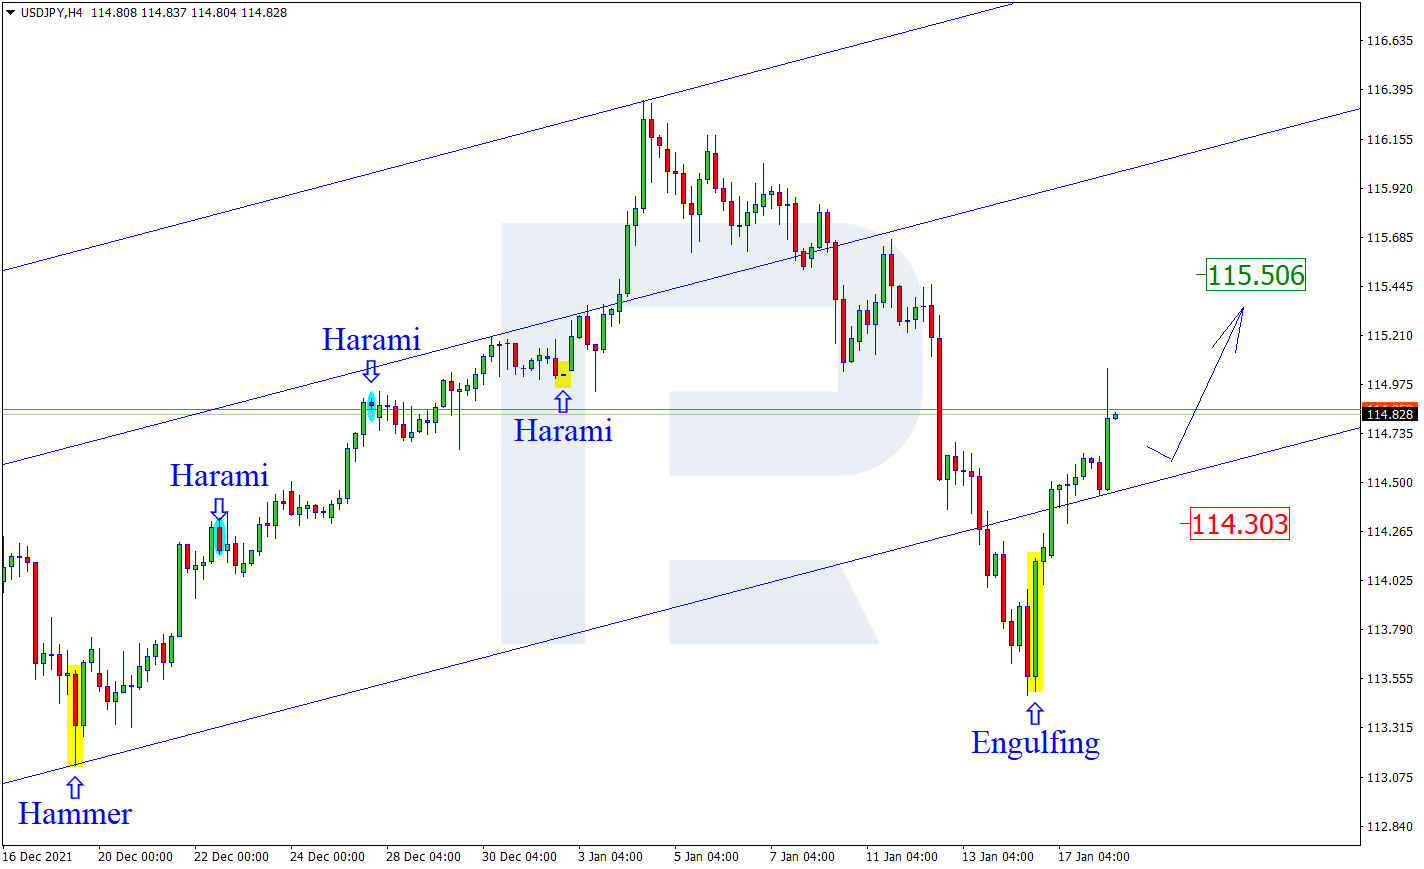
As we can see in the H4 chart, USDJPY has formed an Engulfing reversal pattern during the pullback. At the moment, USDJPY is reversing and may start a new rising wave towards the resistance level. In this case, the upside target may be at 115.50. At the same time, an opposite scenario implies that the price may fall to reach 114.30 before resuming its uptrend.

USDJPY
Risk Warning: the result of previous trading operations do not guarantee the same results in the future

EURGBP, “Euro vs Great Britain Pound”

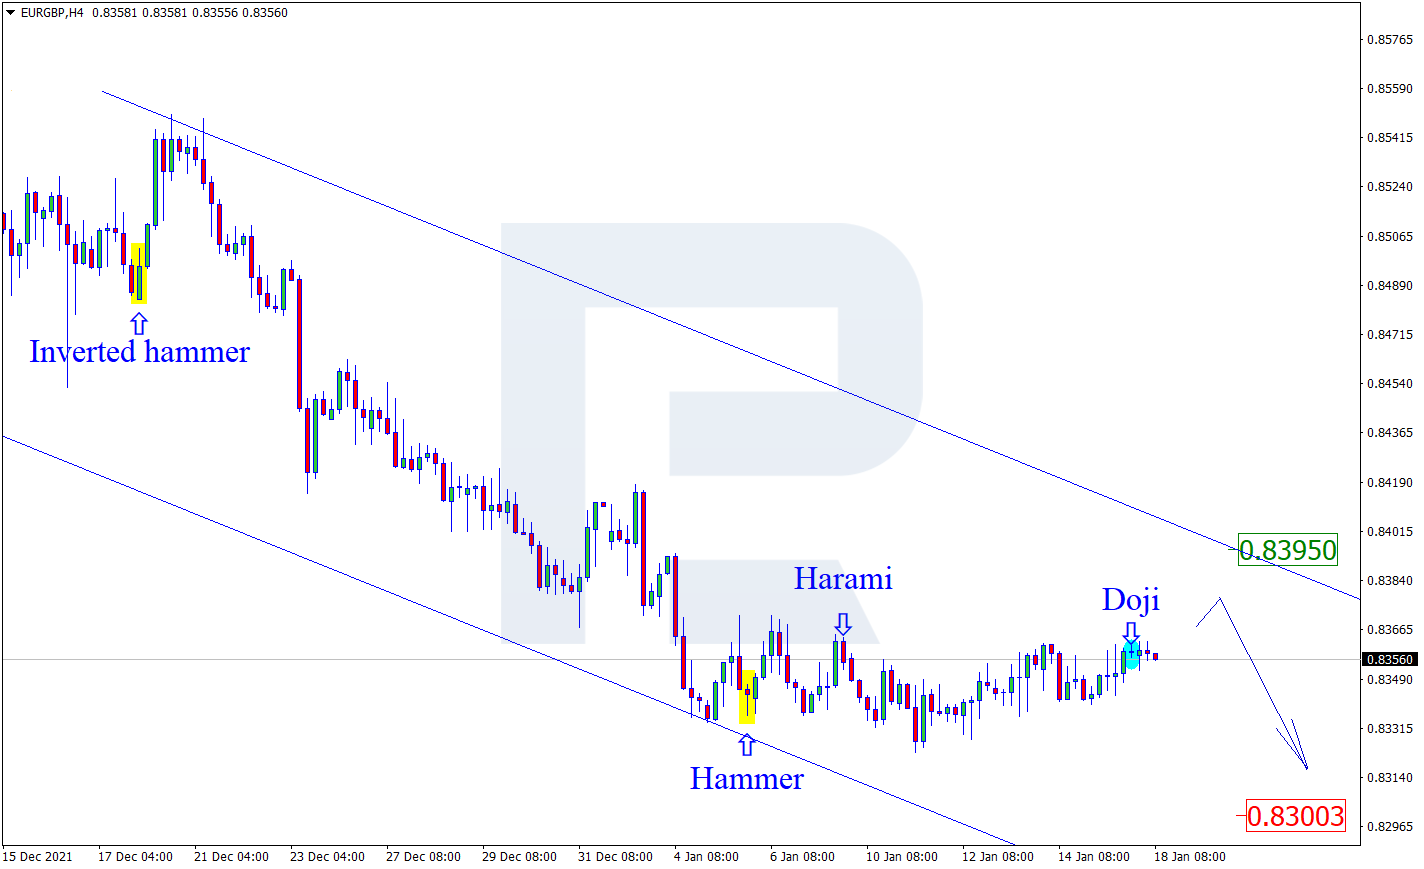
As we can see in the H4 chart, the asset continues moving sideways. After forming a Doji reversal pattern near the resistance level, EURGBP is reversing and may start another decline towards the support area. In this case, the downside target may be at 0.8300. Later, the market may test the area, break it, and continue the descending tendency. Still, there might be an alternative scenario, according to which the asset may correct to reach 0.8395 before resuming its downtrend.

EURGBP

Article By RoboForex.com

Attention!
Forecasts presented in this section only reflect the author’s private opinion and should not be considered as guidance for trading. RoboForex LP bears no responsibility for trading results based on trading recommendations described in these analytical reviews.

The Analytical Overview of the Main Currency Pairs on 2022.01.18

by JustForex

The EUR/USD currency pair

Technical indicators of the currency pair:
  • Prev Open: 1.1414
  • Prev Close: 1.1406
  • % chg. over the last day: -0.07%

The ECB has started to talk about a 10-20 basis point interest rate hike by September-December 2022. So far, it is only a rumor, but markets may put such scenarios in the price ahead of time. But analysts are confident that if inflation in the Eurozone does not grow or be accelerated by a slow pace, given the conservatism of the ECB, no changes to monetary policy should be expected before the end of 2022.

Trading recommendations
  • Support levels: 1.1394, 1.1369, 1.1330, 1.1305, 1.1288, 1.1271
  • Resistance levels: 1.1436, 1.1457, 1.1514, 1.1613, 1.1667, 1.1717

From a technical point of view, the EUR/USD on the hour time frame is bullish. On Friday, a correctional movement began, and yesterday, the price traded flat almost all day since it was a day off in the USA. The MACD indicator is in the negative zone, but there are signs of divergence. Under such market conditions, it is better to consider sell deals from the daily resistance level of 1.1436, but with additional confirmation. Buy trades can be considered on the lower time frames from the support level 1.1394 or 1.1369, but only with additional confirmation in the form of the buyers’ initiative.

Alternative scenario: if the price breaks down through the 1.1369 support level and fixes below, the mid-term uptrend will be broken.

EUR/USD
News feed for 2022.01.18:
  • – German ZEW Economic Sentiment (m/m) at 12:00 (GMT+2);
  • – Eurozone ZEW Economic Sentiment (m/m) at 12:00 (GMT+2);
  • – US NY Empire State Manufacturing Index (m/m) at 15:30 (GMT+2).

The GBP/USD currency pair

Technical indicators of the currency pair:
  • Prev Open: 1.3668
  • Prev Close: 1.3644
  • % chg. over the last day: -0.18%

In the UK, expectations are growing that the Bank of England will make another interest rate hike at its meeting in February. According to ING analysts, any weakening of the British pound will be contained due to Prime Minister Boris Johnson’s calls to resign.

Trading recommendations
  • Support levels: 1.3633, 1.3581, 1.3551
  • Resistance levels: 1.3667, 1.3708, 1.3732, 1.3753, 1.3786

On the hourly time frame, the GBP/USD trend is bullish. But on Friday, a correctional movement began, and today at the opening, the price reached the priority change level. The MACD indicator is in the negative zone, but there are signs of divergence towards long positions. Under such market conditions, traders should consider buy positions from the support level of 1.3633 but only with additional confirmation in the form of a buyers’ initiative. Sell trades can be considered on the lower time frames from the resistance level of 1.3708, but only with short targets.

Alternative scenario: if the price breaks down through the 1.3633 support level and consolidates below, the bearish scenario will likely resume.

GBP/USD
News feed for 2022.01.18:
  • – UK Average Earnings Index (m/m) at 09:00 (GMT+2);
  • – UK Claimant Count Change (m/m) at 09:00 (GMT+2);
  • – UK Unemployment Rate (m/m) at 09:00 (GMT+2).

The USD/JPY currency pair

Technical indicators of the currency pair:
  • Prev Open: 114.11
  • Prev Close: 114.60
  • % chg. over the last day: +0.43%

The Bank of Japan raised its inflation forecasts at its meeting on Tuesday, but as inflation is projected to be well below the 2% target in the coming years, it decided to keep monetary policy ultra-soft.

Trading recommendations
  • Support levels: 114.55, 113.99, 113.72, 114.18, 113.95
  • Resistance levels: 115.04, 115.35, 115.64

The global trend on the USD/JPY currency pair is bearish. But in the background of the JPY’s fall after the BOJ meeting, the price has reached the priority change level. Buy deals are best to look after the breakout of the priority change level of 115.04. Sell trades can be considered from the priority change level, but only with confirmation in the form of a sellers’ initiative, as the monetary policy of the Bank of Japan is now aimed at decreasing the Japanese yen.

Alternative scenario: if the price fixes above 115.04, the uptrend will likely resume.

USD/JPY
News feed for 2022.01.18:
  • – Japan BoJ Interest Rate Decision (Tentative);
  • – Japan BoJ Monetary Policy Statement (Tentative);
  • – Japan BoJ Outlook Report (Tentative);
  • – Japan Industrial Production (m/m) at 06:30 (GMT+2);
  • – Japan BoJ Press Conference (Tentative).

The USD/CAD currency pair

Technical indicators of the currency pair:
  • Prev Open: 1.2535
  • Prev Close: 1.2516
  • % chg. over the last day: -0.15%

The Canadian dollar is a commodity currency, so it depends not only on the monetary policy of the Bank of Canada but also on the oil prices and the dollar index. Yesterday, Brent crude oil increased to its highest level in seven years as geopolitical tensions in the Middle East intensified and concerns over the impact of the Omicron virus on-demand eased. Yesterday, the Canadian dollar strengthened as a result of the rise in the value of oil. Analysts are now revising their 2022 and 2023 oil forecasts upwards, which may provide additional support for the Canadian currency.

Trading recommendations
  • Support levels: 1.2490, 1.2427
  • Resistance levels: 1.2558, 1.2628, 1.2678, 1.2715

From a technical point of view, the USD/CAD currency pair is bearish. The price has found support on the higher time frame, the rebound occurred. The MACD indicator became inactive. Under such market conditions, it is better to look for buy trades on the lower time frames from the 1.2490 support level. Sell deals; it is better to look from the resistance levels around the moving average.

Alternative scenario: if the price breaks through the 1.2628 resistance level and fixes above, the downtrend is likely to be broken.

USD/CAD
There is no news feed for today.

by JustForex


This article reflects a personal opinion and should not be interpreted as an investment advice, and/or offer, and/or a persistent request for carrying out financial transactions, and/or a guarantee, and/or a forecast of future events.