Archive for Forex and Currency News – Page 177

Fibonacci Retracements Analysis 17.01.2022 (GOLD, USDCHF)

Article By RoboForex.com

XAUUSD, “Gold vs US Dollar”

As we can see in the daily chart, XAUUSD is forming another rising wave within the uptrend after convergence on MACD; the previous wave has tested 50.0% fibo. In this case, the pair is expected to continue the uptrend to reach 61.8% and 76.0% fibo at 1908.00 and 1969.50 respectively. The key support remains at the low at 1638.76.

GOLD_D1
Risk Warning: the result of previous trading operations do not guarantee the same results in the future

The H1 chart shows a correction to the upside; it’s been the third time the price is trying to test and break 61.8% fibo. After breaking this level, the asset may grow to reach 76.0% fibo at 1847.30 and then the local high at 1877.09. The local support is at 1752.50.

GOLD_H1
Risk Warning: the result of previous trading operations do not guarantee the same results in the future

USDCHF, “US Dollar vs Swiss Franc”

As we can see in the H4 chart, the asset has rebounded from the support at 0.9085 and may soon start a new correction before another attempt to attack the support. If the pair finally breaks it, the price may continue falling towards the post-correctional extension area between 138.2% and 161.8% fibo at 0.8975 and 0.8907 respectively. The key resistance is the high at 0.9374.

USDCHF_H4
Risk Warning: the result of previous trading operations do not guarantee the same results in the future

The H1 chart shows that the pair is moving upwards after convergence on MACD; it has already reached 23.6% fibo and may later continue towards 38.2%, 50.0%, and 61.8% fibo at 0.9200, 0.9233, and 0.9266 respectively. The local support is the low at 0.9092.

USDCHF_H1

Article By RoboForex.com

Attention!
Forecasts presented in this section only reflect the author’s private opinion and should not be considered as guidance for trading. RoboForex LP bears no responsibility for trading results based on trading recommendations described in these analytical reviews.

The Analytical Overview of the Main Currency Pairs on 2022.01.17

by JustForex

The EUR/USD currency pair

Technical indicators of the currency pair:
  • Prev Open: 1.1454
  • Prev Close: 1.1414
  • % chg. over the last day: -0.35%

France’s Consumer Price Index reached 3.4% in annual terms, the highest level in 13 years. On Friday, ECB spokeswoman Schnabel said that the ECB would not raise interest rates too quickly since such a step risked slowing down the recovery of the Eurozone. It is very likely that the ECB will not raise interest rates until the end of 2022.

Trading recommendations
  • Support levels: 1.1394, 1.1369, 1.1330, 1.1305, 1.1288, 1.1271
  • Resistance levels: 1.1436, 1.1457, 1.1514, 1.1613, 1.1667, 1.1717

From a technical point of view, the EUR/USD on the hour time frame is bullish. But on Friday, a correctional movement began. The MACD indicator became negative. Under such market conditions, it is better to consider sell deals from the daily resistance level of 1.1436, but with additional confirmation. Buy trades can be considered on the lower time frames from the support level 1.1394 or 1.1369, but only with additional confirmation in the form of the buyers’ initiative.

Alternative scenario: if the price breaks down through the 1.1369 support level and fixes below, the mid-term uptrend will be broken.

EUR/USD
There is no news feed for today.

The GBP/USD currency pair

Technical indicators of the currency pair:
  • Prev Open: 1.3707
  • Prev Close: 1.3673
  • % chg. over the last day: -0.25%

The UK GDP increased by 0.9% in November relative to the previous month and exceeded the pre-pandemic level for the first time. British industrial production jumped by 1% in November, significantly exceeding the market forecasts. The statistics indicate that the UK economy is recovering even despite the high level of Omicron disease.

Trading recommendations
  • Support levels: 1.3667, 1.3633, 1.3581, 1.3551
  • Resistance levels: 1.3708, 1.3732, 1.3753, 1.3786

On the hourly time frame, the GBP/USD trend is bullish. But on Friday, a correctional movement began. The MACD indicator became negative. Under such market conditions, traders should consider buy positions from the support level of 1.3667 or 1.3633 but only with additional confirmation in the form of a buyers’ initiative. Sell trades can be considered on the lower time frames from the resistance level of 1.3708, but only with short targets.

Alternative scenario: if the price breaks down through the 1.3633 support level and consolidates below, the bearish scenario will likely resume.

GBP/USD
There is no news feed for today.

The USD/JPY currency pair

Technical indicators of the currency pair:
  • Prev Open: 114.13
  • Prev Close: 114.18
  • % chg. over the last day: +0.04%

Analysts at Morgan Stanley believe that the Bank of Japan’s existing forecast that price risk is “shifted towards lowering” may now be revised to “balanced.” But investors should still expect the BoJ to maintain its current policy. Other analysts emphasize the risk of worsening the Japanese economy as the country prepares to intensify the current wave of Omicron infection among the population, where almost no one has received the third vaccination. The likely imposition of restrictions on restaurants, bars, and other businesses could limit broad-based economic growth in the current quarter.

Trading recommendations
  • Support levels: 114.40, 113.99, 113.72, 114.18, 113.95
  • Resistance levels: 115.04, 115.35, 115.64

The global trend on the USD/JPY currency pair is bearish. However, on the back of the dollar index growth on Friday, the Japanese Yen started to decrease, which caused the quotes’ growth. Buy deals are best to look at the lower time frames near the support level of 113.99 or 113.72. Sell trades can be considered from the priority change level but only with confirmation in the form of a sellers’ initiative since the monetary policy of the Bank of Japan is now aimed at decreasing the Japanese yen.

Alternative scenario: if the price fixes above 115.04, the uptrend will likely resume.

USD/JPY
There is no news feed for today.

The USD/CAD currency pair

Technical indicators of the currency pair:
  • Prev Open: 1.2511
  • Prev Close: 1.2546
  • % chg. over the last day: +0.28%

The Canadian dollar is a commodity currency, so it depends not only on the monetary policy of the Bank of Canada but also on the oil prices and the dollar index. Both the dollar index and oil prices increased on Friday, which led to a slight increase in the USD/CAD quotes. From a fundamental point of view, both the Bank of Canada and the US Federal Reserve intend to raise interest rates soon, which will lead to a strengthening of both national currencies. Given that oil prices are balanced now, the USC/CAD quotes will show a wide corridor without any advantage from both currencies.

Trading recommendations
  • Support levels: 1.2490, 1.2427
  • Resistance levels: 1.2558, 1.2628, 1.2678, 1.2715

From a technical point of view, the USD/CAD currency pair is bearish. The price has found support on the higher time frame, the rebound occurred. The MACD indicator became positive. Under such market conditions, it is better to look for buy trades on the lower time frames from 1.2490 support level. Sell deals it is better to look from the resistance levels around the moving average.

Alternative scenario: if the price breaks through the 1.2628 resistance level and fixes above, the downtrend is likely to be broken.

USD/CAD
There is no news feed for today.

by JustForex


This article reflects a personal opinion and should not be interpreted as an investment advice, and/or offer, and/or a persistent request for carrying out financial transactions, and/or a guarantee, and/or a forecast of future events.

AUDUSD Primary Wave Ⓧ To End Near 0.754

By Orbex

AUDUSD1

It is assumed that according to AUDUSD, the development of a bearish intervening wave x of the cycle degree occurs. It hints at a triple zigzag Ⓦ-Ⓧ-Ⓨ-Ⓧ-Ⓩ.

Apparently, at the time of writing, a bullish intervening wave Ⓧ is in the process of formation, which can take the form of an intermediate triple zigzag (W)-(X)-(Y)-(X)-(Z). In the current chart, we can see the end of the second intermediate intervening wave (X).

Prices could rise to the level of 0.754. This is where the primary wave Ⓧ will be at 61.8% of primary wave Ⓨ.

After reaching the specified level, the price could fall in the primary wave Ⓩ below the minimum of 0.699 marked by the wave Ⓨ.

AUDUSD2

An alternative option shows the formation of the primary intervening wave Ⓧ has already completely come to an end. It took the form of an intermediate double zigzag.

Now the market is in the final part of the primary wave Ⓩ. Most likely, this wave is a double zigzag (W)-(X)-(Y).

At the level of 0.676, primary wave Ⓩ will be at 100% of wave Ⓨ. After reaching this level, the cycle intervening wave x will end.

Then prices could rise within the cycle wave z above the maximum of 0.755. This is should by the primary intervening wave Ⓧ.


Orbex-LogoArticle by Orbex

Orbex is a fully licensed broker that was established in 2011. Founded with a mission to serve its traders responsibly and provides traders with access to the world’s largest and most liquid financial markets. www.orbex.com

Intraday Market Analysis – USD Still Under Pressure

By Orbex

USDCHF attempts to rebound

USDCHF

The US dollar came under pressure after a contraction in December’s US retail sales.

Strong selling pressure from the supply area around 0.9280 has pushed the pair all the way below the daily support at 0.9100.

An oversold RSI triggered a buying-the-dips behavior but the rebound could be limited as sentiment tilted to the bearish side.

The bulls will need to reclaim the support-turned-resistance at 0.9190 first. Otherwise, a new round of sell-off below 0.9090 could send the greenback to last August lows near 0.9020.

NZDUSD seeks post-rally support

NZDUSD

The New Zealand dollar fell as risk sentiment subsided going into the weekend. The surge above the supply zone around 0.6850 has triggered a reversal fever after a month-long sideways action.

As the RSI drops back into the neutrality area, buyers could be waiting to jump in at a discount. A pullback below 0.6840 has led to some profit-taking but as long as the price stays above 0.6780 the rebound is valid, or the kiwi could revisit the critical floor at 0.6700.

A break above the recent high at 0.6890 would extend the rally to 0.6960.

UK 100 consolidates gains

UK100

The FTSE 100 finds support from the UK’s stronger-than-expected GDP. A break above the top of the previous consolidation range (7545) means a continuation of the current uptrend.

Trend-followers may consider a pullback as an opportunity to stake in. Short-term sentiment remains bullish as long as the index is above 7470.

A break above the immediate resistance at 7580 would extend the rally upward. A deeper retracement would test 7370 which used to be a major resistance from the double top on the daily chart.


Orbex-LogoArticle by Orbex

Orbex is a fully licensed broker that was established in 2011. Founded with a mission to serve its traders responsibly and provides traders with access to the world’s largest and most liquid financial markets. www.orbex.com

COT Currency Speculators raise their Euro bets into bullish territory

By InvestMacro | COT | Data Tables | COT Leaders | Downloads | COT Newsletter

Here are the latest charts and statistics for the Commitment of Traders (COT) data published by the Commodities Futures Trading Commission (CFTC).

The latest COT data is updated through Tuesday January 11th 2022 and shows a quick view of how large traders (for-profit speculators and commercial entities) were positioned in the futures markets. All currency positions are in direct relation to the US dollar where, for example, a bet for the euro is a bet that the euro will rise versus the dollar while a bet against the euro will be a bet that the euro will decline versus the dollar.

Highlighting the COT currency data is the bounce back into bullish territory for the Euro in the currency futures contracts. Euro speculators boosted their bets for a fourth consecutive week this week and brought the overall speculator position into its first bullish standing in the past nine weeks (the current net position is now +6,005 contracts). Euro bets had spent from March 2020 through September 2021 in bullish territory with the Euro price reaching as high as 1.2350 before faltering. Speculator bets dropped into bearish territory in October as the euro was in the middle of a downtrend that reached a low of approximately 1.12 on November 24th. Since then, the euro has climbed back above 1.14 and the speculator positions have tipped their toes back into bullish territory. Could a bullish trend change follow?

Joining the Euro (7,559 contracts) with positive changes this week were the Swiss franc (1,869 contracts), British pound sterling (10,005 contracts), New Zealand dollar (241 contracts), Canadian dollar (3,649 contracts), Russian ruble (2,288 contracts), Bitcoin (227 contracts) and the Mexican peso (5,039 contracts).

The currencies with declining bets were the US Dollar Index (-1,186 contracts), yen (-25,263 contracts), Australian dollar (-2,120 contracts) and the Brazil real (-9,736 contracts).


Data Snapshot of Forex Market Traders | Columns Legend
Jan-11-2022OIOI-IndexSpec-NetSpec-IndexCom-NetCOM-IndexSmalls-NetSmalls-Index
USD Index57,2188337,89291-44,14616,25485
EUR682,293776,00537-33,3906627,38520
GBP200,49339-29,1665338,03252-8,86637
JPY234,00578-87,52513108,39290-20,8675
CHF42,71318-7,6605715,59948-7,93940
CAD138,57122-7,376441,996585,38040
AUD185,45372-91,4860103,60996-12,12323
NZD42,06628-8,6045710,30446-1,70032
MXN127,15515-4,451251,238733,21357
RUB44,981459,61736-11,074601,45774
BRL31,08729-10,8125410,84848-3666
Bitcoin10,85558-37795-182055926


US Dollar Index Futures:

US Dollar Index Forex Futures COT Chart
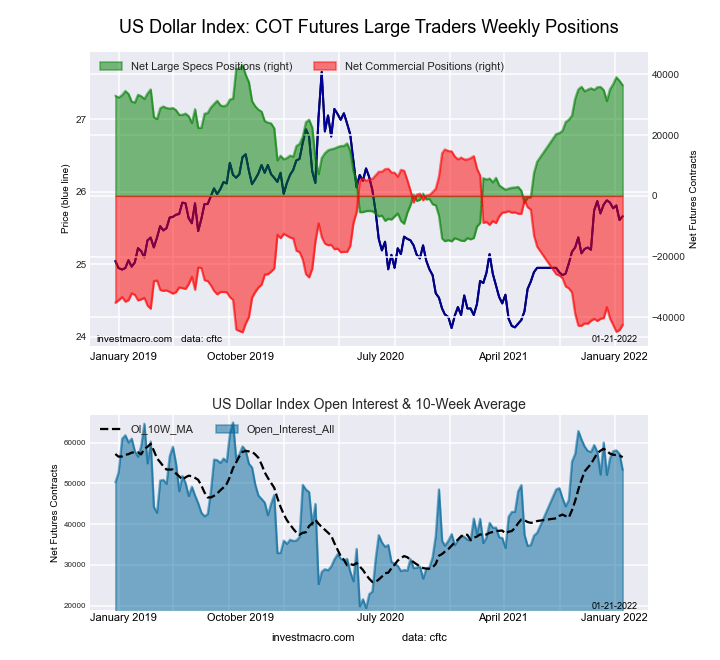
The US Dollar Index large speculator standing this week resulted in a net position of 37,892 contracts in the data reported through Tuesday. This was a weekly decrease of -1,186 contracts from the previous week which had a total of 39,078 net contracts.

This week’s current strength score (the trader positioning range over the past three years, measured from 0 to 100) shows the speculators are currently Bullish-Extreme with a score of 91.1 percent. The commercials are Bearish-Extreme with a score of 1.2 percent and the small traders (not shown in chart) are Bullish-Extreme with a score of 84.9 percent.

US DOLLAR INDEX StatisticsSPECULATORSCOMMERCIALSSMALL TRADERS
– Percent of Open Interest Longs:80.23.014.7
– Percent of Open Interest Shorts:13.980.23.7
– Net Position:37,892-44,1466,254
– Gross Longs:45,8721,7418,396
– Gross Shorts:7,98045,8872,142
– Long to Short Ratio:5.7 to 10.0 to 13.9 to 1
NET POSITION TREND:
– Strength Index Score (3 Year Range Pct):91.11.284.9
– Strength Index Reading (3 Year Range):Bullish-ExtremeBearish-ExtremeBullish-Extreme
NET POSITION MOVEMENT INDEX:
– 6-Week Change in Strength Index:3.5-6.218.5


Euro Currency Futures:

Euro Currency Futures COT Chart
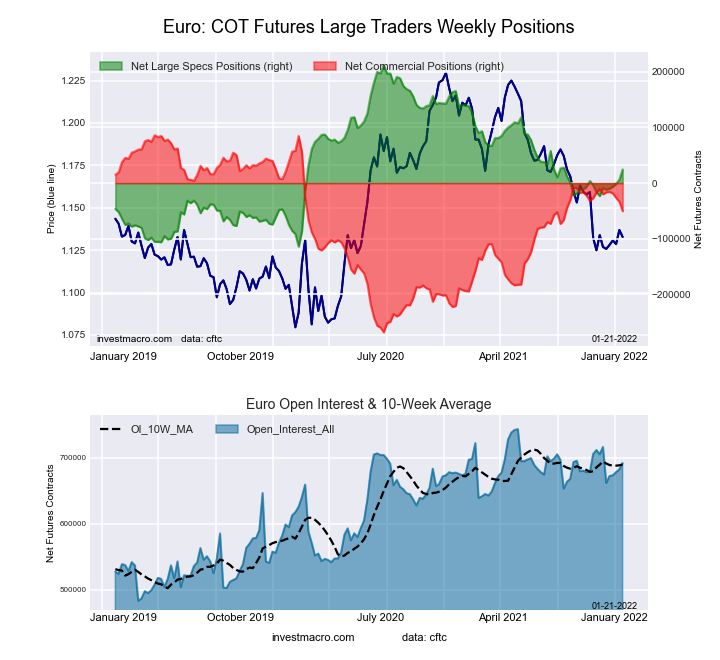
The Euro Currency large speculator standing this week resulted in a net position of 6,005 contracts in the data reported through Tuesday. This was a weekly gain of 7,559 contracts from the previous week which had a total of -1,554 net contracts.

This week’s current strength score (the trader positioning range over the past three years, measured from 0 to 100) shows the speculators are currently Bearish with a score of 36.8 percent. The commercials are Bullish with a score of 66.3 percent and the small traders (not shown in chart) are Bearish-Extreme with a score of 19.8 percent.

EURO Currency StatisticsSPECULATORSCOMMERCIALSSMALL TRADERS
– Percent of Open Interest Longs:30.057.011.7
– Percent of Open Interest Shorts:29.161.97.7
– Net Position:6,005-33,39027,385
– Gross Longs:204,361389,19179,993
– Gross Shorts:198,356422,58152,608
– Long to Short Ratio:1.0 to 10.9 to 11.5 to 1
NET POSITION TREND:
– Strength Index Score (3 Year Range Pct):36.866.319.8
– Strength Index Reading (3 Year Range):BearishBullishBearish-Extreme
NET POSITION MOVEMENT INDEX:
– 6-Week Change in Strength Index:9.0-6.4-11.1


British Pound Sterling Futures:

British Pound Sterling Futures COT Chart
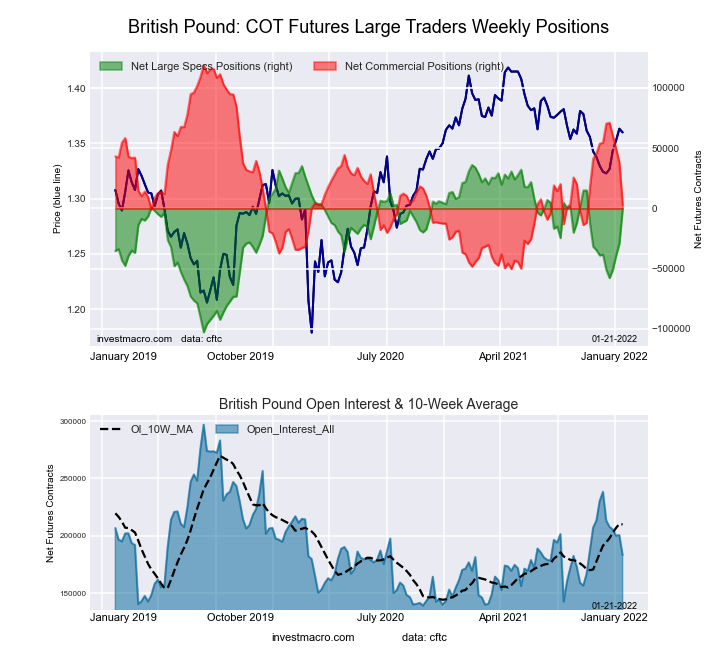
The British Pound Sterling large speculator standing this week resulted in a net position of -29,166 contracts in the data reported through Tuesday. This was a weekly rise of 10,005 contracts from the previous week which had a total of -39,171 net contracts.

This week’s current strength score (the trader positioning range over the past three years, measured from 0 to 100) shows the speculators are currently Bullish with a score of 53.0 percent. The commercials are Bullish with a score of 52.2 percent and the small traders (not shown in chart) are Bearish with a score of 37.3 percent.

BRITISH POUND StatisticsSPECULATORSCOMMERCIALSSMALL TRADERS
– Percent of Open Interest Longs:15.272.111.4
– Percent of Open Interest Shorts:29.853.115.8
– Net Position:-29,16638,032-8,866
– Gross Longs:30,506144,55022,846
– Gross Shorts:59,672106,51831,712
– Long to Short Ratio:0.5 to 11.4 to 10.7 to 1
NET POSITION TREND:
– Strength Index Score (3 Year Range Pct):53.052.237.3
– Strength Index Reading (3 Year Range):BullishBullishBearish
NET POSITION MOVEMENT INDEX:
– 6-Week Change in Strength Index:7.0-9.312.4


Japanese Yen Futures:

Japanese Yen Forex Futures COT Chart
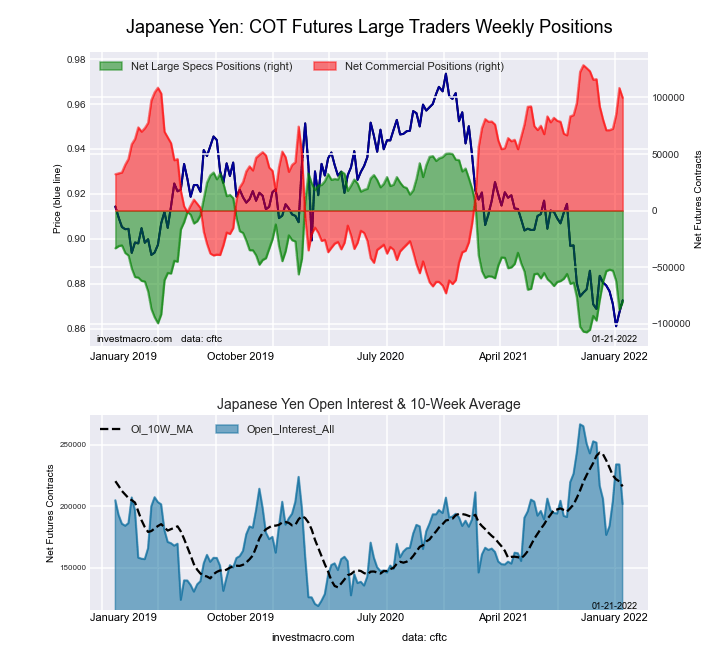
The Japanese Yen large speculator standing this week resulted in a net position of -87,525 contracts in the data reported through Tuesday. This was a weekly fall of -25,263 contracts from the previous week which had a total of -62,262 net contracts.

This week’s current strength score (the trader positioning range over the past three years, measured from 0 to 100) shows the speculators are currently Bearish-Extreme with a score of 12.7 percent. The commercials are Bullish-Extreme with a score of 90.0 percent and the small traders (not shown in chart) are Bearish-Extreme with a score of 4.6 percent.

JAPANESE YEN StatisticsSPECULATORSCOMMERCIALSSMALL TRADERS
– Percent of Open Interest Longs:9.681.17.5
– Percent of Open Interest Shorts:47.034.716.5
– Net Position:-87,525108,392-20,867
– Gross Longs:22,364189,70817,631
– Gross Shorts:109,88981,31638,498
– Long to Short Ratio:0.2 to 12.3 to 10.5 to 1
NET POSITION TREND:
– Strength Index Score (3 Year Range Pct):12.790.04.6
– Strength Index Reading (3 Year Range):Bearish-ExtremeBullish-ExtremeBearish-Extreme
NET POSITION MOVEMENT INDEX:
– 6-Week Change in Strength Index:-5.58.1-16.8


Swiss Franc Futures:

Swiss Franc Forex Futures COT Chart
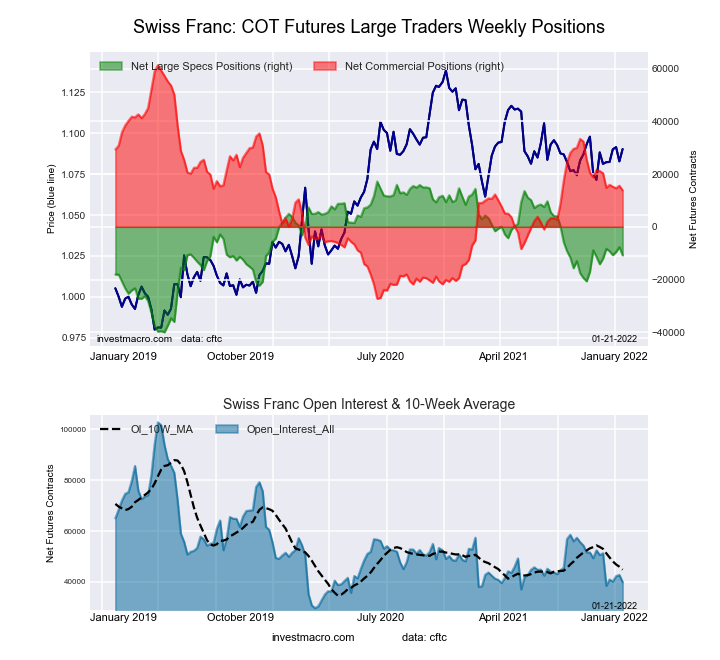
The Swiss Franc large speculator standing this week resulted in a net position of -7,660 contracts in the data reported through Tuesday. This was a weekly rise of 1,869 contracts from the previous week which had a total of -9,529 net contracts.

This week’s current strength score (the trader positioning range over the past three years, measured from 0 to 100) shows the speculators are currently Bullish with a score of 56.6 percent. The commercials are Bearish with a score of 48.4 percent and the small traders (not shown in chart) are Bearish with a score of 40.0 percent.

SWISS FRANC StatisticsSPECULATORSCOMMERCIALSSMALL TRADERS
– Percent of Open Interest Longs:10.765.323.7
– Percent of Open Interest Shorts:28.628.842.3
– Net Position:-7,66015,599-7,939
– Gross Longs:4,57127,89710,124
– Gross Shorts:12,23112,29818,063
– Long to Short Ratio:0.4 to 12.3 to 10.6 to 1
NET POSITION TREND:
– Strength Index Score (3 Year Range Pct):56.648.440.0
– Strength Index Reading (3 Year Range):BullishBearishBearish
NET POSITION MOVEMENT INDEX:
– 6-Week Change in Strength Index:11.4-6.3-2.8


Canadian Dollar Futures:

Canadian Dollar Forex Futures COT Chart
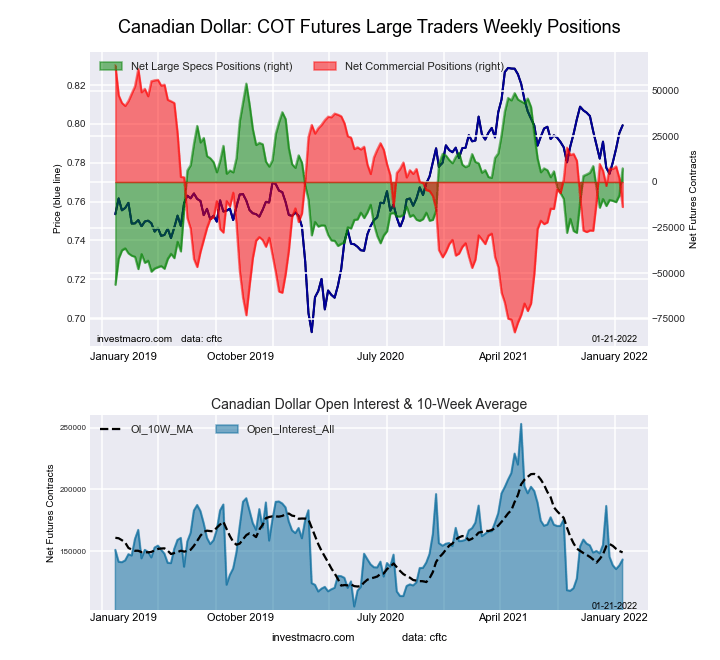
The Canadian Dollar large speculator standing this week resulted in a net position of -7,376 contracts in the data reported through Tuesday. This was a weekly gain of 3,649 contracts from the previous week which had a total of -11,025 net contracts.

This week’s current strength score (the trader positioning range over the past three years, measured from 0 to 100) shows the speculators are currently Bearish with a score of 44.4 percent. The commercials are Bullish with a score of 57.6 percent and the small traders (not shown in chart) are Bearish with a score of 40.5 percent.

CANADIAN DOLLAR StatisticsSPECULATORSCOMMERCIALSSMALL TRADERS
– Percent of Open Interest Longs:32.043.022.2
– Percent of Open Interest Shorts:37.341.518.3
– Net Position:-7,3761,9965,380
– Gross Longs:44,28459,56930,707
– Gross Shorts:51,66057,57325,327
– Long to Short Ratio:0.9 to 11.0 to 11.2 to 1
NET POSITION TREND:
– Strength Index Score (3 Year Range Pct):44.457.640.5
– Strength Index Reading (3 Year Range):BearishBullishBearish
NET POSITION MOVEMENT INDEX:
– 6-Week Change in Strength Index:6.1-5.42.3


Australian Dollar Futures:

Australian Dollar Forex Futures COT Chart
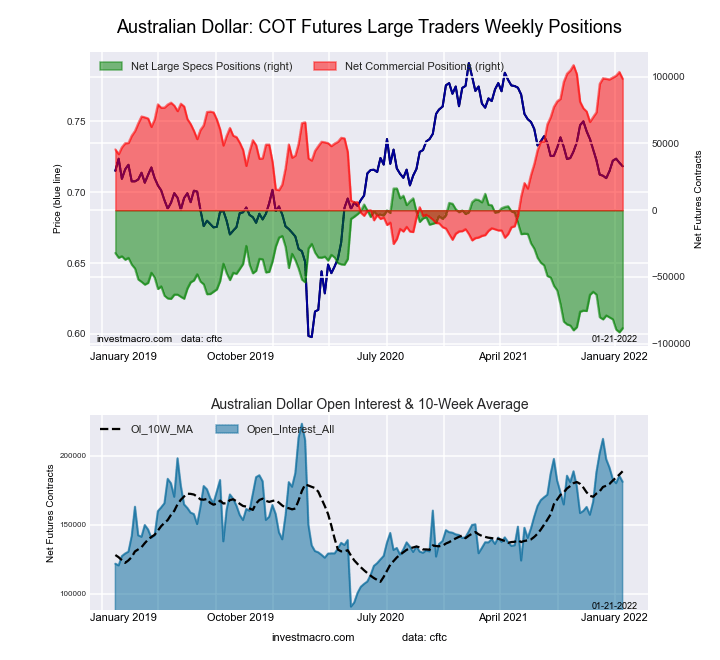
The Australian Dollar large speculator standing this week resulted in a net position of -91,486 contracts in the data reported through Tuesday. This was a weekly fall of -2,120 contracts from the previous week which had a total of -89,366 net contracts.

This week’s current strength score (the trader positioning range over the past three years, measured from 0 to 100) shows the speculators are currently Bearish-Extreme with a score of 0.0 percent. The commercials are Bullish-Extreme with a score of 96.2 percent and the small traders (not shown in chart) are Bearish with a score of 22.9 percent.

AUSTRALIAN DOLLAR StatisticsSPECULATORSCOMMERCIALSSMALL TRADERS
– Percent of Open Interest Longs:6.781.19.9
– Percent of Open Interest Shorts:56.025.216.5
– Net Position:-91,486103,609-12,123
– Gross Longs:12,383150,37518,406
– Gross Shorts:103,86946,76630,529
– Long to Short Ratio:0.1 to 13.2 to 10.6 to 1
NET POSITION TREND:
– Strength Index Score (3 Year Range Pct):0.096.222.9
– Strength Index Reading (3 Year Range):Bearish-ExtremeBullish-ExtremeBearish
NET POSITION MOVEMENT INDEX:
– 6-Week Change in Strength Index:-10.56.65.9


New Zealand Dollar Futures:

New Zealand Dollar Forex Futures COT Chart
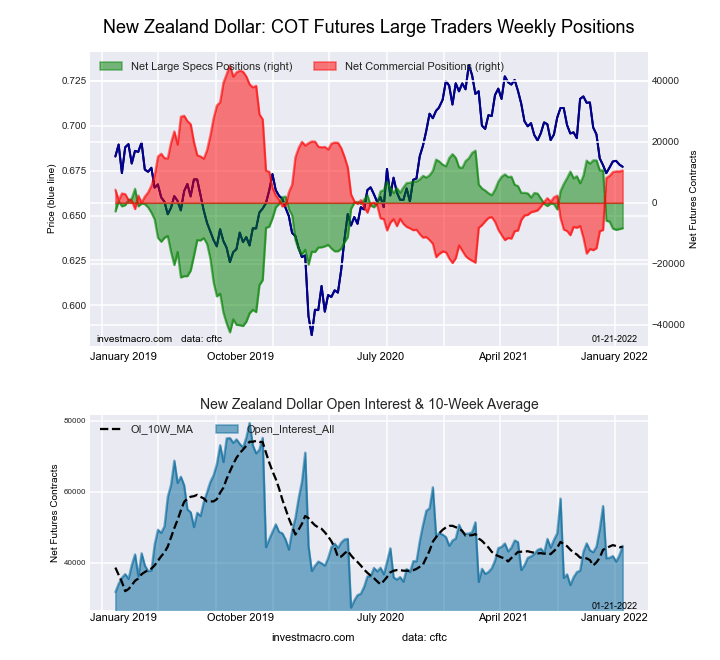
The New Zealand Dollar large speculator standing this week resulted in a net position of -8,604 contracts in the data reported through Tuesday. This was a weekly increase of 241 contracts from the previous week which had a total of -8,845 net contracts.

This week’s current strength score (the trader positioning range over the past three years, measured from 0 to 100) shows the speculators are currently Bullish with a score of 56.8 percent. The commercials are Bearish with a score of 46.3 percent and the small traders (not shown in chart) are Bearish with a score of 32.4 percent.

NEW ZEALAND DOLLAR StatisticsSPECULATORSCOMMERCIALSSMALL TRADERS
– Percent of Open Interest Longs:26.165.77.1
– Percent of Open Interest Shorts:46.541.211.1
– Net Position:-8,60410,304-1,700
– Gross Longs:10,96027,6502,979
– Gross Shorts:19,56417,3464,679
– Long to Short Ratio:0.6 to 11.6 to 10.6 to 1
NET POSITION TREND:
– Strength Index Score (3 Year Range Pct):56.846.332.4
– Strength Index Reading (3 Year Range):BullishBearishBearish
NET POSITION MOVEMENT INDEX:
– 6-Week Change in Strength Index:-32.330.2-4.3


Mexican Peso Futures:

Mexican Peso Futures COT Chart
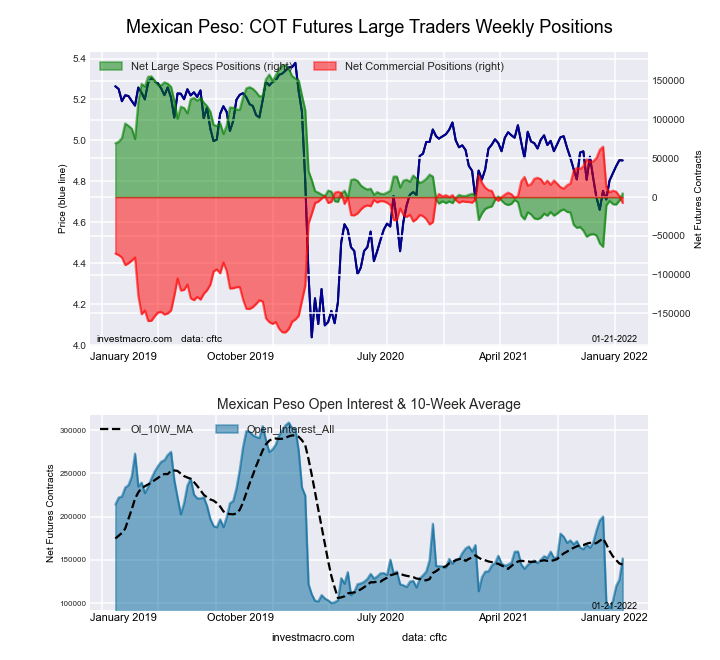
The Mexican Peso large speculator standing this week resulted in a net position of -4,451 contracts in the data reported through Tuesday. This was a weekly increase of 5,039 contracts from the previous week which had a total of -9,490 net contracts.

This week’s current strength score (the trader positioning range over the past three years, measured from 0 to 100) shows the speculators are currently Bearish with a score of 25.4 percent. The commercials are Bullish with a score of 73.3 percent and the small traders (not shown in chart) are Bullish with a score of 56.6 percent.

MEXICAN PESO StatisticsSPECULATORSCOMMERCIALSSMALL TRADERS
– Percent of Open Interest Longs:41.852.85.0
– Percent of Open Interest Shorts:45.351.92.4
– Net Position:-4,4511,2383,213
– Gross Longs:53,19467,1736,301
– Gross Shorts:57,64565,9353,088
– Long to Short Ratio:0.9 to 11.0 to 12.0 to 1
NET POSITION TREND:
– Strength Index Score (3 Year Range Pct):25.473.356.6
– Strength Index Reading (3 Year Range):BearishBullishBullish
NET POSITION MOVEMENT INDEX:
– 6-Week Change in Strength Index:23.6-25.019.4


Brazilian Real Futures:

Brazil Real Futures COT Chart
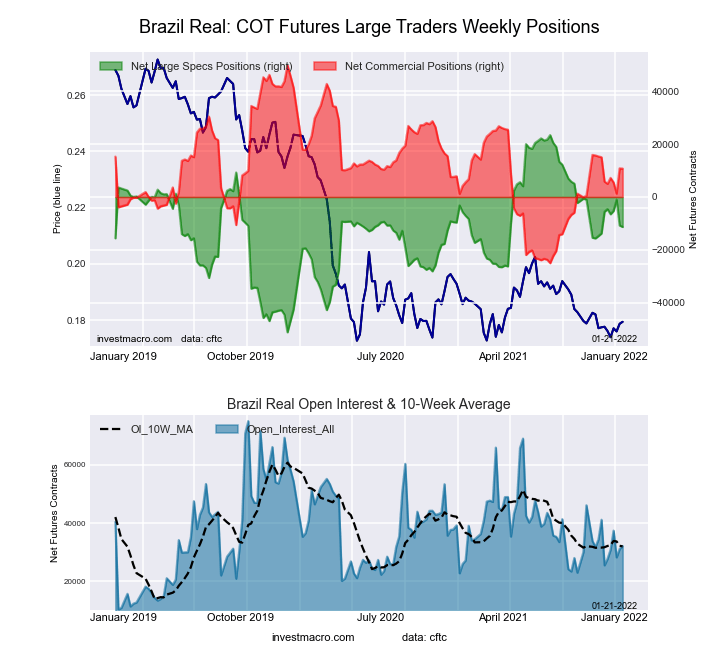
The Brazilian Real large speculator standing this week resulted in a net position of -10,812 contracts in the data reported through Tuesday. This was a weekly decrease of -9,736 contracts from the previous week which had a total of -1,076 net contracts.

This week’s current strength score (the trader positioning range over the past three years, measured from 0 to 100) shows the speculators are currently Bullish with a score of 54.2 percent. The commercials are Bearish with a score of 47.9 percent and the small traders (not shown in chart) are Bullish with a score of 66.4 percent.

BRAZIL REAL StatisticsSPECULATORSCOMMERCIALSSMALL TRADERS
– Percent of Open Interest Longs:23.566.98.8
– Percent of Open Interest Shorts:58.332.08.9
– Net Position:-10,81210,848-36
– Gross Longs:7,31220,8012,721
– Gross Shorts:18,1249,9532,757
– Long to Short Ratio:0.4 to 12.1 to 11.0 to 1
NET POSITION TREND:
– Strength Index Score (3 Year Range Pct):54.247.966.4
– Strength Index Reading (3 Year Range):BullishBearishBullish
NET POSITION MOVEMENT INDEX:
– 6-Week Change in Strength Index:4.1-5.614.4


Russian Ruble Futures:

Russian Ruble Futures COT Chart
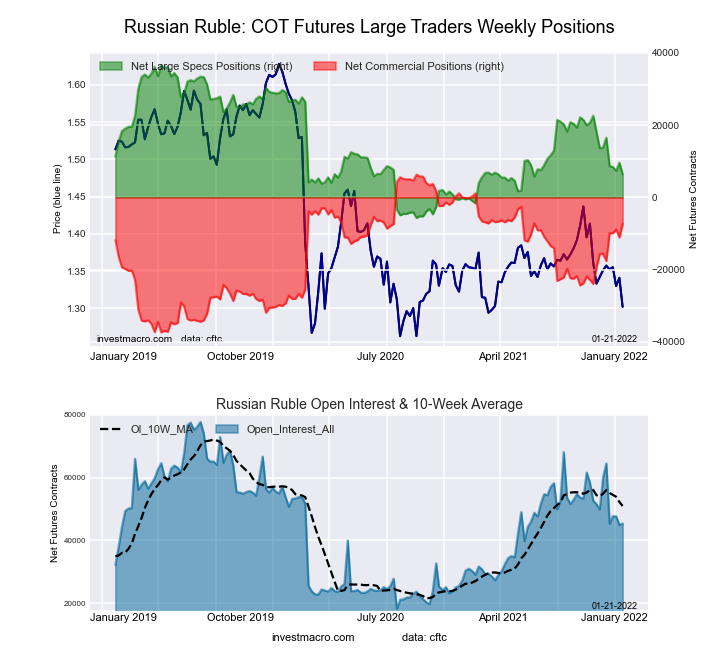
The Russian Ruble large speculator standing this week resulted in a net position of 9,617 contracts in the data reported through Tuesday. This was a weekly gain of 2,288 contracts from the previous week which had a total of 7,329 net contracts.

This week’s current strength score (the trader positioning range over the past three years, measured from 0 to 100) shows the speculators are currently Bearish with a score of 36.2 percent. The commercials are Bullish with a score of 60.2 percent and the small traders (not shown in chart) are Bullish with a score of 74.1 percent.

RUSSIAN RUBLE StatisticsSPECULATORSCOMMERCIALSSMALL TRADERS
– Percent of Open Interest Longs:42.752.05.2
– Percent of Open Interest Shorts:21.376.62.0
– Net Position:9,617-11,0741,457
– Gross Longs:19,19123,4022,357
– Gross Shorts:9,57434,476900
– Long to Short Ratio:2.0 to 10.7 to 12.6 to 1
NET POSITION TREND:
– Strength Index Score (3 Year Range Pct):36.260.274.1
– Strength Index Reading (3 Year Range):BearishBullishBullish
NET POSITION MOVEMENT INDEX:
– 6-Week Change in Strength Index:-9.510.4-14.6


Bitcoin Futures:

Bitcoin Crypto Futures COT Chart
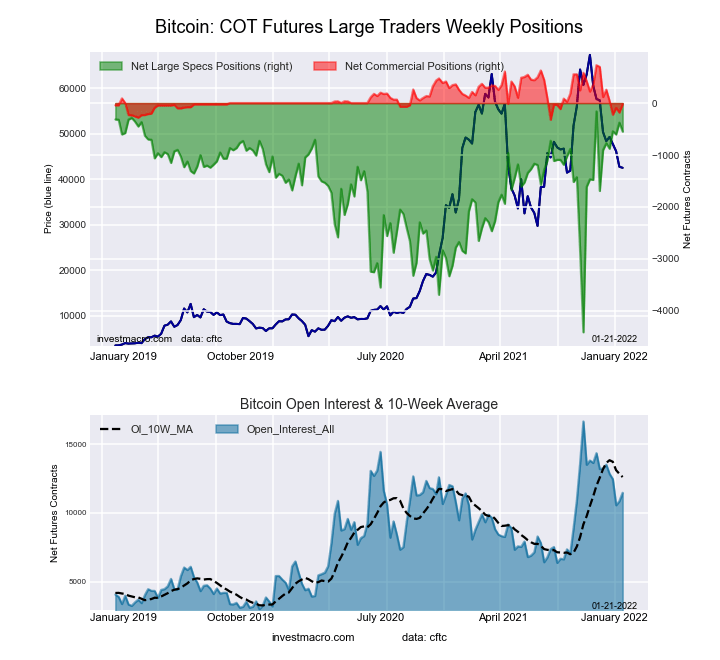
The Bitcoin large speculator standing this week resulted in a net position of -377 contracts in the data reported through Tuesday. This was a weekly boost of 227 contracts from the previous week which had a total of -604 net contracts.

This week’s current strength score (the trader positioning range over the past three years, measured from 0 to 100) shows the speculators are currently Bullish-Extreme with a score of 94.9 percent. The commercials are Bearish-Extreme with a score of 13.2 percent and the small traders (not shown in chart) are Bearish with a score of 25.6 percent.

BITCOIN StatisticsSPECULATORSCOMMERCIALSSMALL TRADERS
– Percent of Open Interest Longs:73.93.213.3
– Percent of Open Interest Shorts:77.44.98.1
– Net Position:-377-182559
– Gross Longs:8,0253471,441
– Gross Shorts:8,402529882
– Long to Short Ratio:1.0 to 10.7 to 11.6 to 1
NET POSITION TREND:
– Strength Index Score (3 Year Range Pct):94.913.225.6
– Strength Index Reading (3 Year Range):Bullish-ExtremeBearish-ExtremeBearish
NET POSITION MOVEMENT INDEX:
– 6-Week Change in Strength Index:30.9-83.7-9.9


Article By InvestMacroReceive our weekly COT Reports by Email

*COT Report: The COT data, released weekly to the public each Friday, is updated through the most recent Tuesday (data is 3 days old) and shows a quick view of how large speculators or non-commercials (for-profit traders) were positioned in the futures markets.

The CFTC categorizes trader positions according to commercial hedgers (traders who use futures contracts for hedging as part of the business), non-commercials (large traders who speculate to realize trading profits) and nonreportable traders (usually small traders/speculators) as well as their open interest (contracts open in the market at time of reporting).See CFTC criteria here.

Fibonacci Retracements Analysis 14.01.2022 (AUDUSD, USDCAD)

Article By RoboForex.com

AUDUSD, “Australian Dollar vs US Dollar”

As we can see in the daily chart, the asset is still moving to the upside after testing 38.2% fibo and convergence on MACD. This movement should be considered as a short-term ascending correction, which may later be followed by a further downtrend towards 50.0% fibo at 0.6758. The key resistance remains at the high at 0.8007.

AUDUSD_D1
Risk Warning: the result of previous trading operations do not guarantee the same results in the future

The H4 chart shows a more detailed structure of the current correctional uptrend, which has already broken 50.0% fibo. The next upside targets may be 61.8% and 76.0% fibo at 0.7340 and 0.7420 respectively. At the same time, there is divergence on MACD, which may indicate that the pullback may be over soon. The support is the low at 0.6991.

AUDUSD_H4
Risk Warning: the result of previous trading operations do not guarantee the same results in the future

USDCAD, “US Dollar vs Canadian Dollar”

As we can see in the daily chart, after updating the high, the asset is correcting downwards. After completing the pullback, USDCAD may resume its mid-term uptrend towards 38.2% and 50.0% fibo at 1.3023 and 1.3336 respectively. The key support remains at the low at 1.2007.

USDCAD_D1
Risk Warning: the result of previous trading operations do not guarantee the same results in the future

The H4 chart shows a more detailed structure of the current decline. After divergence on MACD, the decline has reached 50.0% fibo; the next downside targets may be 61.8% and 76.0% fibo at 1.2372 and 1.2237 respectively. A breakout of the local resistance at 1.2963 will result in a further uptrend.

USDCAD_H4

Article By RoboForex.com

Attention!
Forecasts presented in this section only reflect the author’s private opinion and should not be considered as guidance for trading. RoboForex LP bears no responsibility for trading results based on trading recommendations described in these analytical reviews.

Ichimoku Cloud Analysis 14.01.2022 (GBPUSD, NZDUSD, AUDUSD)

Article By RoboForex.com

GBPUSD, “Great Britain Pound vs US Dollar”

GBPUSD is trading at 1.3726; the instrument is moving above Ichimoku Cloud, thus indicating an ascending tendency. The markets could indicate that the price may test the cloud’s upside border at 1.3695 and then resume moving upwards to reach 1.3840. Another signal in favour of a further uptrend will be a rebound from the rising channel’s downside border. However, the bullish scenario may no longer be valid if the price breaks the cloud’s downside border and fixes below 1.3625. In this case, the pair may continue falling towards 1.3535.

GBPUSD
Risk Warning: the result of previous trading operations do not guarantee the same results in the future

NZDUSD, “New Zealand Dollar vs US Dollar”

NZDUSD is trading at 0.6858; the instrument is moving above Ichimoku Cloud, thus indicating an ascending tendency. The markets could indicate that the price may test Tenkan-Sen and Kijun-Sen at 0.6835 and then resume moving upwards to reach 0.6960. Another signal in favour of a further uptrend will be a rebound from the ascending channel’s downside border. However, the bullish scenario may no longer be valid if the price breaks the cloud’s downside border and fixes below 0.6750. In this case, the pair may continue falling towards 0.6665. To confirm further growth, the asset must break the rising channel’s upside border and fix above 0.6905.

NZDUSD
Risk Warning: the result of previous trading operations do not guarantee the same results in the future

AUDUSD, “Australian Dollar vs US Dollar”

AUDUSD is trading at 0.7277; the instrument is moving above Ichimoku Cloud, thus indicating an ascending tendency. The markets could indicate that the price may test the cloud’s upside border at 0.7255 and then resume moving upwards to reach 0.7375. Another signal in favour of a further uptrend will be a rebound from the bullish channel’s downside border. However, the bullish scenario may no longer be valid if the price breaks the cloud’s downside border and fixes below 0.7205. In this case, the pair may continue falling towards 0.7105.

AUDUSD

Article By RoboForex.com

Attention!
Forecasts presented in this section only reflect the author’s private opinion and should not be considered as guidance for trading. RoboForex LP bears no responsibility for trading results based on trading recommendations described in these analytical reviews.

The Analytical Overview of the Main Currency Pairs on 2022.01.14

by JustForex

The EUR/USD currency pair

Technical indicators of the currency pair:
  • Prev Open: 1.1441
  • Prev Close: 1.1454
  • % chg. over the last day: +0.11%

ECB officials indicate that supply chain problems, rising commodity prices, and Omicron continue to impact Europe’s near-term growth prospects. Such statements, as a rule, should be regarded as that the ECB does not plan to change something in its monetary policy soon. ECB head Christine Lagarde is expected to speak today. The European currency is getting stronger now due to a decrease in the dollar index.

Trading recommendations
  • Support levels: 1.1457, 1.1436, 1.1395, 1.1369, 1.1330, 1.1305, 1.1288, 1.1271
  • Resistance levels: 1.1514, 1.1613, 1.1667, 1.1717

From a technical point of view, the EUR/USD trend on the hour time frame is bullish. The European currency continues to strengthen due to the decline in the dollar index. But the price has now deviated strongly from the average values; the MACD indicator indicates a divergence. For good entry longs, traders should expect a corrective movement downwards. Under such market conditions, it is better to consider sell deals from the daily resistance level of 1.1514, but with additional confirmation. Buy trades can be considered on the lower time frames from the support levels 1.1457 or 1.1436, but only with additional confirmation in the form of the buyers’ initiative.

Alternative scenario: if the price breaks down through the 1.1369 support level and fixes below, the mid-term uptrend will be broken.

EUR/USD
News feed for 2022.01.14:
  • – ECB President Lagarde’s Speech at 15:30 (GMT+2);
  • – US Retail Sales (m/m) at 15:30 (GMT+2);
  • – US Industrial Production (m/m) at 16:15 (GMT+2);
  • – US Michigan Consumer Sentiment (m/m) at 17:00 (GMT+2);
  • – US FOMC Member Williams’s Speech at 18:00 (GMT+2).

The GBP/USD currency pair

Technical indicators of the currency pair:
  • Prev Open: 1.3699
  • Prev Close: 1.3701
  • % chg. over the last day: +0.01%

The British pound is strengthening for three main reasons. Firstly, the Bank of England raised its key interest rate in December and is likely to raise it again in February. Secondly, the 3-month LIBOR rates on the interbank lending market are two times higher than similar rates on the dollar index, and this difference is increasing now. Third, despite the reduction in the QE program, the US Fed balance sheet continues to rise, which negatively affects the dollar index.

Trading recommendations
  • Support levels: 1.3667, 1.3641, 1.3581, 1.3551
  • Resistance levels: 1.3708, 1.3753, 1.3786

On the hourly time frame, the GBP/USD trend is bullish. The price is steadily growing, but the MACD indicator is still signaling divergence on higher time frames. Under such market conditions, traders should consider buy positions from the support level of 1.3708 or 1.3667 but only with additional confirmation in the form of a buyers’ initiative. Sell trades can be considered on the lower time frames from the resistance level of 1.3732, but only with short targets.

Alternative scenario: if the price breaks down through the 1.3633 support level and consolidates below, the bearish scenario will likely resume.

GBP/USD
News feed for 2022.01.14:
  • – UK GDP (m/m) at 09:00 (GMT+2);
  • – UK Industrial Production (m/m) at 09:00 (GMT+2);
  • – UK Manufacturing Production (m/m) at 09:00 (GMT+2).

The USD/JPY currency pair

Technical indicators of the currency pair:
  • Prev Open: 114.62
  • Prev Close: 114.15
  • % chg. over the last day: -0.41%

Investors are buying the Japanese Yen as an insurance asset due to US stock market uncertainty. Investors believe that the end of the quantitative easing program, four rate hikes, and the beginning of a nine-month Fed balance sheet reduction is so aggressive that it will limit the potential for further gains in stock indices. The dollar index reached its biggest weekly decline in eight months. At the same time, the Japanese currency is supported by good statistical data, which showed a decline in producer inflation from 9.2% to 8.5%.

Trading recommendations
  • Support levels: 113.72, 114.18, 113.95
  • Resistance levels: 113.99, 114.40, 115.04, 115.35, 115.64

The global trend on the USD/JPY currency pair is bearish. The price confidently broke through the priority change level and consolidated lower. The MACD indicator is in the negative zone, but there are the first signs of divergence. Buy deals are best to look from the support levels on the lower time frames near the daily support level of 113.72. Sell trades can be considered from the resistance level of 113.99 or 144.40, but only with confirmation in the form of a sellers’ initiative.

Alternative scenario: if the price fixes above 115.04, the uptrend will likely resume.

USD/JPY
News feed for 2022.01.14:
  • – Japan Producer Price Index (q/q) at 01:50 (GMT+2).

The USD/CAD currency pair

Technical indicators of the currency pair:
  • Prev Open: 1.2500
  • Prev Close: 1.2519
  • % chg. over the last day: -0.15%

The Canadian dollar is a commodity currency, so it depends not only on the monetary policy of the Bank of Canada but also on the oil prices and the dollar index. The oil price slightly decreased yesterday, which resulted in the decrease of the Canadian dollar and growth of the USD/CAD quotes. Analysts expect the dollar index to grow soon, which will provide additional support to the quotes.

Trading recommendations
  • Support levels: 1.2470, 1.2427
  • Resistance levels: 1.2558, 1.2628, 1.2678, 1.2715

From a technical point of view, the USD/CAD currency pair is bearish. The price has found support on the higher time frame. And the MACD indicator began to signal a divergence on several timeframes. Under such market conditions, it is better to look for buy trades on the lower time frames from 1.2470 support level. It is best to look for sell deals from the resistance levels around the moving average or from the descending local trend line.

Alternative scenario: if the price breaks through the 1.2628 resistance level and fixes above, the downtrend is likely to be broken.

USD/CAD
There is no news feed for today.

by JustForex


This article reflects a personal opinion and should not be interpreted as an investment advice, and/or offer, and/or a persistent request for carrying out financial transactions, and/or a guarantee, and/or a forecast of future events.

Investors stop believing in the growth of stock indices and return to save assets

by JustForex

On Thursday, major US indices closed lower amid renewed selling of technology stocks. At the same time, investors believe that the end of quantitative easing, four rate hikes, and the beginning of the Fed’s balance sheet reduction for nine months – is so aggressive that it will limit the possibilities for further growth of stock indices. By the close of the session, the S&P 500 Index (US500) decreased by 1.4%, the Dow Jones Industrial Average (US30) decreased by 0.5%, and the Nasdaq Technology Index (US100) lost 2.5%.

During the previous week, the number of new jobless claims in the US was 230,000, while analysts expected 200,000. The US producer price index increased by 0.2% in December, which is lower than the expected 0.4% growth and much slower than the 1.0% growth in November. The decline in producer inflation is the first sign of the beginning of easing and consumer inflation in the near term.

Yesterday, Meta, formerly owned by Facebook, Google-Alphabet, Amazon, Apple, and Microsoft, fell sharply, with Microsoft shares down more than 4%.

Analysts believe the US Federal Reserve will raise rates by 25 basis points at its March 16 meeting, with rates rising 25 basis points each quarter through the third quarter of 2023.

Wells Fargo analysts also predict that the Federal Reserve will raise interest rates four times this year. The balance sheet reduction, according to the analysts, will begin in the 3rd quarter of 2023.

The largest US banks (JPMorgan, Wells Fargo & Co, Citigroup, BlackRock, First Republic Bank) will report today. Analysts expect positive reports as 2021 was a successful year for the US economy.

Yesterday, Fed spokesman Evans said that inflation has been high for a longer period of time, so the Fed should act sooner. The committee needs to bring inflation down to about 2%. Evans also added that inflation was likely to be 2.5% by the end of this year.

Key points from Fed spokesman Brainard’s speech:

  • We expect significant rate increases this year;
  • We also expect our balance sheet to reduce;
  • We are adjusting monetary policy to lower inflation;
  • Labor shortages may be a long-term phenomenon;
  • European stock indices traded without a single trend yesterday;
  • . Germany’s DAX (DE30) gained 0.13%, Britain’s FTSE 100 (UK100) added 0.16% and Spain’s IBEX 35 increased by 0.53%;
  • Meanwhile, the French CAC 40 index (FR40) decreased by 0.5%. Today a number of European countries will report on inflation.

Yesterday, British Tesco Plc shares decreased by 0.9% before today’s report. The largest British grocery retailer predicts that operating profit from retail operations for the fiscal year will be above the previously expected range of 2.5-2.6 billion pounds ($3.43-3.57 billion) on the background of good performance during the winter holidays.

The EU cannot ban the launch of Nord Stream 2, but the start is postponed due to the situation between Russia and Ukraine.

Asian stock indices are declining in trading on Friday, following the negative dynamics of US indices. Japan’s Nikkei (JP225) decreased by 1.28%, Hong Kong’s Hang Seng (HK50) decreased by 0.3%, and Australia’s ASX 200 (AU200) lost 1.08%. Statistics from China showed that China’s 2021 foreign trade surplus peaked at $676.43 billion, breaking the previous record of $593.9 billion in 2015. But month-to-month dynamics showed a slowdown in exports and imports. Analysts believe that strict restrictive measures to curb COVID-19 outbreaks and a real estate slump are two of the problems China will face in 2022 after an initial economic recovery.

Main market quotes:

S&P 500 (F) (US500) 4,659.03 −67.32 (−1.42%)

Dow Jones (US30) 36,113.62 −176.70 (−0.49%)

DAX (DE40) 16,031.59 +21.27 (+0.13%)

FTSE 100 (UK100) 7,563.85 +12.13 (+0.16%)

USD Index 94.87 −0.04 (−0.04%)

Important events for today:
  • – Japan Producer Price Index (q/q) at 01:50 (GMT+2);
  • – UK GDP (m/m) at 09:00 (GMT+2);
  • – UK Industrial Production (m/m) at 09:00 (GMT+2);
  • – UK Manufacturing Production (m/m) at 09:00 (GMT+2);
  • – ECB President Lagarde’s Speech at 15:30 (GMT+2);
  • – US Retail Sales (m/m) at 15:30 (GMT+2);
  • – US Industrial Production (m/m) at 16:15 (GMT+2);
  • – US Michigan Consumer Sentiment (m/m) at 17:00 (GMT+2);
  • – US FOMC Member Williams’s Speech at 18:00 (GMT+2).

by JustForex


This article reflects a personal opinion and should not be interpreted as an investment advice, and/or offer, and/or a persistent request for carrying out financial transactions, and/or a guarantee, and/or a forecast of future events.

Intraday Market Analysis – USD Cuts Through Support

By Orbex

USDCHF tests daily support

USDCHF

The US dollar plunged after December’s CPI slowed down to 0.5% from 0.8% in November.

Despite a swift recovery from the daily support at 0.9100, price action came under pressure once again at December’s supply area (0.9280). The dive below 0.9180 then 0.9140 is a sign of liquidation as buyers rush to the exit.

As the greenback revisits the critical support at 0.9100, an oversold RSI may attract some buying interest. The former demand area around 0.9200 is now the first resistance level.

XAUUSD looks to break out

XAUUSD

Gold edged higher as the US dollar softened across the board.

The precious metal has met stiff selling pressure in the supply zone around 1830. This level used to be a support from last November’s sell-off.

The recovery above the psychological level of 1800 shows the bulls’ commitment to keeping the price afloat. A break above the supply zone would force the sell-side to cover and trigger an extended rally towards the previous peak at 1870.

On the downside, 1800 has turned into a fresh support.

USOIL continues upward

USOIL

WTI crude climbed higher after a larger-than-expected fall in US inventories. A close above the daily resistance at 79.00 was a strong bullish sign.

Following a brief pause, the rally accelerated above 80.40. Sentiment remains upbeat and the bulls are keen to buy the dip during a pullback. A breach above 82.20 would clear the path to the peak at 85.00.

An overbought RSI may cause a temporary retreat. In that case, trend-followers could be looking to jump in near the closest support at 81.20.


Orbex-LogoArticle by Orbex

Orbex is a fully licensed broker that was established in 2011. Founded with a mission to serve its traders responsibly and provides traders with access to the world’s largest and most liquid financial markets. www.orbex.com