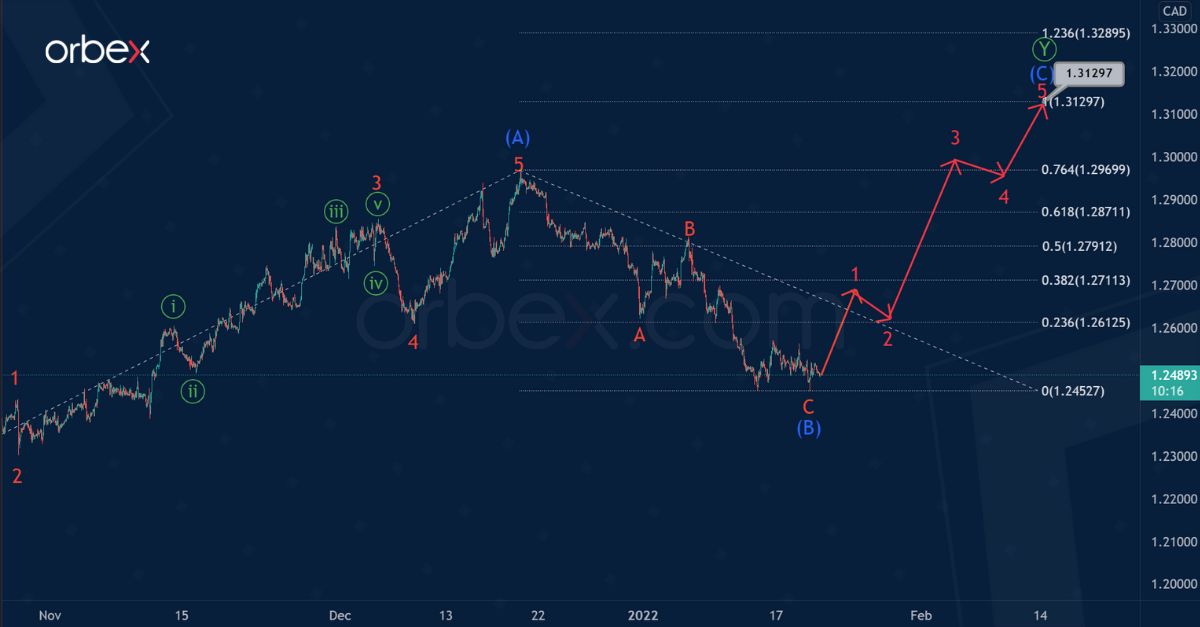
The USDCAD pair sees an upward price movement within the large wave Ⓨ of the primary degree. Judging by the internal structure, wave Ⓨ takes the form of a simple 3-wave zigzag. This is marked by intermediate sub-waves (A)-(B)-(C).
The intermediate wave (A) in the form of an impulse, as well as the bearish correction (B) which is a minor zigzag A-B-C, seem fully complete.
Thus, since the construction of the intermediate correction (B) has ended, the intermediate wave (C) will be the next target.
The end of wave (C) could be near 1.312. At that level, intermediate impulses (A) and (C) will be equal.
According to an alternative scenario, within the framework of a global double zigzag consisting of primary sub-waves Ⓦ-Ⓧ-Ⓨ, only the middle part is complete. Specifically, that is the primary intervening wave Ⓧ.
It is likely that the intervening wave Ⓧ has a complex triple zigzag formation. This consists of intermediate sub-waves (W)-(X)-(Y)-(X)-(Z).
Once the intermediate intervening wave (X) ends, prices could lower in the final wave (Z) towards the 1.223 area. At that level, primary intervening wave Ⓧ will be at 76.4% of actionary wave Ⓦ.
Orbex is a fully licensed broker that was established in 2011. Founded with a mission to serve its traders responsibly and provides traders with access to the world’s largest and most liquid financial markets. www.orbex.com
The Canadian dollar finds support from hotter-than-expected inflation. The US counterpart remained under pressure after it failed to hold onto 1.2500.
The RSI’s repeatedly oversold situation has attracted some buying interest. But timid rebounds have rather been opportunities for trend-followers to sell into strength.
1.2570 is a key resistance to lift if the bulls look for another chance. On the downside, a drop below 1.2450 would trigger a new round of sell-off towards the daily support at 1.2390.
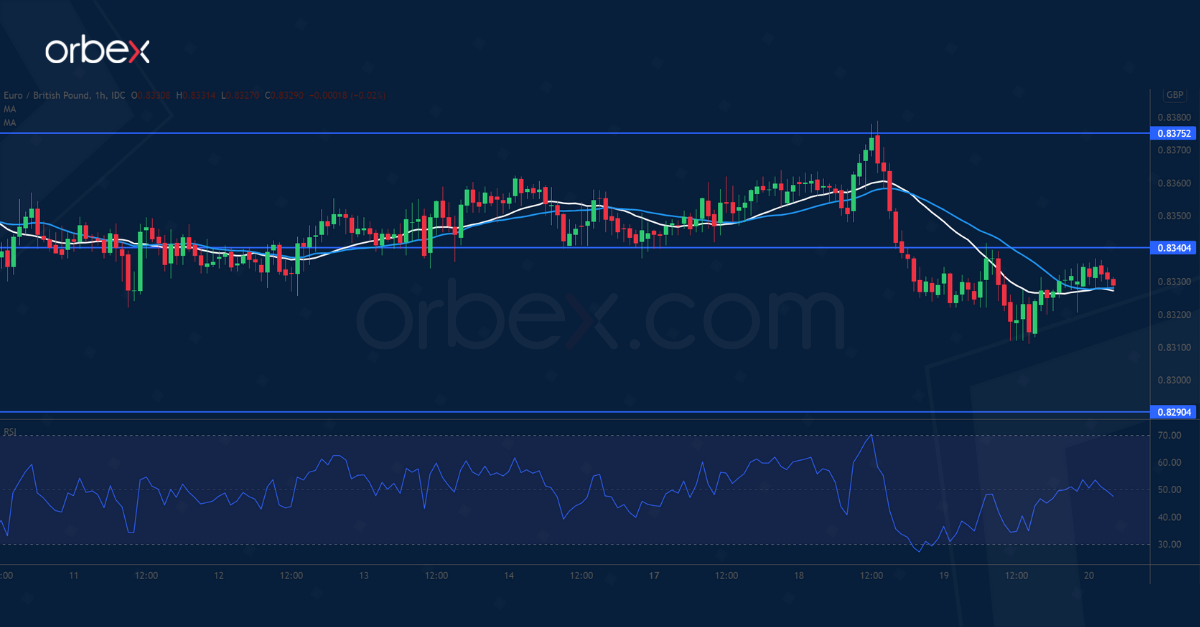
The euro has struggled to lift offers around 0.8375 after a two-week-long consolidation. The subsequent break below 0.8340 has forced buyers to bail out, exacerbating the bearish mood. This former support has turned into a fresh resistance.
A bearish MA cross indicates an acceleration to the downside. The pair is now heading towards February 2020’s lows near 0.8290. An oversold RSI may cause a limited rebound.
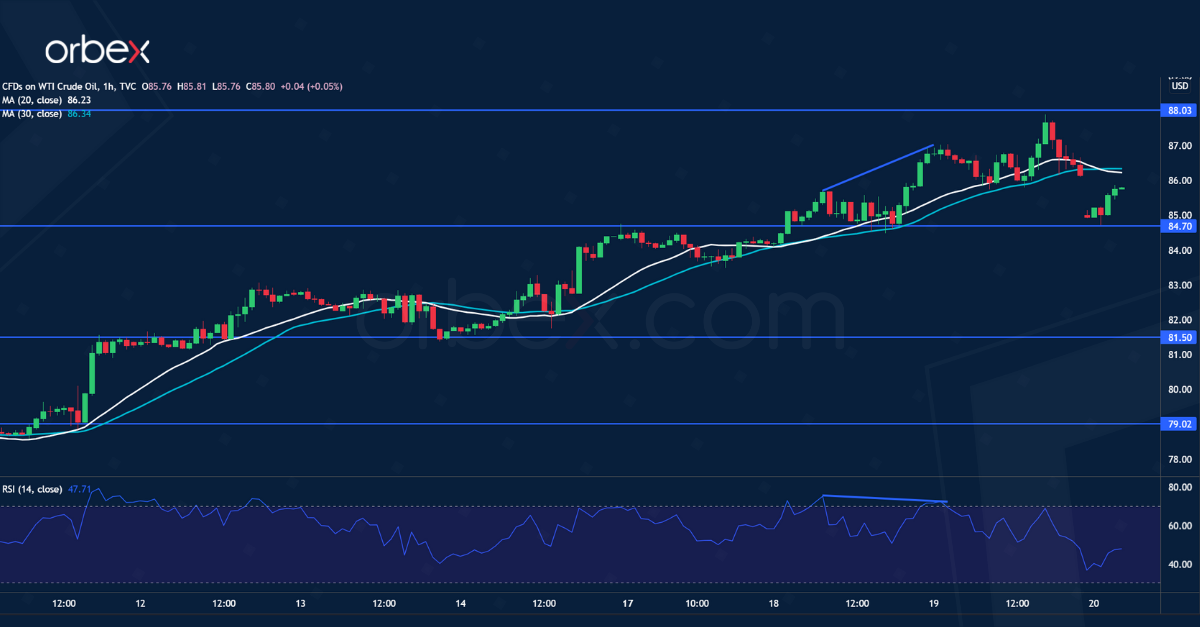
USOIL seeks support
WTI crude continued upward after the IEA warned inventories in OECD countries were at their lowest levels.
The rally may accelerate in the medium-term after the bulls clear last October’s high at 85.00. However, the RSI has shot into the overbought area on the daily chart.
Bearish divergence on the hourly time frame suggests a slowdown in the short-term momentum. Price action could be due for a pullback. 84.70 is the first support and 88.00 is the resistance when the price bounces back.
Orbex is a fully licensed broker that was established in 2011. Founded with a mission to serve its traders responsibly and provides traders with access to the world’s largest and most liquid financial markets. www.orbex.com
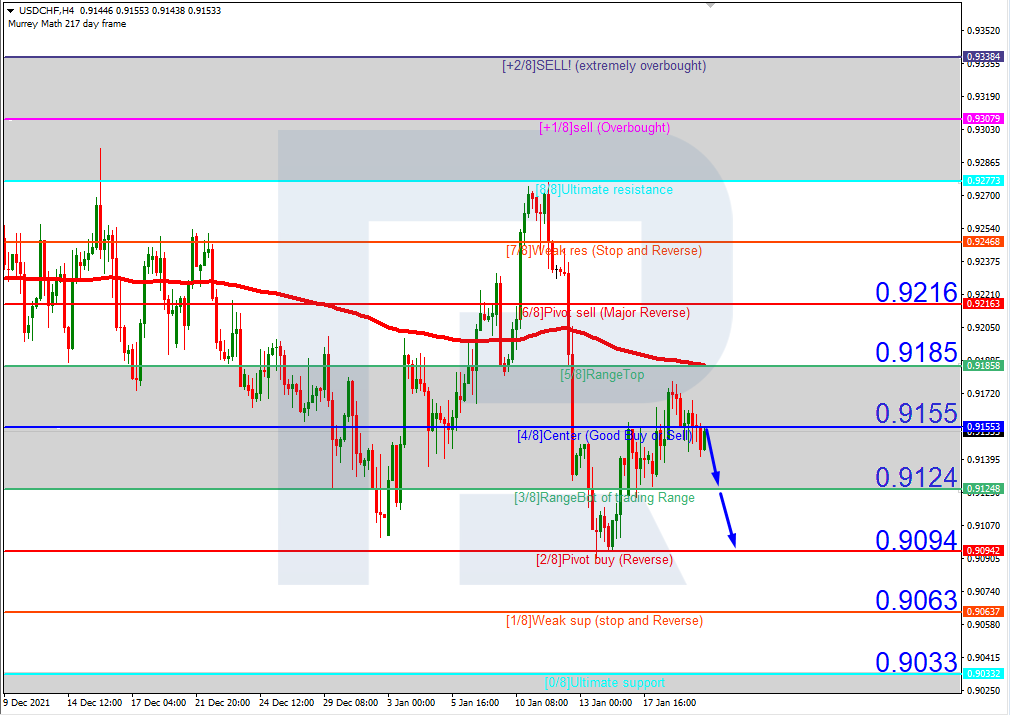
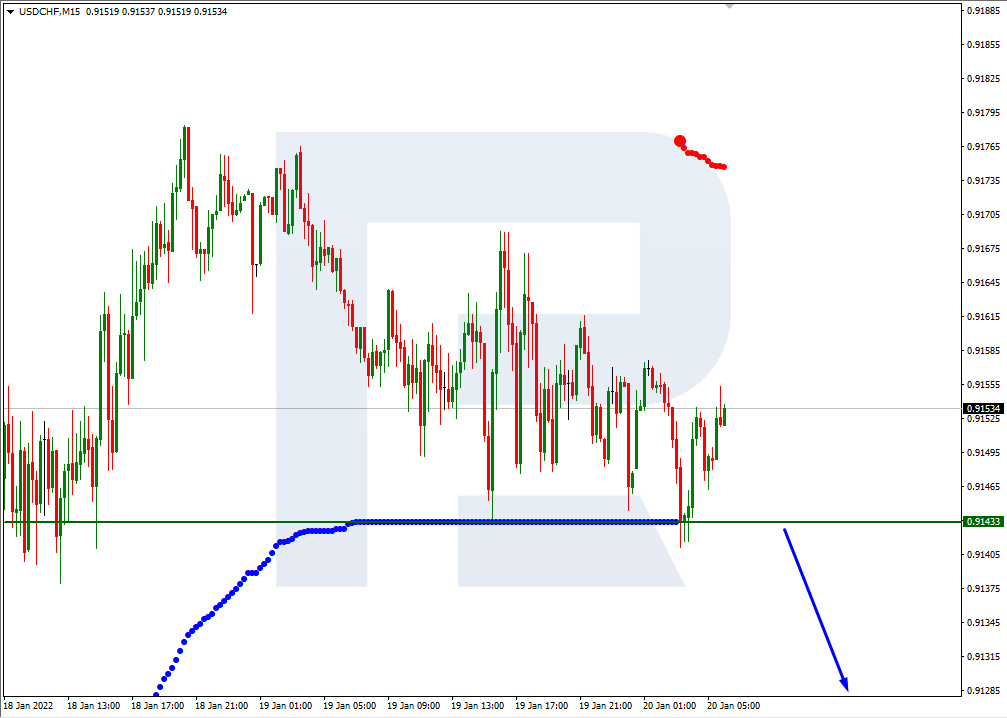
As we can see in the H4 chart, USDCHF is trading below the 200-day Moving Average, thus indicating a possible descending tendency. In this case, the price is expected to test 3/8, break it, and then continue falling to reach the support at 2/8. However, this scenario may be cancelled if the price tests and breaks 5/8 to the upside. After that, the instrument may grow towards the resistance at 7/8.
In the M15 chart, the pair may break the downside line of the VoltyChannel indicator and, as a result, continue trading downwards.
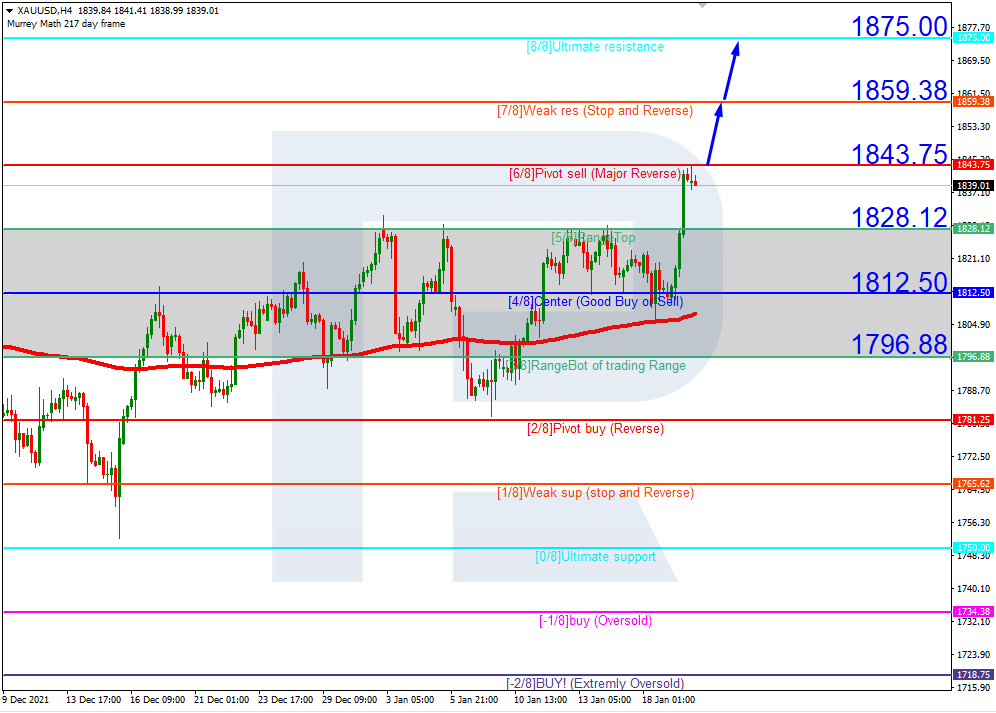
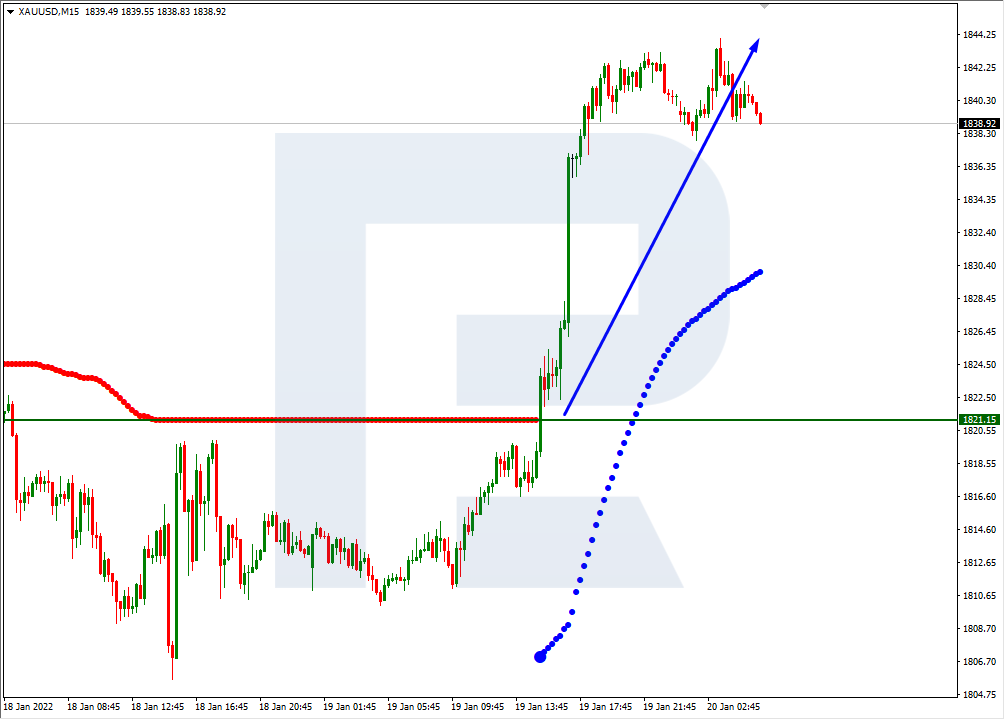
XAUUSD, “Gold vs US Dollar”
In the H4 chart, XAUUSD is trading above the 200-day Moving Average, thus indicating an ascending tendency. In this case, the price is expected to break 6/8 and move upwards to reach the resistance at 8/8. However, this scenario may no longer be valid if the price breaks the support at 5/8 to the downside. After that, the instrument may continue falling towards 3/8.
As we can see in the M15 chart, the pair has broken the upside line of the VoltyChannel indicator and, as a result, may continue growing.
Attention! Forecasts presented in this section only reflect the author’s private opinion and should not be considered as guidance for trading. RoboForex LP bears no responsibility for trading results based on trading recommendations described in these analytical reviews.
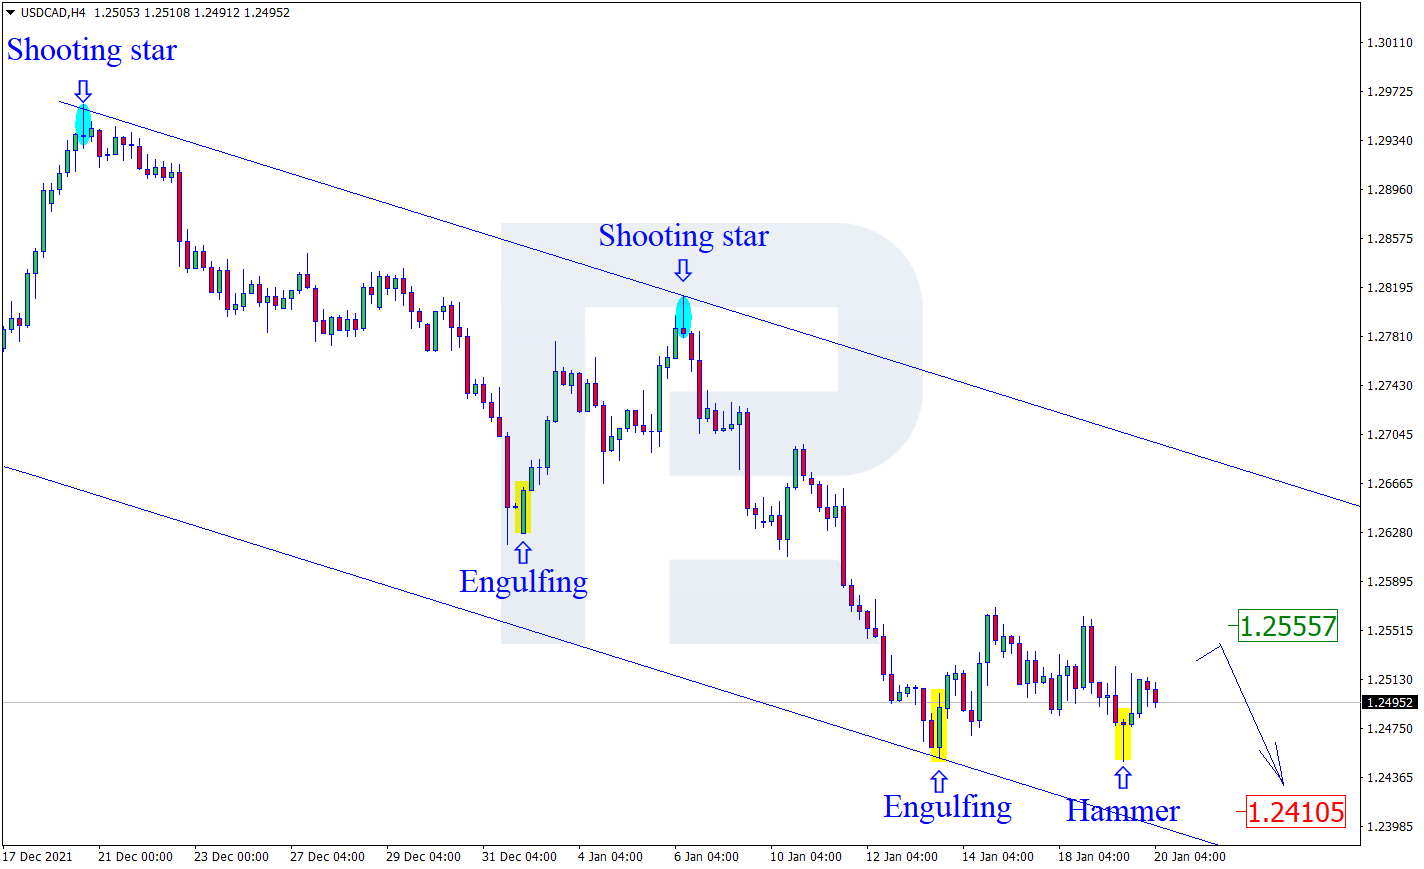
As we can see in the H4 chart, the asset continues moving sideways. After forming several reversal patterns, including Hammer, close to the support level, USDCAD is reversing and may form a new correctional impulse. In this case, the upside target may be the resistance area at 1.2555. However, an alternative scenario implies that the asset may continue falling to reach 1.2410 without forming any corrections.
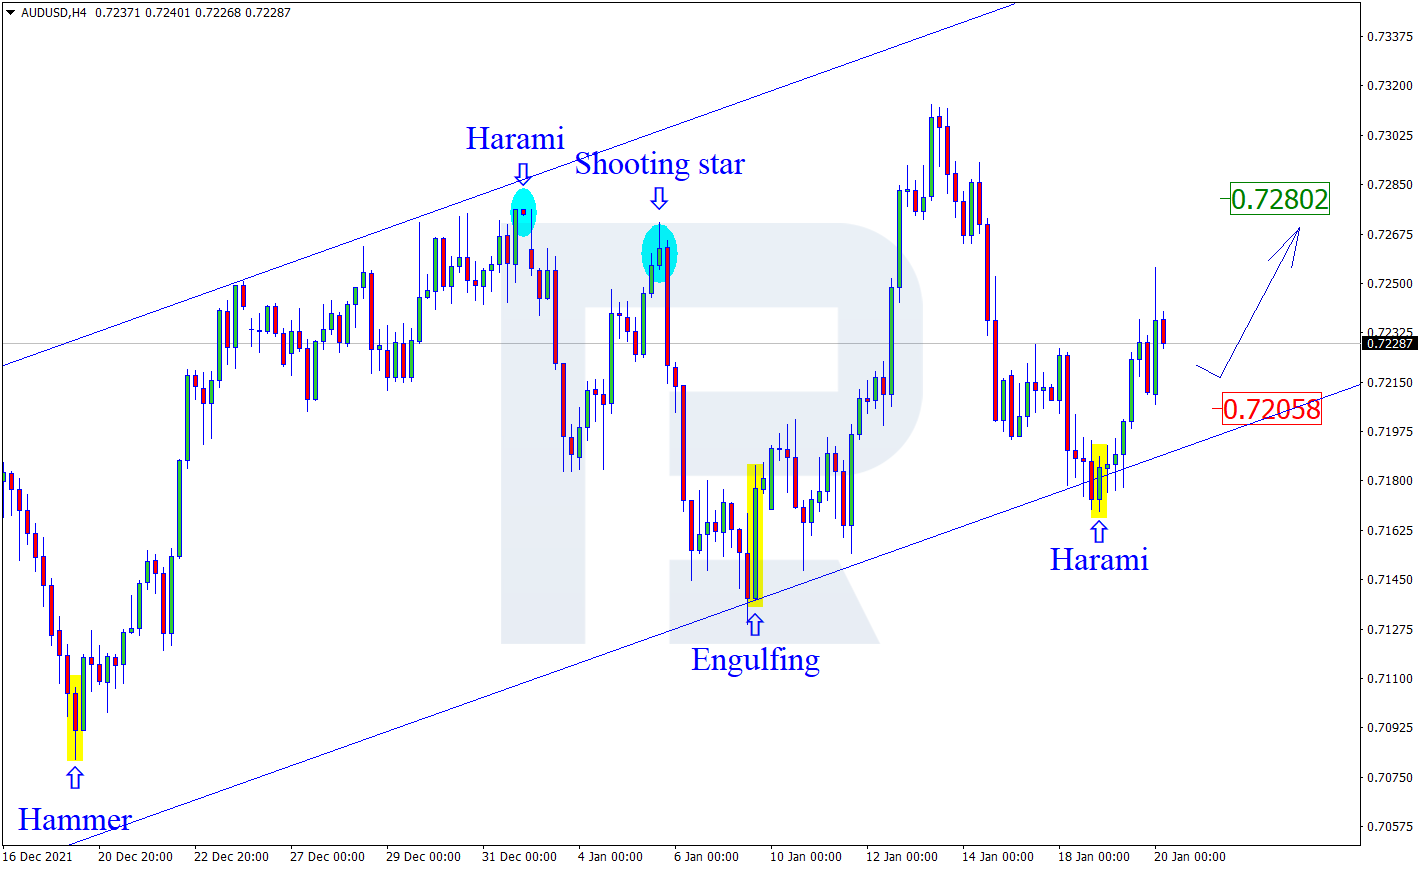
AUDUSD, “Australian Dollar vs US Dollar”
As we can see in the H4 chart, AUDUSD has formed a Harami reversal pattern near the support area. At the moment, the asset is reversing and may start a new growth. In this case, the upside target may be the resistance level at 0.7280. After testing the level, the price may break it and continue the ascending tendency. At the same time, an opposite scenario implies that the price may correct to reach 0.7205 first and then resume its uptrend.
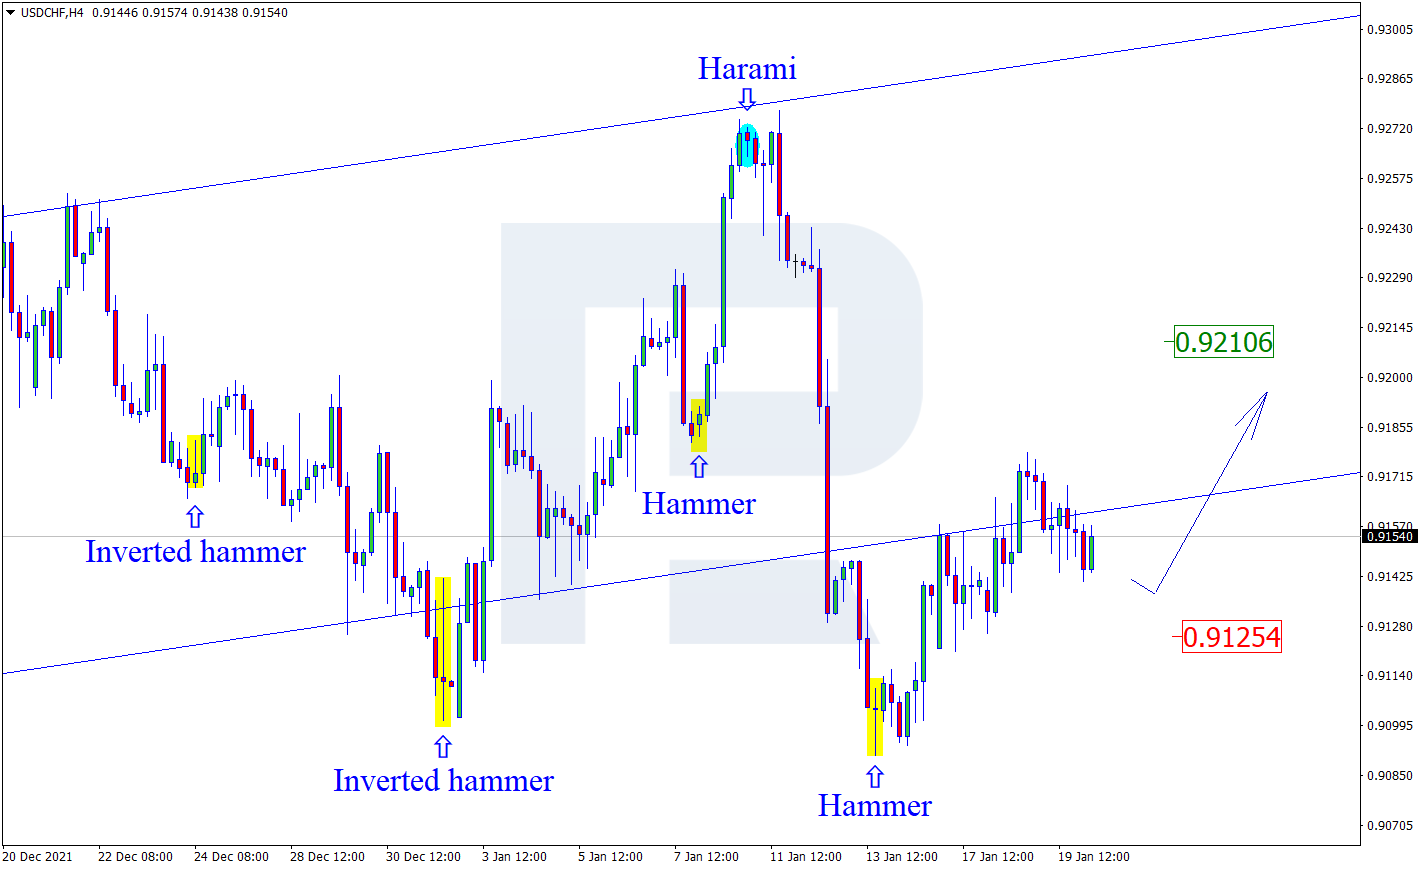
USDCHF, “US Dollar vs Swiss Franc”
As we can see in the H4 chart, after testing the support area, the pair has formed several reversal patterns, for example, Hammer and Engulfing. At the moment, USDCHF may reverse in the form of a new rising wave towards the resistance level. In this case, the upside target may be at 0.9210. Still, there might be an alternative scenario, according to which the asset may correct to reach 0.9125 before resuming its ascending tendency.
Attention! Forecasts presented in this section only reflect the author’s private opinion and should not be considered as guidance for trading. RoboForex LP bears no responsibility for trading results based on trading recommendations described in these analytical reviews.
Germany’s consumer price index increased by 0.5% in December to 3.1% in annual terms. This is the highest level since 1993. At the same time, the ECB balance sheet continues to increase. Aggregate assets rose by another 20.7 billion euros. The ECB continues to stimulate the region’s economy actively. On Wednesday, German 10-year bond yields increased above 0% for the first time since 2019, providing support for the euro. Eurozone inflation data will be released today. Analysts expect consumer prices to remain at the same level.
Trading recommendations
Support levels: 1.1320, 1.1305, 1.1288
Resistance levels: 1.1356, 1.1384, 1.1405
From a technical point of view, the EUR/USD on the hour time frame is bearish. The MACD indicator became inactive, with no signs of a reversal. Under such market conditions, it is better to consider sell trades from the resistance levels near the moving average. Buy trades can be considered on the lower time frames from the support level of 1.1320 or 1.1305, but only with additional confirmation in the form of a buyers’ initiative.
Alternative scenario: if the price breaks out through the 1.1405 resistance level and fixes above, the mid-term uptrend will be renewed.
News feed for 2022.01.20:
– German Producer price index (m/m) at 09:00 (GMT+2);
– Eurozone Consumer Price Index (m/m) at 12:00 (GMT+2);
– Eurozone ECB Monetary Policy Statement at 14:30 (GMT+2);
– US Initial Jobless Claims (w/w) at 15:30 (GMT+2);
– US Philadelphia Fed Manufacturing Index (m/m) at 15:30 (GMT+2);
– US Existing Home Sales (m/m) at 17:00 (GMT+2).
The GBP/USD currency pair
Technical indicators of the currency pair:
Prev Open: 1.3588
Prev Close: 1.3612
% chg. over the last day: +0.18%
The UK inflation rate increased from 5.1% to 5.4% in annual terms; it’s a 30-year high. The sharp rise in the CPI is due to higher prices for products made in British factories, energy prices, and rising food prices. Analysts believe that sufficiently sustainable indicators of economic activity and high inflation are likely to convince the Bank of England to raise rates by another 25 bps in February to 0.5%.
Trading recommendations
Support levels: 1.3602, 1.3581, 1.3551, 1.3479
Resistance levels: 1.3661, 1.3689, 1.3715
On the hourly time frame, the GBP/USD trend is bearish. The MACD indicator became inactive, with no signs of a reversal. Under such market conditions, sell deals are best to look at from the resistance level of 1.3661. Buy trades should be considered from the support level of 1.3602, but only with additional confirmation in the form of buyers’ initiative.
Alternative scenario: if the price breaks out through the 1.3661 resistance level and consolidates above, the bearish scenario will be broken.
There is no news feed for today.
The USD/JPY currency pair
Technical indicators of the currency pair:
Prev Open: 114.58
Prev Close: 114.32
% chg. over the last day: -0.23%
Japan’s economic performance is improving despite an increase in Omicron disease. Exports increased by 17.5% in December compared with the previous year. Auto export growth accelerated to 17.5% from 4.1% in November. But despite the “reviving” tendencies of the Japanese economy, experts think that new restrictions, increase in raw material prices, and the stimulating policy of the Bank of Japan will lead to a JPY decline in the coming months.
Trading recommendations
Support levels: 114.25, 113.99, 113.72
Resistance levels: 114.63, 115.04, 115.35, 115.64
The global trend on the USD/JPY currency pair is bearish. The sellers managed to protect the priority change level. Buy deals are best to look at the lower time frames from the nearest support levels. Sell trades can be considered from the resistance level of 114.63, but only with confirmation in the form of a sellers’ initiative, as the monetary policy of the Bank of Japan is now aimed at decreasing the Japanese yen.
Alternative scenario: if the price fixes above 115.04, the uptrend will likely resume.
There is no news feed for today.
The USD/CAD currency pair
Technical indicators of the currency pair:
Prev Open: 1.2512
Prev Close: 1.2514
% chg. over the last day: +0.02%
The Canadian dollar is a commodity currency, so it depends not only on the monetary policy of the Bank of Canada but also on the oil prices and the dollar index. The oil price is traded near its maximum, and the fundamental situation is now in favor of the oil price growth. Inflation in Canada increased to a new 30-year high of 4.8% in annual terms. This adds to analysts’ confidence that Canada’s central bank will raise its interest rate in the near term.
Trading recommendations
Support levels: 1.2483, 1.2427
Resistance levels: 1.2558, 1.2628, 1.2678, 1.2715
From a technical point of view, the USD/CAD currency pair is bearish. The price is now trading in a corridor with a range of 1.2483-1.2558. The MACD indicator has become inactive. Under such market conditions, it is better to look for buy deals from the level of 1.2483 on the lower time frames. It is better to consider sell deals from the upper border of the range of 1.2558.
Alternative scenario: if the price breaks through the 1.2575 resistance level and fixes above, the downtrend is likely to be broken.
This article reflects a personal opinion and should not be interpreted as an investment advice, and/or offer, and/or a persistent request for carrying out financial transactions, and/or a guarantee, and/or a forecast of future events.
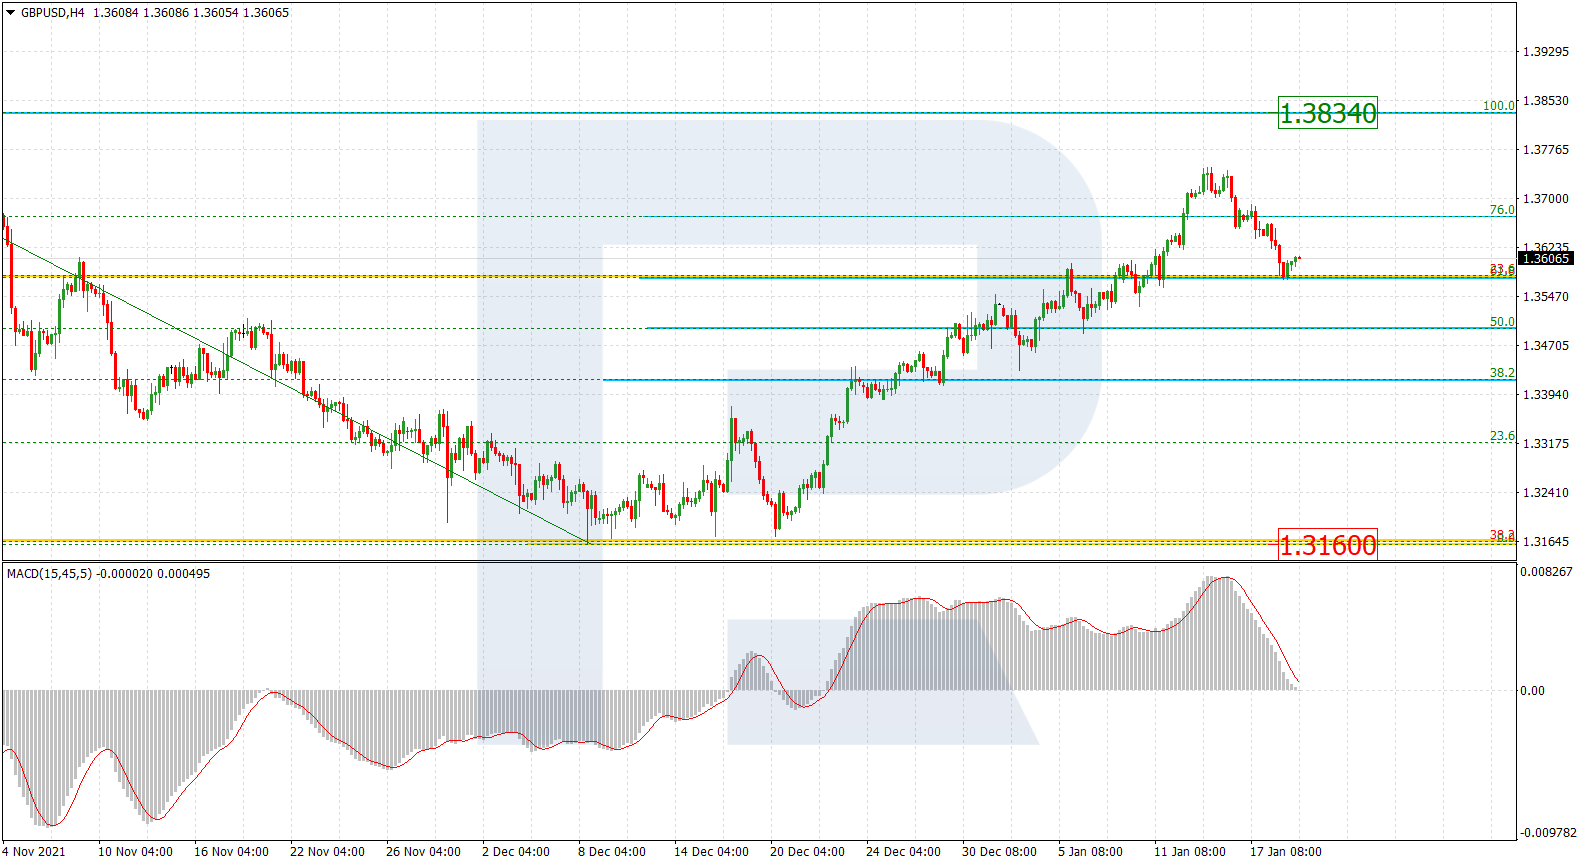
As we can see in the H4 chart, after an attempt to test and break 76.0% fibo, GBPUSD has started a new decline, which may transform into a proper descending wave towards the low at 1.3160. The key resistance and the next upside target are the high at 1.3834.
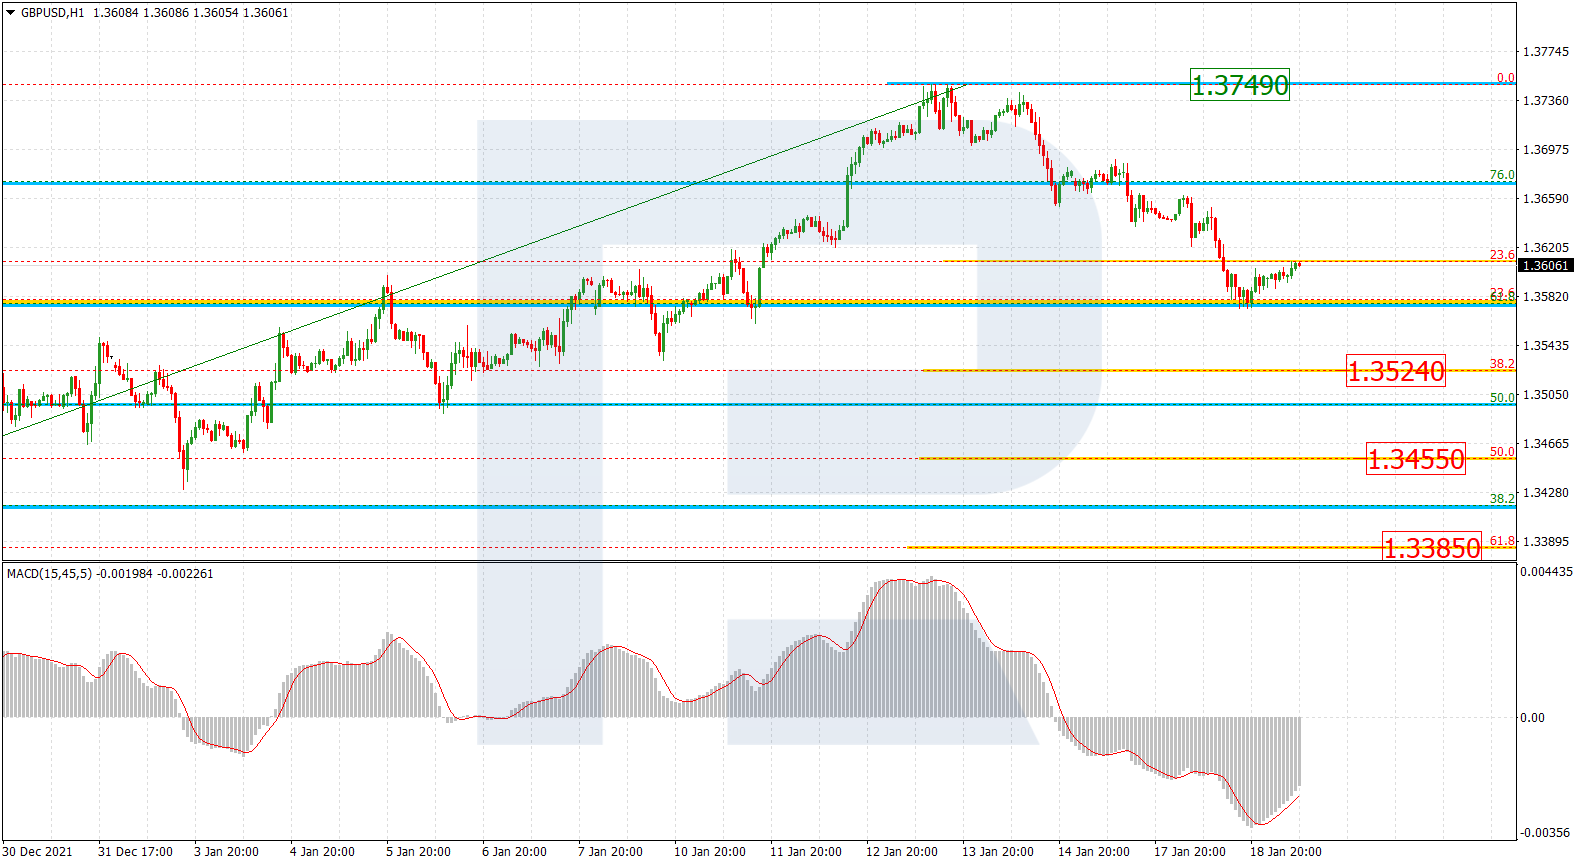
The H1 chart shows a more detailed structure of the current correctional downtrend. By now, the descending wave has reached 23.6% fibo and may later continue towards 38.2%, 50.0%, and 61.8% fibo at 1.3524, 1.3455, and 1.3385 respectively. The local resistance is the high at 1.3749.
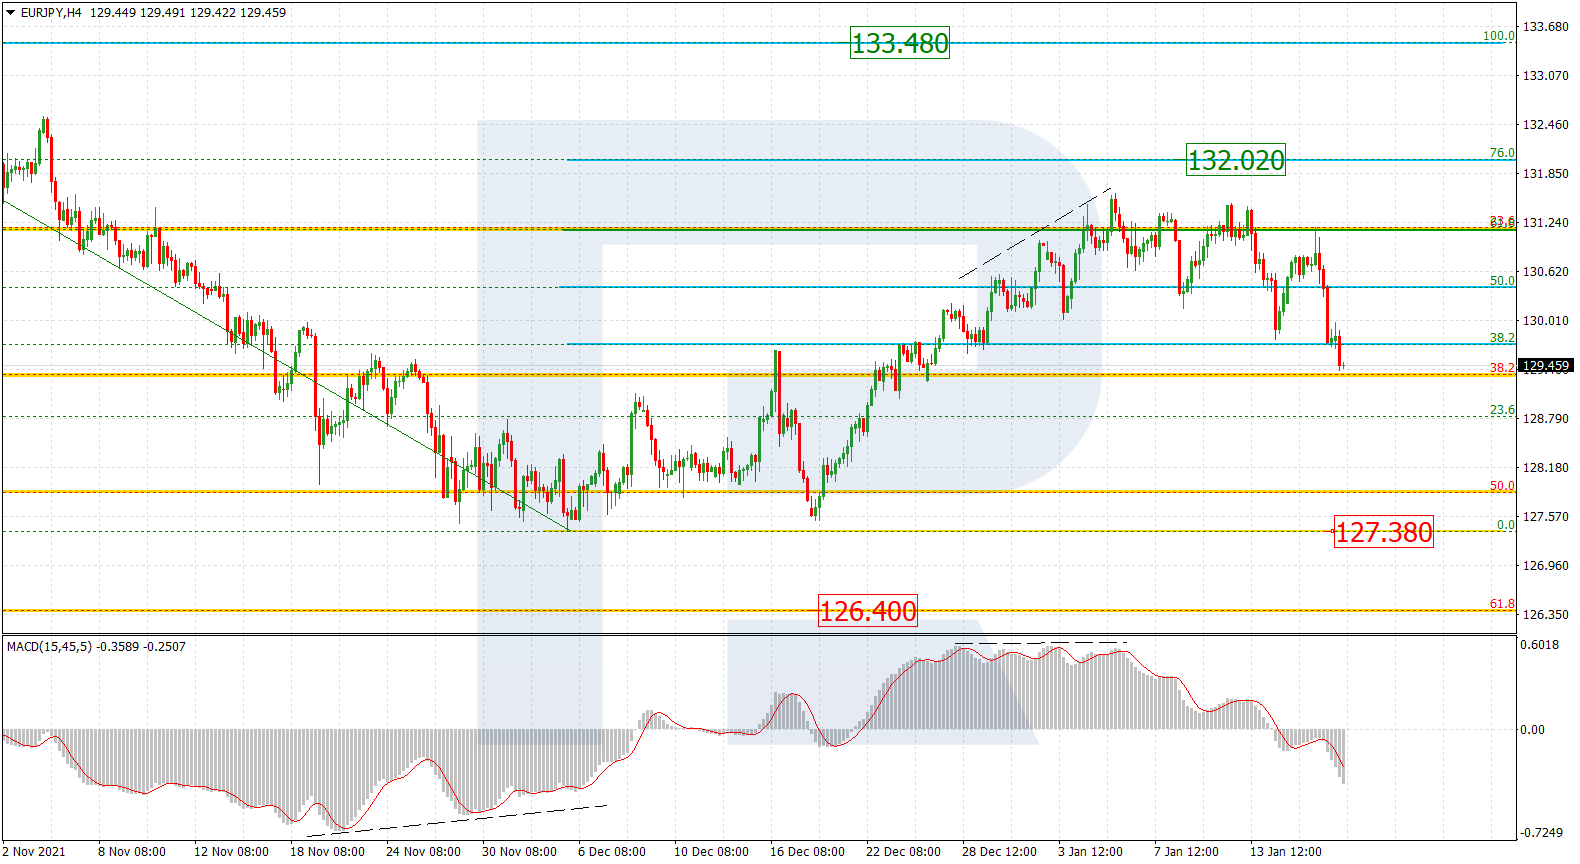
EURJPY, “Euro vs. Japanese Yen”
As we can see in the H4 chart, EURJPY is moving upwards after divergence on MACD. In this case, the asset may fall to break the low at 127.38 and then continue trading downwards to reach the long-term 61.8% fibo at 126.40.
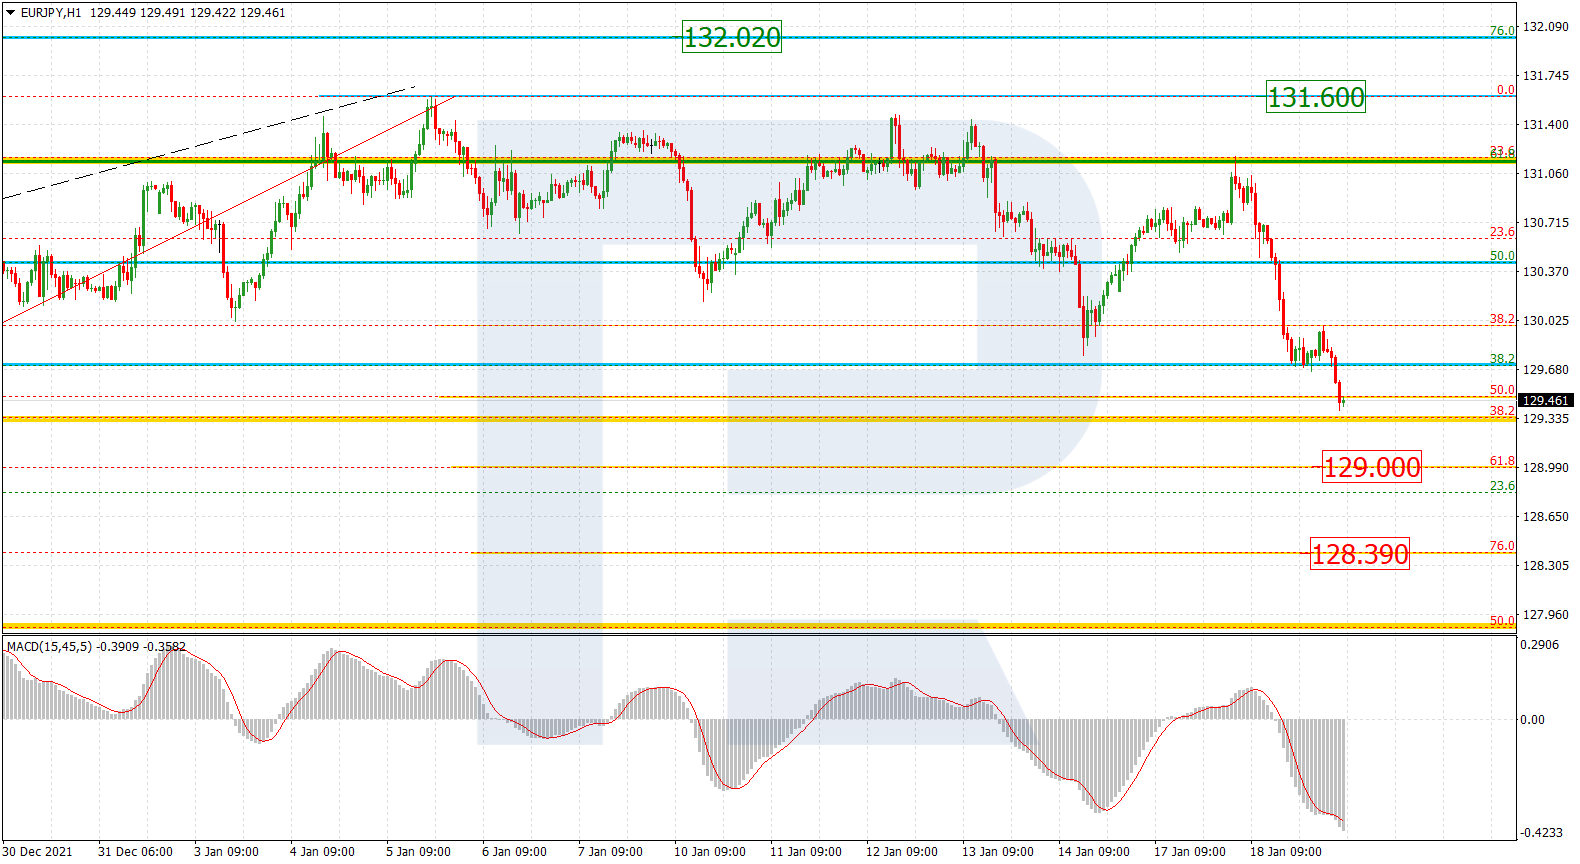
The H1 chart shows that the pair is falling; it has already reached 50.0% fibo and may later continue towards 61.8% and 76.0% fibo at 129.00 and 128.39 respectively. The key resistance is the local high at 131.60.
Attention! Forecasts presented in this section only reflect the author’s private opinion and should not be considered as guidance for trading. RoboForex LP bears no responsibility for trading results based on trading recommendations described in these analytical reviews.
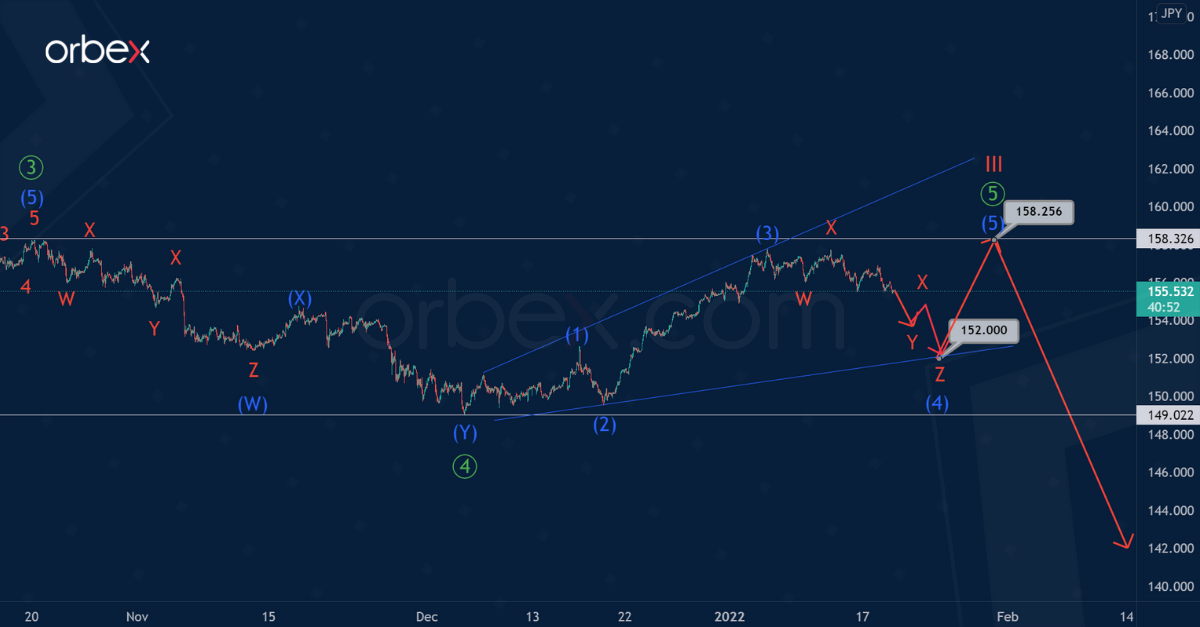
The GBPJPY currency pair is most likely moving within the cycle impulse, with wave III under development.
We can assume that the correction wave ④ of the primary degree ended at the end of December. This correction took the form of an intermediate triple zigzag.
Since then, we have observed a rise in the price in the primary wave ⑤. In turn, this takes the form of an intermediate 5-wave impulse (1)-(2)-(3)-(4)-(5).
The entire primary wave ⑤ can complete its pattern near 163.52. At that level, it will be at 61.8% of wave ③.
Alternatively, the primary wave ⑤ is not an impulse, but an ending diagonal in which an intermediate correction wave (4) is under construction.
Perhaps wave (4) will be a triple W-X-Y-X-Z zigzag of the minor degree, as shown in the chart. In the near future, prices could lower in the minor sub-waves Y-X-Z to the level of 152.00.
After reaching the specified price level, the price is likely to increase within the final intermediate wave (5) to the previous maximum of 158.25.
Orbex is a fully licensed broker that was established in 2011. Founded with a mission to serve its traders responsibly and provides traders with access to the world’s largest and most liquid financial markets. www.orbex.com
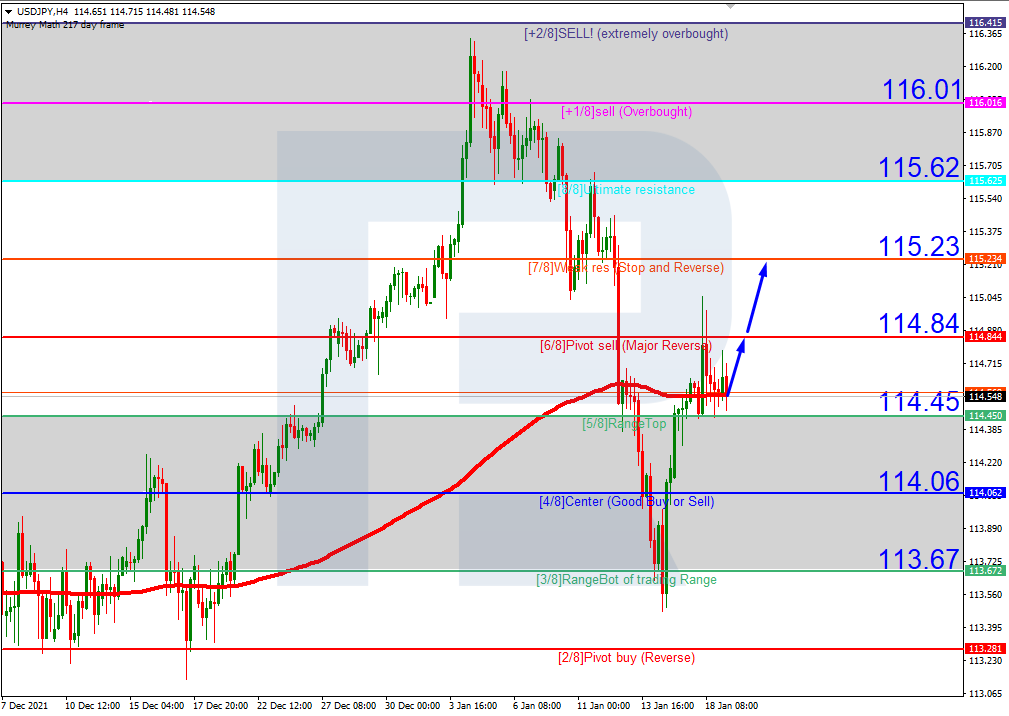
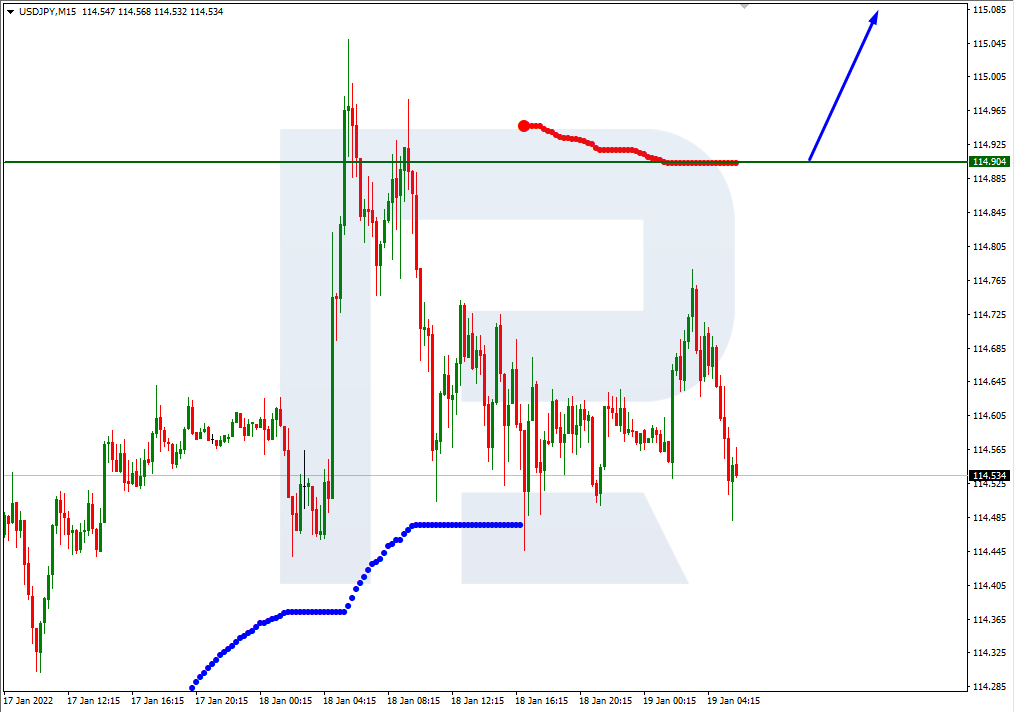
As we can see in the H4 chart, after breaking the 200-day Moving Average, USDJPY is trading above it, thus indicating a possible ascending tendency. In this case, the price is expected to test 6/8, break it, and then continue growing to reach the resistance at 7/8. However, this scenario may no longer be valid if the price breaks 5/8 to the downside. After that, the instrument may reverse and fall towards the support at 3/8.
In the M15 chart, the pair may break the upside line of the VoltyChannel indicator and, as a result, continue growing.
USDCAD, “US Dollar vs Canadian Dollar”
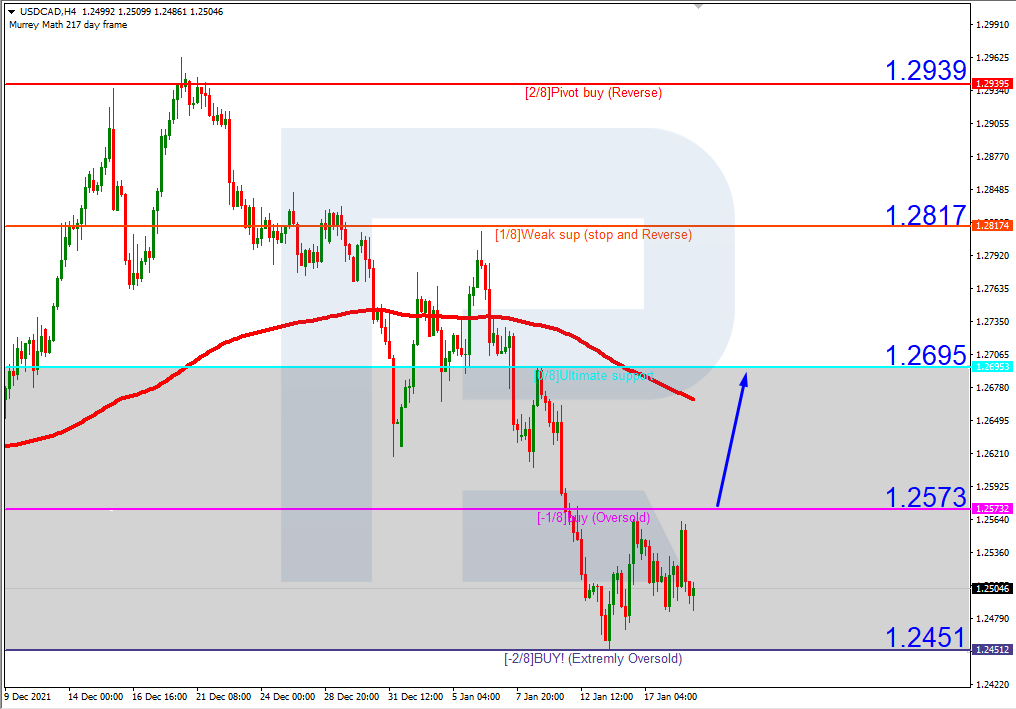
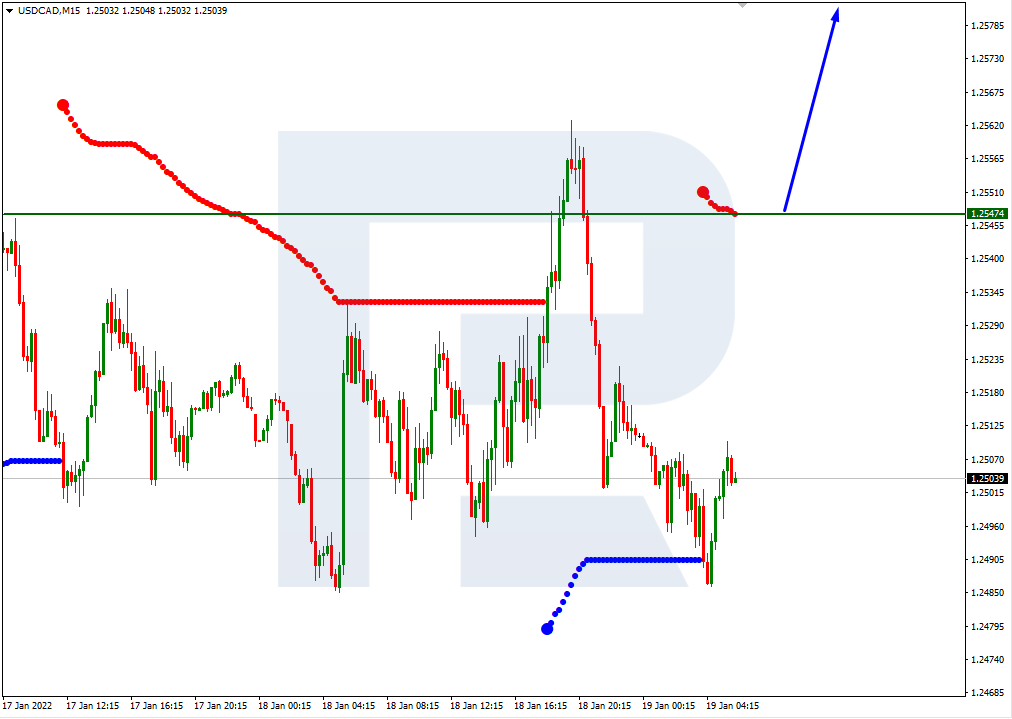
As we can see in the H4 chart, USDCAD is trading within the “oversold area”. In this case, the price is expected to test -1/8, break it, and continue growing towards the resistance at 0/8. Still, this scenario may no longer be valid if the price breaks the support at -2/8 to the downside. After that, the lines in the chart will be redrawn, thus helping us to define new downside targets.
In the M15 chart, the pair may break the upside line of the VoltyChannel indicator and, as a result, continue trading downwards to reach 0/8 in the H4 chart.
Attention! Forecasts presented in this section only reflect the author’s private opinion and should not be considered as guidance for trading. RoboForex LP bears no responsibility for trading results based on trading recommendations described in these analytical reviews.
The sterling fell back after a slowdown in Britain’s wage growth in November. Sentiment favors the pound after it rallied above the daily resistance at 1.3700.
However, an overbought RSI has cut back buyers’ appetite. A break below 1.3630 has prompted some traders to take profit, driving down the price.
As the RSI dips into the oversold zone, 1.3570 is the next support. A bearish breakout would send the pair to 1.3480 which sits on the 30-day moving average. 1.3660 is the immediate resistance when a rebound takes shape.
USDJPY struggles to bounce
The yen softened after the Bank of Japan signaled no shift in its ultra-loose monetary policy. The US dollar bounced off the critical floor at 113.50 from the daily chart.
A bullish RSI divergence revealed a deceleration in the downward impetus. The indicator’s oversold situation also attracted a number of bargain hunters.
A break above 114.70 suggests a strong interest in keeping the correction in check. 115.50 from the latest sell-off is a major hurdle and its breach could extend the rally to the recent peak at 116.30.
SPX 500 to test daily support
The S&P 500 extended losses over rising rate worries. The fall below 4640 invalidates the latest rebound and indicates that sentiment is still downbeat.
Below the psychological level of 4600, 4540 is a key support near last December’s lows on the daily chart. A bearish breakout would trigger a deeper correction towards 4400, the origin of the October rally.
An oversold RSI may cause a limited rebound. Nonetheless, the bulls need to clear offers around 4675 and then 4745 to gain momentum.
Orbex is a fully licensed broker that was established in 2011. Founded with a mission to serve its traders responsibly and provides traders with access to the world’s largest and most liquid financial markets. www.orbex.com
According to data from the ZEW Institute, economic sentiment in Germany and the Eurozone has improved significantly over the past month. At the same time, inflation expectations have declined. More than half of analysts expect inflation to decline in the region over the next six months. With a high probability, the ECB will not change its monetary policy before the end of the year, so the euro has no fundamental support, unlike the dollar index, where the US Federal Reserve will hike rates soon.
Trading recommendations
Support levels: 1.1320, 1.1305, 1.1288
Resistance levels: 1.1356, 1.1384, 1.1405
From a technical point of view, the EUR/USD on the hour time frame has changed to bearish. The price broke through the priority change level and consolidated lower. The MACD indicator became negative, with no signs of a reversal. Under such market conditions, it is better to consider sell trades from the resistance levels near the moving average, as the price has deviated strongly from the average values. Buy trades can be considered on the lower time frames from the support level of 1.1320 or 1.1305, but only with additional confirmation in the form of a buyers’ initiative.
Alternative scenario: if the price breaks out through the 1.1405 resistance level and fixes above, the mid-term uptrend will be renewed.
News feed for 2022.01.19:
– German Consumer Price Index (m/m) at 09:00 (GMT+2);
– US Building Permits (m/m) at 15:30 (GMT+2).
The GBP/USD currency pair
Technical indicators of the currency pair:
Prev Open: 1.3642
Prev Close: 1.3597
% chg. over the last day: -0.33%
Labor market statistics showed that the UK was facing wage cuts. At the same time, the unemployment rate fell from 4.2% to 4.1%. Inflation data will be released today. Analysts expect inflation in December to rise to its highest level in a decade. The Bank of England has warned that inflation could peak close to 6% in April, up from the current level of 5.1%. Rising inflation will further increase the probability of an interest rate hike at the next Bank of England meeting.
Trading recommendations
Support levels: 1.3581, 1.3551, 1.3479
Resistance levels: 1.3620, 1.3661, 1.3689, 1.3715
On the hourly time frame, the GBP/USD trend has changed to bearish. The price broke through the priority change level and consolidated lower. The MACD indicator became negative, with no signs of a reversal. Under such market conditions, sell deals are best to look at from the resistance level of 1.3620 or 1.3661. Buy trades should be considered from the support level of 1.3580, but only with additional confirmation in the form of buyers’ initiative.
Alternative scenario: if the price breaks out through the 1.3661 resistance level and consolidates above, the bearish scenario will be broken.
News feed for 2022.01.19:
– UK Consumer Price Index (m/m) at 09:00 (GMT+2);
– UK BoE Gov Bailey Speaks at 16:15 (GMT+2).
The USD/JPY currency pair
Technical indicators of the currency pair:
Prev Open: 114.59
Prev Close: 114.58
% chg. over the last day: -0.01%
Prime Minister Kishida intends to declare a state of emergency in certain regions of Japan from January 21 to February 13. This is likely to lead to a slowdown in economic activity. But the Japanese Yen is strengthening now due to investors returning to safe-haven currencies as traders start to fear another hawkish surprise from the Federal Reserve, which is expected to meet next week.
Trading recommendations
Support levels: 114.25, 113.99, 113.72
Resistance levels: 114.63, 115.04, 115.35, 115.64
The global trend on the USD/JPY currency pair is bearish. The sellers managed to protect the priority change level. Buy deals are best to look at the lower time frames from the nearest support levels. Sell trades can be considered from the resistance level of 114.63, but only with confirmation in the form of a sellers’ initiative, as the monetary policy of the Bank of Japan is now aimed at decreasing the Japanese yen.
Alternative scenario: if the price fixes above 115.04, the uptrend will likely resume.
There is no news feed for today.
The USD/CAD currency pair
Technical indicators of the currency pair:
Prev Open: 1.2514
Prev Close: 1.2511
% chg. over the last day: -0.02%
The Canadian dollar is a commodity currency, so it depends not only on the monetary policy of the Bank of Canada but also on the oil prices and the dollar index. The price of Brent oil reached $88 per barrel for the first time since October 2014. Analysts point out that the demand for oil in the last three months was higher than previously expected. The fundamental situation is now in favor of the growth of oil prices. Therefore, with the Bank of Canada also set to hike rates, the Canadian dollar will be strong.
Trading recommendations
Support levels: 1.2490, 1.2427
Resistance levels: 1.2558, 1.2628, 1.2678, 1.2715
From a technical point of view, the USD/CAD currency pair is bearish. The price is now trading in a corridor with a range of 1.2490-1.2558. The MACD indicator has become inactive. Under such market conditions, it is better to look for buy deals from the level of 1.2490 on the lower time frames. It is better to consider sell deals from the upper border of the range of 1.2558.
Alternative scenario: if the price breaks through the 1.2575 resistance level and fixes above, the downtrend is likely to be broken.
News feed for 2022.01.19:
– Canada Consumer Price Index (m/m) at 15:30 (GMT+2).
This article reflects a personal opinion and should not be interpreted as an investment advice, and/or offer, and/or a persistent request for carrying out financial transactions, and/or a guarantee, and/or a forecast of future events.