By InvestMacro | COT | Data Tables | COT Leaders | Downloads | COT Newsletter
Here are the latest charts and statistics for the Commitment of Traders (COT) data published by the Commodities Futures Trading Commission (CFTC).
The latest COT data is updated through Tuesday February 8th and shows a quick view of how large traders (for-profit speculators and commercial entities) were positioned in the futures markets. All currency positions are in direct relation to the US dollar where, for example, a bet for the euro is a bet that the euro will rise versus the dollar while a bet against the euro will be a bet that the euro will decline versus the dollar.
Highlighting the COT currency data was the strong gains in bullish bets for the Brazilian Real currency futures contracts. Real speculators boosted their bullish bets this week by the largest one-week amount (+33,599 contracts) on record, according the CFTC data going back to 1995. This surge in bullish sentiment pushed the overall net speculator standing for Brazilian Reals into bullish territory for the first time in nineteen weeks, dating back to September 28th.
There has been a surge of trading going on in this market over the past couple of weeks with open interest increasing dramatically. Open interest (OI) for the Brazilian currency jumped on February 2nd to a total of 76,175 contracts which marked the highest OI level of the previous 381 weeks, dating all the way back to September of 2014. The previous ten weeks had seen an average open interest of less than half (ten week average of 33,492 contracts) of the February 2nd total. This week’s open interest fell a bit to 64,283 contracts but still was the second highest open interest of the past thirty-six weeks and with all this activity going on, this is a currency to watch.
Joining the Brazil real (33,599 contracts) with positive changes this week were the Euro (9,126 contracts), Japanese yen (1,492 contracts), British pound sterling (15,060 contracts), New Zealand dollar (1,332 contracts), Mexican peso (514 contracts) and the Russian ruble (1,292 contracts).
The currencies with declining bets were the US Dollar Index (-806 contracts), Australian dollar (-5,912 contracts), Canadian dollar (-3,378 contracts), Swiss franc (-1,160 contracts) and the Bitcoin futures (-460 contracts).
| Feb-08-2022 | OI | OI-Index | Spec-Net | Spec-Index | Com-Net | COM-Index | Smalls-Net | Smalls-Index |
|---|
| USD Index | 53,603 | 75 | 33,765 | 84 | -40,826 | 7 | 7,061 | 94 |
| EUR | 700,098 | 83 | 38,842 | 47 | -73,252 | 55 | 34,410 | 31 |
| GBP | 197,948 | 37 | -8,545 | 68 | 9,323 | 35 | -778 | 54 |
| JPY | 196,478 | 53 | -59,148 | 31 | 75,957 | 74 | -16,809 | 13 |
| CHF | 41,481 | 16 | -9,399 | 54 | 16,918 | 50 | -7,519 | 41 |
| CAD | 145,208 | 27 | 14,886 | 62 | -16,958 | 45 | 2,072 | 34 |
| AUD | 196,403 | 80 | -85,741 | 5 | 98,357 | 92 | -12,616 | 22 |
| NZD | 54,877 | 53 | -10,366 | 54 | 12,733 | 50 | -2,367 | 25 |
| MXN | 134,257 | 19 | 1,244 | 28 | -4,073 | 71 | 2,829 | 55 |
| RUB | 39,233 | 35 | 15,443 | 50 | -16,839 | 47 | 1,396 | 72 |
| BRL | 64,283 | 81 | 20,246 | 96 | -22,432 | 4 | 2,186 | 92 |
| Bitcoin | 9,886 | 50 | -319 | 90 | -189 | 0 | 508 | 24 |
US Dollar Index Futures:
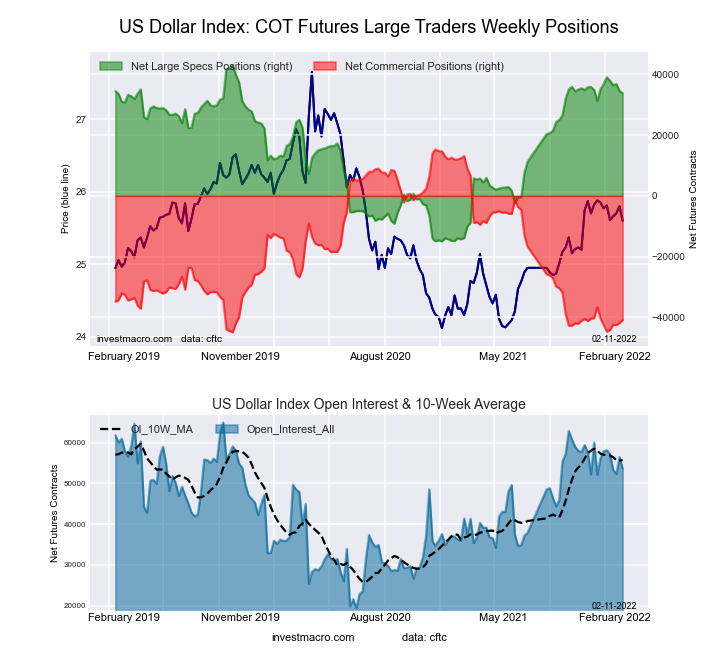 The US Dollar Index large speculator standing this week was a net position of 33,765 contracts in the data reported through Tuesday. This was a weekly fall of -806 contracts from the previous week which had a total of 34,571 net contracts.
This week’s current strength score (the trader positioning range over the past three years, measured from 0 to 100) shows the speculators are currently Bullish-Extreme with a score of 84.0 percent. The commercials are Bearish-Extreme with a score of 6.8 percent and the small traders (not shown in chart) are Bullish-Extreme with a score of 93.8 percent.
| US DOLLAR INDEX Statistics | SPECULATORS | COMMERCIALS | SMALL TRADERS |
| – Percent of Open Interest Longs: | 75.3 | 5.9 | 16.5 |
| – Percent of Open Interest Shorts: | 12.3 | 82.0 | 3.3 |
| – Net Position: | 33,765 | -40,826 | 7,061 |
| – Gross Longs: | 40,370 | 3,150 | 8,841 |
| – Gross Shorts: | 6,605 | 43,976 | 1,780 |
| – Long to Short Ratio: | 6.1 to 1 | 0.1 to 1 | 5.0 to 1 |
| NET POSITION TREND: | | | |
| – Strength Index Score (3 Year Range Pct): | 84.0 | 6.8 | 93.8 |
| – Strength Index Reading (3 Year Range): | Bullish-Extreme | Bearish-Extreme | Bullish-Extreme |
| NET POSITION MOVEMENT INDEX: | | | |
| – 6-Week Change in Strength Index: | -5.2 | 2.7 | 15.2 |
Euro Currency Futures:
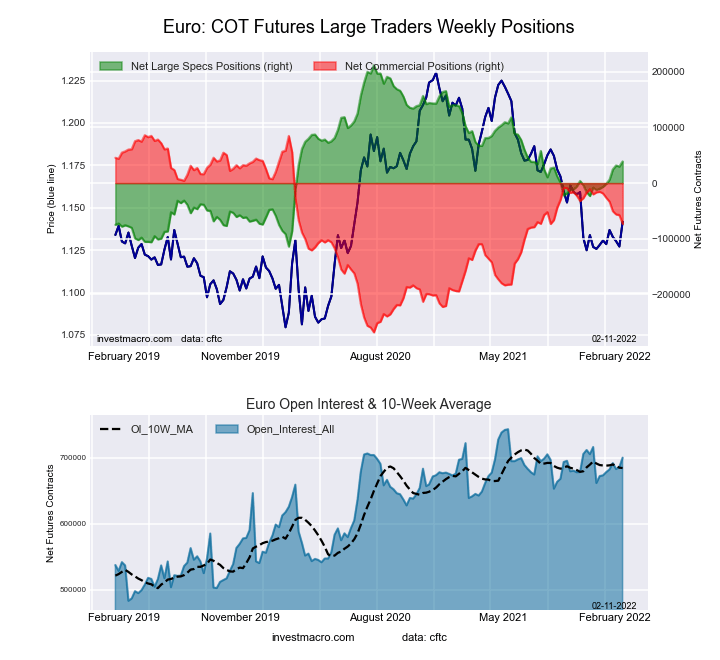 The Euro Currency large speculator standing this week was a net position of 38,842 contracts in the data reported through Tuesday. This was a weekly increase of 9,126 contracts from the previous week which had a total of 29,716 net contracts.
This week’s current strength score (the trader positioning range over the past three years, measured from 0 to 100) shows the speculators are currently Bearish with a score of 46.9 percent. The commercials are Bullish with a score of 55.0 percent and the small traders (not shown in chart) are Bearish with a score of 31.4 percent.
| EURO Currency Statistics | SPECULATORS | COMMERCIALS | SMALL TRADERS |
| – Percent of Open Interest Longs: | 31.3 | 54.6 | 12.5 |
| – Percent of Open Interest Shorts: | 25.7 | 65.1 | 7.6 |
| – Net Position: | 38,842 | -73,252 | 34,410 |
| – Gross Longs: | 218,973 | 382,426 | 87,725 |
| – Gross Shorts: | 180,131 | 455,678 | 53,315 |
| – Long to Short Ratio: | 1.2 to 1 | 0.8 to 1 | 1.6 to 1 |
| NET POSITION TREND: | | | |
| – Strength Index Score (3 Year Range Pct): | 46.9 | 55.0 | 31.4 |
| – Strength Index Reading (3 Year Range): | Bearish | Bullish | Bearish |
| NET POSITION MOVEMENT INDEX: | | | |
| – 6-Week Change in Strength Index: | 14.0 | -15.5 | 15.3 |
British Pound Sterling Futures:
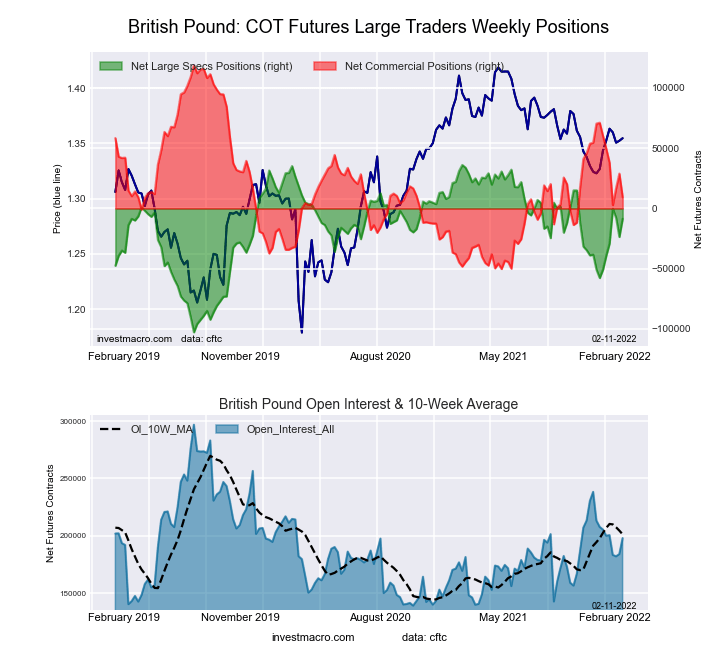 The British Pound Sterling large speculator standing this week was a net position of -8,545 contracts in the data reported through Tuesday. This was a weekly gain of 15,060 contracts from the previous week which had a total of -23,605 net contracts.
This week’s current strength score (the trader positioning range over the past three years, measured from 0 to 100) shows the speculators are currently Bullish with a score of 67.8 percent. The commercials are Bearish with a score of 35.2 percent and the small traders (not shown in chart) are Bullish with a score of 54.0 percent.
| BRITISH POUND Statistics | SPECULATORS | COMMERCIALS | SMALL TRADERS |
| – Percent of Open Interest Longs: | 22.6 | 60.7 | 13.6 |
| – Percent of Open Interest Shorts: | 26.9 | 56.0 | 14.0 |
| – Net Position: | -8,545 | 9,323 | -778 |
| – Gross Longs: | 44,709 | 120,220 | 26,951 |
| – Gross Shorts: | 53,254 | 110,897 | 27,729 |
| – Long to Short Ratio: | 0.8 to 1 | 1.1 to 1 | 1.0 to 1 |
| NET POSITION TREND: | | | |
| – Strength Index Score (3 Year Range Pct): | 67.8 | 35.2 | 54.0 |
| – Strength Index Reading (3 Year Range): | Bullish | Bearish | Bullish |
| NET POSITION MOVEMENT INDEX: | | | |
| – 6-Week Change in Strength Index: | 30.4 | -30.0 | 17.8 |
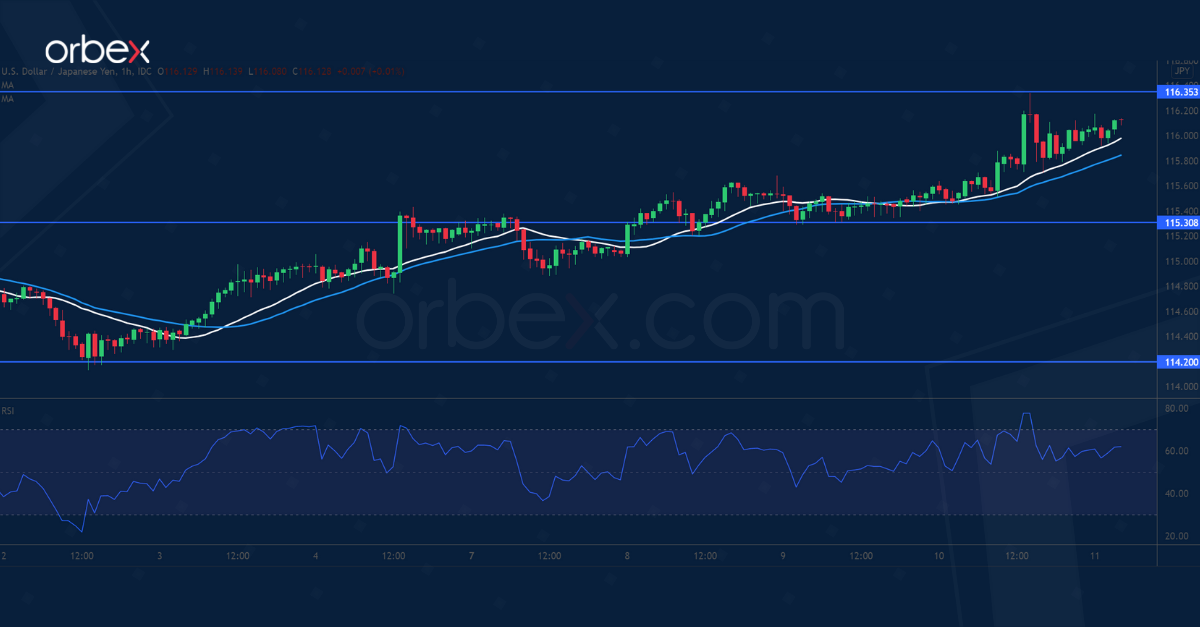
Japanese Yen Futures:
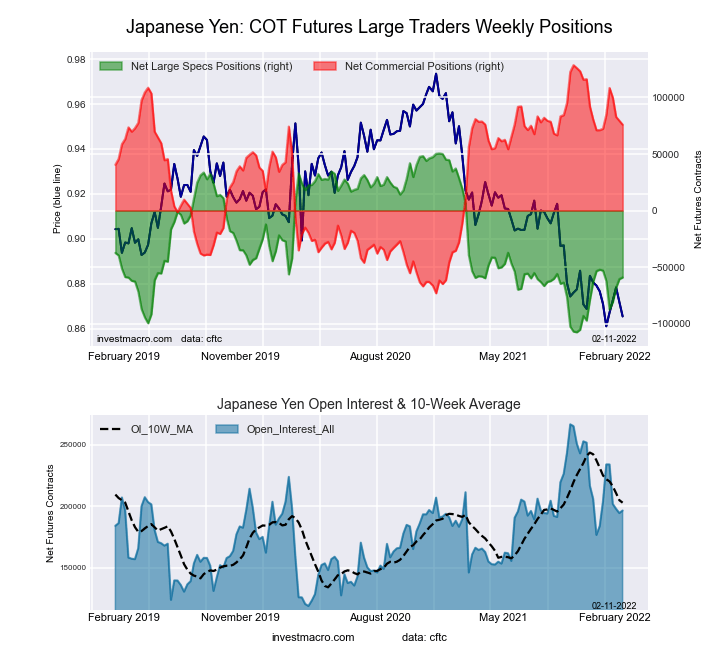 The Japanese Yen large speculator standing this week was a net position of -59,148 contracts in the data reported through Tuesday. This was a weekly boost of 1,492 contracts from the previous week which had a total of -60,640 net contracts.
This week’s current strength score (the trader positioning range over the past three years, measured from 0 to 100) shows the speculators are currently Bearish with a score of 30.7 percent. The commercials are Bullish with a score of 73.9 percent and the small traders (not shown in chart) are Bearish-Extreme with a score of 13.5 percent.
| JAPANESE YEN Statistics | SPECULATORS | COMMERCIALS | SMALL TRADERS |
| – Percent of Open Interest Longs: | 8.0 | 81.2 | 9.0 |
| – Percent of Open Interest Shorts: | 38.1 | 42.6 | 17.5 |
| – Net Position: | -59,148 | 75,957 | -16,809 |
| – Gross Longs: | 15,692 | 159,601 | 17,609 |
| – Gross Shorts: | 74,840 | 83,644 | 34,418 |
| – Long to Short Ratio: | 0.2 to 1 | 1.9 to 1 | 0.5 to 1 |
| NET POSITION TREND: | | | |
| – Strength Index Score (3 Year Range Pct): | 30.7 | 73.9 | 13.5 |
| – Strength Index Reading (3 Year Range): | Bearish | Bullish | Bearish-Extreme |
| NET POSITION MOVEMENT INDEX: | | | |
| – 6-Week Change in Strength Index: | -3.8 | 1.8 | 5.3 |
Swiss Franc Futures:
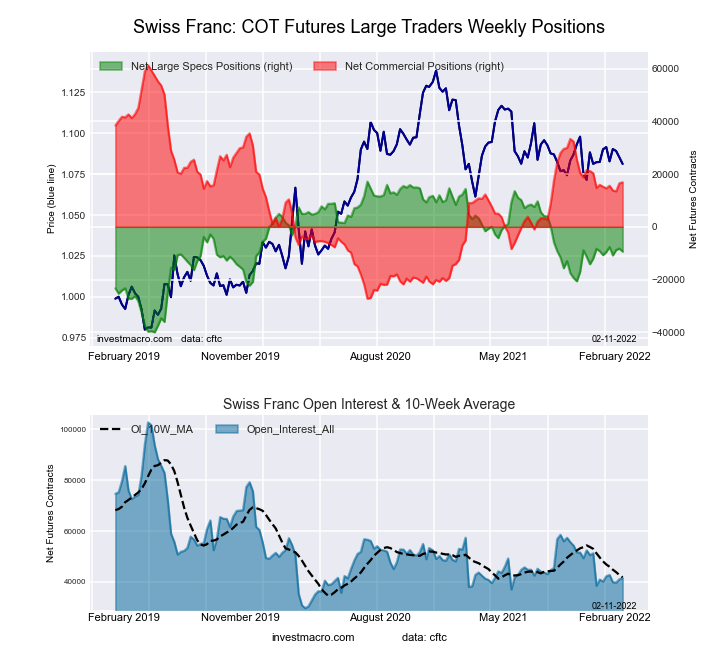 The Swiss Franc large speculator standing this week was a net position of -9,399 contracts in the data reported through Tuesday. This was a weekly decline of -1,160 contracts from the previous week which had a total of -8,239 net contracts.
This week’s current strength score (the trader positioning range over the past three years, measured from 0 to 100) shows the speculators are currently Bullish with a score of 53.5 percent. The commercials are Bearish with a score of 49.9 percent and the small traders (not shown in chart) are Bearish with a score of 41.2 percent.
| SWISS FRANC Statistics | SPECULATORS | COMMERCIALS | SMALL TRADERS |
| – Percent of Open Interest Longs: | 3.0 | 72.8 | 23.7 |
| – Percent of Open Interest Shorts: | 25.6 | 32.1 | 41.8 |
| – Net Position: | -9,399 | 16,918 | -7,519 |
| – Gross Longs: | 1,234 | 30,215 | 9,838 |
| – Gross Shorts: | 10,633 | 13,297 | 17,357 |
| – Long to Short Ratio: | 0.1 to 1 | 2.3 to 1 | 0.6 to 1 |
| NET POSITION TREND: | | | |
| – Strength Index Score (3 Year Range Pct): | 53.5 | 49.9 | 41.2 |
| – Strength Index Reading (3 Year Range): | Bullish | Bearish | Bearish |
| NET POSITION MOVEMENT INDEX: | | | |
| – 6-Week Change in Strength Index: | 2.3 | 1.9 | -8.8 |
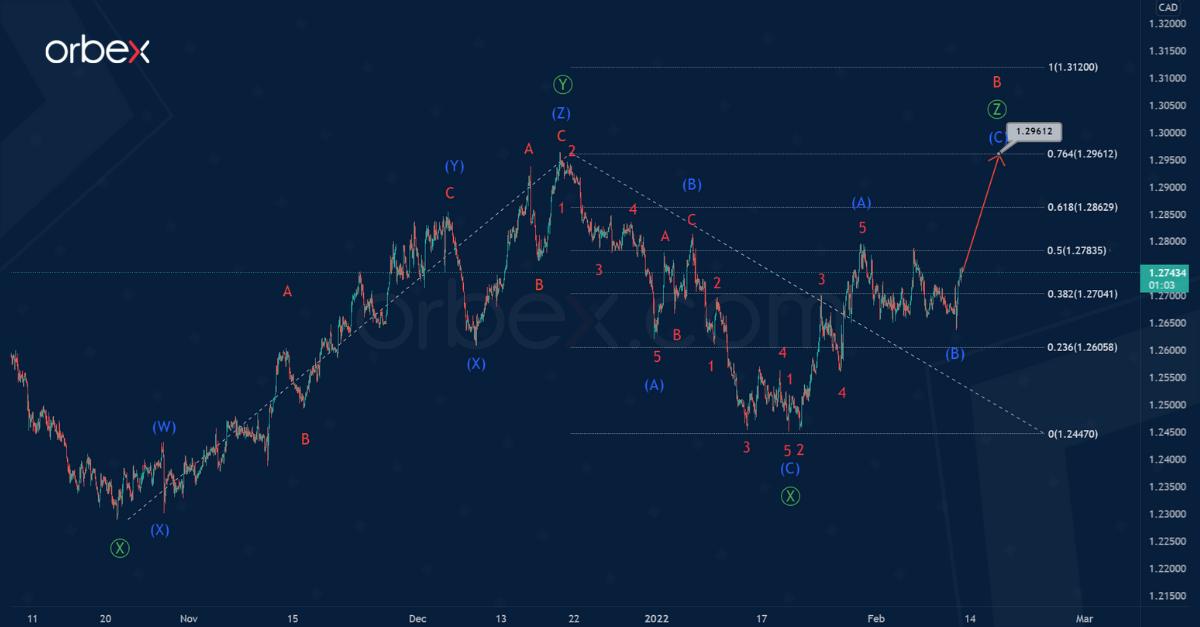
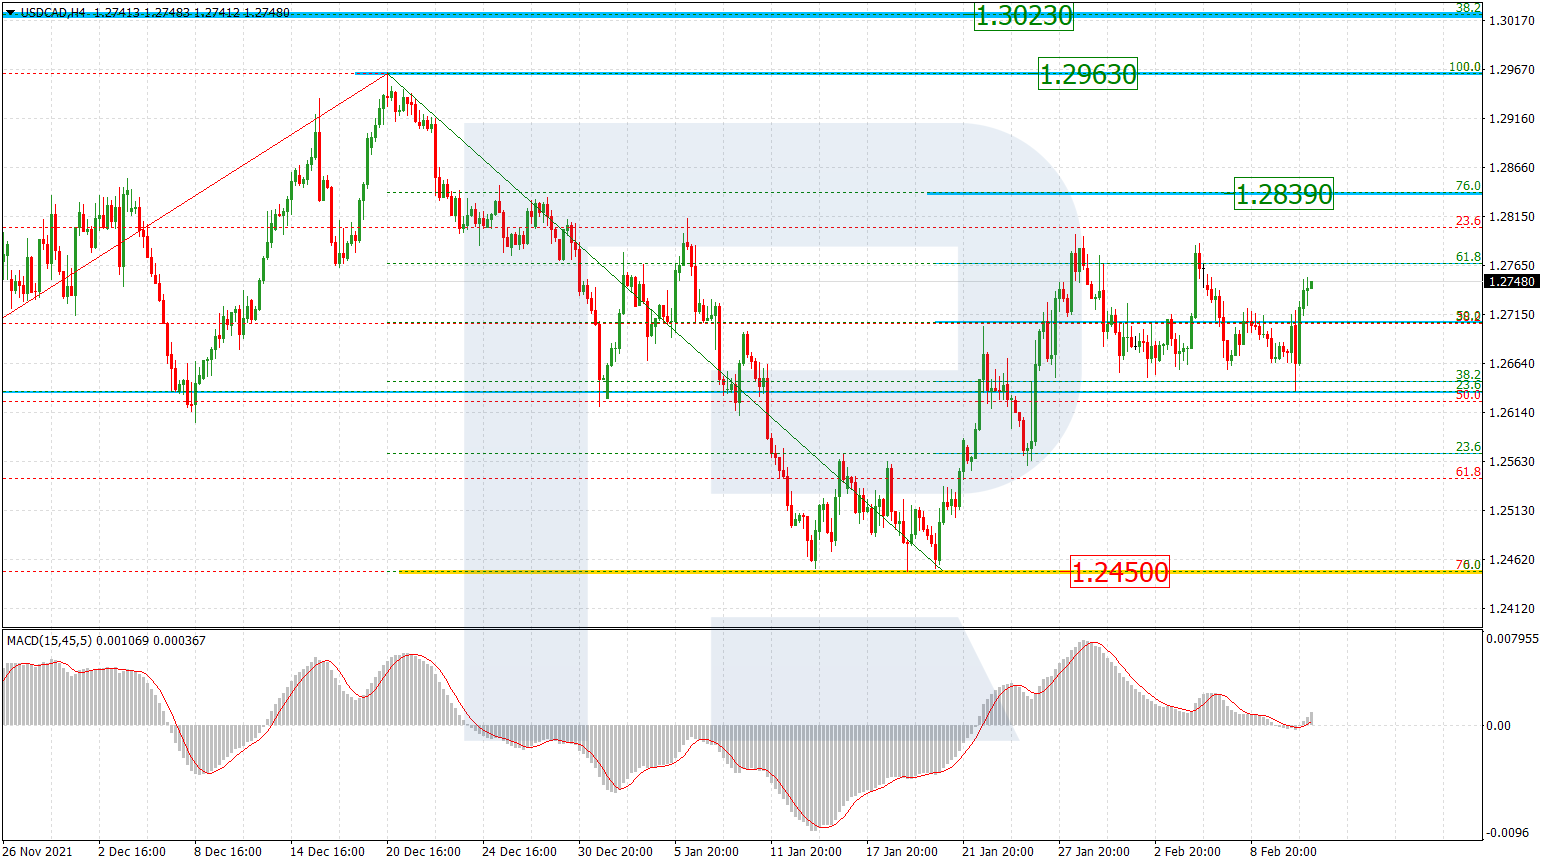
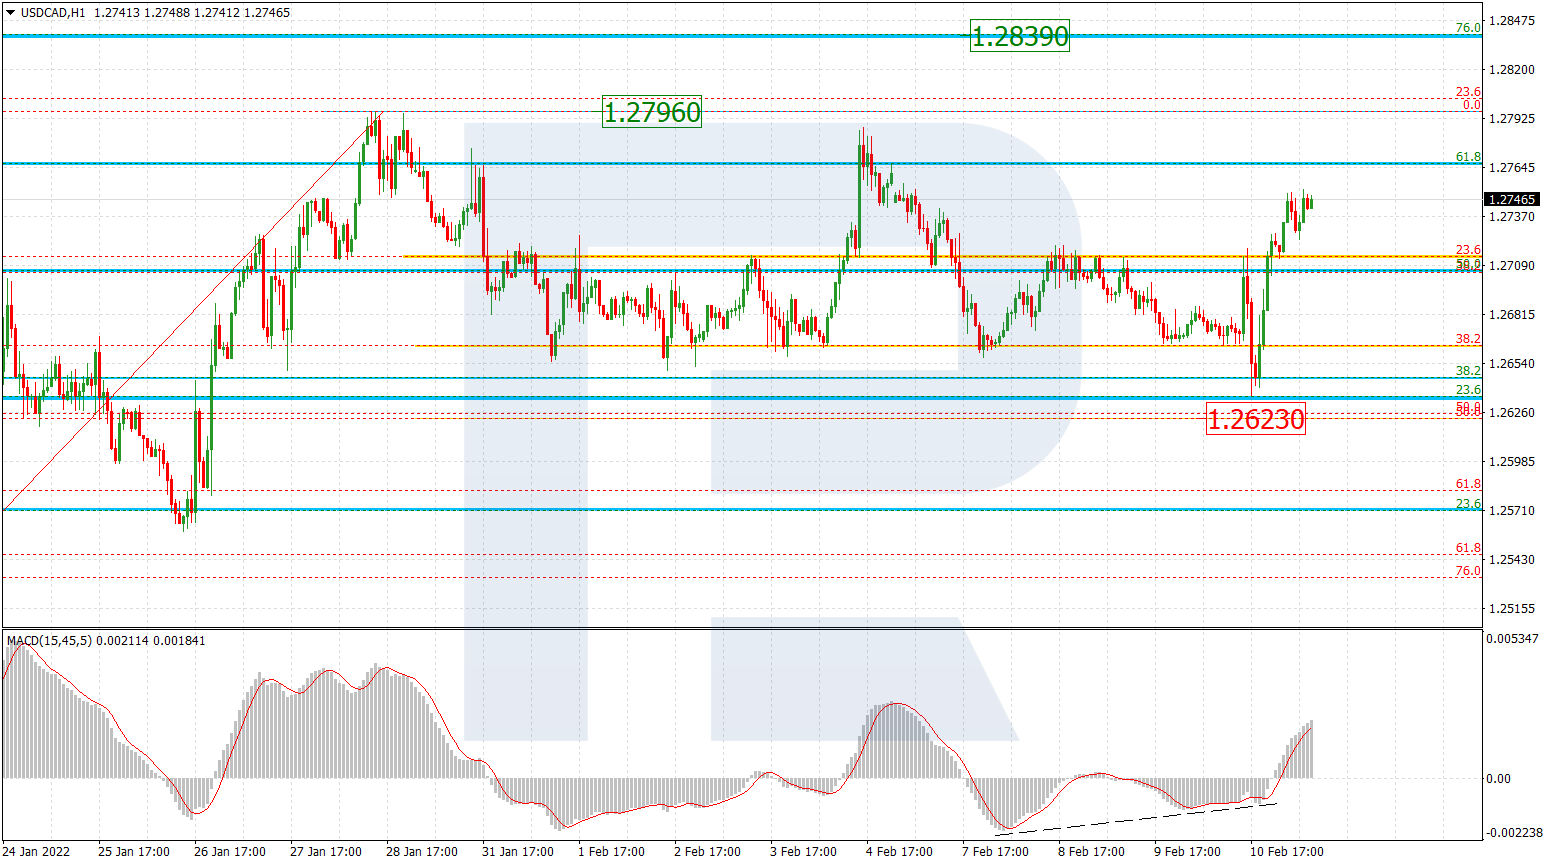
Canadian Dollar Futures:
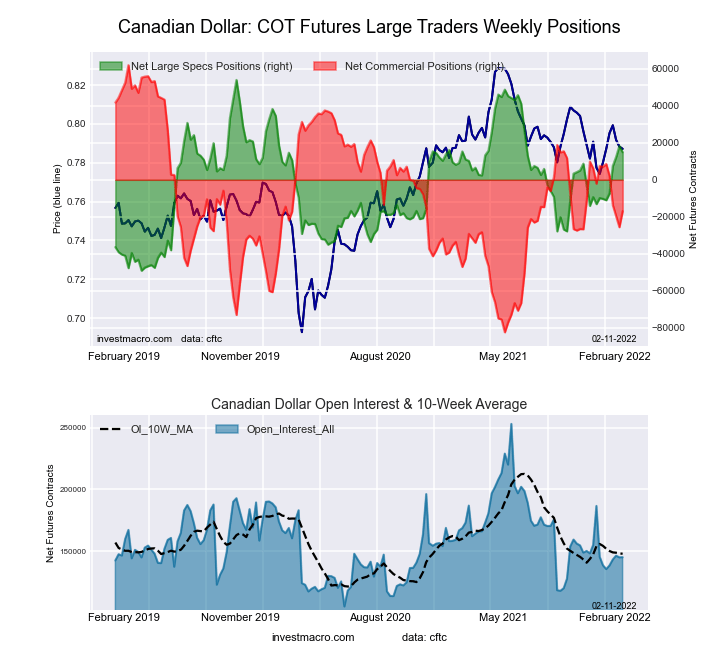 The Canadian Dollar large speculator standing this week was a net position of 14,886 contracts in the data reported through Tuesday. This was a weekly decline of -3,378 contracts from the previous week which had a total of 18,264 net contracts.
This week’s current strength score (the trader positioning range over the past three years, measured from 0 to 100) shows the speculators are currently Bullish with a score of 62.1 percent. The commercials are Bearish with a score of 45.4 percent and the small traders (not shown in chart) are Bearish with a score of 33.9 percent.
| CANADIAN DOLLAR Statistics | SPECULATORS | COMMERCIALS | SMALL TRADERS |
| – Percent of Open Interest Longs: | 37.7 | 40.2 | 18.9 |
| – Percent of Open Interest Shorts: | 27.5 | 51.9 | 17.5 |
| – Net Position: | 14,886 | -16,958 | 2,072 |
| – Gross Longs: | 54,762 | 58,404 | 27,480 |
| – Gross Shorts: | 39,876 | 75,362 | 25,408 |
| – Long to Short Ratio: | 1.4 to 1 | 0.8 to 1 | 1.1 to 1 |
| NET POSITION TREND: | | | |
| – Strength Index Score (3 Year Range Pct): | 62.1 | 45.4 | 33.9 |
| – Strength Index Reading (3 Year Range): | Bullish | Bearish | Bearish |
| NET POSITION MOVEMENT INDEX: | | | |
| – 6-Week Change in Strength Index: | 24.4 | -16.7 | -2.2 |
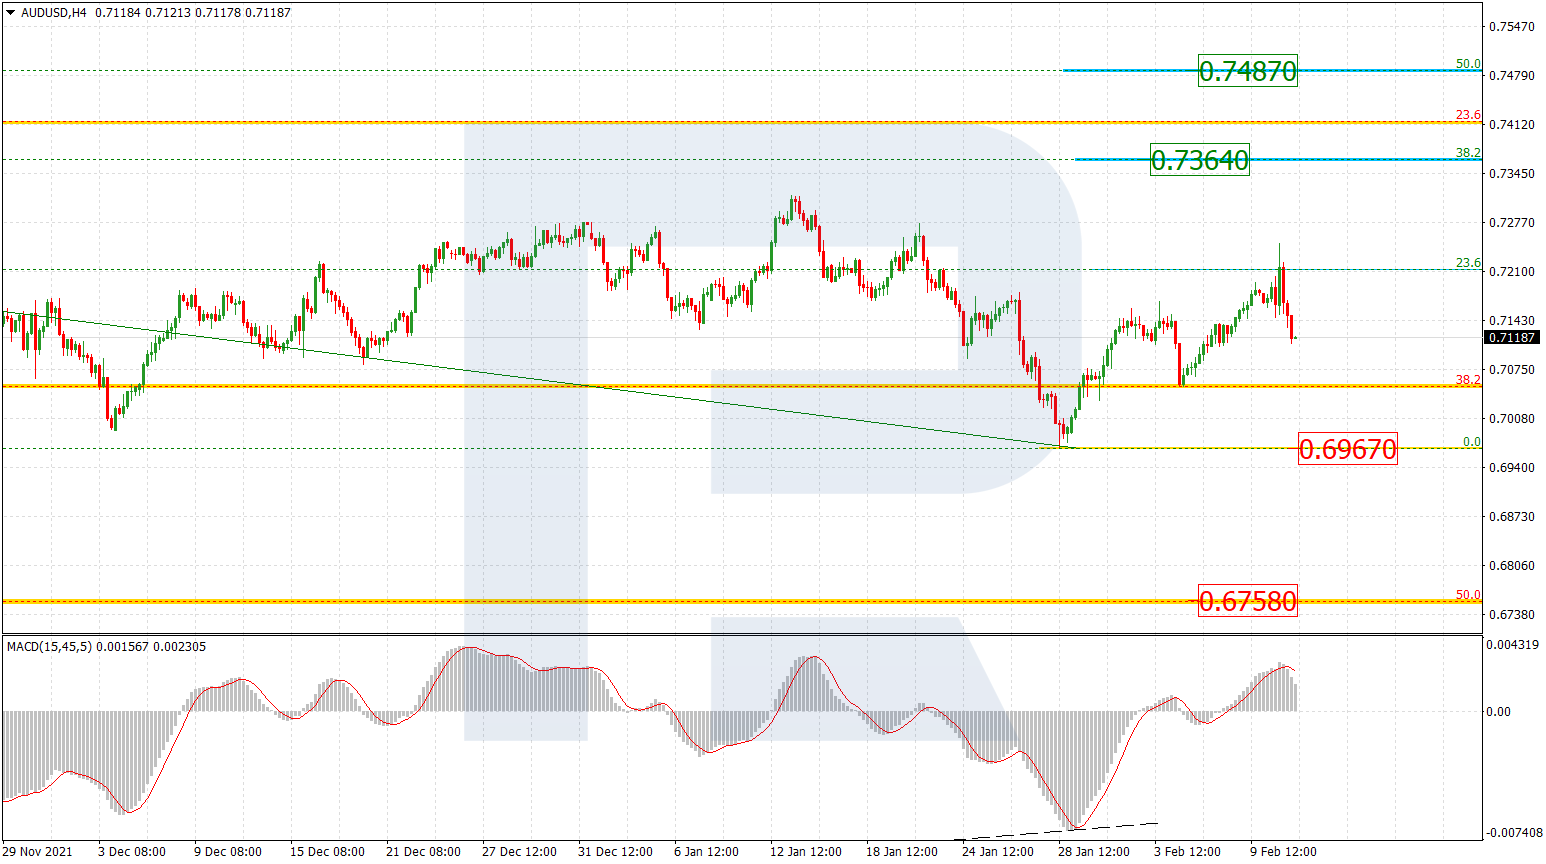
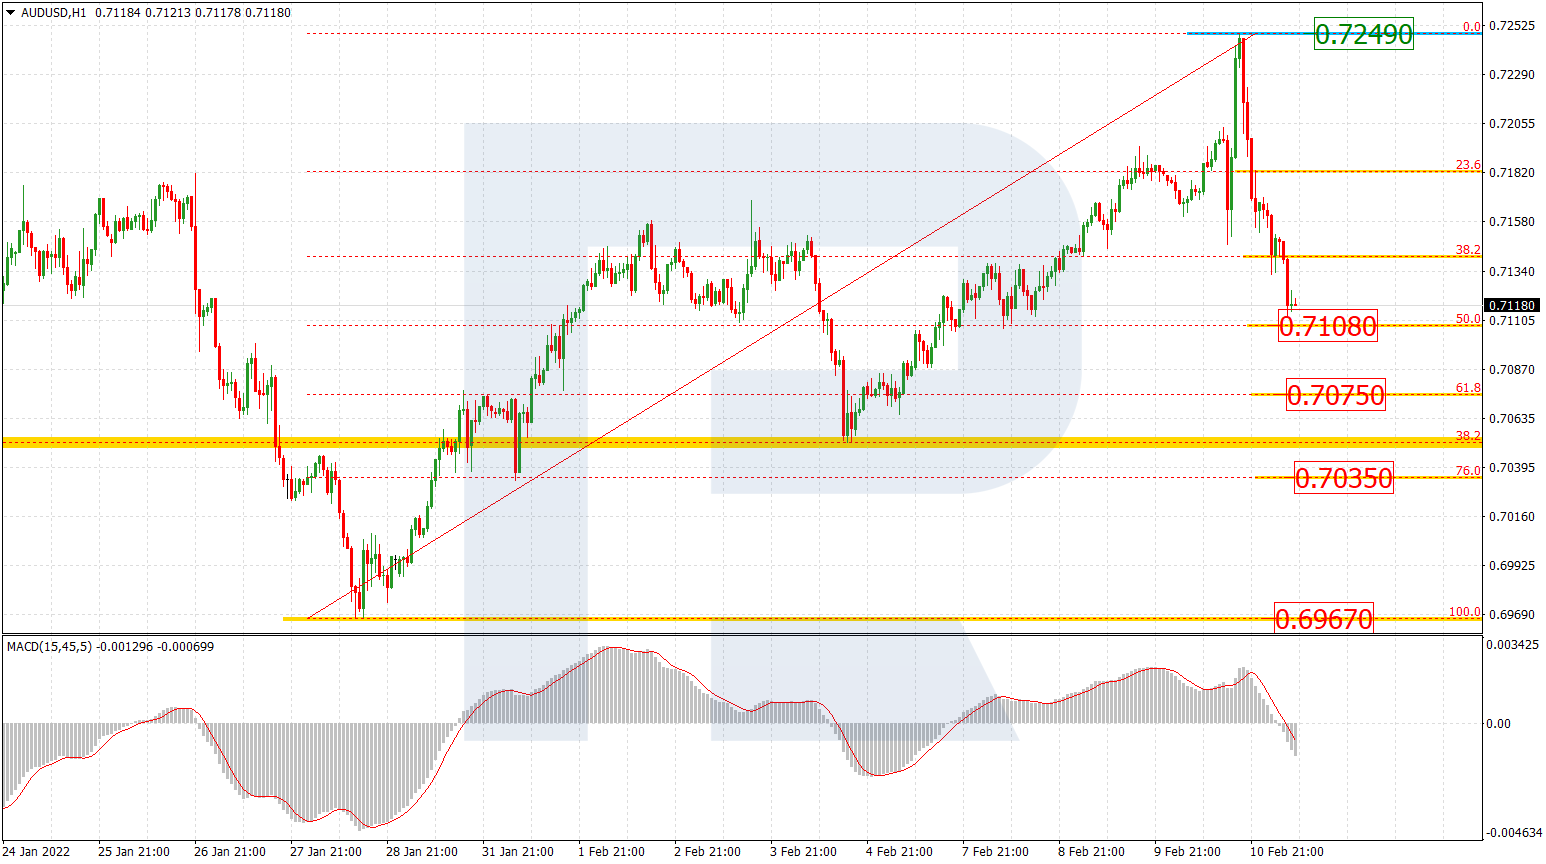
Australian Dollar Futures:
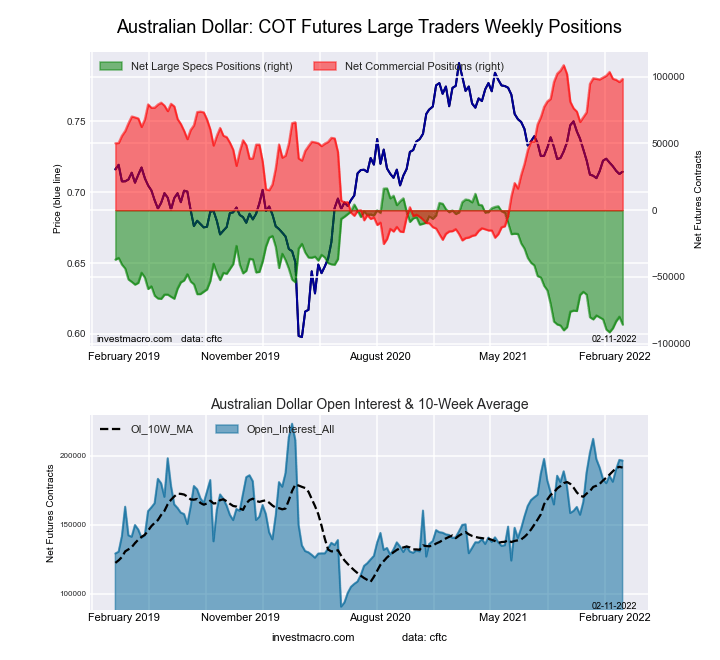 The Australian Dollar large speculator standing this week was a net position of -85,741 contracts in the data reported through Tuesday. This was a weekly reduction of -5,912 contracts from the previous week which had a total of -79,829 net contracts.
This week’s current strength score (the trader positioning range over the past three years, measured from 0 to 100) shows the speculators are currently Bearish-Extreme with a score of 5.3 percent. The commercials are Bullish-Extreme with a score of 92.3 percent and the small traders (not shown in chart) are Bearish with a score of 21.7 percent.
| AUSTRALIAN DOLLAR Statistics | SPECULATORS | COMMERCIALS | SMALL TRADERS |
| – Percent of Open Interest Longs: | 8.8 | 79.0 | 9.9 |
| – Percent of Open Interest Shorts: | 52.5 | 28.9 | 16.3 |
| – Net Position: | -85,741 | 98,357 | -12,616 |
| – Gross Longs: | 17,323 | 155,203 | 19,485 |
| – Gross Shorts: | 103,064 | 56,846 | 32,101 |
| – Long to Short Ratio: | 0.2 to 1 | 2.7 to 1 | 0.6 to 1 |
| NET POSITION TREND: | | | |
| – Strength Index Score (3 Year Range Pct): | 5.3 | 92.3 | 21.7 |
| – Strength Index Reading (3 Year Range): | Bearish-Extreme | Bullish-Extreme | Bearish |
| NET POSITION MOVEMENT INDEX: | | | |
| – 6-Week Change in Strength Index: | -3.7 | -0.8 | 12.5 |
New Zealand Dollar Futures:
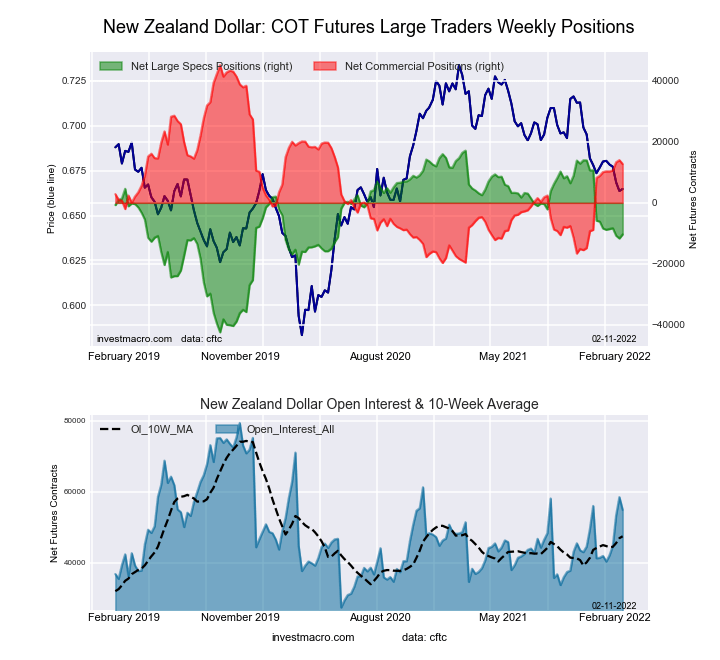 The New Zealand Dollar large speculator standing this week was a net position of -10,366 contracts in the data reported through Tuesday. This was a weekly increase of 1,332 contracts from the previous week which had a total of -11,698 net contracts.
This week’s current strength score (the trader positioning range over the past three years, measured from 0 to 100) shows the speculators are currently Bullish with a score of 53.9 percent. The commercials are Bullish with a score of 50.0 percent and the small traders (not shown in chart) are Bearish with a score of 24.7 percent.
| NEW ZEALAND DOLLAR Statistics | SPECULATORS | COMMERCIALS | SMALL TRADERS |
| – Percent of Open Interest Longs: | 31.3 | 61.2 | 5.6 |
| – Percent of Open Interest Shorts: | 50.2 | 38.0 | 10.0 |
| – Net Position: | -10,366 | 12,733 | -2,367 |
| – Gross Longs: | 17,168 | 33,591 | 3,097 |
| – Gross Shorts: | 27,534 | 20,858 | 5,464 |
| – Long to Short Ratio: | 0.6 to 1 | 1.6 to 1 | 0.6 to 1 |
| NET POSITION TREND: | | | |
| – Strength Index Score (3 Year Range Pct): | 53.9 | 50.0 | 24.7 |
| – Strength Index Reading (3 Year Range): | Bullish | Bullish | Bearish |
| NET POSITION MOVEMENT INDEX: | | | |
| – 6-Week Change in Strength Index: | -3.3 | 4.1 | -7.9 |
Mexican Peso Futures:
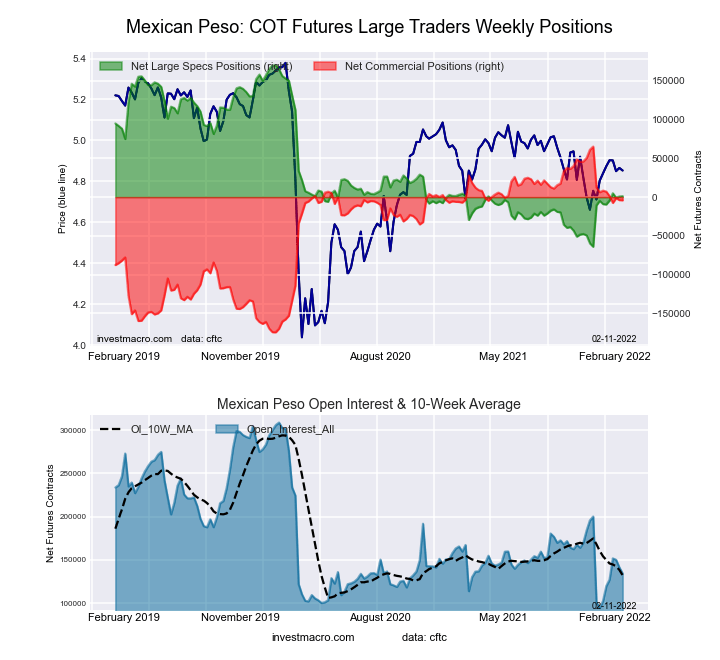 The Mexican Peso large speculator standing this week was a net position of 1,244 contracts in the data reported through Tuesday. This was a weekly gain of 514 contracts from the previous week which had a total of 730 net contracts.
This week’s current strength score (the trader positioning range over the past three years, measured from 0 to 100) shows the speculators are currently Bearish with a score of 27.9 percent. The commercials are Bullish with a score of 71.1 percent and the small traders (not shown in chart) are Bullish with a score of 55.0 percent.
| MEXICAN PESO Statistics | SPECULATORS | COMMERCIALS | SMALL TRADERS |
| – Percent of Open Interest Longs: | 33.6 | 61.3 | 4.5 |
| – Percent of Open Interest Shorts: | 32.7 | 64.3 | 2.4 |
| – Net Position: | 1,244 | -4,073 | 2,829 |
| – Gross Longs: | 45,097 | 82,287 | 6,067 |
| – Gross Shorts: | 43,853 | 86,360 | 3,238 |
| – Long to Short Ratio: | 1.0 to 1 | 1.0 to 1 | 1.9 to 1 |
| NET POSITION TREND: | | | |
| – Strength Index Score (3 Year Range Pct): | 27.9 | 71.1 | 55.0 |
| – Strength Index Reading (3 Year Range): | Bearish | Bullish | Bullish |
| NET POSITION MOVEMENT INDEX: | | | |
| – 6-Week Change in Strength Index: | 4.4 | -5.2 | 9.1 |
Brazilian Real Futures:
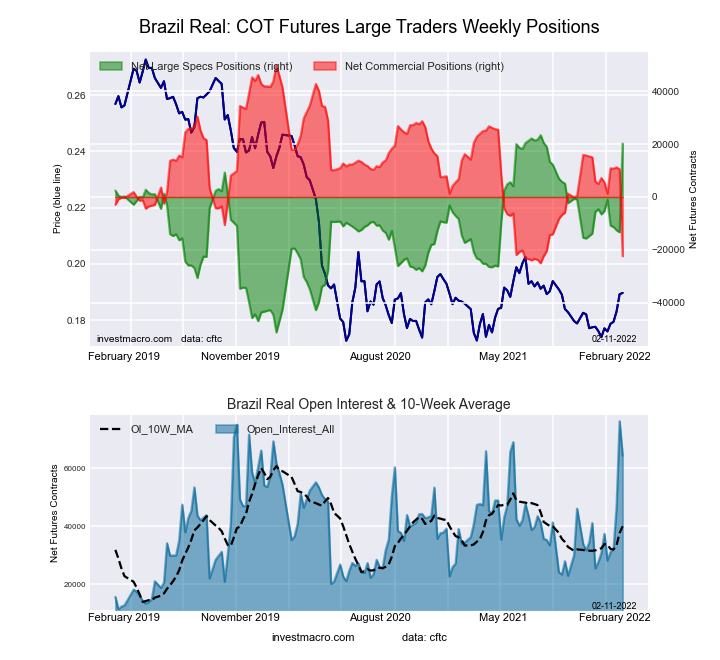 The Brazilian Real large speculator standing this week was a net position of 20,246 contracts in the data reported through Tuesday. This was a weekly rise of 33,599 contracts from the previous week which had a total of -13,353 net contracts.
This week’s current strength score (the trader positioning range over the past three years, measured from 0 to 100) shows the speculators are currently Bullish-Extreme with a score of 95.7 percent. The commercials are Bearish-Extreme with a score of 3.5 percent and the small traders (not shown in chart) are Bullish-Extreme with a score of 91.7 percent.
| BRAZIL REAL Statistics | SPECULATORS | COMMERCIALS | SMALL TRADERS |
| – Percent of Open Interest Longs: | 76.5 | 17.6 | 5.7 |
| – Percent of Open Interest Shorts: | 45.0 | 52.5 | 2.3 |
| – Net Position: | 20,246 | -22,432 | 2,186 |
| – Gross Longs: | 49,170 | 11,336 | 3,666 |
| – Gross Shorts: | 28,924 | 33,768 | 1,480 |
| – Long to Short Ratio: | 1.7 to 1 | 0.3 to 1 | 2.5 to 1 |
| NET POSITION TREND: | | | |
| – Strength Index Score (3 Year Range Pct): | 95.7 | 3.5 | 91.7 |
| – Strength Index Reading (3 Year Range): | Bullish-Extreme | Bearish-Extreme | Bullish-Extreme |
| NET POSITION MOVEMENT INDEX: | | | |
| – 6-Week Change in Strength Index: | 34.2 | -37.2 | 28.4 |
Russian Ruble Futures:
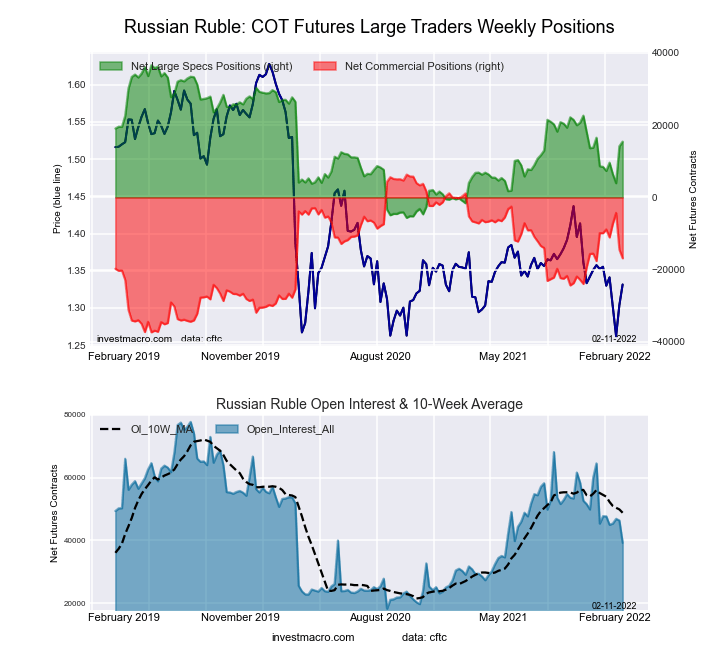 The Russian Ruble large speculator standing this week was a net position of 15,443 contracts in the data reported through Tuesday. This was a weekly boost of 1,292 contracts from the previous week which had a total of 14,151 net contracts.
This week’s current strength score (the trader positioning range over the past three years, measured from 0 to 100) shows the speculators are currently Bearish with a score of 49.9 percent. The commercials are Bearish with a score of 46.9 percent and the small traders (not shown in chart) are Bullish with a score of 72.5 percent.
| RUSSIAN RUBLE Statistics | SPECULATORS | COMMERCIALS | SMALL TRADERS |
| – Percent of Open Interest Longs: | 50.1 | 43.4 | 6.5 |
| – Percent of Open Interest Shorts: | 10.7 | 86.3 | 3.0 |
| – Net Position: | 15,443 | -16,839 | 1,396 |
| – Gross Longs: | 19,657 | 17,021 | 2,555 |
| – Gross Shorts: | 4,214 | 33,860 | 1,159 |
| – Long to Short Ratio: | 4.7 to 1 | 0.5 to 1 | 2.2 to 1 |
| NET POSITION TREND: | | | |
| – Strength Index Score (3 Year Range Pct): | 49.9 | 46.9 | 72.5 |
| – Strength Index Reading (3 Year Range): | Bearish | Bearish | Bullish |
| NET POSITION MOVEMENT INDEX: | | | |
| – 6-Week Change in Strength Index: | 16.5 | -15.9 | -0.7 |
Bitcoin Futures:
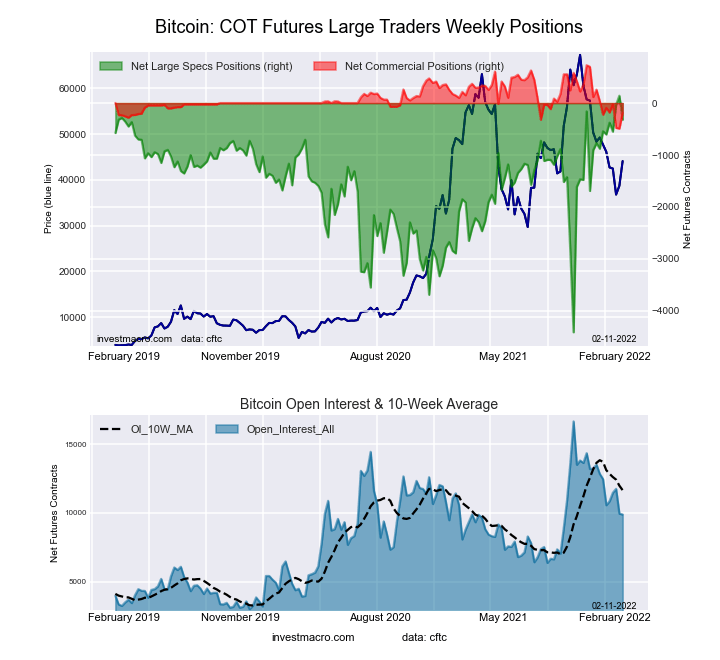 The Bitcoin large speculator standing this week was a net position of -319 contracts in the data reported through Tuesday. This was a weekly reduction of -460 contracts from the previous week which had a total of 141 net contracts.
This week’s current strength score (the trader positioning range over the past three years, measured from 0 to 100) shows the speculators are currently Bullish-Extreme with a score of 89.9 percent. The commercials are Bearish with a score of 24.8 percent and the small traders (not shown in chart) are Bearish with a score of 24.5 percent.
| BITCOIN Statistics | SPECULATORS | COMMERCIALS | SMALL TRADERS |
| – Percent of Open Interest Longs: | 78.4 | 3.8 | 14.9 |
| – Percent of Open Interest Shorts: | 81.6 | 5.7 | 9.8 |
| – Net Position: | -319 | -189 | 508 |
| – Gross Longs: | 7,751 | 376 | 1,474 |
| – Gross Shorts: | 8,070 | 565 | 966 |
| – Long to Short Ratio: | 1.0 to 1 | 0.7 to 1 | 1.5 to 1 |
| NET POSITION TREND: | | | |
| – Strength Index Score (3 Year Range Pct): | 89.9 | 24.8 | 24.5 |
| – Strength Index Reading (3 Year Range): | Bullish-Extreme | Bearish | Bearish |
| NET POSITION MOVEMENT INDEX: | | | |
| – 6-Week Change in Strength Index: | 4.9 | 2.9 | -5.9 |
Article By InvestMacro – Receive our weekly COT Reports by Email
*COT Report: The COT data, released weekly to the public each Friday, is updated through the most recent Tuesday (data is 3 days old) and shows a quick view of how large speculators or non-commercials (for-profit traders) were positioned in the futures markets.
The CFTC categorizes trader positions according to commercial hedgers (traders who use futures contracts for hedging as part of the business), non-commercials (large traders who speculate to realize trading profits) and nonreportable traders (usually small traders/speculators) as well as their open interest (contracts open in the market at time of reporting).See CFTC criteria here.


