by JustForex
On Thursday, US stock indices fell sharply after a Federal Reserve spokesman stoked fears of an aggressive interest rate hike. St. Louis Fed President James Bullard supported a 1% Fed rate hike by July after consumer price inflation jumped to 7.5% in annual terms, the fastest pace since 1982. The probability of a 50 basis point interest rate hike from the Fed next month increased to 89.9% from 24% the day before. High volatility in the stock market is likely to continue until the Fed meeting in March.
Goldman Sachs Group expects the Federal Reserve to raise interest rates seven times this year, rather than five as previously expected, to curb rising inflation in the US. “Most Fed officials who have commented have opposed a 50 basis points hike in March,” Goldman analysts wrote in a note. “We therefore think that the more likely path is a longer series of 25 basis points hikes instead,” the bank’s strategists wrote.
Yields on 10-year Treasuries jumped to 2% for the first time in more than two years, prompting investor risk aversion on stocks. The technology sector has been the hardest hit. At the close of the stock market, the Dow Jones Index (US30) decreased by 1.47%, the S&P 500 Index (US500) fell by 1.81%, and the NASDAQ Technology Index (US100) lost 2.1%. The stock market is currently trying to find a balance between concerns about inflation and the tightening of the Fed’s policy on the one hand and stronger than expected quarterly company reports on the other hand.
Leading European politicians have said the bloc would “do very well without Facebook” if the Meta-owned social network left the EU. Meta warned this week that it could leave the EU bloc if Europe does not allow it to conduct “transatlantic data transfers.”
European stock markets traded without a single dynamic yesterday. German DAX (DE30) gained 0.05%, French CAC 40 (FR40) decreased by 0.41%, Spanish IBEX 35 (ES35) gained 0.45%, British FTSE 100 (UK100) added 0.38%. In the Eurozone, March inflation forecasts will be key to determining the future policy of the European Central Bank (ECB). Yesterday, ECB President Christine Lagarde said that tightening monetary policy too quickly could hurt the Eurozone’s economic recovery. US stock indices show a “roller-coaster ride” amid the Fed’s plans to tighten monetary policy aggressively. However, European indices are now more attractive to investors, as the ECB is known for its conservatism. Analysts do not expect decisive actions from ECB until the end of the year. Germany’s consumer price index (inflation rate) remained at 4.9%. Switzerland’s inflation rate increased by 0.2% over the last month. UK GDP increased by 1% over the past three months to 6.5% in annual terms. France is making a huge bet on nuclear power. President Macron said the government plans to build six new nuclear reactors across the country.
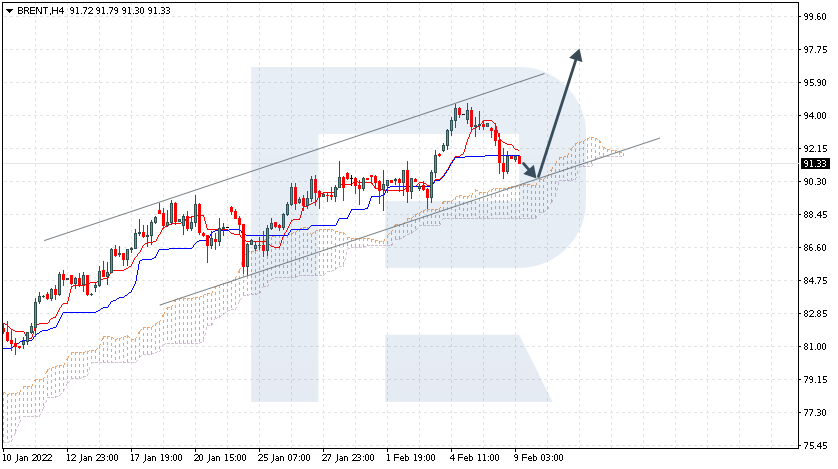
Yesterday, oil prices fell after the release of US inflation data. When inflation is growing, the dollar index rises, which increases the cost of buying oil through other currencies. In the mid-term, the growth of the dollar index and the possible entry of Iranian oil into the world market puts pressure on oil quotes. On the other hand, geopolitical tensions in the Middle East and Eastern Europe and declining crude oil reserves are holding oil prices down. As a result, oil is in some balance between two opposite scenarios.
Asian stock markets are mostly down today after the US market decline yesterday. Australia’s S&P/ASX 200 (AU200) fell by 0.98%, and Hong Kong’s Hang Seng (HK50) lost 0.29%. Today is a bank holiday in Japan. Reserve Bank of Australia Governor Philip Lowe said the country’s central bank would patiently pursue the monetary policy as long as inflation is stable within the target range.
Main market quotes:
S&P 500 (F) (US500) 4,504.08 −83.10 (−1.81%)
Dow Jones (US30) 35,241.59 −526.47 (−1.47%)
DAX (DE40) 15,490.44 +8.43 (+0.054%)
FTSE 100 (UK100) 7,672.40 +28.98 (+0.38%)
USD Index 95.69 +0.19 (+0.20%)
- – Australia RBA Lowe’s Speech at 00:30 (GMT+2);
- – UK GDP (q/q) at 09:00 (GMT+2);
- – UK Industrial Production (m/m) at 09:00 (GMT+2);
- – UK Manufacturing Production (m/m) at 09:00 (GMT+2);
- – German Consumer Price Index (m/m) at 09:00 (GMT+2);
- – Switzerland Consumer Price Index (m/m) at 09:30 (GMT+2);
- – US Michigan Consumer Sentiment (m/m) at 17:00 (GMT+2).
by JustForex
This article reflects a personal opinion and should not be interpreted as an investment advice, and/or offer, and/or a persistent request for carrying out financial transactions, and/or a guarantee, and/or a forecast of future events.