Archive for Forex and Currency News – Page 154

Uncertainty in the energy market is growing. Shocking atrocities of Russian soldiers in Bucha, Ukraine. Inflation is rising in E

by JustForex

Last week, investors’ attention was focused on European inflation data, US labor market data, geopolitics, and the OPEC+ meeting. On Friday, non-farm payrolls showed that the number of jobs in the US increased by 431,000 in March, while a rise of 490,000 was expected. US unemployment rate fell to 3.6% in March from 3.8%. The strong labor market scenario mentioned by Fed Chairman Mr. Powell has been fully implemented. Accordingly, the Fed has more room to raise rates quickly to catch up with the yield curve. At the moment, analysts see a 75.5% chance of a double rate hike (50bp) at the May 4 meeting.

“The Federal Reserve needs to move monetary policy towards a more neutral stance, but the pace at which it tightens credit will depend on how the economy reacts,” New York Fed President John Williams said on Saturday. The average neutral rate rating by policymakers is 2.4%. Currently, traders believe the Fed will achieve this by the end of this year. That rate will require a 0.5% increase at two of the remaining six Fed meetings this year, and the first is expected to take place at the May 4 Fed meeting.

The US stock market traded without a single dynamic last week. By the close of the stock market on Friday, the Dow Jones index (US30) increased by 0.40% (-0.04% for the week), the S&P 500 index (US500) added 0.34% (+0.11% for the week), and the NASDAQ Technology Index (US100) gained 0.29% on Friday (+0.59% for the week).

According to FlightAware, a data tracking site, more than 6,041 flights were delayed, and 1,933 flights were canceled on Saturday due to a major storm in Florida, USA. JetBlue Airways (25%), Spirit Airlines (23%), Southwest Airlines (10%), American Airlines (7%), and EasyJet (7%) had the most flight cancellations.

Major European indices were trading higher on Friday. German DAX (DE30) gained 0.22% on Friday (+0.49% for the week), French CAC 40 (FR40) gained 0.37% (+1.61% for the week), Spanish IBEX 35 (ES35) added 0.69% (+1.76% for the week), British FTSE 100 (UK100) jumped by 0.30% (+0.73% for the week). The inflation rate in the Eurozone rose sharply from 5.9% to 7.5% year on year. This surge in inflation has increased the likelihood that the ECB will soon announce the end of its quantitative easing program.

The UK agrees to join the US in releasing strategic oil reserves. The situation in the energy market is difficult now. On the one hand, due to Russia’s invasion of Ukraine, there is a shortage of energy resources on the market, especially in Europe. On the other hand, the US and its partners are ready to release strategic reserves to curb rising oil prices. As a result, oil prices volatility is now extremely high. Oil lost more than 10% last week.

The situation in the gas market is also very difficult. On the one hand, Russia wants Europe to pay for Russian gas in rubles. On the other hand, last week, the United States announced that it would work to supply 15 billion cubic meters of LNG to the European Union this year. US natural gas exporters have already benefited from the supply crisis in Europe and Norway. Many European countries (UK, France, Germany, Austria) refuse to pay for gas in rubles. Russia cannot cut off gas to European countries because it would violate previously signed supply contracts. In addition, it should be noted that more than 80% of Russia’s revenue comes from the sale of oil and gas. Therefore, the cessation of supplies to Europe will significantly reduce its revenues. It would be like shooting yourself in the foot. Lithuania has become the first EU country to no longer import natural gas from Russia.

Due to Russia’s aggression against Ukraine and threats against Europe, Finland and Sweden are considering joining NATO under an accelerated procedure.

Asian markets traded flat last week. Japan’s Nikkei 225 (JP225) decreased by 1.49% over the week, Hong Kong’s Hang Seng (HK50) gained 2.88% over the week, and Australia’s S&P/ASX 200 (AU200) closed with +1.18% over the week.

The EU has warned China against helping Russia circumvent sanctions. The EU will remain vigilant about any attempt to help Russia circumvent sanctions imposed on its invasion of Ukraine. EU leaders also said that Brussels would welcome China’s positive steps to end the war between Russia and Ukraine. For its part, China has promised the European Union that it would seek peace in Ukraine, but “on its terms.” Beijing has shied away from pressuring the country to take a tougher stance on Russia.

The war in Ukraine continues. This weekend, the Ukrainian armed forces managed to regain control of the Kyiv region. But footage from cities such as Bucha and Gostomel was shocking. Hundreds of civilians were killed, tortured and shot, and hundreds of mutilated civilian bodies were on the streets. The Russians shot civilians, raped Ukrainian women, killed dogs, robbed and looted. War crimes in Bucha and other cities during the Russian occupation will be considered by the UN Security Council and The Hague. The Minister for Foreign Affairs of Ukraine, Dmytro Kuleba, called on a mission of the International Criminal Court to come to Bucha and other cities in the Kyiv region to gather evidence.

In the commodities market by the end of the week futures on orange juice (+3.91%), coffee (+2.95%), and natural gas (+1.98) showed the biggest gains at the end of the week. Futures on BRENT oil (-13.18%), WTI oil (-12.71%), wheat (-10.80%), soybeans (-7.57%), palladium (-4.77%), silver (-3.36%), corn (-2.75%) and timber (-2.49%) showed the biggest drop.

Main market quotes:

S&P 500 (F) (US500) 4,545.86 +15.45 (+0.34%)

Dow Jones (US30) 34,818.27 +139.92 (+0.40%)

DAX (DE40) 14,446.48 +31.73 (+0.22%)

FTSE 100 (UK100) 7,537.90 +22.22 (+0.30%)

USD Index 98.57 +0.25 (+0.26%)

Important events for today:
  • – Australia Retail Sales (m/m) at 04:30 (GMT+3);
  • – UK BoE Gov Bailey’s Speech at 12:05 (GMT+3);
  • – Canada BoC Business Outlook Survey at 17:30 (GMT+3).

by JustForex


This article reflects a personal opinion and should not be interpreted as an investment advice, and/or offer, and/or a persistent request for carrying out financial transactions, and/or a guarantee, and/or a forecast of future events.

Currency Speculators continue Japanese Yen bearishness, push bearish bets to 20-week high

By InvestMacro | COT | Data Tables | COT Leaders | Downloads | COT Newsletter

Here are the latest charts and statistics for the Commitment of Traders (COT) data published by the Commodities Futures Trading Commission (CFTC).

The latest COT data is updated through Tuesday March 29th and shows a quick view of how large traders (for-profit speculators and commercial entities) were positioned in the futures markets. All currency positions are in direct relation to the US dollar where, for example, a bet for the euro is a bet that the euro will rise versus the dollar while a bet against the euro will be a bet that the euro will decline versus the dollar.

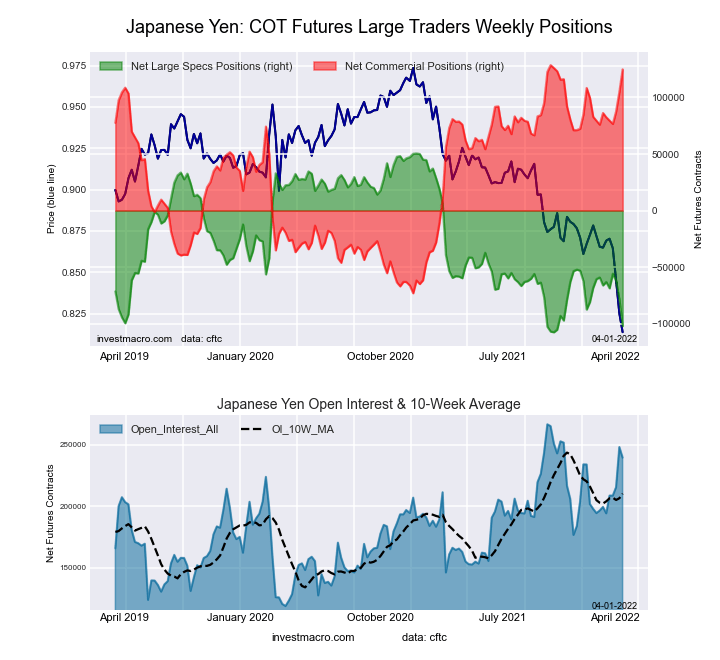
Highlighting the COT currency data is the increase of bearish bets in the Japanese yen currency futures contracts. Japanese yen speculators raised their bearish bets for a third straight week this week and for the fourth time in the past five weeks. Over this five-week time-frame, yen bets have now dropped by a total of -38,944 contracts, going from -63,187 net positions on February 22nd to -102,131 net positions this week. This weakness in speculator sentiment has pushed the current Yen positioning to the most bearish level in the past twenty weeks, dating back to November 9th when net positions over over -105,000 contracts.

Since the new year, yen speculator positions have averaged -70,432 weekly contracts, underscoring the sentiment weakness and compared to the 2021 weekly positions average of -44,182 contracts (positions averaged +17,100 weekly contracts in 2020). Japanese yen prices have also been extremely weak versus the other major currencies. Currently, the yen has recorded losses against all of the majors year-to-date and many majors currencies are trading at the highest levels since 2015 versus the yen.

Overall, the currencies with higher speculator bets this week were the US Dollar Index (1,306 contracts), Australian dollar (1,583 contracts), Brazil real (1,052 contracts), Canadian dollar (3,405 contracts) and the Mexican peso (9,804 contracts).

The currencies with declining bets this week were the Japanese yen (-23,649 contracts), Euro (-2,469 contracts), Swiss franc (-3,155 contracts), British pound sterling (-2,826 contracts), New Zealand dollar (-3,387 contracts), Russian ruble (-263 contracts) and Bitcoin (-271 contracts).


Data Snapshot of Forex Market Traders | Columns Legend
Mar-29-2022OIOI-IndexSpec-NetSpec-IndexCom-NetCOM-IndexSmalls-NetSmalls-Index
USD Index53,9677630,94179-35,106164,16562
EUR662,4156721,37442-47,3486225,97417
GBP224,36554-40,0704552,00960-11,93931
JPY239,69882-102,1313124,85098-22,7197
CHF44,32720-11,5795023,22857-11,64929
CAD147,42128-1,53546-15,5184817,05364
AUD143,00739-49,6063940,894498,71274
NZD34,88115-86770-33087062
MXN157,77930-8,247243,286744,96164
RUB20,93047,54331-7,15069-39324
BRL78,8947942,61692-45,62373,007100
Bitcoin12,02466-27189-411068228


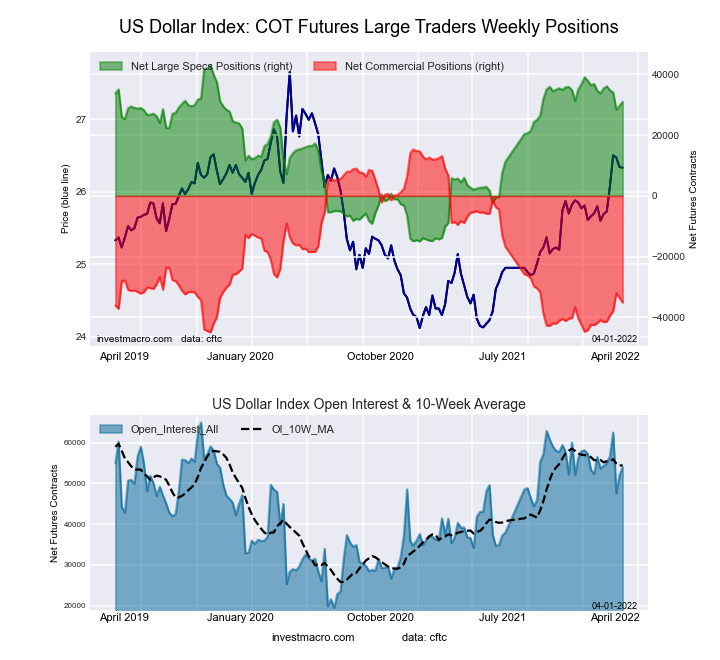
US Dollar Index Futures:

US Dollar Index Forex Futures COT ChartThe US Dollar Index large speculator standing this week recorded a net position of 30,941 contracts in the data reported through Tuesday. This was a weekly rise of 1,306 contracts from the previous week which had a total of 29,635 net contracts.

This week’s current strength score (the trader positioning range over the past three years, measured from 0 to 100) shows the speculators are currently Bullish with a score of 79.2 percent. The commercials are Bearish-Extreme with a score of 16.3 percent and the small traders (not shown in chart) are Bullish with a score of 62.1 percent.

US DOLLAR INDEX StatisticsSPECULATORSCOMMERCIALSSMALL TRADERS
– Percent of Open Interest Longs:83.32.810.5
– Percent of Open Interest Shorts:26.067.82.8
– Net Position:30,941-35,1064,165
– Gross Longs:44,9701,4935,684
– Gross Shorts:14,02936,5991,519
– Long to Short Ratio:3.2 to 10.0 to 13.7 to 1
NET POSITION TREND:
– Strength Index Score (3 Year Range Pct):79.216.362.1
– Strength Index Reading (3 Year Range):BullishBearish-ExtremeBullish
NET POSITION MOVEMENT INDEX:
– 6-Week Change in Strength Index:-7.710.7-21.9


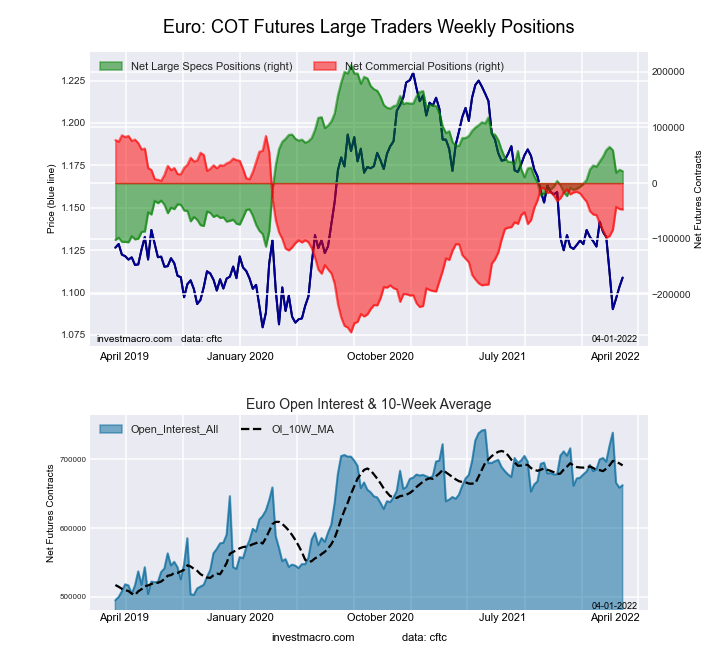
Euro Currency Futures:

Euro Currency Futures COT ChartThe Euro Currency large speculator standing this week recorded a net position of 21,374 contracts in the data reported through Tuesday. This was a weekly fall of -2,469 contracts from the previous week which had a total of 23,843 net contracts.

This week’s current strength score (the trader positioning range over the past three years, measured from 0 to 100) shows the speculators are currently Bearish with a score of 41.6 percent. The commercials are Bullish with a score of 62.3 percent and the small traders (not shown in chart) are Bearish-Extreme with a score of 17.4 percent.

EURO Currency StatisticsSPECULATORSCOMMERCIALSSMALL TRADERS
– Percent of Open Interest Longs:30.255.012.1
– Percent of Open Interest Shorts:27.062.18.2
– Net Position:21,374-47,34825,974
– Gross Longs:200,043364,16380,321
– Gross Shorts:178,669411,51154,347
– Long to Short Ratio:1.1 to 10.9 to 11.5 to 1
NET POSITION TREND:
– Strength Index Score (3 Year Range Pct):41.662.317.4
– Strength Index Reading (3 Year Range):BearishBullishBearish-Extreme
NET POSITION MOVEMENT INDEX:
– 6-Week Change in Strength Index:-8.010.7-19.0


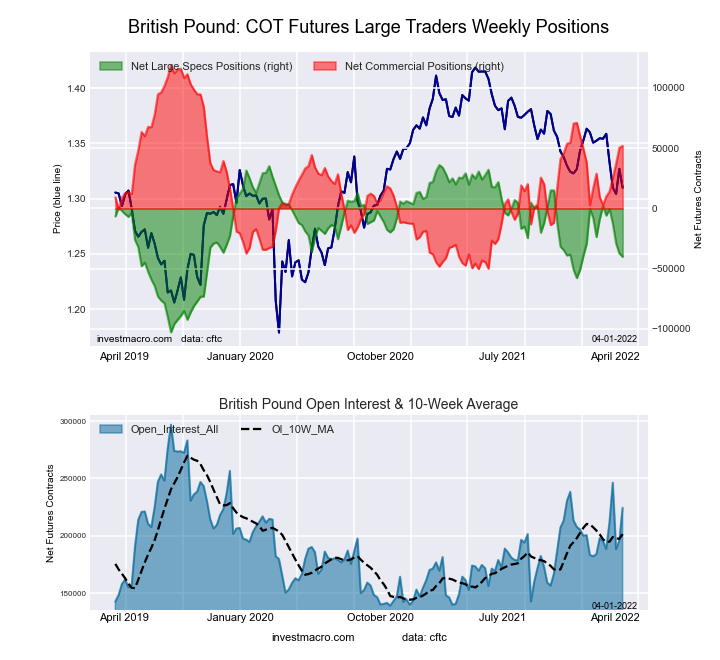
British Pound Sterling Futures:

British Pound Sterling Futures COT ChartThe British Pound Sterling large speculator standing this week recorded a net position of -40,070 contracts in the data reported through Tuesday. This was a weekly decrease of -2,826 contracts from the previous week which had a total of -37,244 net contracts.

This week’s current strength score (the trader positioning range over the past three years, measured from 0 to 100) shows the speculators are currently Bearish with a score of 45.1 percent. The commercials are Bullish with a score of 60.4 percent and the small traders (not shown in chart) are Bearish with a score of 30.9 percent.

BRITISH POUND StatisticsSPECULATORSCOMMERCIALSSMALL TRADERS
– Percent of Open Interest Longs:13.673.39.9
– Percent of Open Interest Shorts:31.550.115.2
– Net Position:-40,07052,009-11,939
– Gross Longs:30,624164,51922,187
– Gross Shorts:70,694112,51034,126
– Long to Short Ratio:0.4 to 11.5 to 10.7 to 1
NET POSITION TREND:
– Strength Index Score (3 Year Range Pct):45.160.430.9
– Strength Index Reading (3 Year Range):BearishBullishBearish
NET POSITION MOVEMENT INDEX:
– 6-Week Change in Strength Index:-30.529.1-14.2


Japanese Yen Futures:

Japanese Yen Forex Futures COT ChartThe Japanese Yen large speculator standing this week recorded a net position of -102,131 contracts in the data reported through Tuesday. This was a weekly decrease of -23,649 contracts from the previous week which had a total of -78,482 net contracts.

This week’s current strength score (the trader positioning range over the past three years, measured from 0 to 100) shows the speculators are currently Bearish-Extreme with a score of 3.5 percent. The commercials are Bullish-Extreme with a score of 98.2 percent and the small traders (not shown in chart) are Bearish-Extreme with a score of 7.3 percent.

JAPANESE YEN StatisticsSPECULATORSCOMMERCIALSSMALL TRADERS
– Percent of Open Interest Longs:6.483.98.5
– Percent of Open Interest Shorts:49.031.818.0
– Net Position:-102,131124,850-22,719
– Gross Longs:15,274201,19020,392
– Gross Shorts:117,40576,34043,111
– Long to Short Ratio:0.1 to 12.6 to 10.5 to 1
NET POSITION TREND:
– Strength Index Score (3 Year Range Pct):3.598.27.3
– Strength Index Reading (3 Year Range):Bearish-ExtremeBullish-ExtremeBearish-Extreme
NET POSITION MOVEMENT INDEX:
– 6-Week Change in Strength Index:-22.719.1-5.3


Swiss Franc Futures:

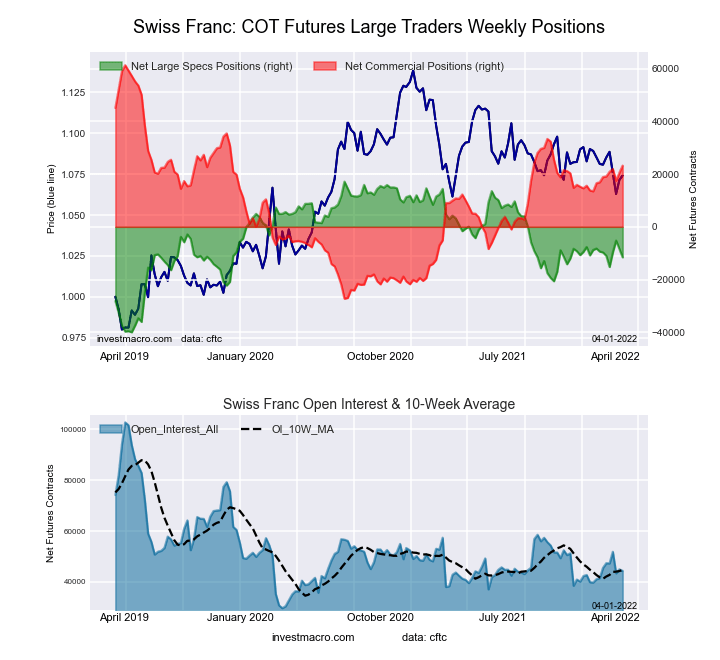
Swiss Franc Forex Futures COT ChartThe Swiss Franc large speculator standing this week recorded a net position of -11,579 contracts in the data reported through Tuesday. This was a weekly lowering of -3,155 contracts from the previous week which had a total of -8,424 net contracts.

This week’s current strength score (the trader positioning range over the past three years, measured from 0 to 100) shows the speculators are currently Bearish with a score of 49.7 percent. The commercials are Bullish with a score of 57.0 percent and the small traders (not shown in chart) are Bearish with a score of 29.1 percent.

SWISS FRANC StatisticsSPECULATORSCOMMERCIALSSMALL TRADERS
– Percent of Open Interest Longs:7.473.219.2
– Percent of Open Interest Shorts:33.520.845.5
– Net Position:-11,57923,228-11,649
– Gross Longs:3,29232,4308,522
– Gross Shorts:14,8719,20220,171
– Long to Short Ratio:0.2 to 13.5 to 10.4 to 1
NET POSITION TREND:
– Strength Index Score (3 Year Range Pct):49.757.029.1
– Strength Index Reading (3 Year Range):BearishBullishBearish
NET POSITION MOVEMENT INDEX:
– 6-Week Change in Strength Index:-3.34.9-7.3


Canadian Dollar Futures:

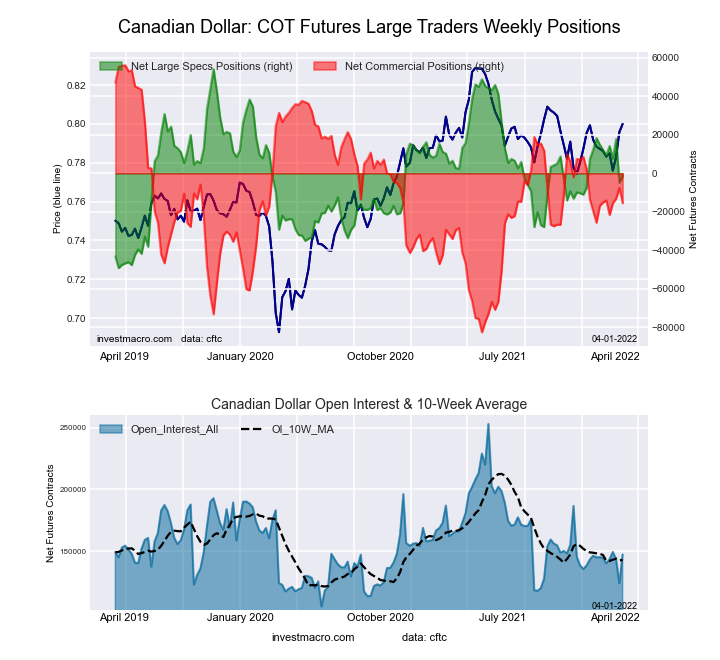
Canadian Dollar Forex Futures COT ChartThe Canadian Dollar large speculator standing this week recorded a net position of -1,535 contracts in the data reported through Tuesday. This was a weekly advance of 3,405 contracts from the previous week which had a total of -4,940 net contracts.

This week’s current strength score (the trader positioning range over the past three years, measured from 0 to 100) shows the speculators are currently Bearish with a score of 46.2 percent. The commercials are Bearish with a score of 48.3 percent and the small traders (not shown in chart) are Bullish with a score of 63.7 percent.

CANADIAN DOLLAR StatisticsSPECULATORSCOMMERCIALSSMALL TRADERS
– Percent of Open Interest Longs:22.052.124.9
– Percent of Open Interest Shorts:23.062.613.4
– Net Position:-1,535-15,51817,053
– Gross Longs:32,42976,73836,771
– Gross Shorts:33,96492,25619,718
– Long to Short Ratio:1.0 to 10.8 to 11.9 to 1
NET POSITION TREND:
– Strength Index Score (3 Year Range Pct):46.248.363.7
– Strength Index Reading (3 Year Range):BearishBearishBullish
NET POSITION MOVEMENT INDEX:
– 6-Week Change in Strength Index:-13.3-0.328.1


Australian Dollar Futures:

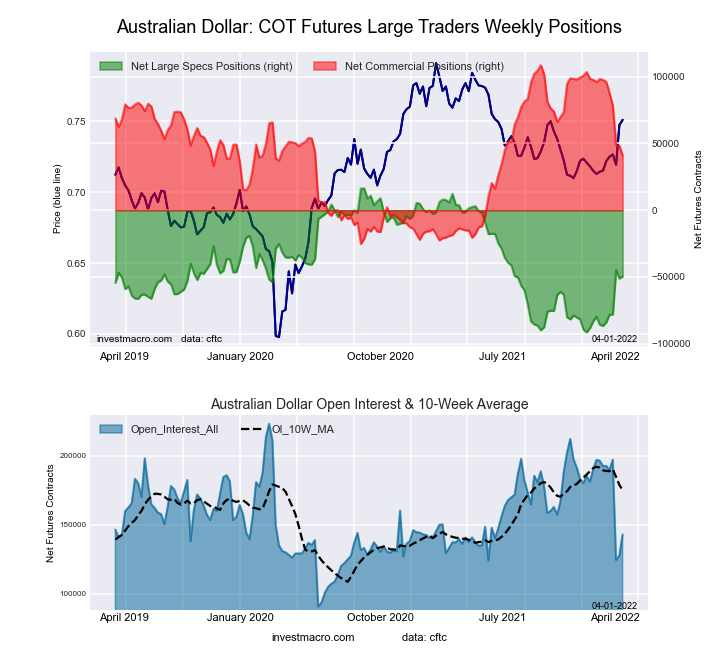
Australian Dollar Forex Futures COT ChartThe Australian Dollar large speculator standing this week recorded a net position of -49,606 contracts in the data reported through Tuesday. This was a weekly gain of 1,583 contracts from the previous week which had a total of -51,189 net contracts.

This week’s current strength score (the trader positioning range over the past three years, measured from 0 to 100) shows the speculators are currently Bearish with a score of 38.8 percent. The commercials are Bearish with a score of 49.4 percent and the small traders (not shown in chart) are Bullish with a score of 73.7 percent.

AUSTRALIAN DOLLAR StatisticsSPECULATORSCOMMERCIALSSMALL TRADERS
– Percent of Open Interest Longs:23.756.618.7
– Percent of Open Interest Shorts:58.428.012.7
– Net Position:-49,60640,8948,712
– Gross Longs:33,96080,88526,806
– Gross Shorts:83,56639,99118,094
– Long to Short Ratio:0.4 to 12.0 to 11.5 to 1
NET POSITION TREND:
– Strength Index Score (3 Year Range Pct):38.849.473.7
– Strength Index Reading (3 Year Range):BearishBearishBullish
NET POSITION MOVEMENT INDEX:
– 6-Week Change in Strength Index:34.4-42.448.0


New Zealand Dollar Futures:

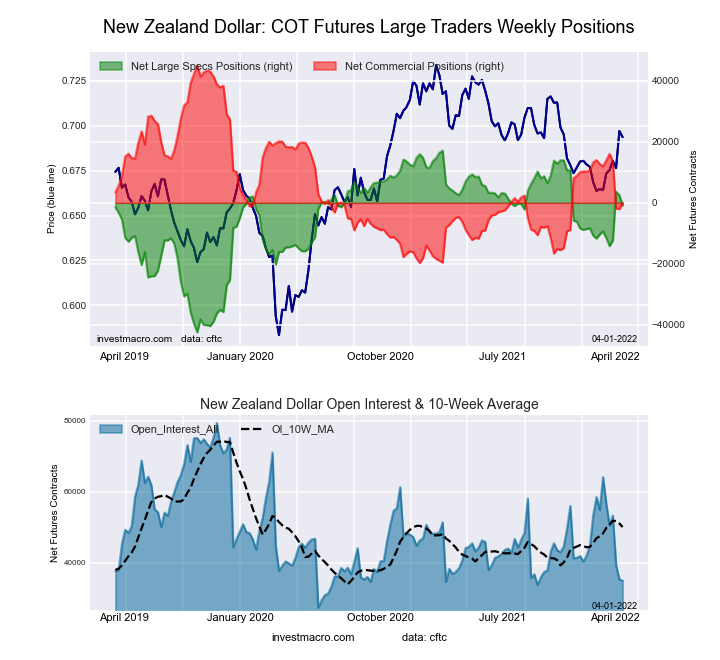
New Zealand Dollar Forex Futures COT ChartThe New Zealand Dollar large speculator standing this week recorded a net position of -867 contracts in the data reported through Tuesday. This was a weekly reduction of -3,387 contracts from the previous week which had a total of 2,520 net contracts.

This week’s current strength score (the trader positioning range over the past three years, measured from 0 to 100) shows the speculators are currently Bullish with a score of 69.8 percent. The commercials are Bearish with a score of 30.4 percent and the small traders (not shown in chart) are Bullish with a score of 61.8 percent.

NEW ZEALAND DOLLAR StatisticsSPECULATORSCOMMERCIALSSMALL TRADERS
– Percent of Open Interest Longs:44.444.510.5
– Percent of Open Interest Shorts:46.944.58.0
– Net Position:-867-3870
– Gross Longs:15,50415,5073,666
– Gross Shorts:16,37115,5102,796
– Long to Short Ratio:0.9 to 11.0 to 11.3 to 1
NET POSITION TREND:
– Strength Index Score (3 Year Range Pct):69.830.461.8
– Strength Index Reading (3 Year Range):BullishBearishBullish
NET POSITION MOVEMENT INDEX:
– 6-Week Change in Strength Index:14.2-18.540.7


Mexican Peso Futures:

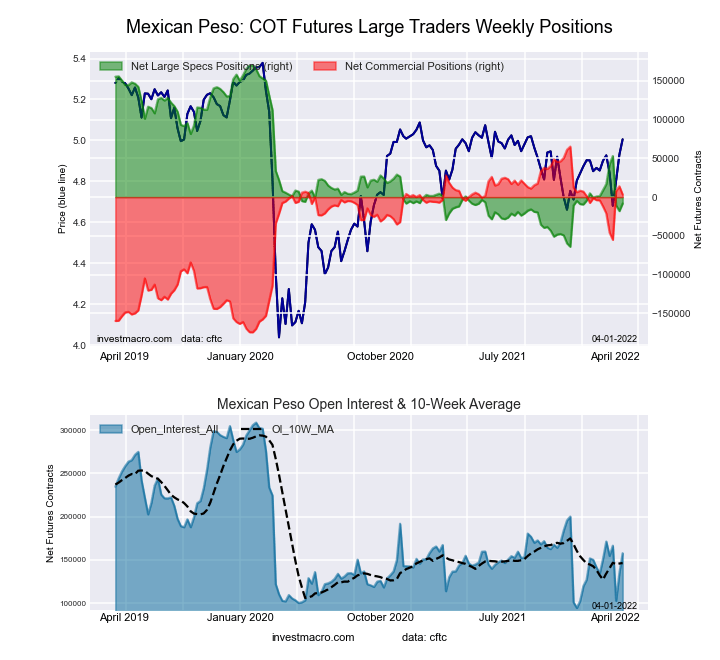
Mexican Peso Futures COT ChartThe Mexican Peso large speculator standing this week recorded a net position of -8,247 contracts in the data reported through Tuesday. This was a weekly gain of 9,804 contracts from the previous week which had a total of -18,051 net contracts.

This week’s current strength score (the trader positioning range over the past three years, measured from 0 to 100) shows the speculators are currently Bearish with a score of 23.8 percent. The commercials are Bullish with a score of 74.2 percent and the small traders (not shown in chart) are Bullish with a score of 64.1 percent.

MEXICAN PESO StatisticsSPECULATORSCOMMERCIALSSMALL TRADERS
– Percent of Open Interest Longs:47.646.94.8
– Percent of Open Interest Shorts:52.844.81.7
– Net Position:-8,2473,2864,961
– Gross Longs:75,08173,9527,577
– Gross Shorts:83,32870,6662,616
– Long to Short Ratio:0.9 to 11.0 to 12.9 to 1
NET POSITION TREND:
– Strength Index Score (3 Year Range Pct):23.874.264.1
– Strength Index Reading (3 Year Range):BearishBullishBullish
NET POSITION MOVEMENT INDEX:
– 6-Week Change in Strength Index:-7.36.48.0


Brazilian Real Futures:

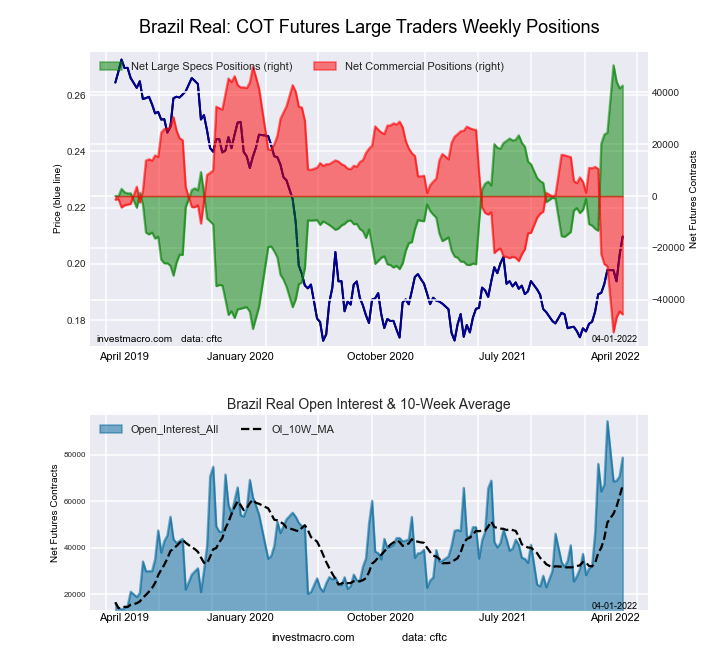
Brazil Real Futures COT ChartThe Brazilian Real large speculator standing this week recorded a net position of 42,616 contracts in the data reported through Tuesday. This was a weekly advance of 1,052 contracts from the previous week which had a total of 41,564 net contracts.

This week’s current strength score (the trader positioning range over the past three years, measured from 0 to 100) shows the speculators are currently Bullish-Extreme with a score of 92.3 percent. The commercials are Bearish-Extreme with a score of 6.8 percent and the small traders (not shown in chart) are Bullish-Extreme with a score of 100.0 percent.

BRAZIL REAL StatisticsSPECULATORSCOMMERCIALSSMALL TRADERS
– Percent of Open Interest Longs:67.326.26.1
– Percent of Open Interest Shorts:13.284.02.3
– Net Position:42,616-45,6233,007
– Gross Longs:53,06520,6494,805
– Gross Shorts:10,44966,2721,798
– Long to Short Ratio:5.1 to 10.3 to 12.7 to 1
NET POSITION TREND:
– Strength Index Score (3 Year Range Pct):92.36.8100.0
– Strength Index Reading (3 Year Range):Bullish-ExtremeBearish-ExtremeBullish-Extreme
NET POSITION MOVEMENT INDEX:
– 6-Week Change in Strength Index:18.5-18.96.4


Russian Ruble Futures:

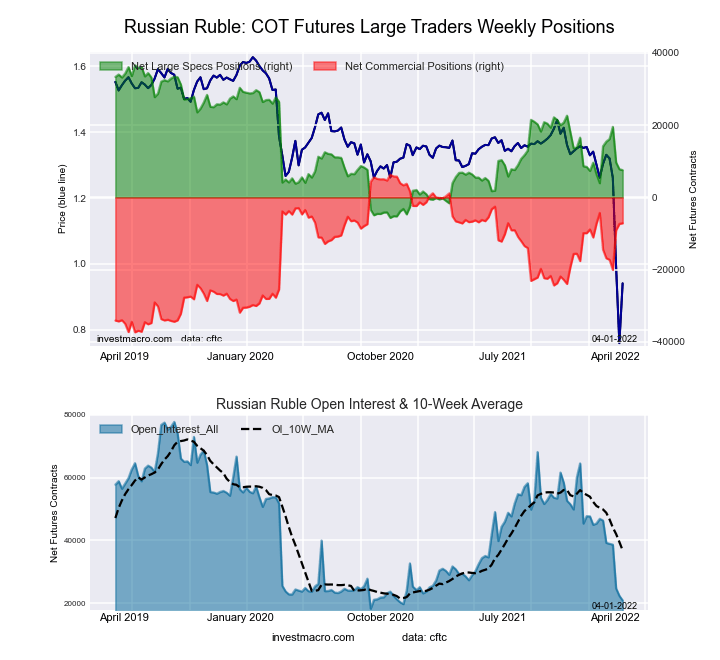
Russian Ruble Futures COT ChartThe Russian Ruble large speculator standing this week recorded a net position of 7,543 contracts in the data reported through Tuesday. This was a weekly fall of -263 contracts from the previous week which had a total of 7,806 net contracts.

This week’s current strength score (the trader positioning range over the past three years, measured from 0 to 100) shows the speculators are currently Bearish with a score of 31.2 percent. The commercials are Bullish with a score of 69.1 percent and the small traders (not shown in chart) are Bearish with a score of 23.9 percent.

RUSSIAN RUBLE StatisticsSPECULATORSCOMMERCIALSSMALL TRADERS
– Percent of Open Interest Longs:36.660.62.8
– Percent of Open Interest Shorts:0.594.74.7
– Net Position:7,543-7,150-393
– Gross Longs:7,65812,679593
– Gross Shorts:11519,829986
– Long to Short Ratio:66.6 to 10.6 to 10.6 to 1
NET POSITION TREND:
– Strength Index Score (3 Year Range Pct):31.269.123.9
– Strength Index Reading (3 Year Range):BearishBullishBearish
NET POSITION MOVEMENT INDEX:
– 6-Week Change in Strength Index:-15.616.7-18.8


Bitcoin Futures:

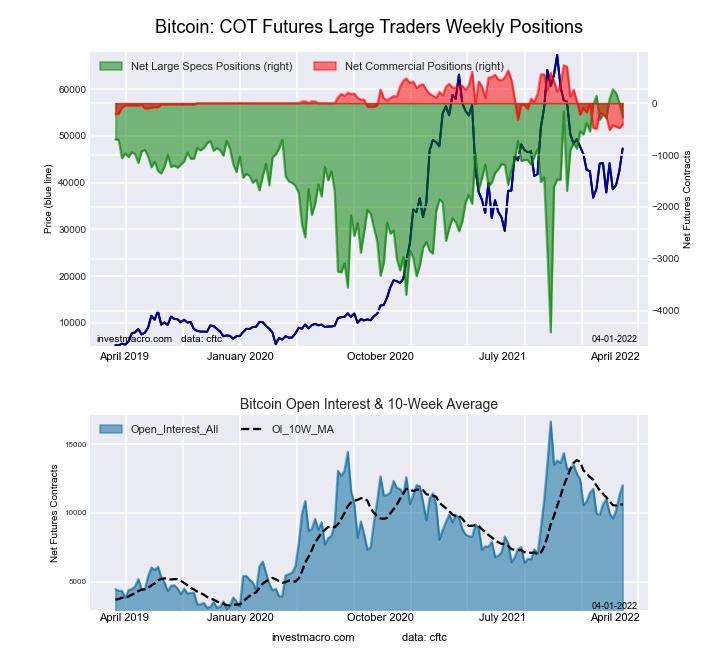
Bitcoin Crypto Futures COT ChartThe Bitcoin large speculator standing this week recorded a net position of -271 contracts in the data reported through Tuesday. This was a weekly lowering of -271 contracts from the previous week which had a total of 0 net contracts.

This week’s current strength score (the trader positioning range over the past three years, measured from 0 to 100) shows the speculators are currently Bullish-Extreme with a score of 88.5 percent. The commercials are Bearish-Extreme with a score of 8.5 percent and the small traders (not shown in chart) are Bearish with a score of 28.4 percent.

BITCOIN StatisticsSPECULATORSCOMMERCIALSSMALL TRADERS
– Percent of Open Interest Longs:80.93.210.8
– Percent of Open Interest Shorts:83.16.65.2
– Net Position:-271-411682
– Gross Longs:9,7223831,302
– Gross Shorts:9,993794620
– Long to Short Ratio:1.0 to 10.5 to 12.1 to 1
NET POSITION TREND:
– Strength Index Score (3 Year Range Pct):88.58.528.4
– Strength Index Reading (3 Year Range):Bullish-ExtremeBearish-ExtremeBearish
NET POSITION MOVEMENT INDEX:
– 6-Week Change in Strength Index:-1.2-15.95.8


Article By InvestMacroReceive our weekly COT Reports by Email

*COT Report: The COT data, released weekly to the public each Friday, is updated through the most recent Tuesday (data is 3 days old) and shows a quick view of how large speculators or non-commercials (for-profit traders) were positioned in the futures markets.

The CFTC categorizes trader positions according to commercial hedgers (traders who use futures contracts for hedging as part of the business), non-commercials (large traders who speculate to realize trading profits) and nonreportable traders (usually small traders/speculators) as well as their open interest (contracts open in the market at time of reporting).See CFTC criteria here.

Ichimoku Cloud Analysis 01.04.2022 (AUDNZD, EURJPY, GBPCHF)

Article By RoboForex.com

AUDNZD, “Australian Dollar vs New Zealand Dollar”

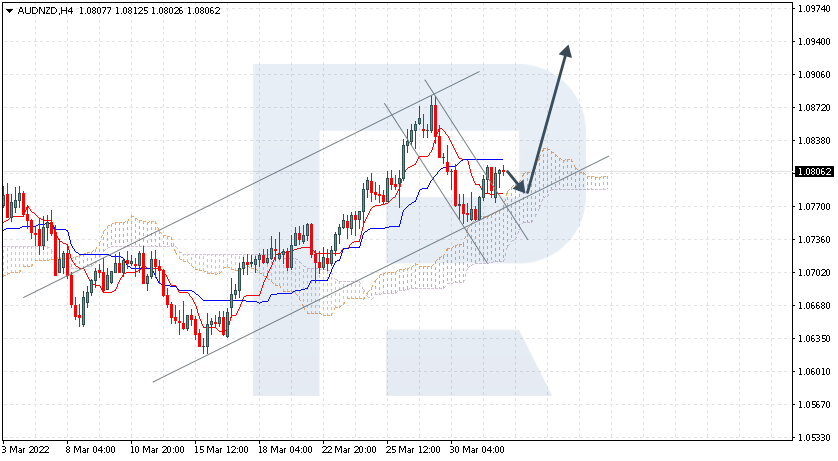
AUDNZD is rebounding from Tenkan-Sen and Kijun-Sen at 1.0806; the instrument is moving above Ichimoku Cloud, thus indicating an ascending tendency. The markets could indicate that the price may test the cloud’s upside border at 1.0795 and then resume moving upwards to reach 1.0940. Another signal in favour of a further uptrend will be a rebound from the rising channel’s downside border. However, the bullish scenario may no longer be valid if the price breaks the cloud’s downside border and fixes below 1.0725. In this case, the pair may continue falling towards 1.0635.

AUDNZD
Risk Warning: the result of previous trading operations do not guarantee the same results in the future

EURJPY, “Euro vs Japanese Yen”

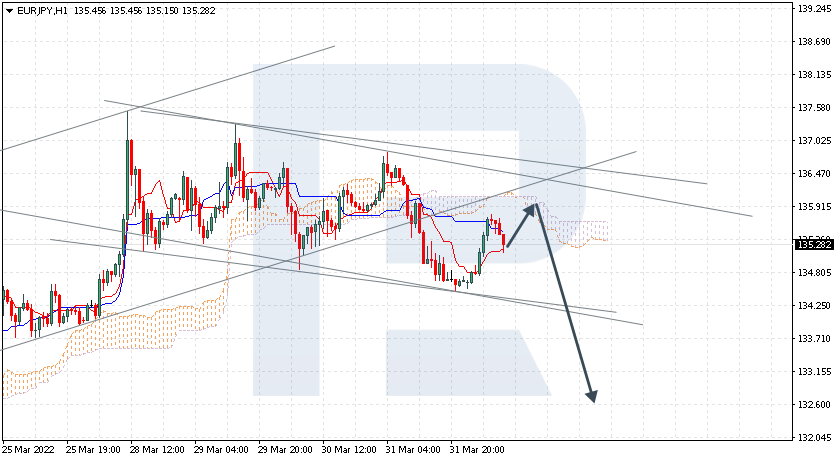
EURJPY is testing Tenkan-Sen and Kijun-Sen at 135.28; the instrument is moving below Ichimoku Cloud, thus indicating a descending tendency. The markets could indicate that the price may test the cloud’s downside border at 135.90 and then resume moving downwards to reach 132.60. Another signal in favour of a further downtrend will be a rebound from the rising channel’s downside border. However, the bearish scenario may no longer be valid if the price breaks the cloud’s upside border and fixes above 136.50. In this case, the pair may continue growing towards 137.45.

EURJPY
Risk Warning: the result of previous trading operations do not guarantee the same results in the future

GBPCHF, “Great Britain Pound vs Swiss Franc”

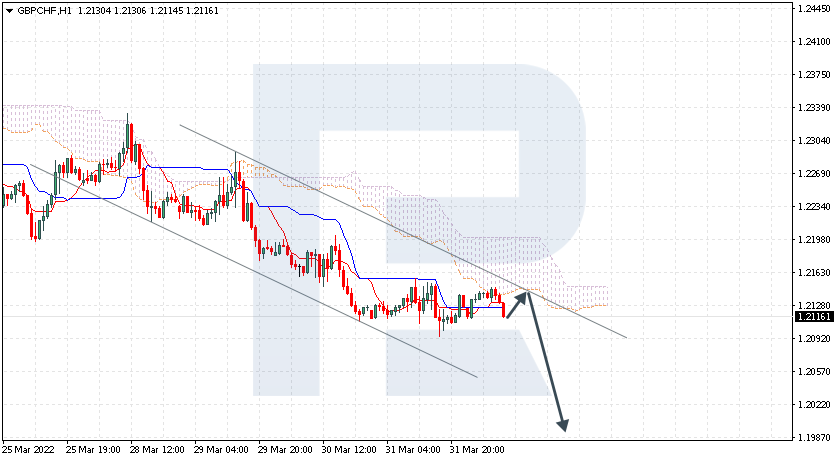
GBPCHF has rebounded from the resistance area at 1.2116; the instrument is moving below Ichimoku Cloud, thus indicating a descending tendency. The markets could indicate that the price may test the cloud’s downside border at 1.2130 and then resume moving downwards to reach 1.1995. Another signal in favour of a further downtrend will be a rebound from the descending channel’s upside border. However, the bearish scenario may no longer be valid if the price breaks the cloud’s upside border and fixes above 1.22105 In this case, the pair may continue growing towards 1.2305.

GBPCHF

Article By RoboForex.com

Attention!
Forecasts presented in this section only reflect the author’s private opinion and should not be considered as guidance for trading. RoboForex LP bears no responsibility for trading results based on trading recommendations described in these analytical reviews.

Intraday Market Analysis – USD Seeks Support

By Orbex

GBPUSD attempts to rebound

GBPUSD

The US dollar went sideways as February’s PCE fell short of expectations. The pair met stiff selling pressure around 1.3300, a supply zone next to the 30-day moving average.

A break below 1.3120 may have cast doubt on the viability of the previous rebound after short-term buyers rushed to the exit. 1.3220 is now a fresh resistance and buyers’ failure to lift these offers could send the pound into a deeper correction.

Price action may revisit the psychological level of 1.3000 if it drops below 1.3070.

NZDUSD sees a limited pullback

NZDUSD

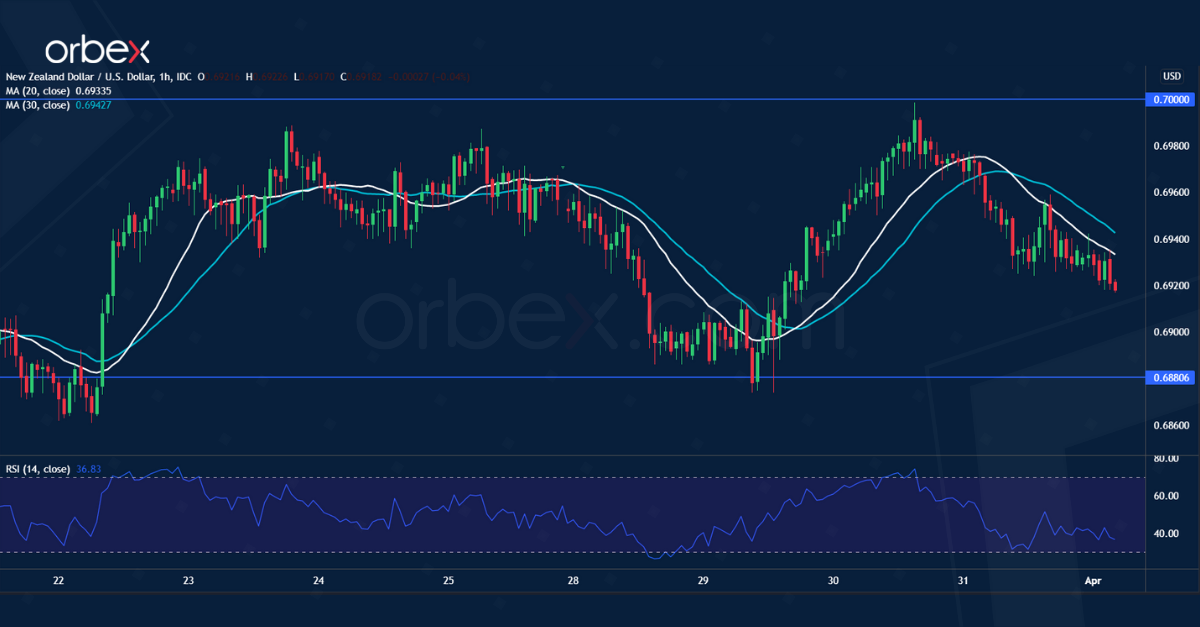
The New Zealand dollar falls back as risk appetite subdues. The pair hit resistance under the psychological level of 0.7000 after it broke to a new high.

The RSI’s overbought condition in this supply zone led buyers to take profit, driving the kiwi lower momentarily. Trend followers may see the retracement as a buying opportunity.

Sentiment would stay bullish as long as the pair is above the previous low at 0.6880. A bearish breakout may dent short-term optimism and send the kiwi to 0.6790.

US 30 keeps high ground

US 30

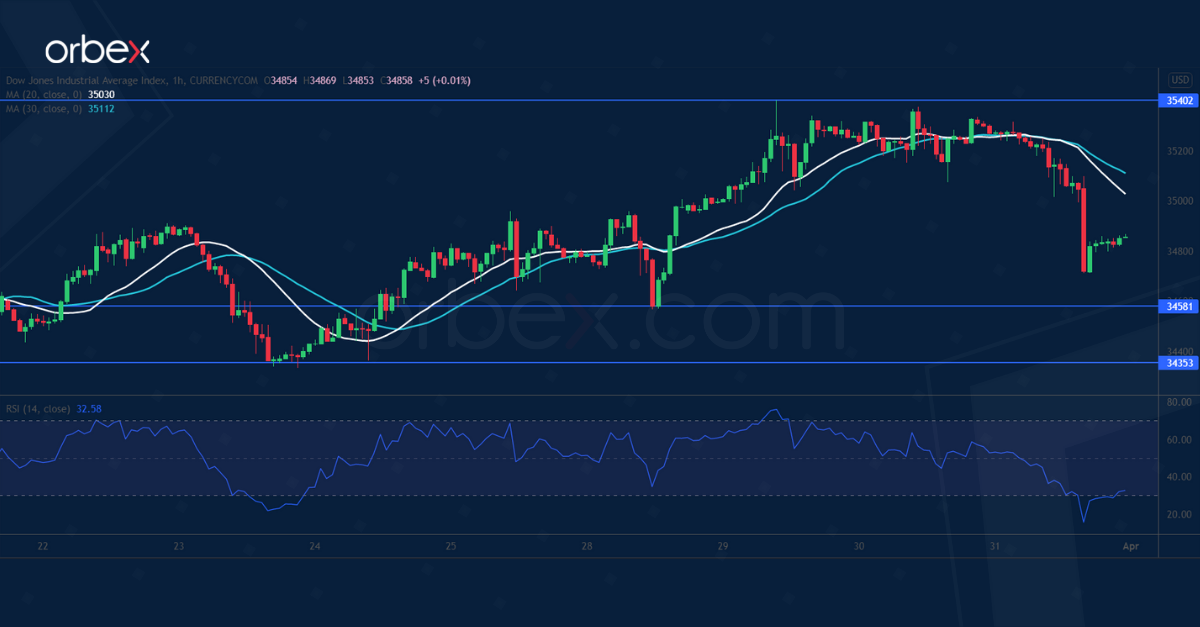
The Dow Jones 30 retreats on profit-taking as the first quarter draws to an end. A bullish MA cross on the daily chart suggests that the rebound is picking up steam.

The index hit resistance around 35400 and went horizontal, allowing the bulls to take a breather. Buyers may find relief as the RSI tanks into the oversold area.

A rebound would propel the Dow to February’s high at 35870, where a bullish breakout could resume the uptrend in the medium term. The demand area between 34350 and 34580 is an important level.


Orbex-LogoArticle by Orbex

Orbex is a fully licensed broker that was established in 2011. Founded with a mission to serve its traders responsibly and provides traders with access to the world’s largest and most liquid financial markets. www.orbex.com

The Analytical Overview of the Main Currency Pairs on 2022.04.01

by JustForex

The EUR/USD currency pair

Technical indicators of the currency pair:
  • Prev Open: 1.1155
  • Prev Close: 1.1065
  • % chg. over the last day: -0.90 %

The number of new jobless claims in the US was 202,000, while analysts expected 196,000. In February, US household spending increased by 0.2%, while a 0.5% growth was expected. As for personal income, it increased by 0.5%, as expected. If incomes grow faster than expenses, this is a good sign for the economy, especially for stock indices. But a negative factor for the dollar index. In February, Eurozone unemployment fell to 6.8% from 6.9%. Eurozone inflation data will be released today. Analysts forecast inflation to rise from 5.9% to 6.6% year on year. Reducing unemployment along with rising inflation are prerequisites for the monetary policy tightening on the part of the ECB.

Trading recommendations
  • Support levels: 1.1037, 1.1017, 1.0963, 1.0917, 1.0887, 1.0823, 1.0633
  • Resistance levels: 1.1149, 1.1196, 1.1291

From the technical point of view, the trend on the EUR/USD currency pair on the hourly time frame has changed to bullish. At the moment, the price has corrected and is trading between the moving averages. The MACD indicator is in the negative zone. Under such market conditions, it is better to look for buy trades on intraday timeframes from the support level of 1.1037. Sell trades should be considered from the resistance level of 1.1149, but only after the additional confirmation.

Alternative scenario: if the price breaks down through the 1.1017 support level and fixes below, the uptrend will likely be broken.

EUR/USD
News feed for 2022.04.01:
  • – French Manufacturing PMI (m/m) at 10:50 (GMT+3);
  • – German Manufacturing PMI (m/m) at 10:55 (GMT+3);
  • – Eurozone Manufacturing PMI (m/m) at 11:00 (GMT+3);
  • – Eurozone Consumer Price Index (m/m) at 12:00 (GMT+3);
  • – US Nonfarm Payrolls (m/m) at 15:30 (GMT+3);
  • – US Unemployment Rate (m/m) at 15:30 (GMT+3);
  • – US ISM Manufacturing PMI (m/m) at 17:00 (GMT+3).

The GBP/USD currency pair

Technical indicators of the currency pair:
  • Prev Open: 1.3129
  • Prev Close: 1.3142
  • % chg. over the last day: +0.10%

The news that the US intends to release up to 180 million barrels of oil from its strategic reserves in six months is a negative factor for the British pound, as the pound is directly correlated with Brent oil quotes, which in turn is highly correlated with the US WTI oil quotes. Given the Fed’s aggressive policies, the British pound could lose much of its position if the Bank of England does not continue to raise interest rates. Currently, the Bank of England has decided to suspend monetary policy tightening.

Trading recommendations
  • Support levels: 1.3117, 1.3074, 1.3015, 1.2989, 1.2863
  • Resistance levels: 1.3161, 1.3244, 1.3274

On the hourly time frame, the GBP/USD currency pair trend is bullish. The price movement pattern is beginning to show a flat structure. The MACD indicator became inactive. Under such market conditions, buy trades should be considered from the support level of 1.3117, but better with confirmation. Sell deals should be considered from the resistance level of 1.3244, but only with short targets.

Alternative scenario: if the price breaks down through the 1.3074 support level and fixes below, the mid-term uptrend will likely be broken.

GBP/USD
News feed for 2022.04.01:
  • – UK Manufacturing PMI (m/m) at 11:30 (GMT+3).

The USD/JPY currency pair

Technical indicators of the currency pair:
  • Prev Open: 121.84
  • Prev Close: 121.69
  • % chg. over the last day: -0.12%

The fundamental picture for the Japanese Yen remains unchanged. The monetary policy of the Bank of Japan is now “ultra-soft” and is aimed at decreasing the national currency rate (USD/JPY growth). Due to the Сentral Bank of Japan’s work in the debt market, the Japanese Yen is now temporarily strengthening. However, the mid-term outlook remains unchanged – analysts see a continuation of the uptrend, as the monetary policy of the US and Japanese central banks are now diametrically opposed.

Trading recommendations
  • Support levels: 120.88, 119.52, 117.72
  • Resistance levels: 122.83, 123.44,125.22

The medium-term trend on the USD/JPY currency pair is bullish. The price corrected to the moving averages. The MACD indicator has become positive. Under such market conditions, it is best to look for buy deals, expecting the continuation of the uptrend. First of all, it is worth considering the support level of 120.88, but with additional confirmation. For sell deals, a resistance level of 122.83 or 123.44 may be considered, but only after the sellers’ initiative.

Alternative scenario: If the price fixes below 119.52, the uptrend will likely be broken.

USD/JPY
News feed for 2022.04.01:
  • – Japan Final Manufacturing PMI (m/m) at 03:30 (GMT+3).

The USD/CAD currency pair

Technical indicators of the currency pair:
  • Prev Open: 1.2479
  • Prev Close: 1.2505
  • % chg. over the last day: +0.21%

The Canadian dollar is a commodity currency and is highly dependent on the movement of oil prices and the dollar index. OPEC+ will stick to its current plan to increase oil production, as OPEC+ ministers see a balanced oil market and increased volatility through the geopolitics. The next OPEC+ ministerial meeting will take place on May 5. After OPEC+ did not raise its production plan, the US said it would release a record 1 million barrels of oil a day from its strategic reserve for six months. This move will limit the rise in oil prices, which in combination with the rise in the dollar index may lead to an increase in the USD/CAD currency pair. The only thing that can prevent this is the monetary policy of the Central Bank of Canada, which, like the Fed, is preparing for a tightening.

Trading recommendations
  • Support levels: 1.2486, 1.2453
  • Resistance levels: 1.2563, 1.2655, 1.2713, 1.2754, 1.2851

In terms of technical analysis, the USD/CAD currency pair trend is bearish. The MACD indicator has become inactive, but the pressure on buyers remains. Trade only with short targets, since on the USD/CAD currency pair fundamentally, there are no prerequisites for the medium-term trend, as the dollar index in the medium term also has the support of the Fed. Under such market conditions, it is better to look for buy trades on the lower timeframes from the support level of 1.2486, but it is better with additional confirmation. For sell deals, it is better to consider the resistance level of 1.2563.

Alternative scenario: if the price breaks through and consolidates above 1.2654, the downtrend will likely be broken.

USD/CAD
News feed for 2022.04.01:
  • – Canada Manufacturing PMI (m/m) at 16:30 (GMT+3).

by JustForex


This article reflects a personal opinion and should not be interpreted as an investment advice, and/or offer, and/or a persistent request for carrying out financial transactions, and/or a guarantee, and/or a forecast of future events.

The US announced a record release of its oil reserves, inflation in Europe at record levels

by JustForex

On Thursday, global stock indices fell amid fears of recession, and Russia’s invasion of Ukraine boosted sales. Oil prices fell more than $6 after the US announced a record release of its strategic reserves. The Dow Jones index (US30) decreased by 1.56% yesterday, the S&P 500 index (US500) lost 1.57%, and the NASDAQ technology index (US100) fell by 1.54%. Analysts see a stock market downturn over the next two quarters as record inflation in the US forces the Fed to aggressively raise interest rates, which will eventually lead to higher government bond yields, the rising dollar index, and lower stock indices. Investors need to balance their portfolios.

“The inverted Treasury yield curve is one of the signals that future US stock earnings will be disappointing,” said Nicholas Colas, co-founder of DataTrek Research. The inversion of the US yield curve is seen as a reliable signal that a recession may follow within a year or two.

The economic slowdown, rising inventories, declining demand, and lower household purchasing power will further reduce inflationary pressures in the second half of the year. As a result, the Fed will stop aggressively raising rates. Therefore, the new portfolio purchase agreement should be considered at the end of the third or beginning of the fourth quarter of 2022, but not earlier.

On Wednesday, European stock markets were mostly decreasing. Yesterday, German DAX (DE30) fell by 1.31%, French CAC 40 (FR40) lost 1.21%, Spanish IBEX 35 (ES35) decreased by 1.23%, British FTSE 100 (UK100) lost 0.83%. Following the negative inflation data from Spain and Germany, inflation data also showed a record price increase in France in March and increased to 7% year on year in Italy. Inflation data for the Eurozone will be released today. Analysts forecast an increase in inflation from 5.9% to 6.6% year on year. Reducing unemployment along with rising inflation are prerequisites for tightening the ECB monetary policy.

The US Treasury Department is considering imposing sanctions on any individuals or organizations involved in the aerospace, maritime, and electronic sectors of the Russian economy.

Russia has banned entry to high-ranking EU and US officials responding to sanctions.

Putin said he had signed a decree on the rules of gas trade with unfriendly countries. They will have to open ruble accounts in Russian banks. Existing gas supply contracts will be terminated if buyers from unfriendly countries do not comply with the new payment terms. The new rules will take effect on April 1. Existing contracts for the purchase of Russian gas will be terminated if buyers refuse to pay in rubles. The UK, France, and Germany have already indicated that they are not going to pay in rubles for gas. Gas prices in Europe have accelerated and jumped up to almost $1450.

At the end of the meeting, OPEC+ will adhere to its existing plan to increase oil production. OPEC+ ministers see a balanced oil market, and the volatility is increased due to geopolitics. The next meeting of OPEC+ ministers will take place on May 5. After OPEC+ did not raise its production plan, the US said it would release 1 million barrels of oil daily from its strategic reserve for six months. In total, it is planned to release up to 180 million barrels over six months, which, if implemented, will be the largest release from the reserve since its creation in 1975. This step will limit the rise in oil prices.

Gold is rising again, but investors should be aware that gold is inversely correlated to government bond yields, the movement of which depends on the Fed’s monetary policy. As the Fed hikes rates aggressively this year, the dollar index and the government bond yields will rise, and gold and silver prices will fall. The current rise in gold is speculative amid rising inflation in the US and Europe.

The Russian ruble strengthened for the ninth session in a row, trading at about 83 rubles per dollar, while stocks jumped due to the removal of some restrictions on short-selling. The ruble’s exchange rate dynamics are currently created artificially. The currency, which was in free circulation until the end of February, is now governed by capital control, a ban on the purchase of cash dollars and euros, and other administrative measures. Analysts are confident that the Central Bank of Russia will not be able to maintain such a course for long.

Asian markets traded in negative territory yesterday. Japan’s Nikkei 225 (JP225) decreased by 0.73%, Hong Kong’s Hang Seng (HK50) lost 1.06%, and Australia’s S&P/ASX 200 (AU200) ended the day down by 0.20%. China has decided to restrict visas for some US officials in response to US visa restrictions for some Chinese officials. Shares of Chinese company Baidu plummeted 7.5% due to the threat of delisting. The SEC warned Baidu of delisting from US stock exchanges due to audit data. A curfew has been imposed in Sri Lanka after protests over the economic crisis turned violent. Hundreds of protesters gathered near the president’s private residence in the Colombo suburb late Thursday night and were dispersed by police using tear gas and water cannons.

Main market quotes:

S&P 500 (F) (US500) 4,530.41 -72.04 (-1.57%)

Dow Jones (US30) 34,678.35 -550.46 (-1.56%)

DAX (DE40) 14,414.75 -191.30 (-1.31%)

FTSE 100 (UK100) 7,515.68 -63.07 (-0.83%)

USD Index 98.37 +0.58 (+0.59%)

Important events for today:
  • – Japan Final Manufacturing PMI (m/m) at 03:30 (GMT+3);
  • – China Caixin Manufacturing PMI (m/m) at 04:45 (GMT+3);
  • – Switzerland Consumer Price Index (m/m) at 10:30 (GMT+3);
  • – French Manufacturing PMI (m/m) at 10:50 (GMT+3);
  • – German Manufacturing PMI (m/m) at 10:55 (GMT+3);
  • – Eurozone Manufacturing PMI (m/m) at 11:00 (GMT+3);
  • – UK Manufacturing PMI (m/m) at 11:30 (GMT+3);
  • – Eurozone Consumer Price Index (m/m) at 12:00 (GMT+3);
  • – US Nonfarm Payrolls (m/m) at 15:30 (GMT+3);
  • – US Unemployment Rate (m/m) at 15:30 (GMT+3);
  • – Canada Manufacturing PMI (m/m) at 16:30 (GMT+3);
  • – US ISM Manufacturing PMI (m/m) at 17:00 (GMT+3).

by JustForex


This article reflects a personal opinion and should not be interpreted as an investment advice, and/or offer, and/or a persistent request for carrying out financial transactions, and/or a guarantee, and/or a forecast of future events.

Japanese Candlesticks Analysis 31.03.2022 (EURUSD, USDJPY, EURGBP)

Article By RoboForex.com

EURUSD, “Euro vs US Dollar”

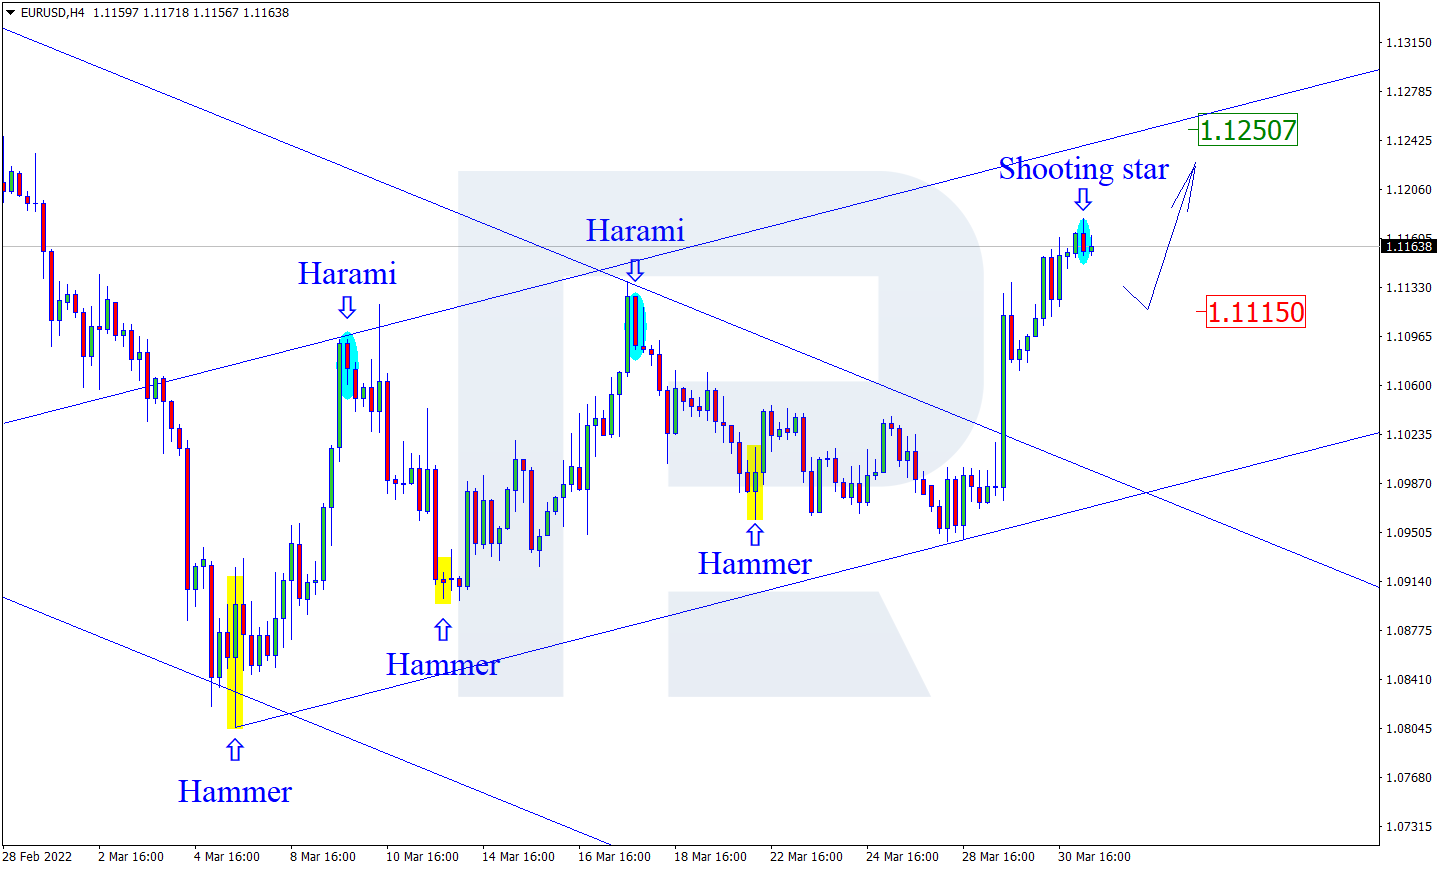
As we can see in the H4 chart, the asset has formed a Shooting Star reversal pattern close to the resistance area. At the moment, EURUSD is reversing in the form of a new descending impulse. In this case, the downside target may be at 1.1115. However, an alternative scenario implies that the price may grow to reach 1.1250 and continue the downtrend without any corrections towards the support level.

EURUSD
Risk Warning: the result of previous trading operations do not guarantee the same results in the future

USDJPY, “US Dollar vs Japanese Yen”

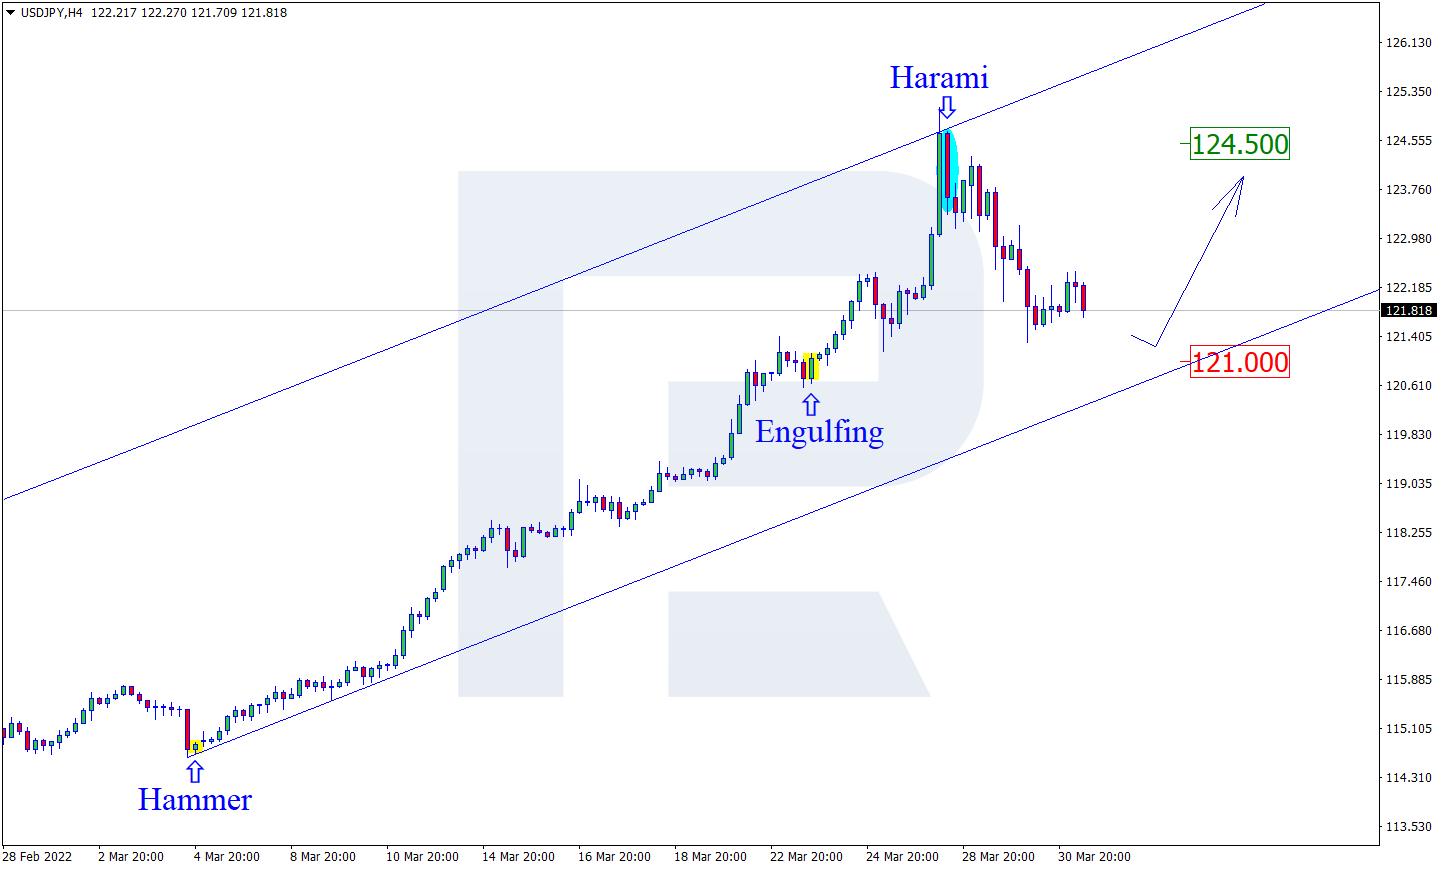
As we can see in the H4 chart, USDJPY has formed a Harami pattern not far from the resistance level. At the moment, the asset may reverse and start a new descending impulse. In this case, the downside correctional target may be at 121.00. At the same time, an opposite scenario implies that the price may grow to reach 124.50 without testing the support area.

USDJPY
Risk Warning: the result of previous trading operations do not guarantee the same results in the future

EURGBP, “Euro vs Great Britain Pound”

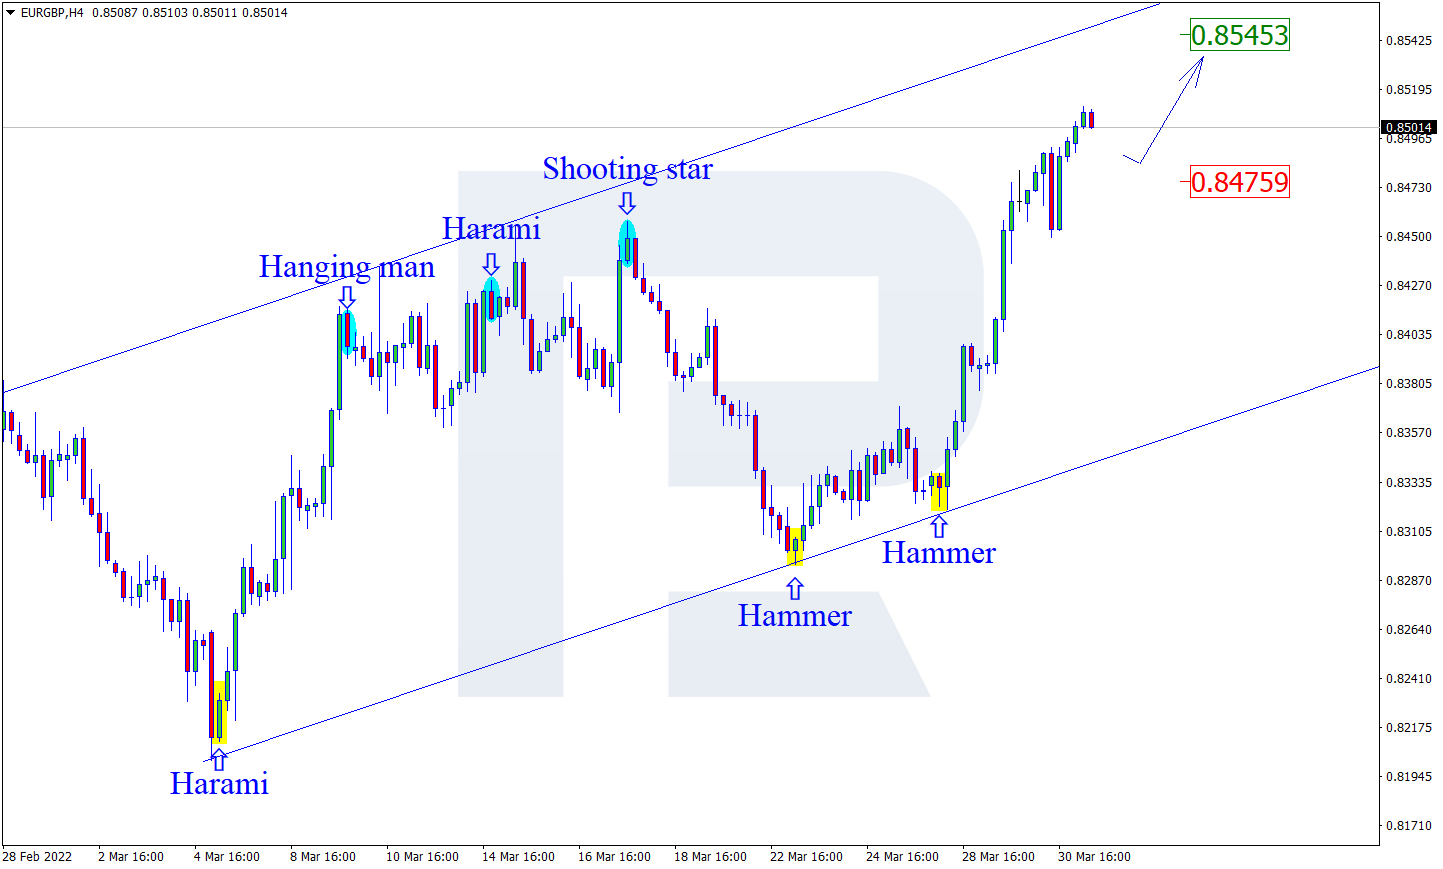
As we can see in the H4 chart, after forming a Hammer reversal pattern near the support area, EURGBP is reversing and may start another ascending wave. In this case, the upside target may be at 0.8545. Later, the market may test the resistance level, break it, and continue the ascending tendency. Still, there might be an alternative scenario, according to which the asset may correct to reach 0.8475 first and then resume trading upwards.

EURGBP

Article By RoboForex.com

Attention!
Forecasts presented in this section only reflect the author’s private opinion and should not be considered as guidance for trading. RoboForex LP bears no responsibility for trading results based on trading recommendations described in these analytical reviews.

Murrey Math Lines 31.03.2022 (USDCHF, GOLD)

Article By RoboForex.com

USDCHF, “US Dollar vs Swiss Franc”

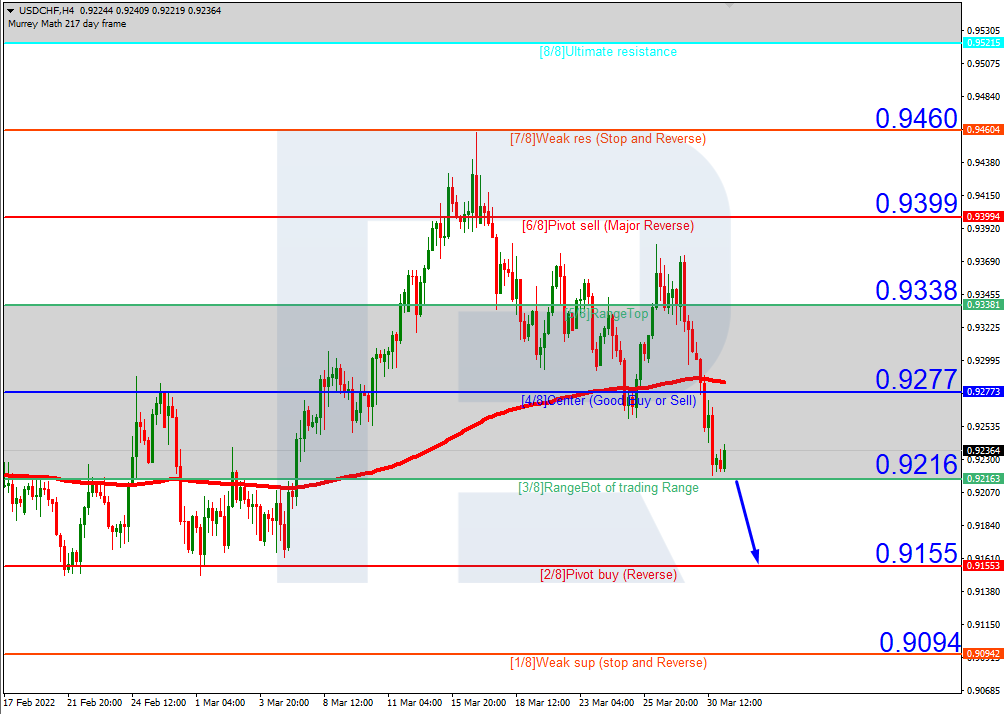
In the H4 chart, after breaking the 200-day Moving Average, USDCHF is trading below it to indicate a possible descending tendency. In this case, the price is expected to break 3/8 and then continue falling to reach the support at 2/8. However, this scenario may be cancelled if the price breaks the resistance at 4/8 to the upside. After that, the instrument may reverse and grow towards 5/8.

USDCHFH4
Risk Warning: the result of previous trading operations do not guarantee the same results in the future

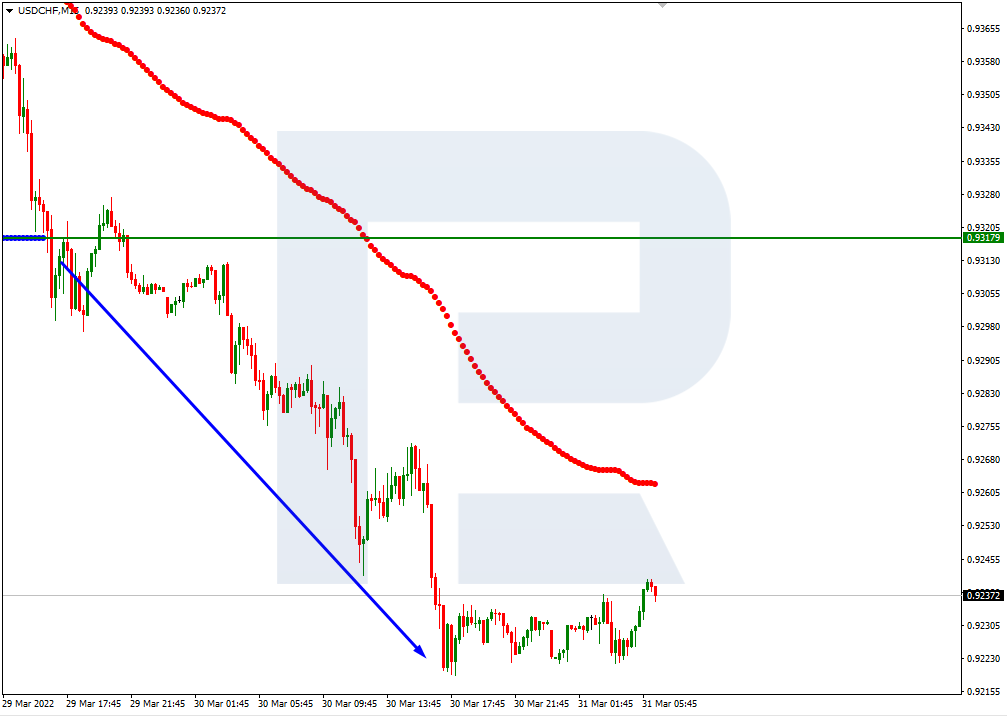
As we can see in the M15 chart, the pair has broken the downside line of the VoltyChannel indicator and, as a result, may continue trading downwards.

USDCHF_M15
Risk Warning: the result of previous trading operations do not guarantee the same results in the future

XAUUSD, “Gold vs US Dollar”

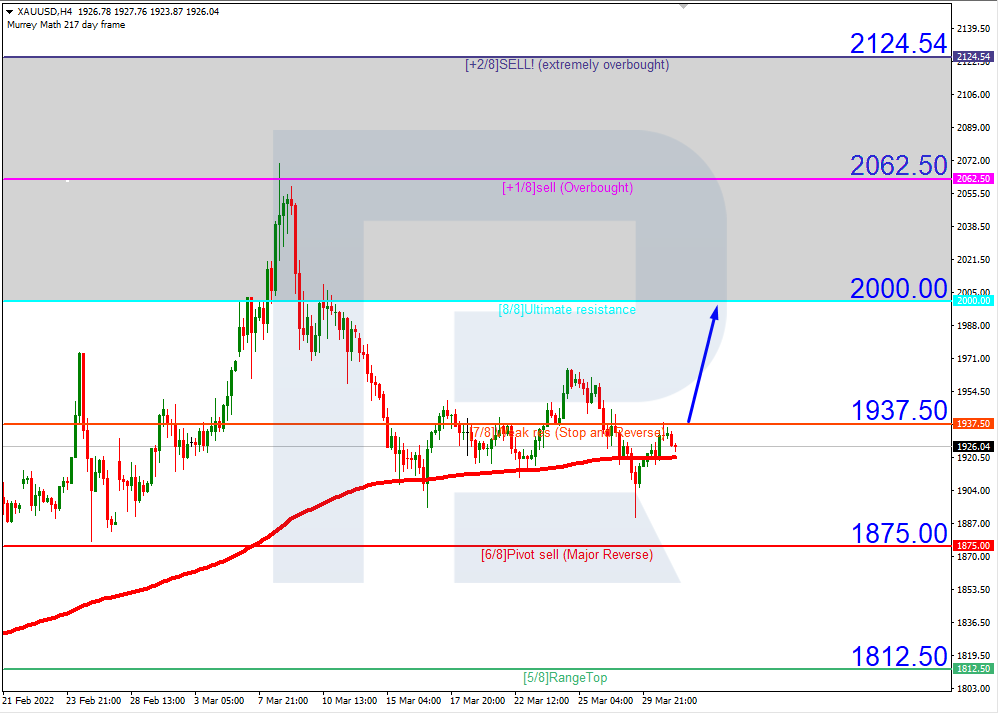
As we can see in the H4 chart, XAUUSD is trading above the 200-day Moving Average, thus indicating a further ascending tendency. In this case, the price is expected to break 7/8 and continue moving upwards to reach the resistance at 8/8. However, this scenario may no longer be valid if the price breaks the support at 6/8 to the downside. After that, the instrument may reverse and form a new descending wave towards 5/8.

XAUUSD_H4
Risk Warning: the result of previous trading operations do not guarantee the same results in the future

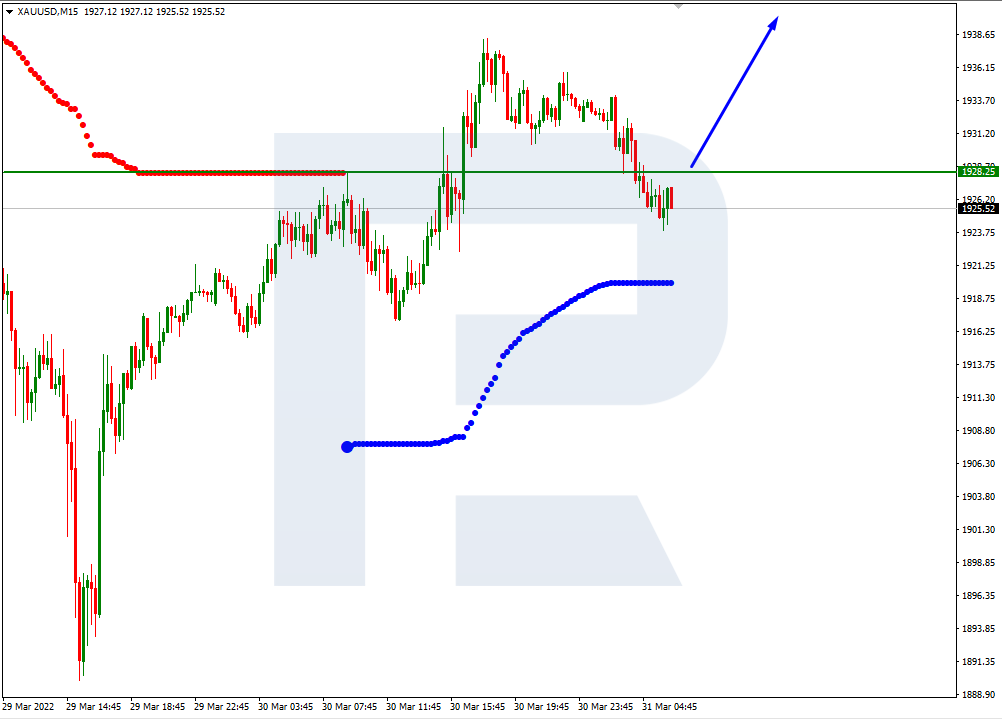
In the M15 chart, the pair may break the upside line of the VoltyChannel indicator and, as a result, continue growing.

XAUUSD_M15
Risk Warning: the result of previous trading operations do not guarantee the same results in the future

Article By RoboForex.com

Attention!
Forecasts presented in this section only reflect the author’s private opinion and should not be considered as guidance for trading. RoboForex LP bears no responsibility for trading results based on trading recommendations described in these analytical reviews.

The Analytical Overview of the Main Currency Pairs on 2022.03.31

by JustForex

The EUR/USD currency pair

Technical indicators of the currency pair:
  • Prev Open: 1.1086
  • Prev Close: 1.1157
  • % chg. over the last day: +0.64%

Spain’s consumer price index jumped from 7.6% to 9.8% year on year. This is the highest value in 30 years. Inflation if Germany rose in March to its highest level in more than 40 years due to higher prices for natural gas and oil products. The annual consumer price index was 7.3% against 5.1% in February. Such a jump in inflation in the EU countries may force the ECB to reconsider its monetary policy towards tightening. That is why the European currency is reacting higher as investors are already considering a tightening scenario. The higher the interest rates, the stronger the national exchange rate.

Trading recommendations
  • Support levels: 1.1136, 1.1037, 1.1017, 1.0963, 1.0917, 1.0887, 1.0823, 1.0633
  • Resistance levels: 1.1196, 1.1291

From the technical point of view, the EUR/USD currency pair trend on the hourly time frame has changed to bullish. The price confidently broke through the priority change level and consolidated above the moving averages. The MACD indicator is in the positive zone, the buyers’ pressure has intensified. Under such market conditions, it is better to look for buy trades on intraday timeframes from the support levels of 1.1037 or 1.1018 around the moving averages. Sell trades should be considered from the support level of 1.1196, but only after a false breakout and only with short targets.

Alternative scenario: if the price breaks down through the 1.1017 support level and fixes below, the uptrend will likely be broken.

EUR/USD
News feed for 2022.03.31:
  • – German Retail Sales at 09:00 (GMT+3);
  • – German Unemployment Rate (m/m) at 10:55 (GMT+3);
  • – Eurozone Unemployment Rate (m/m) at 12:00 (GMT+3);
  • – US Initial Jobless Claims (w/w) at 15:30 (GMT+3);
  • – US Core PCE Price Index (m/m) at 15:30 (GMT+3);
  • – US FOMC Member Williams Speech at 16:00 (GMT+3);
  • – US Chicago PMI (m/m) at 16:45 (GMT+3);
  • – US Natural Gas Storage (w/w) at 17:30 (GMT+3).

The GBP/USD currency pair

Technical indicators of the currency pair:
  • Prev Open: 1.3083
  • Prev Close: 1.3135
  • % chg. over the last day: +0.39%

UK GDP grew by 1.3% in Q4, a growth of 1% was expected. But economic indicators now have little effect on the economy. Geopolitics and the health of the dollar index came out on top. And as geopolitical tensions persist in Eastern Europe and the US Federal Reserve intends to aggressively tighten monetary policy, these factors combine to hurt the British pound.

Trading recommendations
  • Support levels: 1.3117, 1.3074, 1.3015, 1.2989, 1.2863
  • Resistance levels: 1.3181, 1.3244, 1.3274

On the hourly time frame, the GBP/USD currency pair trend is bullish. The price movement pattern starts to show a flat structure. The MACD indicator became inactive. Under such market conditions, buy trades should be considered from the support level of 1.3117, but better with confirmation. For sell deals, it is better to consider the resistance level of 1.3161, but only with short targets.

Alternative scenario: if the price breaks down through the 1.3074 support level and fixes below, the mid-term uptrend will likely be broken.

GBP/USD
News feed for 2022.03.31:
  • – UK GDP (q/q) at 09:00 (GMT+3).

The USD/JPY currency pair

Technical indicators of the currency pair:
  • Prev Open: 122.87
  • Prev Close: 121.82
  • % chg. over the last day: -0.86%

The monetary policy of the Bank of Japan is now “ultra-soft” and is aimed at decreasing the national currency rate (USD/JPY growth). But against the backdrop of the dollar index, and also thanks to the work of the Central Bank of Japan on the debt market, the Japanese yen is now temporarily strengthening. The medium-term forecast remains unchanged – analysts see a continuation of the uptrend.

Trading recommendations
  • Support levels: 120.88, 119.52, 117.72
  • Resistance levels: 122.83, 123.44,125.22

The medium-term trend on the USD/JPY currency pair is bullish. But amid the decline in the dollar index, the price began a corrective movement. The MACD indicator has become negative. Under such market conditions, it is best to look for buy deals, expecting the continuation of the uptrend. First of all, it is worth considering the support level of 120.88, but with additional confirmation. For sell deals, a resistance level of 122.83 or 123.44 may be considered, but only after the sellers’ initiative.

Alternative scenario: If the price fixes below 119.52, the uptrend will likely be broken.

USD/JPY
News feed for 2022.03.31:
  • – Japan Industrial Production (m/m) at 02:50 (GMT+3).

The USD/CAD currency pair

Technical indicators of the currency pair:
  • Prev Open: 1.2491
  • Prev Close: 1.2481
  • % chg. over the last day: -0.08%

The Canadian dollar is a commodity currency and is highly dependent on the movement of oil prices and the dollar index. The weekly drop-in crude oil inventories were accompanied by the release of almost the same amount of oil from the US reserves, which led to a slight decrease in oil prices yesterday. As a result, the USD/CAD pair jumped yesterday, despite a decline in the dollar index. OPEC+ producing countries will meet today. However, analysts do not expect anything substantial from this meeting and are confident that OPEC+ will not increase oil production since high oil prices are beneficial to almost all producing countries except the US.

Trading recommendations
  • Support levels: 1.2453
  • Resistance levels: 1.2563, 1.2655, 1.2713, 1.2754, 1.2851

In terms of technical analysis, the USD/CAD currency pair trend is bearish. The MACD indicator has become positive. The buyer’s pressure has increased. Trade only with short targets, since on the USD/CAD currency pair fundamentally, there are no prerequisites for the medium-term trend, as the dollar index in the medium-term also has the support of the Fed. Under such market conditions, it is better to look for buy trades on the lower timeframes from the support level of 1.2453, but it is better with additional confirmation. For sell deals, it is better to consider the resistance level of 1.2563.

Alternative scenario: if the price breaks through and consolidates above 1.2654, the downtrend will likely be broken.

USD/CAD
News feed for 2022.03.31:
  • – OPEC+ Meeting at 13:00 (GMT+3);
  • – Canada GDP (m/m) at 15:30 (GMT+3).

by JustForex


This article reflects a personal opinion and should not be interpreted as an investment advice, and/or offer, and/or a persistent request for carrying out financial transactions, and/or a guarantee, and/or a forecast of future events.

Amid record inflation in Europe, investors expect ECB to tighten policy

by JustForex

In April, private-sector job growth was surprisingly positive, but fourth-quarter GDP was revised down unexpectedly by a tenth of a percentage point. Investors also continue to monitor the US debt market. Yield spreads on 10- and 2-year Treasury bonds continue to show inversion, raising serious concerns about an impending recession. The Federal Reserve may be tightening policy too aggressively in the near term, and analyst houses are already predicting the next three 0.5% interest rate hikes.

“Given the state of the economy, inflation at its highest level in 40 years, and an unemployment rate close to a record low, it is appropriate to move quickly to neutral policy,” Kansas City Fed President Esther George said on Wednesday. Thomas Barkin, Head of the Federal Reserve Bank of Richmond, said he was ready to raise rates by half a point at the next meeting.

US indices decreased yesterday. The Dow Jones (US30) lost 0.19%, the S&P 500 (US500) fell by 0.63%, and the NASDAQ technology index (US100) decreased by 1.21%.

On Wednesday, European stock markets were mostly down, losing some of the gains of the previous session amid skepticism about the likely success of the latest peace talks between Ukraine and Russia. German DAX (DE30) decreased by 1.45% yesterday, French CAC 40 (FR40) lost 0.74%, Spanish IBEX 35 (ES35) decreased by 0.74%, and only British FTSE 100 (UK100) added 0.55%. Inflation in Germany increased in March to its highest level in more than 40 years due to higher prices for natural gas and oil products. The annual consumer price index was 7.3% compared to 5.1% in February. Such a jump in inflation in the EU countries may force the ECB to reconsider its monetary policy towards tightening. Now in Europe, there is a sale of European short-term bonds. This means that investors are already betting that higher-than-expected inflation will force the European Central Bank to raise interest rates. But despite rising inflation, Germany is preparing to cut Russian gas supplies by activating the first phase of its national contingency plan. The composite index of business and consumer confidence in the Eurozone fell to 108.5 from 113.9 in March, according to the European Commission.

The weekly drop-in crude oil inventories were accompanied by the release of almost the same amount of oil from the US Strategic Oil Reserves. The United States and its allies plan to impose new sanctions on more sectors of the Russian economy, including military supply chains. The OPEC+ countries will meet today. According to several sources, major oil producers are likely to stick to their planned target of increasing production by about 432,000 bpd.

Asian markets traded without a single trade yesterday. Japan’s Nikkei 225 (JP225) decreased by 0.80%, Hong Kong’s Hang Seng (HK50) added 1.39%, and Australia’s S&P/ASX 200 (AU200) increased by 0.67%. China’s manufacturing PMI fell to 49.5 points in March from 50.2 points the previous month, according to the State Bureau of Statistics (SBS). A PMI value above 50 points indicates an increase in activity in the sector, while a lower value indicates a weakening of activity. In Australia, building permits increased by 43.5% month-over-month, while private sector lending increased by 0.6% month-over-month in February.

Analysts say global stock indices are bracing for the worst quarter in 2 years as Russia’s invasion of Ukraine puts upward pressure on commodity prices, forcing the global central banks to revise their monetary policy.

Main market quotes:

S&P 500 (F) (US500) 4,602.45 -29.15 (-0.63%)

Dow Jones (US30) 35,228.81 -65.38 (-0.19%)

DAX (DE40) 14,606.05 -214.28 (-1.45%)

FTSE 100 (UK100) 7,578.75 +41.50 (+0.55%)

USD Index 97.83 -0.58 (-0.59%)

Important events for today:
  • – Japan Industrial Production (m/m) at 02:50 (GMT+3);
  • – China Manufacturing PMI (m/m) at 04:30 (GMT+3);
  • – China Non-Manufacturing PMI (m/m) at 04:30 (GMT+3);
  • – UK GDP (q/q) at 09:00 (GMT+3);
  • – German Retail Sales at 09:00 (GMT+3);
  • – German Unemployment Rate (m/m) at 10:55 (GMT+3);
  • – Eurozone Unemployment Rate (m/m) at 12:00 (GMT+3);
  • – OPEC+ Meeting at 13:00 (GMT+3);
  • – Canada GDP (m/m) at 15:30 (GMT+3);
  • – US Initial Jobless Claims (w/w) at 15:30 (GMT+3);
  • – US Core PCE Price Index (m/m) at 15:30 (GMT+3);
  • – US FOMC Member Williams Speech at 16:00 (GMT+3);
  • – US Chicago PMI (m/m) at 16:45 (GMT+3);
  • – US Natural Gas Storage (w/w) at 17:30 (GMT+3).

by JustForex


This article reflects a personal opinion and should not be interpreted as an investment advice, and/or offer, and/or a persistent request for carrying out financial transactions, and/or a guarantee, and/or a forecast of future events.