Archive for Forex and Currency News – Page 153

Important Calculations In Forex Trading – FREE Live Webinar!

By Orbex

fx calculations

Calling all beginner Forex traders! We’ve put together a comprehensive webinar dedicated to teaching you how to trade the financial markets!

Next Monday, April 11th at 5 PM GMT, our seasoned market expert David Kindley will be going live on Zoom to cover all the basic forex calculations you need to begin your online trading journey.

Sign up now for a chance to learn:

  • How to calculate margins when trading
  • How to include leverages into your trades
  • How to calculate pips and points
  • How to set pending orders

The webinar is free to attend, but seats are limited.

Book your spot today to start trading responsibly!

Register Now!


Orbex-LogoArticle by Orbex

Orbex is a fully licensed broker that was established in 2011. Founded with a mission to serve its traders responsibly and provides traders with access to the world’s largest and most liquid financial markets. www.orbex.com

Ichimoku Cloud Analysis 05.04.2022 (EURUSD, NZDUSD, USDCHF)

Article By RoboForex.com

EURUSD, “Euro vs US Dollar”

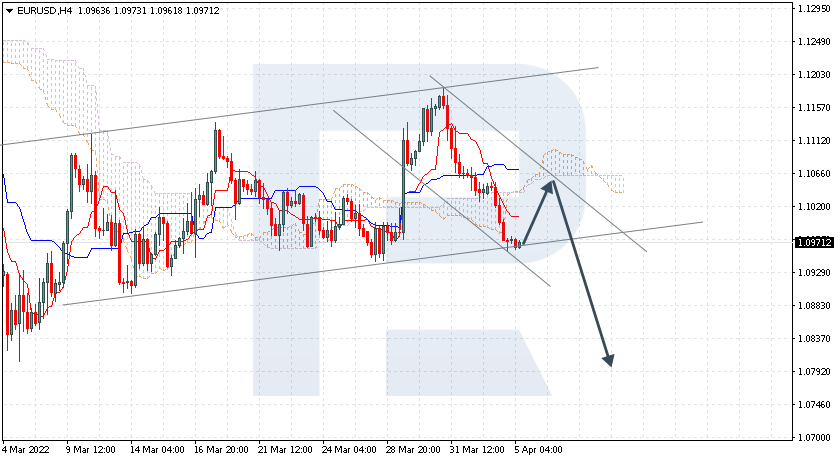
EURUSD is rebounding from the rising channel’s downside border at 1.0971; the instrument is moving below Ichimoku Cloud, thus indicating a descending tendency. The markets could indicate that the price may test the cloud’s downside border at 1.1055 and then resume moving downwards to reach 1.0780. Another signal in favour of a further downtrend will be a rebound from the descending channel’s upside border. However, the bearish scenario may no longer be valid if the price breaks the cloud’s upside border and fixes above 1.1120. In this case, the pair may continue growing towards 1.1205. To confirm further decline, the asset must break the rising channel’s downside border and fix below 1.0930.

EURUSD
Risk Warning: the result of previous trading operations do not guarantee the same results in the future

NZDUSD, “New Zealand Dollar vs US Dollar”

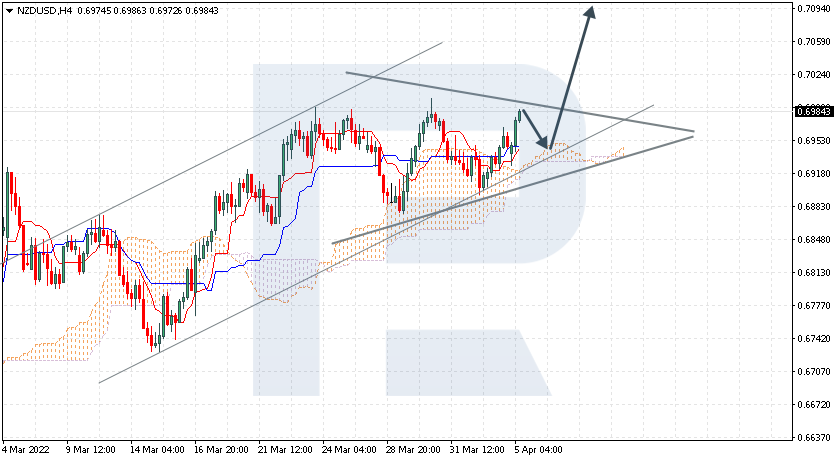
NZDUSD is testing the resistance level at 0.6939 for the third time; the instrument is moving above Ichimoku Cloud, thus indicating an ascending tendency. The markets could indicate that the price may test the cloud’s upside border at 0.6955 and then resume moving upwards to reach 0.7095. Another signal in favour of a further uptrend will be a rebound from the rising channel’s downside border. However, the bullish scenario may no longer be valid if the price breaks the cloud’s downside border and fixes below 0.6865. In this case, the pair may continue falling towards 0.6775. To confirm further growth, the asset must break the upside border of the Triangle pattern and fix above 0.6995.

NZDUSD
Risk Warning: the result of previous trading operations do not guarantee the same results in the future

USDCHF, “US Dollar vs Swiss Franc”

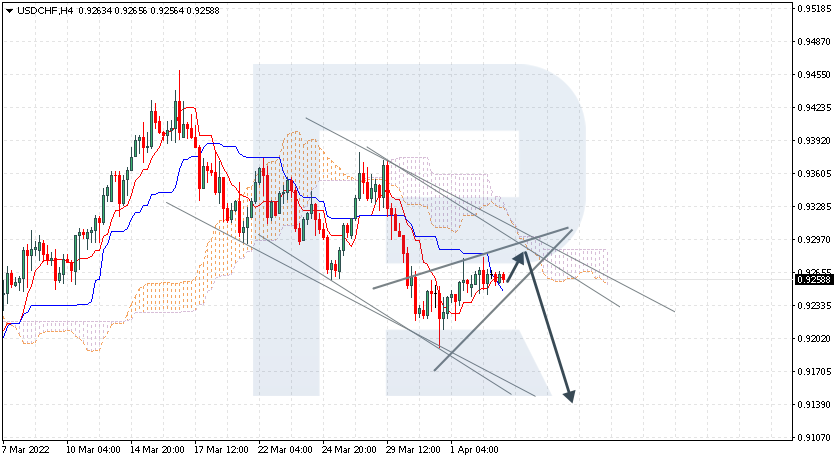
USDCHF is testing Tenkan-Sen and Kijun-Sen at 0.9258; the instrument is moving below Ichimoku Cloud, thus indicating a descending tendency. The markets could indicate that the price may test the cloud’s downside border at 0.9275 and then resume moving downwards to reach 0.9140. Another signal in favour of a further downtrend will be a rebound from the descending channel’s upside border. However, the bearish scenario may no longer be valid if the price breaks the cloud’s upside border and fixes above 0.9335. In this case, the pair may continue growing towards 0.9425. To confirm further growth, the asset must break the downside border of the Wedge pattern and fix below 0.9230.

USDCHF

Article By RoboForex.com

Attention!
Forecasts presented in this section only reflect the author’s private opinion and should not be considered as guidance for trading. RoboForex LP bears no responsibility for trading results based on trading recommendations described in these analytical reviews.

Murrey Math Lines 05.04.2022 (AUDUSD, NZDUSD)

Article By RoboForex.com

AUDUSD, “Australian Dollar vs US Dollar”

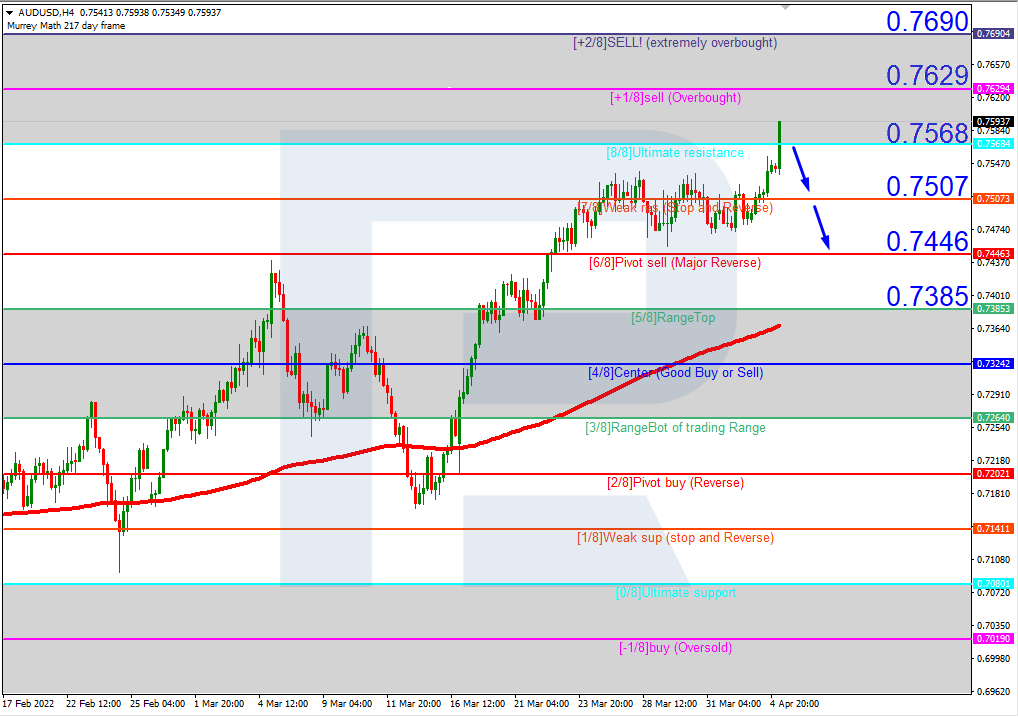
In the H4 chart, AUDUSD is trading inside the “overbought area”. In this case, the price is expected to break 8/8 and then continue falling to reach the support at 6/8. However, this scenario may no longer be valid if the price breaks the resistance at +1/8 to the upside. After that, the instrument may grow towards +2/8.

AUDUSDH4
Risk Warning: the result of previous trading operations do not guarantee the same results in the future

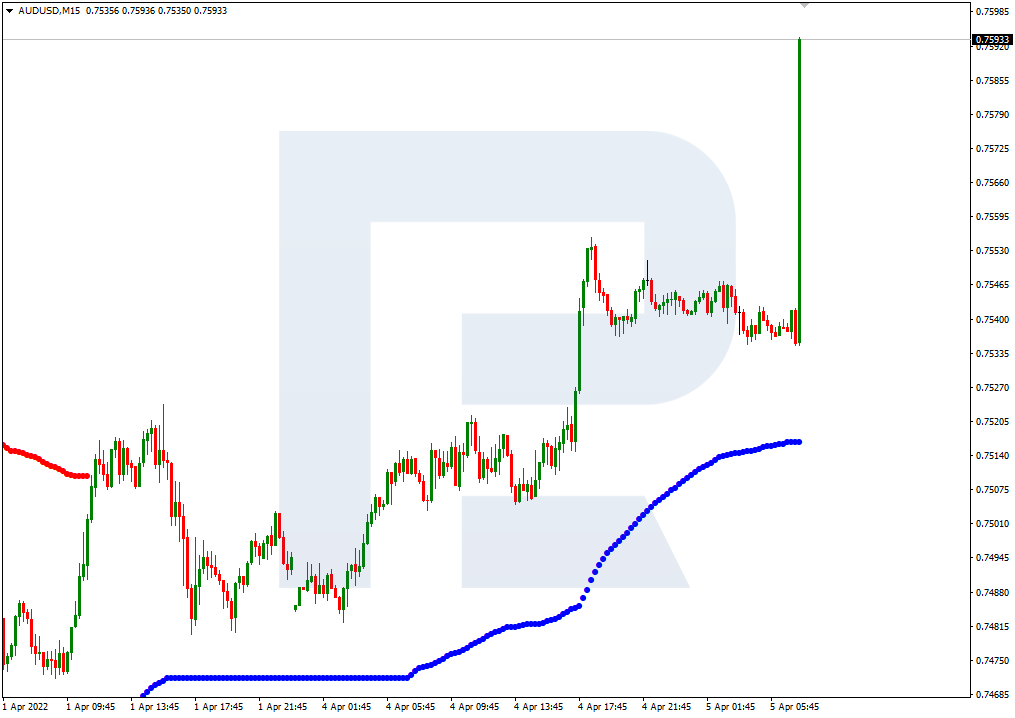
As we can see in the M15 chart, the downside line of the VoltyChannel indicator is pretty far away from the price, that’s why the pair may resume trading downwards only after rebounding from 8/8 in the H4 chart.

AUDUSD_M15
Risk Warning: the result of previous trading operations do not guarantee the same results in the future

NZDUSD, “New Zealand Dollar vs US Dollar”

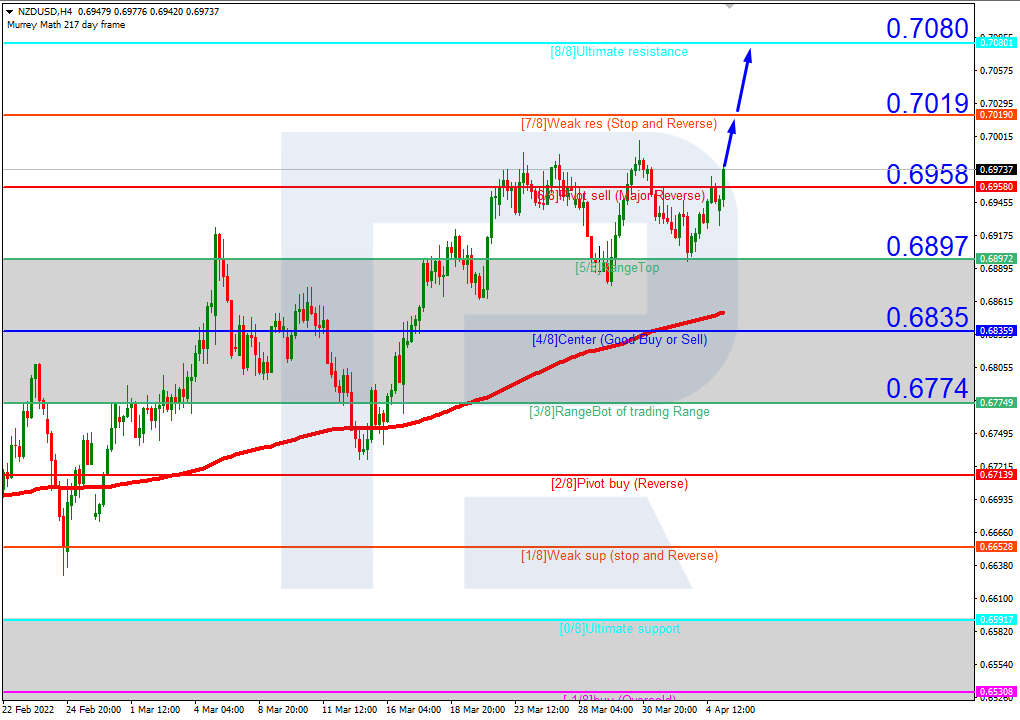
In the H4 chart, NZDUSD is trading above the 200-day Moving Average to indicate an ascending tendency. In this case, the price is expected to test 7/8, break it, and then continue growing to reach the resistance at 8/8. However, this scenario may no longer be valid if the price breaks 5/8 to the downside. After that, the instrument may reverse and fall towards the support at 4/8.

NZDUSD_H4
Risk Warning: the result of previous trading operations do not guarantee the same results in the future

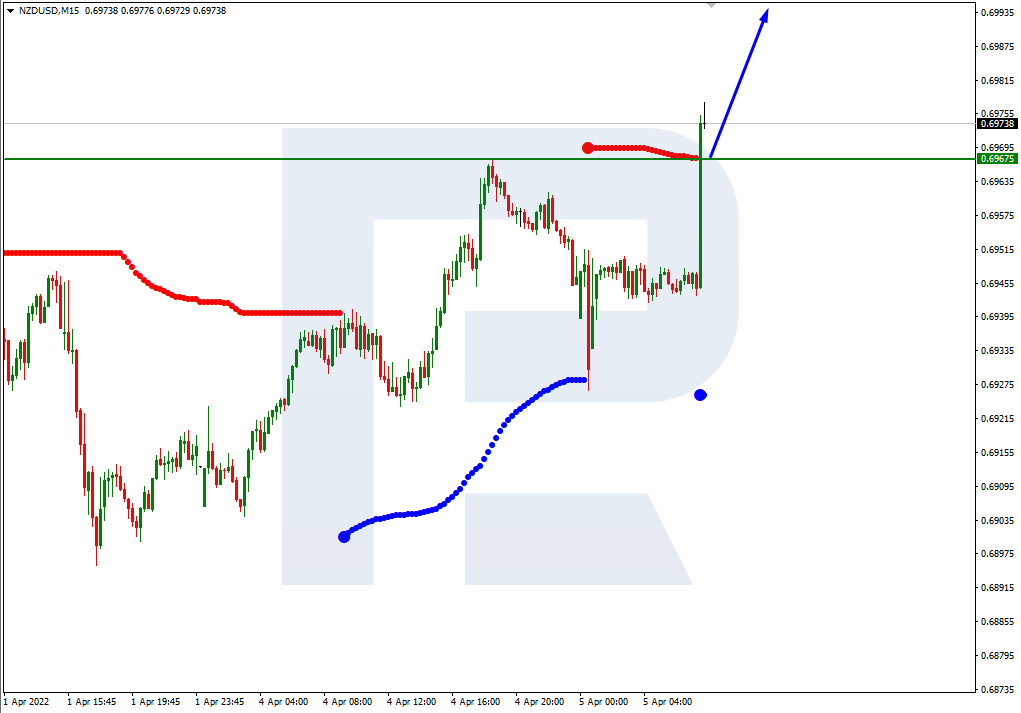
As we can see in the M15 chart, the pair has broken the upside line of the VoltyChannel indicator and, as a result, may continue its growth.

NZDUSD_M15

Article By RoboForex.com

Attention!
Forecasts presented in this section only reflect the author’s private opinion and should not be considered as guidance for trading. RoboForex LP bears no responsibility for trading results based on trading recommendations described in these analytical reviews.

The Analytical Overview of the Main Currency Pairs on 2022.04.05

by JustForex

The EUR/USD currency pair

Technical indicators of the currency pair:
  • Prev Open: 1.1037
  • Prev Close: 1.0972
  • % chg. over the last day: -0.59%

ECB spokesman said yesterday that the European bond-buying program (PEPP) could end in July. Inflation in Europe has accelerated, and the ECB does not want to delay the tightening of monetary policy. New sanctions against Russia will also put negative pressure on the European currency.

Trading recommendations
  • Support levels: 1.0963, 1.0917, 1.0887, 1.0823, 1.0633
  • Resistance levels: 1.1027, 1.1075, 1.1135, 1.1196, 1.1291

From the technical point of view, the trend on the EUR/USD currency pair in the hourly time frame has changed to bearish. Yesterday, the price confidently broke through the priority change level and consolidated lower. The MACD indicator is in the negative zone. The price has reached the support level, so it is too late for sell deals. Under such market conditions, traders can look for buy trades on the intraday timeframes from the support level of 1.0963, but only with short targets. Sell trades should be considered from the resistance level of 1.1027 or 1.1075, but only after the additional confirmation.

Alternative scenario: if the price breaks out through the 1.1135 resistance level and fixes above, the uptrend will likely resume.

EUR/USD
News feed for 2022.04.05:
  • – German Services (m/m) PMI at 10:55 (GMT+3);
  • – Eurozone Services (m/m) PMI at 11:00 (GMT+3);
  • – US ISM Services PMI (m/m) at 17:00 (GMT+3).
  • – US FOMC Member Brainard Speaks at 18:05 (GMT+3);
  • – US FOMC Member Williams Speaks at 21:00 (GMT+3).

The GBP/USD currency pair

Technical indicators of the currency pair:
  • Prev Open: 1.3093
  • Prev Close: 1.3114
  • % chg. over the last day: +0.16%

Bank of England Governor Andrew Bailey said yesterday that monetary policy can do little to offset external pressures on prices and therefore cannot significantly offset the decline in household income caused by high inflation. Bailey once again mentioned the term “uncertainty” that the Bank of England would soon face.

Trading recommendations
  • Support levels: 1.3074, 1.3015, 1.2989, 1.2863
  • Resistance levels: 1.3130, 1.3161, 1.3244, 1.3274

On the hourly time frame, the GBP/USD currency pair trend is bullish. The British pound looks more confident than the euro. At the moment, narrowing liquidity in the form of a triangle pattern is forming. The MACD indicator became inactive. Under such market conditions, buy trades should be considered from the support level of 1.3130, but after an actual level breakdown. Sell deals should also be considered from the resistance level of 1.3130 if the price shows a bearish initiative.

Alternative scenario: if the price breaks down through the 1.3074 support level and fixes below, the mid-term uptrend will likely be broken.

GBP/USD
News feed for 2022.04.05:
  • – UK Services PMI (m/m) at 11:30 (GMT+3).

The USD/JPY currency pair

Technical indicators of the currency pair:
  • Prev Open: 122.59
  • Prev Close: 122.73
  • % chg. over the last day: +0.11%

The fundamental picture for the Japanese yen remains unchanged. The monetary policy of the Bank of Japan is now “ultra-soft” and aims to decrease the national currency rate (USD/JPY growth). US bonds show strong growth in the debt market, while Japanese bond yields are at the same level. The mid-term outlook remains unchanged – analysts see a continuation of the uptrend, as the monetary policy of the US and Japanese central banks are now opposed.

Trading recommendations
  • Support levels: 121.83, 120.88, 119.52, 117.72
  • Resistance levels: 123.44, 125.22

The medium-term trend on the USD/JPY currency pair is bullish. The price corrected to the moving averages and formed a narrow price range. The MACD indicator has become inactive. Under such market conditions, it is best to look for buy deals, expecting the continuation of the uptrend. First of all, it is worth considering the support level of 121.83, but with additional confirmation. A resistance level of 123.44 may be considered for sell deals, but only after the sellers’ initiative.

Alternative scenario: If the price fixes below 119.52, the uptrend will likely be broken.

USD/JPY
There is no news feed for today.

The USD/CAD currency pair

Technical indicators of the currency pair:
  • Prev Open: 1.2516
  • Prev Close: 1.2486
  • % chg. over the last day: -0.24%

The Canadian dollar is a commodity currency and is highly dependent on the movement of oil prices and the dollar index. The Bank of Canada Business Outlook Survey showed a slowdown in business investment growth. Canadian companies expect strong wage growth and rising product prices due to strong demand, inflation, and high commodity prices. Analysts believe that the Bank of Canada will likely raise interest rates on April 13.

Trading recommendations
  • Support levels: 1.2453
  • Resistance levels: 1.2520, 1.2563, 1.2655, 1.2713, 1.2754, 1.2851

In terms of technical analysis, the USD/CAD currency pair trend is bearish, but the price is getting a flat structure. The MACD indicator has become inactive. Trade only with short targets, since on the USD/CAD currency pair fundamentally, there are no prerequisites for the medium-term trend, as the dollar index in the medium term also has the support of the Fed. Under such market conditions, it is better to look for buy trades on the lower timeframes from the support level of 1.2453, but it is better with additional confirmation. For sell deals, it is better to consider the resistance level of 1.2520.

Alternative scenario: if the price breaks through and consolidates above 1.2654, the downtrend will likely be broken.

USD/CAD
There is no news feed for today.

by JustForex


This article reflects a personal opinion and should not be interpreted as an investment advice, and/or offer, and/or a persistent request for carrying out financial transactions, and/or a guarantee, and/or a forecast of future events.

Intraday Market Analysis – USD Inches Up

By Orbex

USDJPY consolidates gains

USDJPY

The US dollar gains on the prospect of more sanctions on Russia. On the daily chart, the RSI’s overbought condition led to profit-takings as the bulls became reluctant to outbid each other.

Nonetheless, the direction remains upward, and a pause is necessary for the market to take a breather. The current pullback has found support over 121.30.

A bounce above 123.20 may signal a bullish continuation and extend the price back to 125.00. On the downside, a breakout could cause a correction to 119.40 near the 30-day moving average.

EURGBP struggles for support

EURGBP

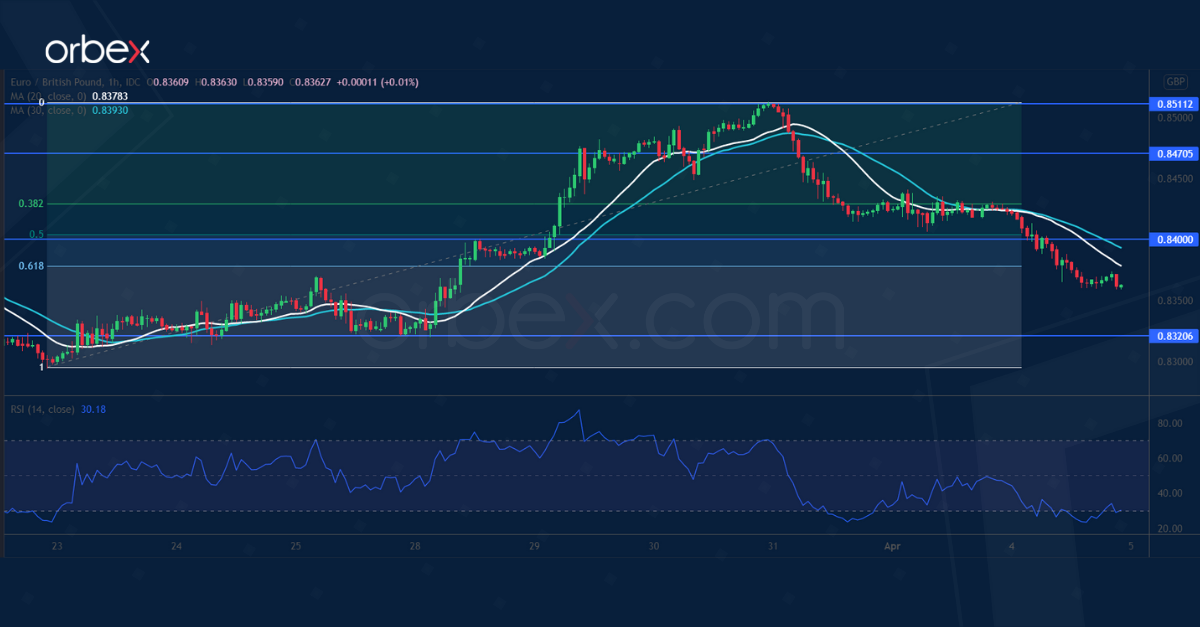
The euro fell as worries over Europe’s energy supply grew. The current pullback could be an opportunity for the bulls to stake in but they will need to push past 0.8400 to regain control.

The 61.8% (0.8380) Fibonacci retracement level has failed to foster buyers’ interest. The RSI’s double dip into the oversold area may attract some bids.

The demand zone between the daily support (0.8300) and 0.8320 is a critical floor to keep the rebound valid. That said, its breach could trigger a sell-off towards 0.8200.

GER 40 takes a breather

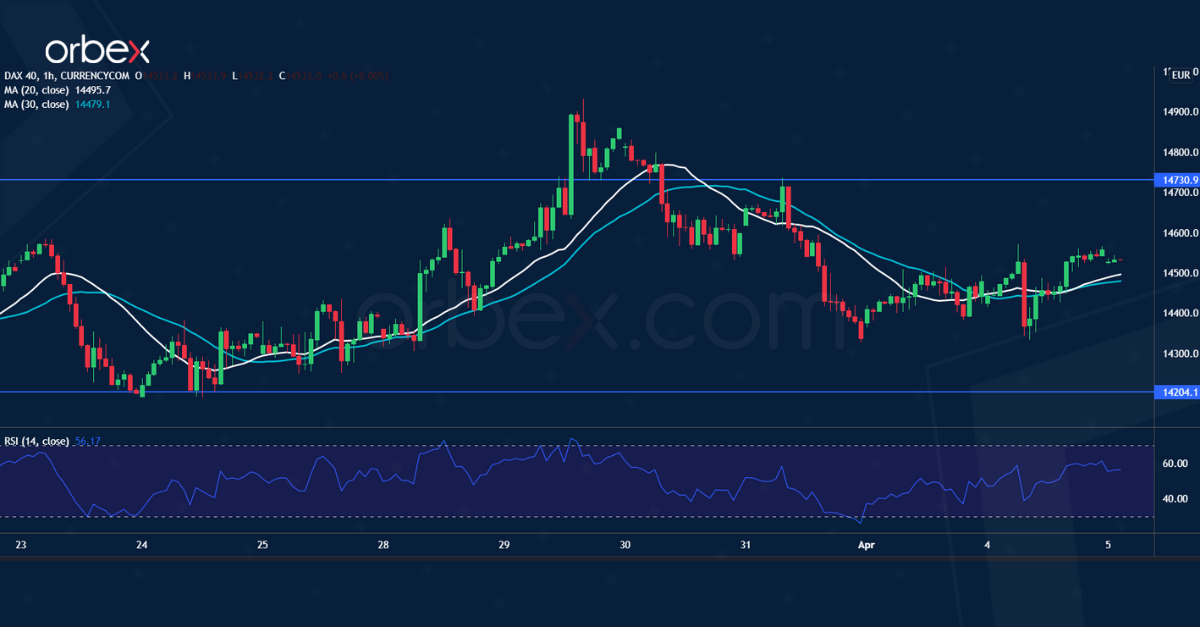
DAX

The Dax 40 goes sideways as the EU considers a new set of sanctions. A bullish MA cross on the daily chart suggests an acceleration in the rebound as a sign of improved sentiment.

The index is hovering above the lower end (14200) of the previous consolidation. This level coincides with the 20 and 30-day moving averages, making it an area of interest.

A close above 14730 could extend the rally to the origin of the February liquidation at 15200. This is an important resistance before the uptrend could resume in the medium-term.


Orbex-LogoArticle by Orbex

Orbex is a fully licensed broker that was established in 2011. Founded with a mission to serve its traders responsibly and provides traders with access to the world’s largest and most liquid financial markets. www.orbex.com

Forex Technical Analysis & Forecast for April 2022

Article By RoboForex.com

EURUSD, “Euro vs US Dollar”

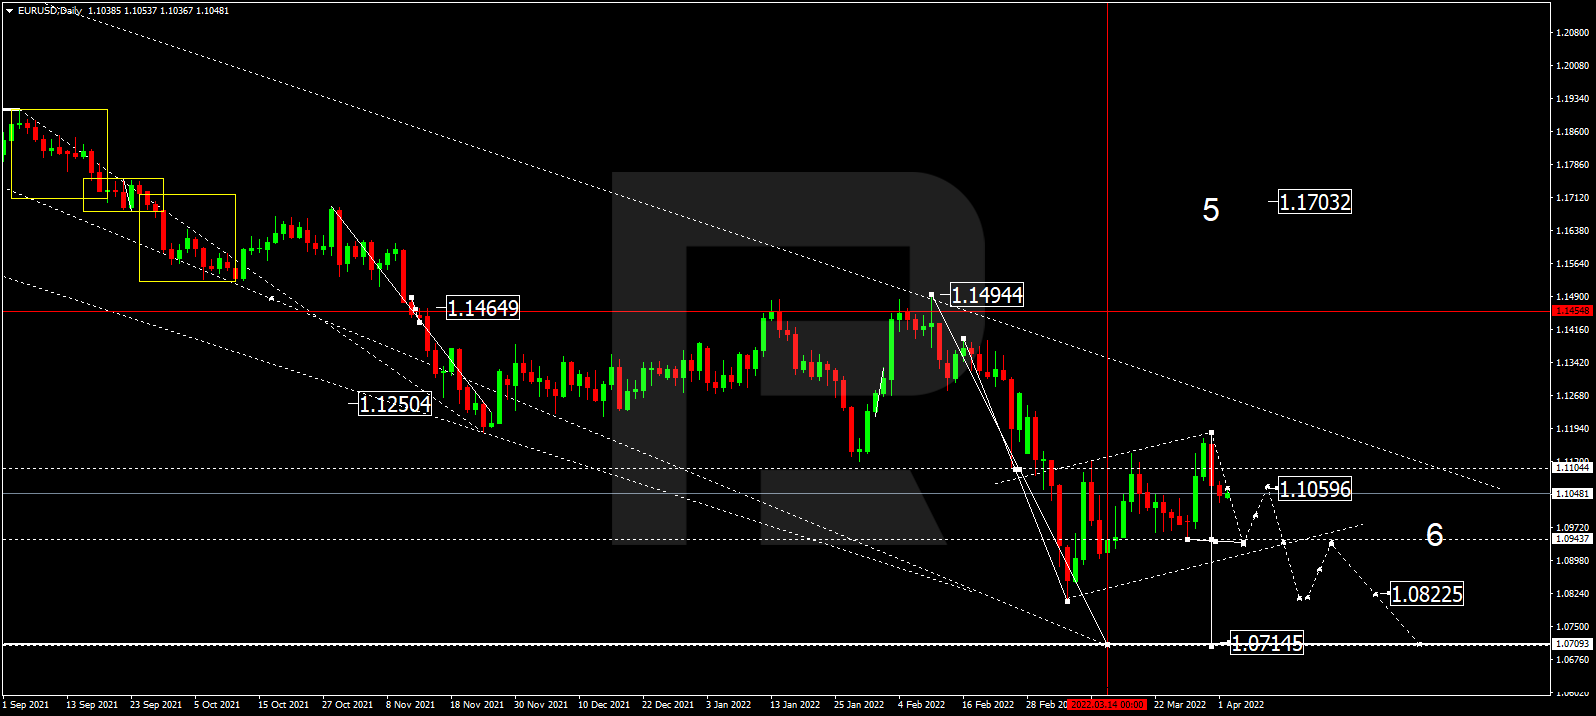
As we can see in the daily chart, having completed the correction at 1.1170, EURUSD is forming another descending wave with the first target at 1.0944 and may later correct towards 1.1060, thus forming a wide consolidation range around 1.0944. If the price breaks this range to the downside, the market may resume falling towards 1.0822 or even extend this wave down to 1.0715; if to the upside – start another growth to reach 1.1200 and then form one more descending structure to return to 1.0944.

EURUSD
Risk Warning: the result of previous trading operations do not guarantee the same results in the future

GBPUSD, “Great Britain Pound vs US Dollar”

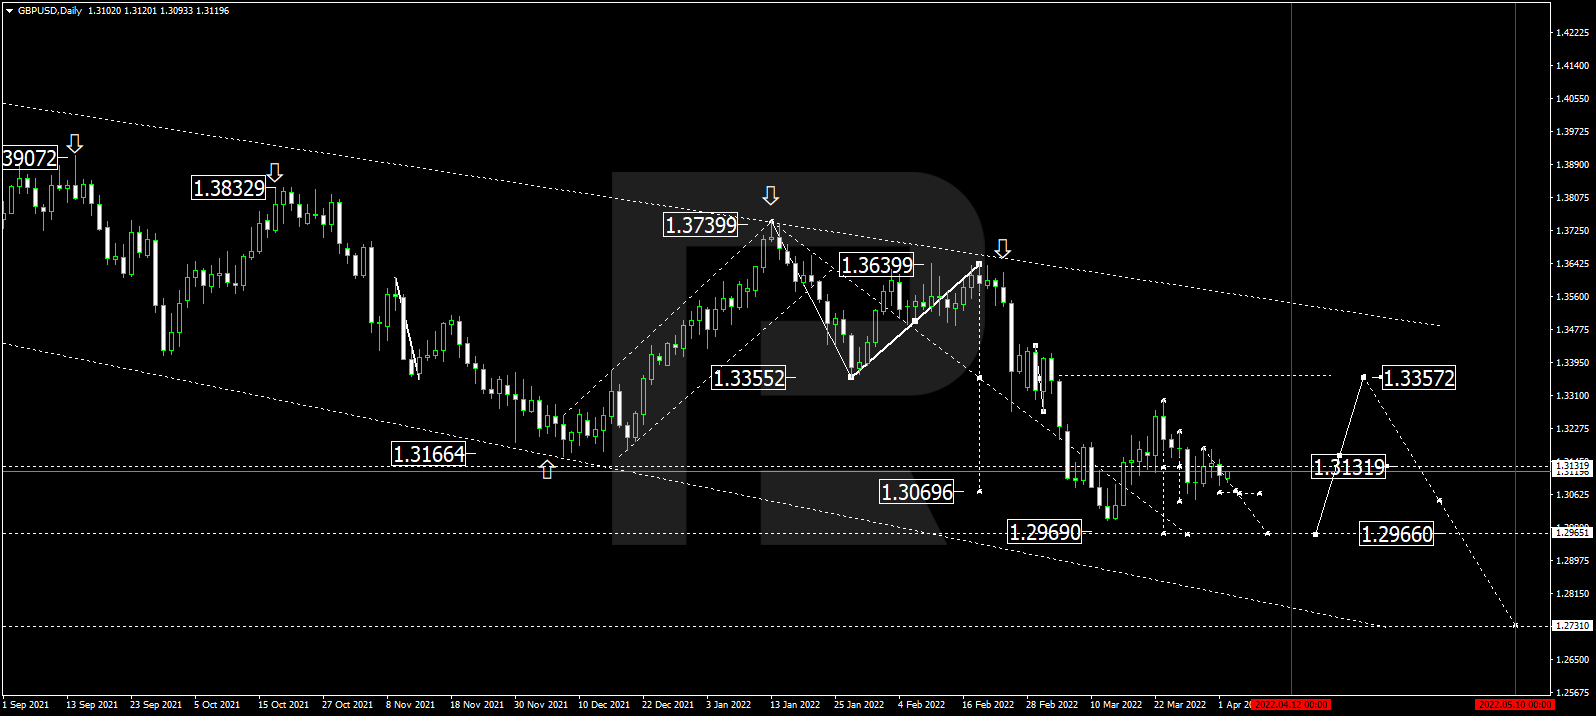
In the daily chart, after finishing the correction at 1.3300, GBPUSD is trading downwards with the target at 1.2966; it has already broken 1.3131. At the moment, the asset is consolidating below the latter level. After reaching the above-mentioned target, the instrument may start another growth towards 1.3355.
GBPUSD
Risk Warning: the result of previous trading operations do not guarantee the same results in the future

USDJPY, “US Dollar vs Japanese Yen”

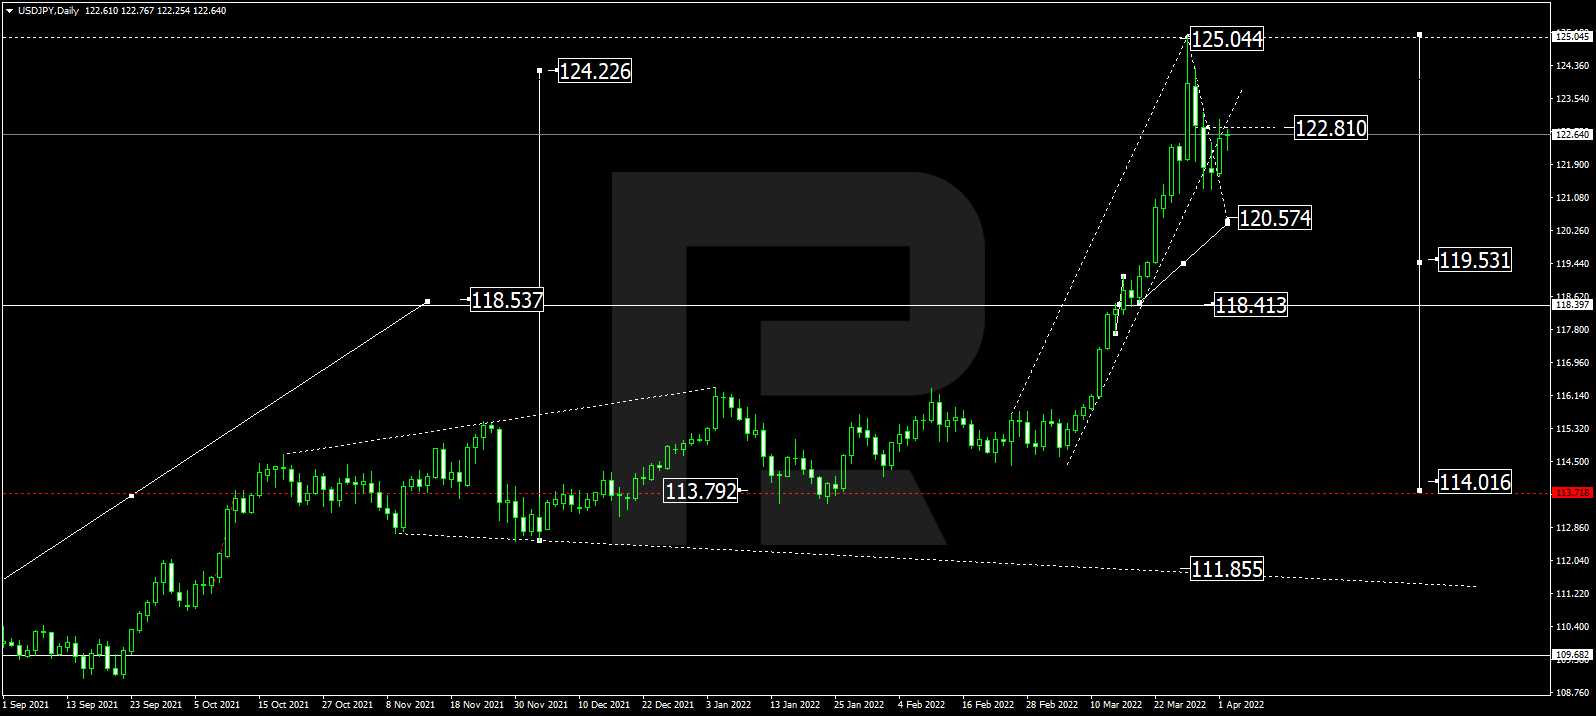
In the daily chart, having finished the ascending wave at 118.41 and formed a new consolidation range around this level, USDJPY has broken it to the upside to extend this structure up to 125.04; right now, it is forming the first structure to the downside with the first target at 120.57. Later, the market may correct to test 122.80 from below and then start a new decline to break 118.40. After that, the instrument may continue trading downwards with the target is at 114.00.
USDJPY
Risk Warning: the result of previous trading operations do not guarantee the same results in the future

BRENT

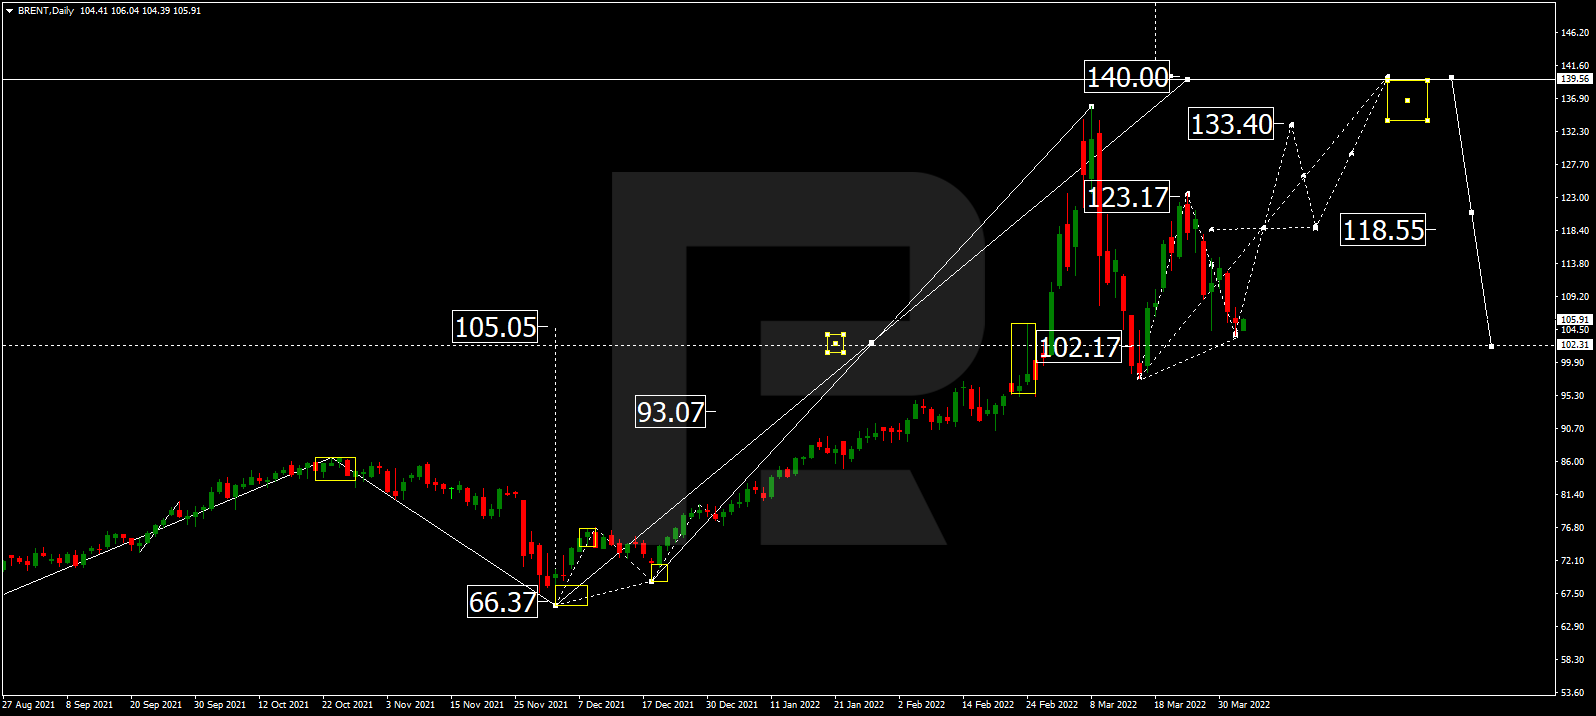
As we can see in the daily chart, Brent has completed the correction at 105.00; right now, it is consolidating around this level. Possibly, the asset may form one more ascending wave to break 118.55 and then continue trading upwards with the short-term target at 133.40. Later, the market may start another correction to return to 118.55 and then resume trading upwards to reach 140.00, at least.
BRENT
Risk Warning: the result of previous trading operations do not guarantee the same results in the future

XAUUSD, “Gold vs US Dollar”

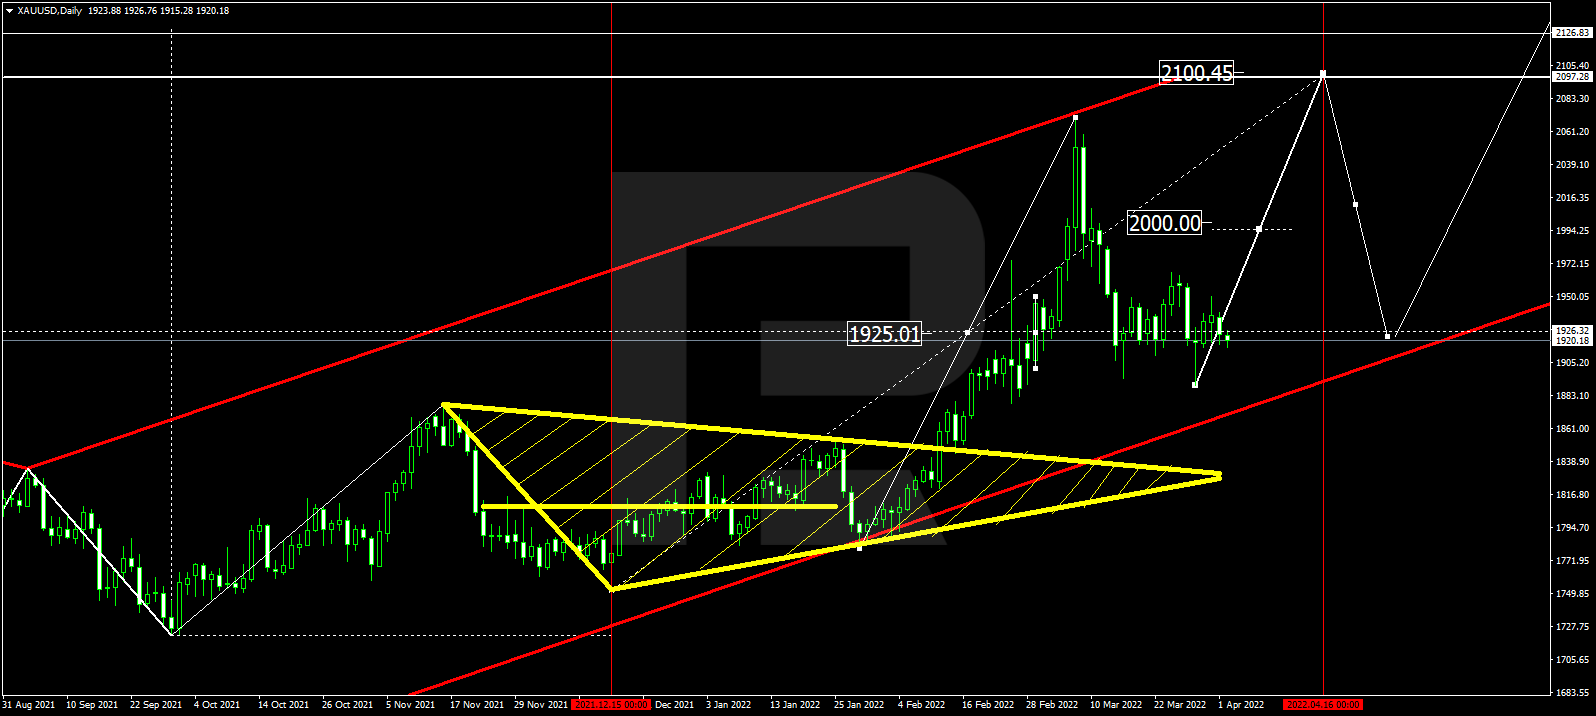
In the daily chart, Gold is still consolidating around 1926.30. The main scenario implies further growth towards 2000.00. After that, the instrument may break this level to the upside and form one more ascending structure with the target at 2100.50.
GOLD
Risk Warning: the result of previous trading operations do not guarantee the same results in the future

S&P 500

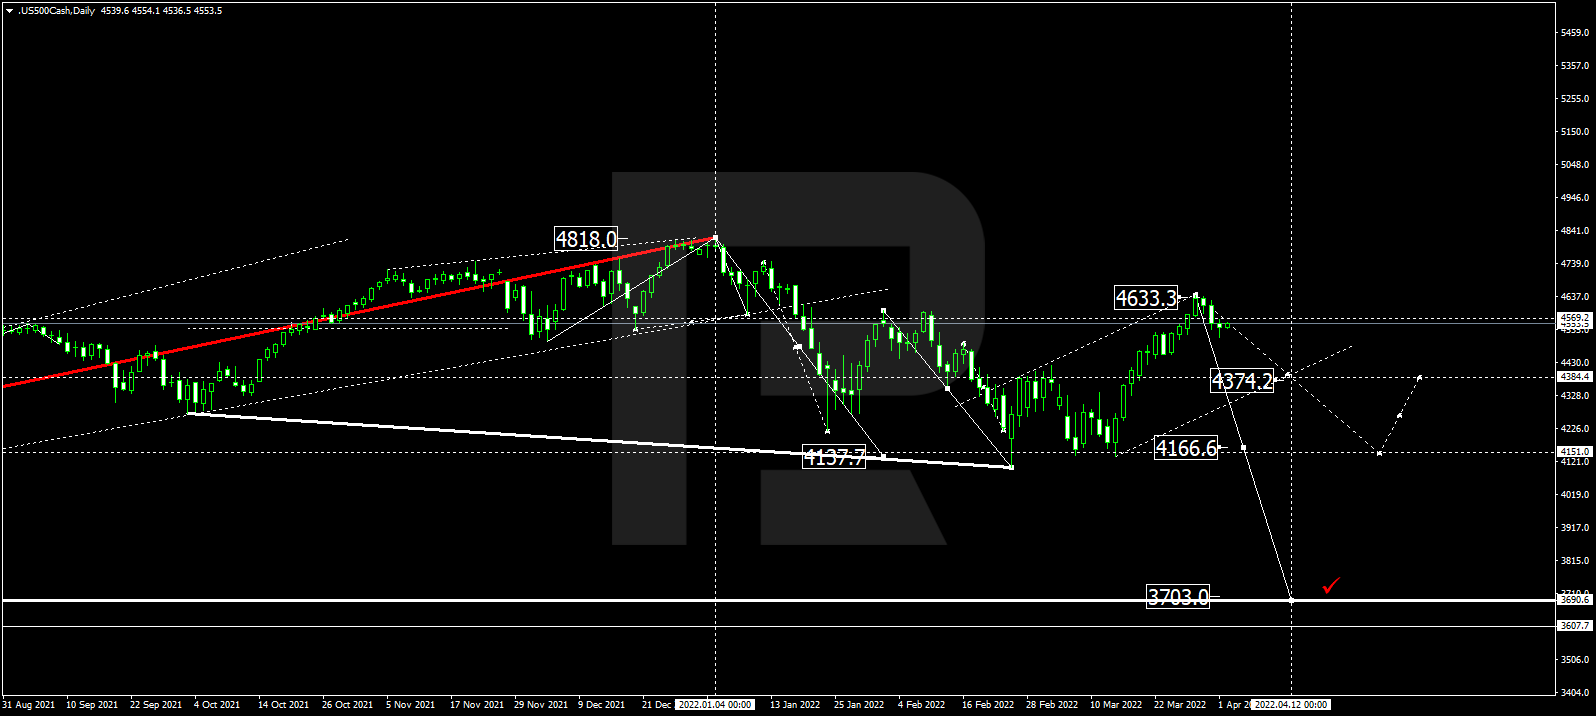
In the daily chart, the S&P index has finished the correctional wave at 4633.3; right now, it is consolidating below this level. Possibly, the asset may form a new descending structure to break 4374.2 and then continue trading downwards with the short-term target at 4166.6.
S&P500

Article By RoboForex.com

Attention!
Forecasts presented in this section only reflect the author’s private opinion and should not be considered as guidance for trading. RoboForex LP bears no responsibility for trading results based on trading recommendations described in these analytical reviews.

Japanese Candlesticks Analysis 04.04.2022 (USDCAD, AUDUSD, USDCHF)

Article By RoboForex.com

USDCAD, “US Dollar vs Canadian Dollar”

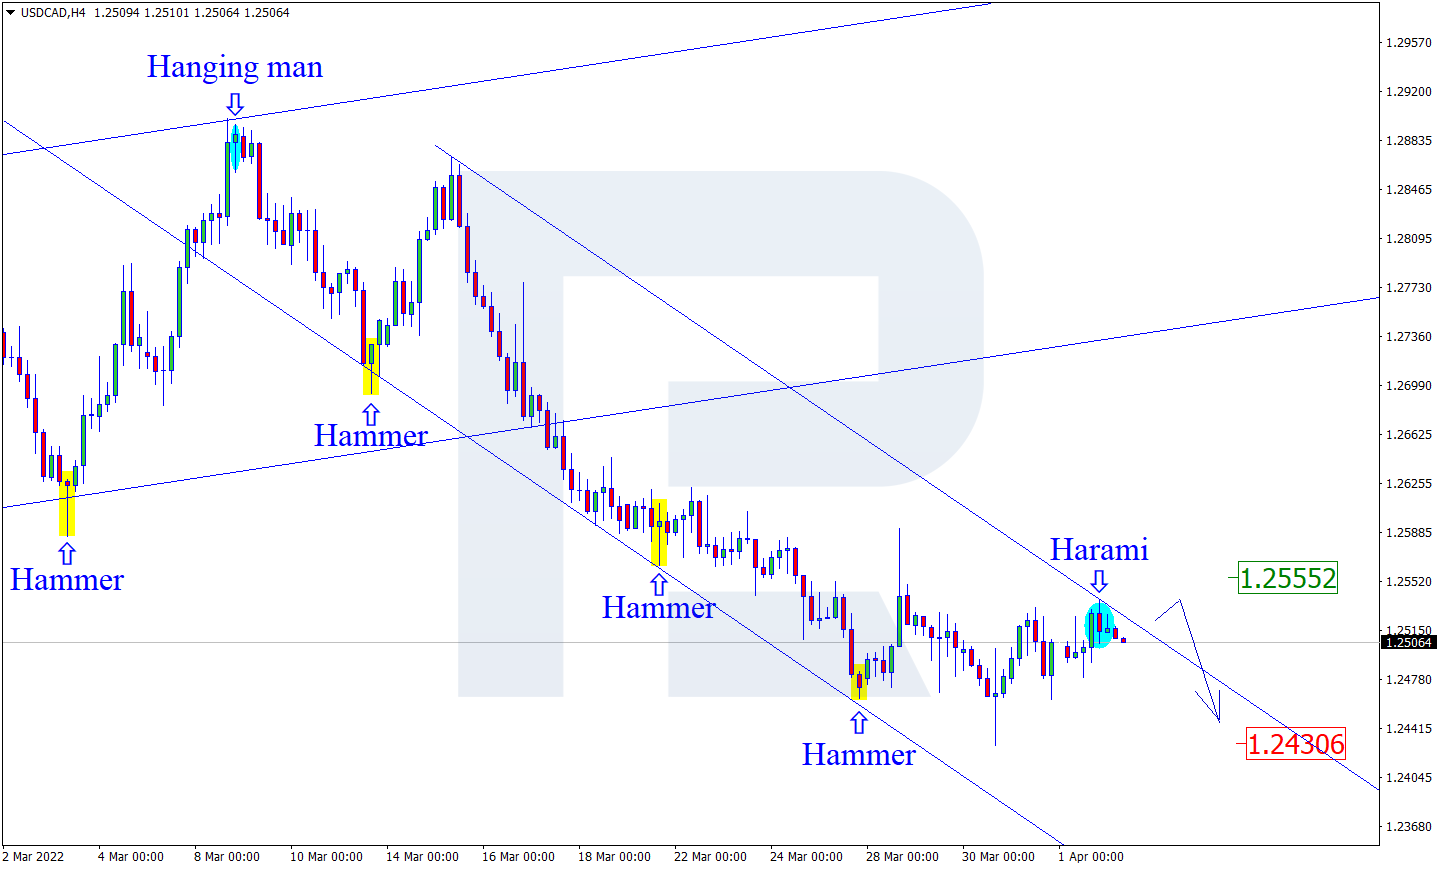
As we can see in the H4 chart, after forming a Harami reversal pattern close to the resistance level, USDCAD is reversing in the form of a new descending impulse. In this case, the downside target may be at 1.2430. However, an alternative scenario implies that the asset may correct to rebound from the resistance level at 1.2555 and then resume the downtrend.

USDCAD
Risk Warning: the result of previous trading operations do not guarantee the same results in the future

AUDUSD, “Australian Dollar vs US Dollar”

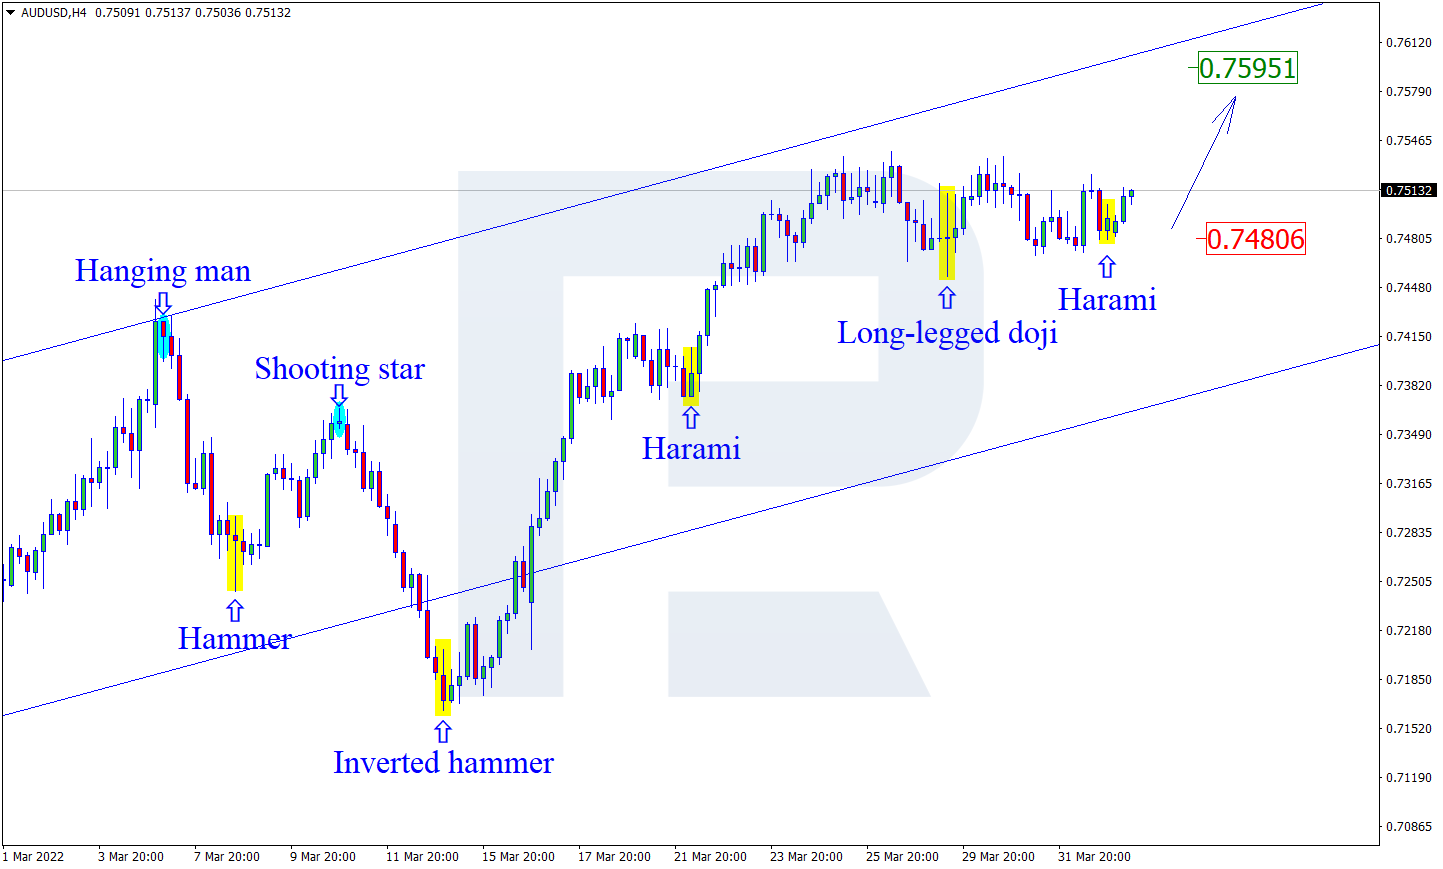
As we can see in the H4 chart, during the pullback, AUDUSD has formed a Harami reversal pattern near the support area. At the moment, the asset is reversing and starting a new rising impulse. In this case, the upside target may be the resistance level at 0.7595. After testing the level, the price may break it and continue the ascending impulse. At the same time, an opposite scenario implies that the price may correct to reach 0.7480 before resuming the uptrend.

AUDUSD
Risk Warning: the result of previous trading operations do not guarantee the same results in the future

USDCHF, “US Dollar vs Swiss Franc”

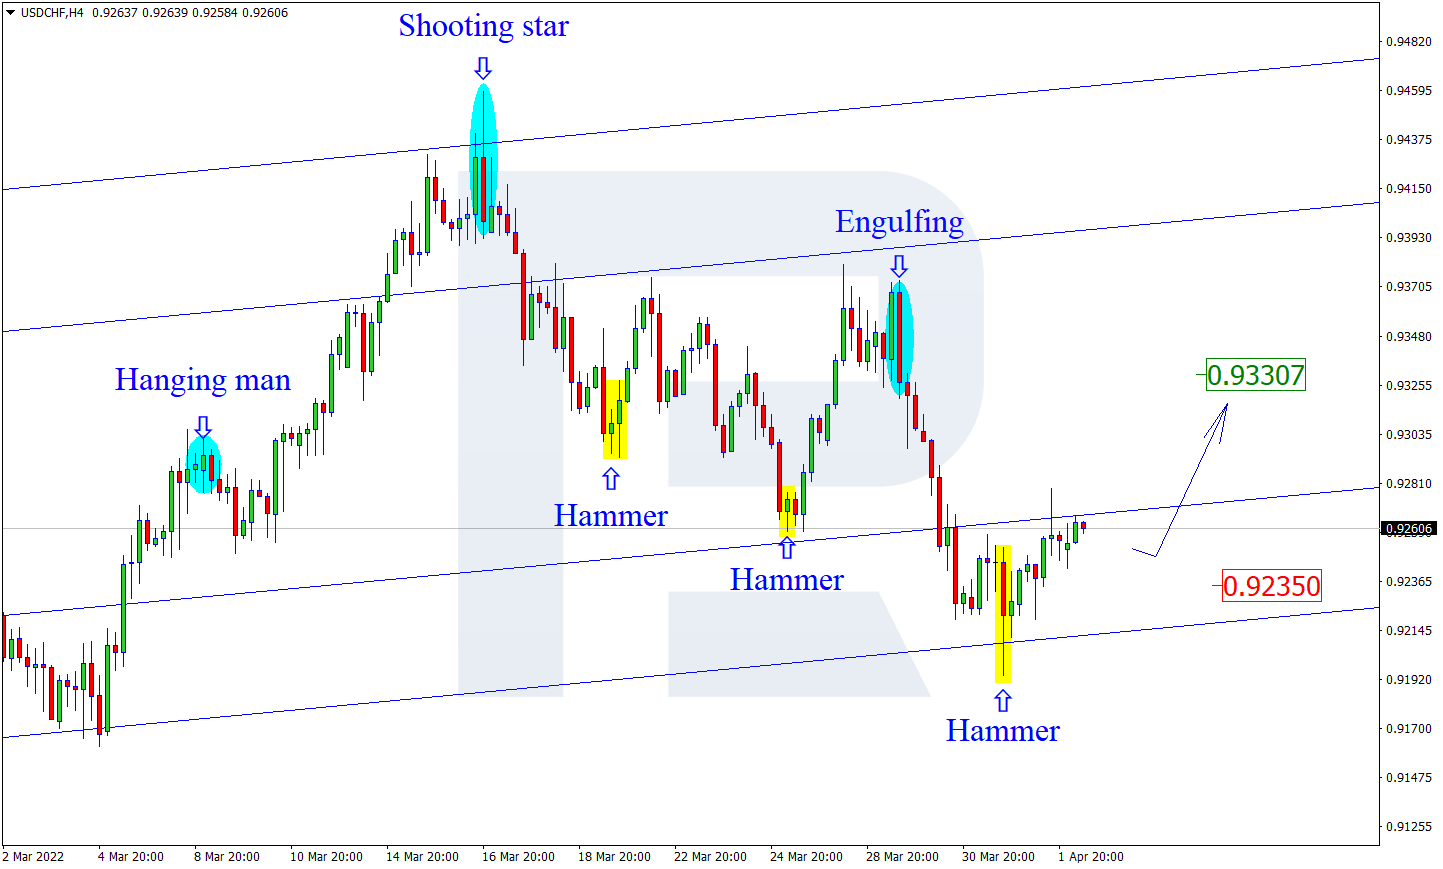
As we can see in the H4 chart, after testing the support area, the pair has formed a Hammer pattern. At the moment, USDCHF is reversing in the form of a new ascending impulse. In this case, the upside target may be at 0.9330. After testing the resistance level, the price may break it and continue trading upwards. Still, there might be an alternative scenario, according to which the asset may correct to reach 0.9235 first and then resume the ascending tendency.

USDCHF

Article By RoboForex.com

Attention!
Forecasts presented in this section only reflect the author’s private opinion and should not be considered as guidance for trading. RoboForex LP bears no responsibility for trading results based on trading recommendations described in these analytical reviews.

USDCHF Double Zigzag To Complete Wave X

By Orbex

USDCHF

The structure of the USDCHF pair suggests that the cycle wave y has ended. This was followed by the cycle intervening wave x.

The intervening wave x takes the form of a primary double zigzag Ⓦ-Ⓧ-Ⓨ. Currently, there is a decrease in the price in the final wave Ⓨ. This takes the form of an intermediate double (W)-(X)-(Y) zigzag.

In the near future, the price could continue to move in the intermediate wave (Y) to the level of 0.913. At that level, wave x will be at 61.8% of wave y.

After the end of wave x, bulls can enter the market by starting to build the actionary wave z.

USDCHF

According to an alternative scenario, the formation of the cycle intervening wave x is fully complete. Now we are seeing a price increase and the development of a cycle wave z. Perhaps it takes the form of a primary double Ⓐ-Ⓑ-Ⓒ zigzag.

Wave Ⓐ will take the form of a simple impulse and will end at the level of 0.946. This is where the actionary cycle wave y ended.

Then, after a slight correction, prices are likely to move higher in the impulse wave Ⓒ.

Join our responsible trading community – Open your Orbex account now!


Orbex-LogoArticle by Orbex

Orbex is a fully licensed broker that was established in 2011. Founded with a mission to serve its traders responsibly and provides traders with access to the world’s largest and most liquid financial markets. www.orbex.com

The Analytical Overview of the Main Currency Pairs on 2022.04.04

by JustForex

The EUR/USD currency pair

Technical indicators of the currency pair:
  • Prev Open: 1.1063
  • Prev Close: 1.1048
  • % chg. over the last day: -0.14%

On Friday, non-farm payrolls data showed that the number of jobs in the US increased by 431,000 in March from an expected 490,000. The US unemployment rate fell to 3.6% in March from 3.8%. The inflation rate in the Eurozone jumped sharply from 5.9% to 7.5% year on year. This surge in inflation has increased the likelihood that the ECB will soon announce the end of its quantitative easing program.

Trading recommendations
  • Support levels: 1.1037, 1.1017, 1.0963, 1.0917, 1.0887, 1.0823, 1.0633
  • Resistance levels: 1.1149, 1.1196, 1.1291

From the technical point of view, the trend on the EUR/USD currency pair on the hourly time frame is bullish. At the moment, the price has corrected and is trading between the moving averages. The MACD indicator is in the negative zone. There are signs of divergence. Under such market conditions, it is better to look for buy trades on intraday timeframes from the support level of 1.1017. Sell trades should be considered from the resistance level of 1.1149, but only after the additional confirmation.

Alternative scenario: if the price breaks down through the 1.1017 support level and fixes below, the uptrend will likely be broken.

EUR/USD
There is no news feed for today.

The GBP/USD currency pair

Technical indicators of the currency pair:
  • Prev Open: 1.3134
  • Prev Close: 1.3114
  • % chg. over the last day: -0.15%

The UK manufacturing activity index remains above 50, which is a positive signal. The UK agrees to join the US in releasing strategic oil reserves. This may soon lead to lower oil prices, which will be negative for the GBP due to the high correlation with Brent oil. Today, investors should pay close attention to the speech of the Governor of the Bank of England, Andrew Bailey. The UK has suspended interest rate hikes, but rising consumer prices may force politicians to reconsider their decision.

Trading recommendations
  • Support levels: 1.3074, 1.3015, 1.2989, 1.2863
  • Resistance levels: 1.3130, 1.3161, 1.3244, 1.3274

On the hourly time frame, the GBP/USD currency pair trend is bullish. The price movement pattern is beginning to show a flat structure. The MACD indicator became inactive. Under such market conditions, buy trades should be considered from the support level of 1.3074, but better with confirmation. Sell deals should be considered from the resistance level of 1.3130 or 1.3161, but only with short targets.

Alternative scenario: if the price breaks down through the 1.3074 support level and fixes below, the mid-term uptrend will likely be broken.

GBP/USD
News feed for 2022.04.04:
  • – UK BoE Gov Bailey’s Speech at 12:05 (GMT+3).

The USD/JPY currency pair

Technical indicators of the currency pair:
  • Prev Open: 121.84
  • Prev Close: 121.69
  • % chg. over the last day: +0.73%

The fundamental picture for the Japanese Yen remains unchanged. The monetary policy of the Bank of Japan is now “ultra-soft” and aims to decrease the national currency rate (USD/JPY growth). Due to the central bank of Japan’s work in the debt market, the Japanese yen temporarily strengthened at the end of last week. However, the mid-term outlook remains unchanged – analysts see a continuation of the uptrend, as the monetary policy of the US and Japanese central banks is now opposed.

Trading recommendations
  • Support levels: 121.83, 120.88, 119.52, 117.72
  • Resistance levels: 123.44,125.22

The medium-term trend on the USD/JPY currency pair is bullish. The price corrected to the moving averages. The MACD indicator has become positive. Under such market conditions, it is best to look for buy deals, expecting the continuation of the uptrend. First of all, it is worth considering the support level of 121.83, but with additional confirmation. A resistance level of 123.44 may be considered for sell deals, but only after the sellers’ initiative.

Alternative scenario: If the price fixes below 119.52, the uptrend will likely be broken.

USD/JPY
There is no news feed for today.

The USD/CAD currency pair

Technical indicators of the currency pair:
  • Prev Open: 1.2479
  • Prev Close: 1.2505
  • % chg. over the last day: +0.11%

The Canadian dollar is a commodity currency and is highly dependent on the movement of oil prices and the dollar index. The situation in the energy market is difficult now. On the one hand, due to Russia’s invasion of Ukraine, there is a shortage of energy resources on the market, especially in Europe. On the other hand, the US and its partners are ready to release strategic reserves to stop rising oil prices. As a result, volatility in oil quotes is now higher. Oil lost more than 10% last week. Falling oil prices will hurt the Canadian dollar. On the other hand, the Bank of Canada is publishing its business activity review today. Positive data may increase expectations of a half a percent rate hike, which is favorable to the Canadian dollar.

Trading recommendations
  • Support levels: 1.2491, 1.2453
  • Resistance levels: 1.2563, 1.2655, 1.2713, 1.2754, 1.2851

In terms of technical analysis, the USD/CAD currency pair trend is bearish. The MACD indicator has become inactive. Trade only with short targets, since on the USD/CAD currency pair fundamentally, there are no prerequisites for the medium-term trend, as the dollar index in the medium term also has the support of the Fed. Under such market conditions, it is better to look for buy trades on the lower timeframes from the support level of 1.2491, but it is better with additional confirmation. For sell deals, it is better to consider the resistance level of 1.2563.

Alternative scenario: if the price breaks through and consolidates above 1.2654, the downtrend will likely be broken.

USD/CAD
News feed for 2022.04.04:
  • – Canada BoC Business Outlook Survey at 17:30 (GMT+3).

by JustForex


This article reflects a personal opinion and should not be interpreted as an investment advice, and/or offer, and/or a persistent request for carrying out financial transactions, and/or a guarantee, and/or a forecast of future events.

Intraday Market Analysis – USD Attempts To Rebound

By Orbex

EURUSD seeks support

EURUSD

The US dollar rallied after March’s average hourly wages jumped by 5.6%. The euro came to a halt in the supply zone at the origin of the March sell-off (1.1180).

A bearish RSI divergence pointed to softness in the rebound. A fall below 1.1120 then 1.1070 prompted buyers to bail out, further weighing on overall sentiment.

1.0980 at the base of the recent bullish impetus is major support. Its breach could invalidate the recovery and trigger a new round of sell-offs. The bulls need to clear 1.1120 to regain the upper hand.

XAUUSD builds support

XAUUSD

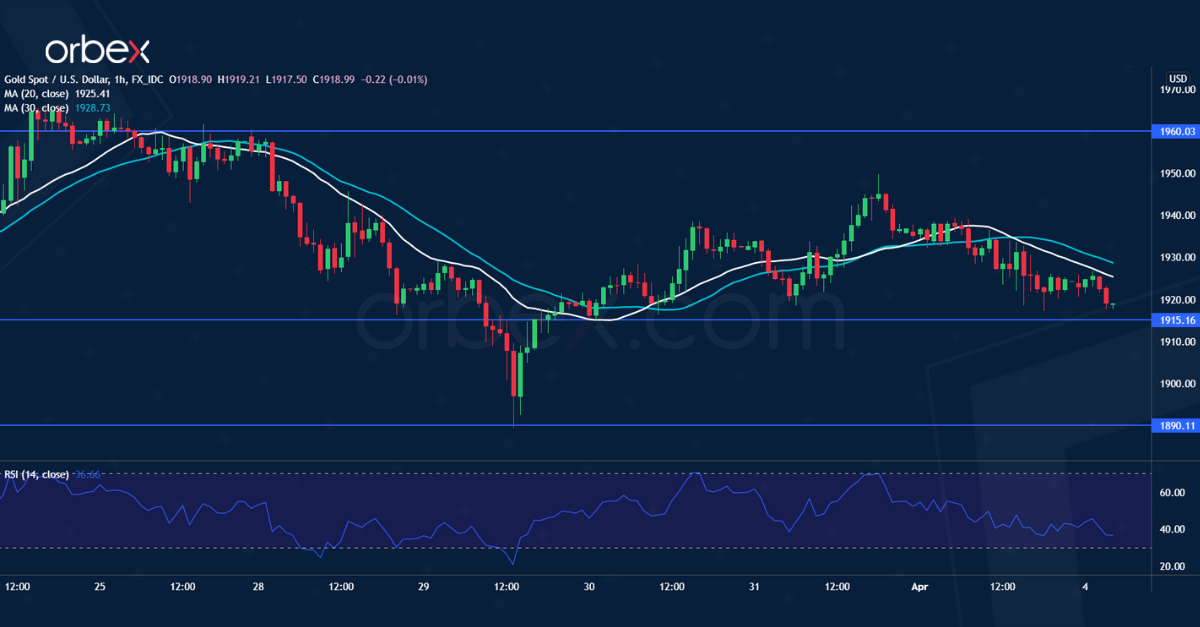
Gold retreats as the US dollar finds support from a fall in the jobless rate.

On the daily chart, price action still holds above the demand zone between 1890 and 1900 which is a sign of strong buying interest. A break above 1940 forced sellers out. This may also foreshadow a reversal.

Sentiment would improve if the precious metal stays above 1915. A bullish close above 1960 could extend the rally to the psychological level of 2000. On the downside, 1890 is a critical level to maintain the bulls’ optimism.

UK 100 consolidates gains

UK 100

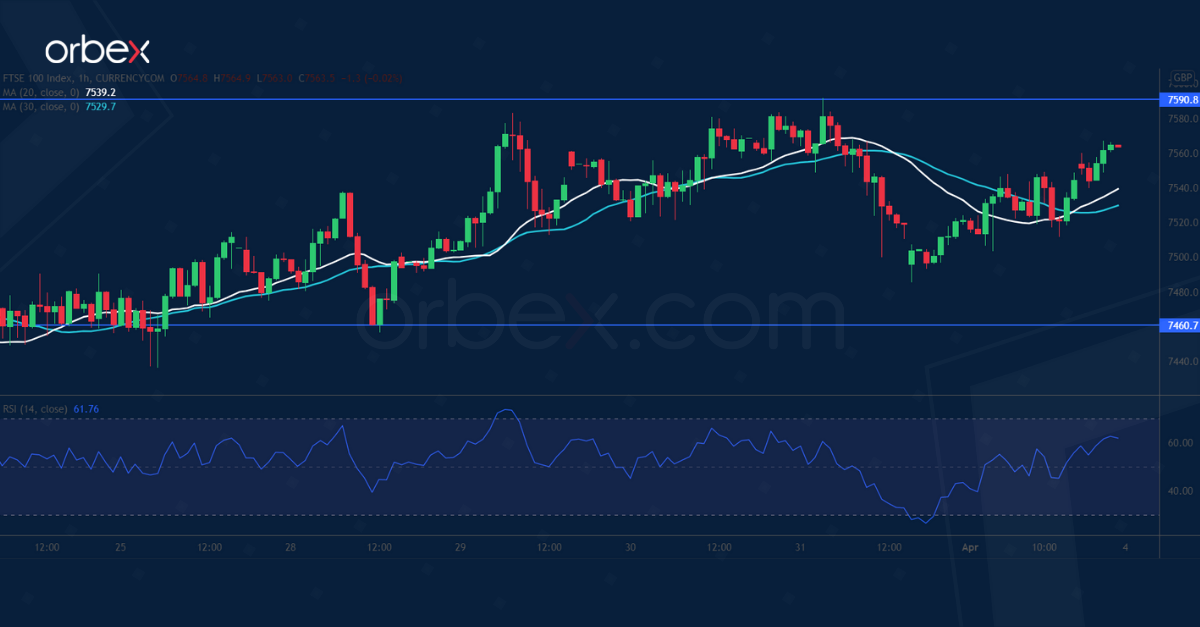
The FTSE 100 treads water dragged by weaker energy stocks. A bullish MA cross on the daily chart suggests that the index could be back on track in the medium term.

The intraday direction is still up despite its choppiness. A close above 7590 would extend the rally to this year’s high at 7690. Trend followers may see pullbacks as a bargain opportunity.

The RSI’s oversold condition attracted some buying interest over 7460. A deeper correction would send the index to 7380 which coincides with the moving averages.


Orbex-LogoArticle by Orbex

Orbex is a fully licensed broker that was established in 2011. Founded with a mission to serve its traders responsibly and provides traders with access to the world’s largest and most liquid financial markets. www.orbex.com